

The 2023 Long-Term Outlook
for the Federal Budget
Each year, the Congressional Budget Office provides the
Congress with its projections of what the federal budget and the
economy would look like over the next 30 years if current laws
generally remained unchanged.
Those projections show the estimated effects of demographic
trends, economic developments, and health care costs on federal
spending, revenues, deficits, and debt.
For details about the projections in this section, see Congressional Budget Office, The 2023 Long-Term Budget Outlook (June 2023), www.cbo.gov/publication/59014 .

2
Total Deficits, Primary Deficits, and Net Interest
Primary deficits, which
exclude net interest costs,
equal 3.3 percent of gross
domestic product (GDP) in
both 2023 and 2053.
Combined with rising
interest rates, those large
and sustained primary
deficits cause net outlays for
interest to almost triple in
relation to GDP.

3
Federal Debt Held by the Public
In CBO’s projections, debt
rises in relation to GDP over
the next three decades,
exceeding any previously
recorded level—and it is on
track to continue growing
after 2053.

4
Size of the Population Ages 20 to 64
in Relation to the Population Age 65 or Older
In CBO’s projections, the
number of people ages 20 to
64 measured in relation to
the number of people age 65
or older declines.
In particular, the number of
people in the younger age
group—who are more likely
to work and who generally
pay more in taxes—grows
more slowly than the
number of people in the
older age group—who are
less likely to work, generally
pay less in taxes, and are
generally eligible for Social
Security and Medicare.
5
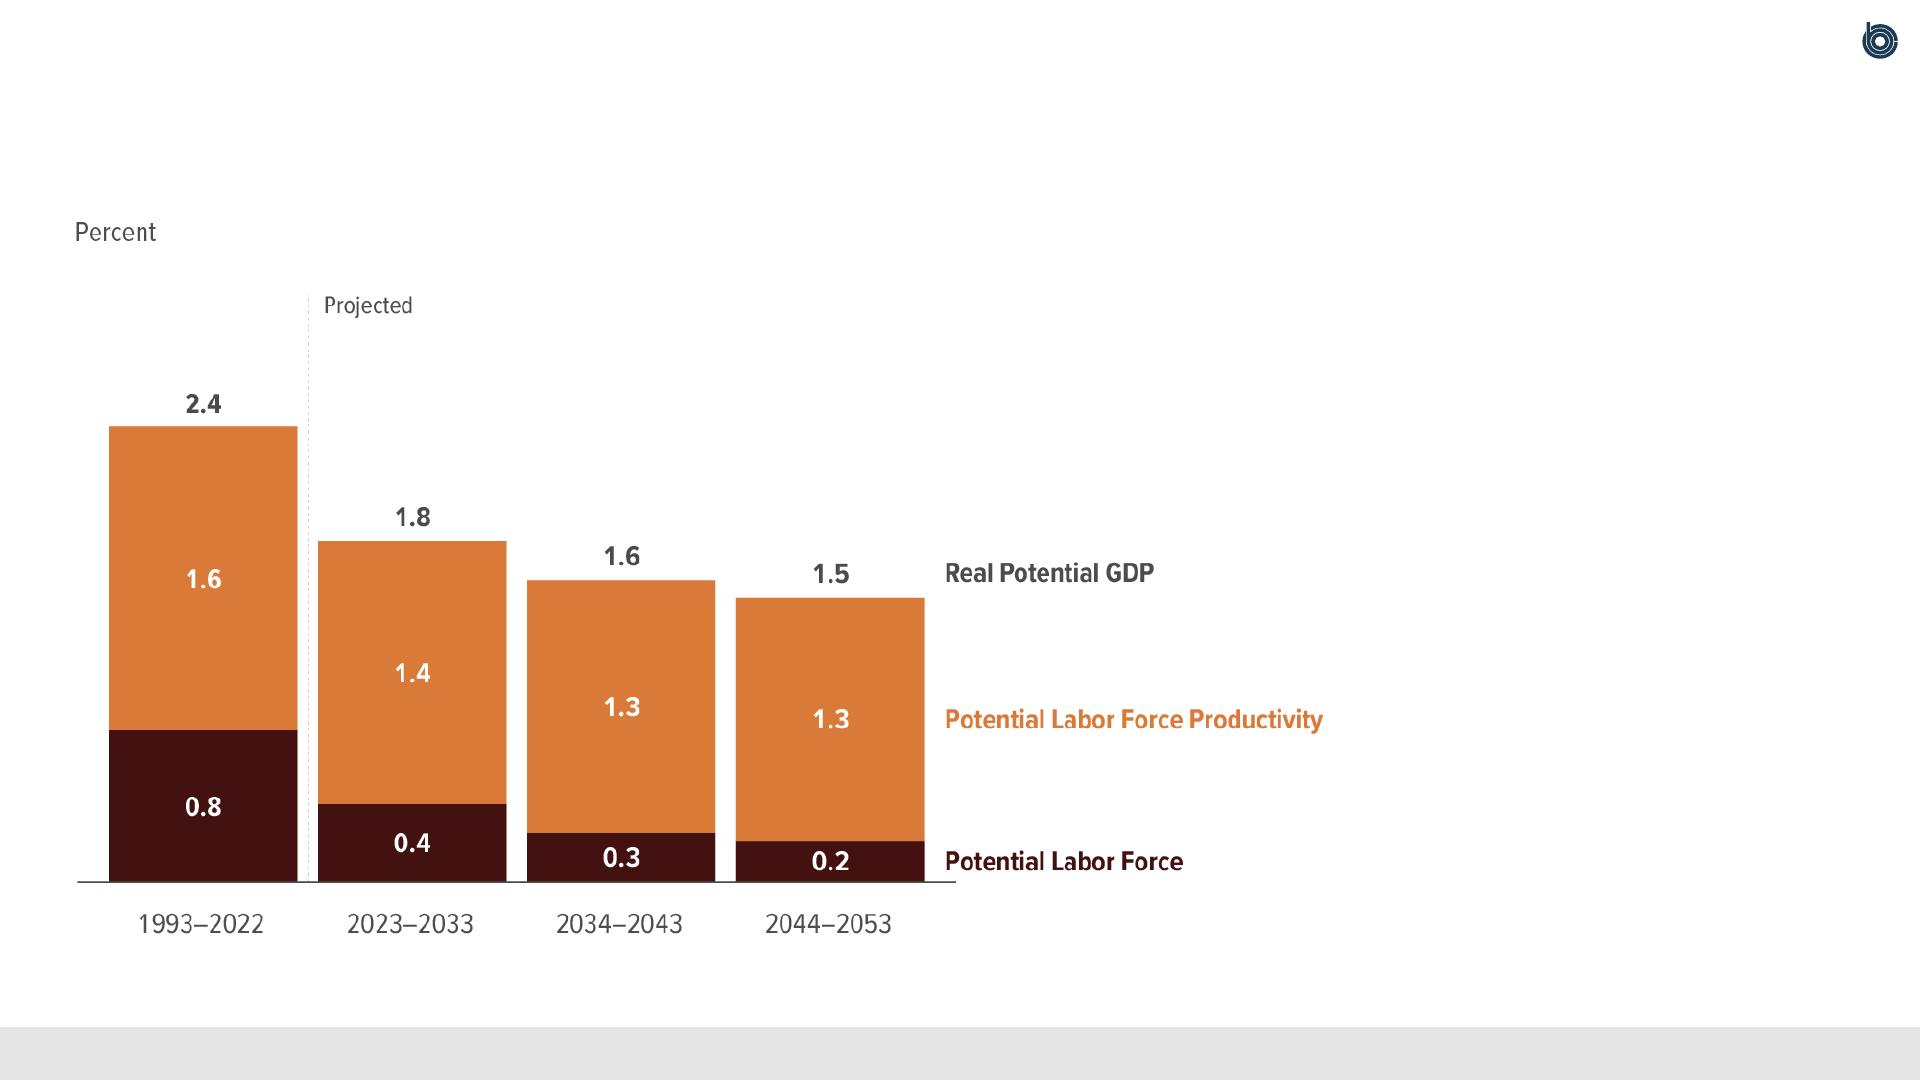
Real potential GDP is the maximum sustainable output of the economy, adjusted to remove the effects of inflation.
Average Annual Growth of Real Potential GDP
and Its Components
In CBO’s projections, real
potential GDP grows more
slowly throughout the
2023–2053 period than it
has, on average, over the
past 30 years.
That slower growth is
explained by slower growth
in the potential labor force
and in potential labor force
productivity.

6
Total Outlays and Revenues
In most years, growth in
outlays is projected to
outpace growth in revenues,
resulting in widening budget
deficits.

7
Outlays for major health care programs consist of spending on Medicare (net of premiums and other offsetting receipts), Medicaid, and the Children’s Health Insurance Program, as
well as outlays to subsidize health insurance purchased through the marketplaces established under the Affordable Care Act and related spending. “Other Mandatory” consists of all
mandatory spending other than that for Social Security and the major health care programs. It includes the refundable portions of the earned income tax credit, the child tax credit, and
the American Opportunity Tax Credit.
Outlays, by Category
Rising interest rates and
mounting debt cause net
outlays for interest to
increase from 2.5 percent
of GDP in 2023 to
6.7 percent in 2053.
Outlays for the major
health care programs rise
from 5.8 percent of GDP to
8.6 percent as the average
age of the population
increases and health care
costs grow.
The aging of the population
also pushes up outlays for
Social Security, which
increase from 5.1 percent
of GDP to 6.2 percent.

8
Average Interest Rates
Interest rates—which, along
with primary deficits, help
determine net outlays for
interest—rise through 2053
but remain lower than they
have been, on average, over
the past three decades.
Projected interest rates
remain below that average
for several reasons,
including slower growth of
the labor force, an increase
in savings available for
investment, and slower
growth of total factor
productivity.
9
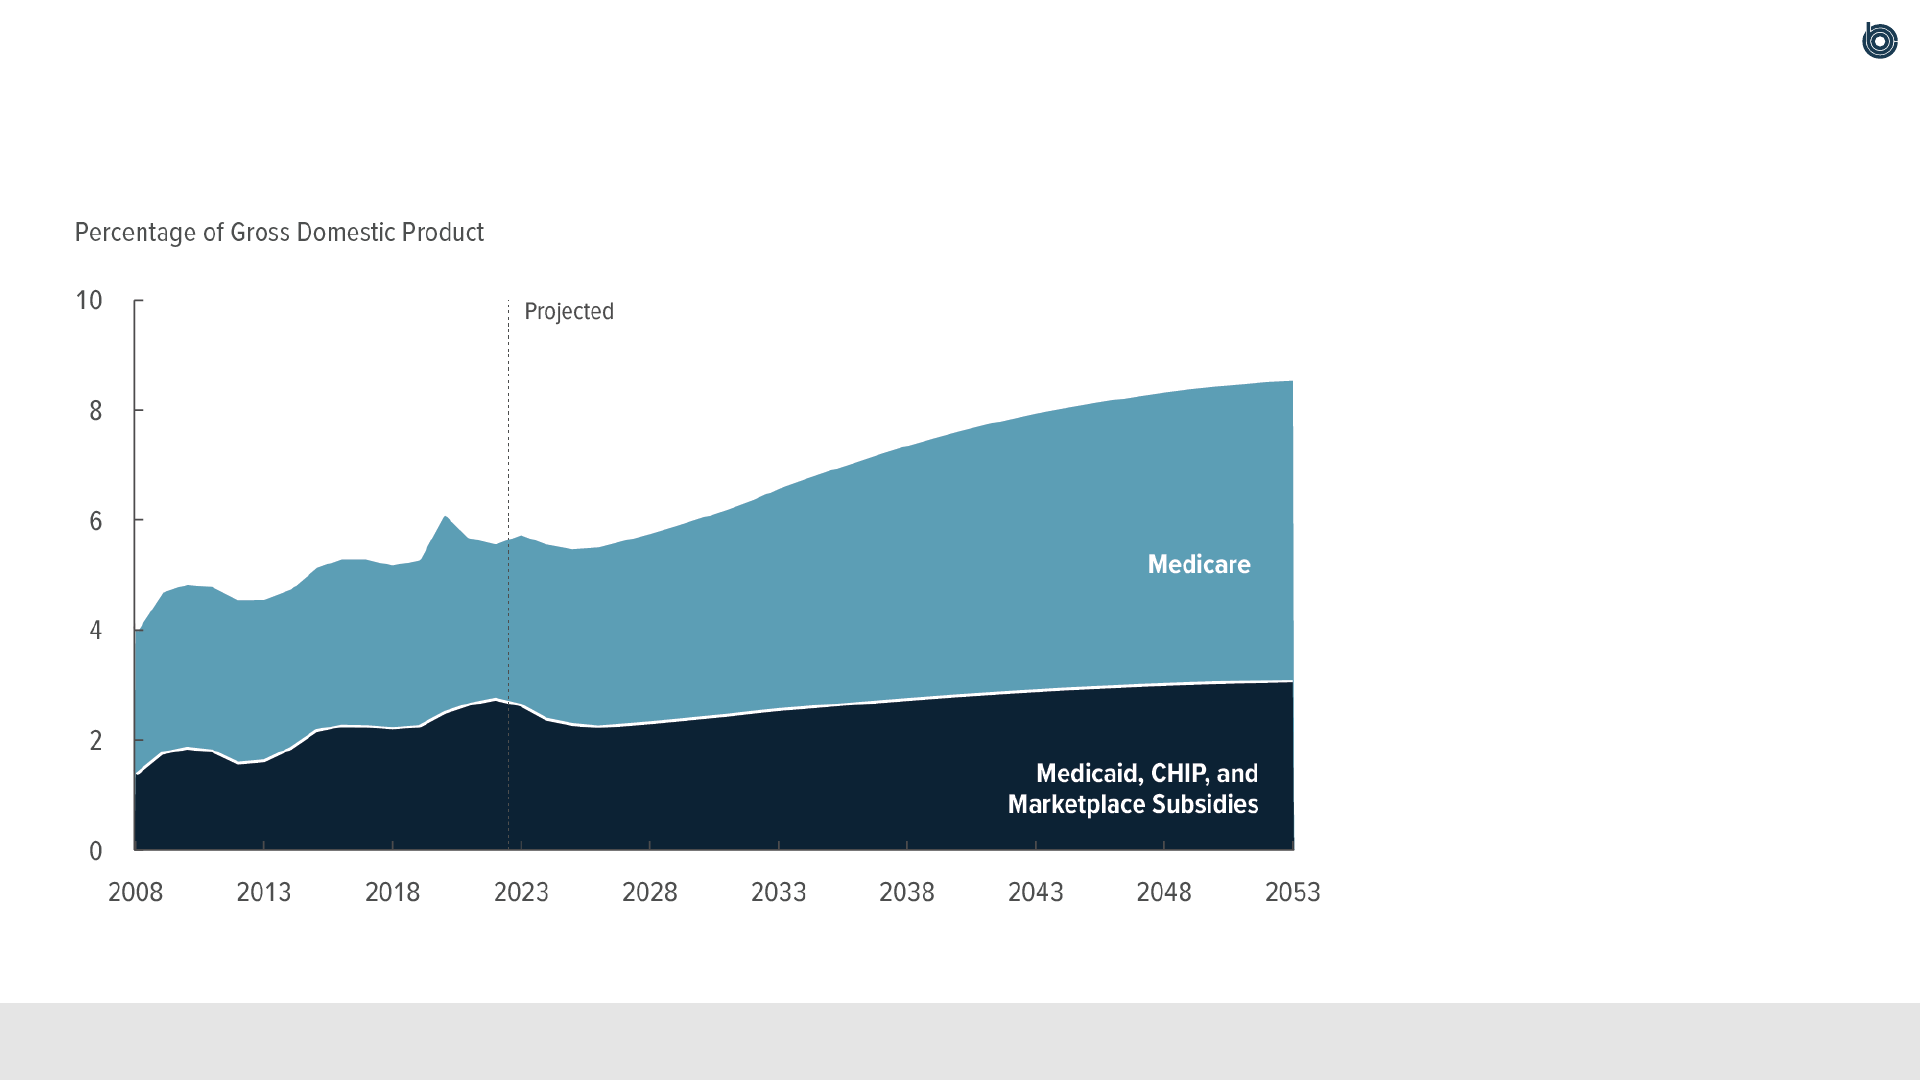
Outlays for Medicare are net of premiums and other offsetting receipts. “Marketplace Subsidies” refers to outlays to subsidize health insurance purchased through the marketplaces
established under the Affordable Care Act and related spending. CHIP = Children’s Health Insurance Program.
Composition of Outlays for the Major Health Care Programs
Spending on Medicare is
projected to account for
more than four-fifths of the
increase in spending on the
major health care programs
over the next 30 years.

10
The spending on the major health care programs examined here consists of gross spending on Medicare (which does not account for premiums or other offsetting receipts), Medicaid,
and the Children’s Health Insurance Program, as well as outlays to subsidize health insurance purchased through the marketplaces established under the Affordable Care Act and
related spending. Additional cost growth is the extent to which the growth rate of nominal health care spending per person (adjusted for demographic changes) exceeds the growth
rate of potential GDP per person. Potential GDP is the maximum sustainable output of the economy.
Composition of Growth in Outlays for the
Major Health Care Programs and Social Security
Growth in spending on the
major health care programs
is largely driven by cost
growth above and beyond
that accounted for by
demographic changes or the
growth of potential GDP per
person. Spending on those
programs, as well as
spending on Social Security
benefits, is also boosted by
the aging of the population.

11
Revenues, by Source
From 2023 to 2053, total
revenues, measured as a
percentage of GDP, grow by
about 1 percentage point.
Individual income taxes
account for nearly all of
that growth.
Receipts from payroll and
corporate taxes decline by
small amounts in relation to
GDP over the 30-year
period.

12
Key Factors Contributing to Changes in Revenues
The largest source of growth
in revenues is real bracket
creep: As income rises
faster than prices, a larger
proportion of income
becomes subject to higher
tax rates.
After 2025, another source
of growth in revenues is the
scheduled expiration of
certain provisions of the
2017 tax act.
Other factors partially offset
those effects. In 2023 and
2024, for example, revenues
fall in relation to GDP as a
temporary boost to tax
receipts observed in recent
years abates.

13
CBO’s economic projections are subject to a high degree of uncertainty. For
instance, the possibility that growth in the labor force or in productivity could be
faster or slower than expected makes CBO’s projections of labor market
conditions and economic output uncertain. Other key sources of uncertainty are
future monetary policy and the path of interest rates.
CBO’s long-term demographic projections are subject to significant uncertainty
because, compounded over many years, even small changes in rates of fertility,
mortality, or net immigration could greatly affect outcomes later in the projection
period.
Uncertainty of CBO’s Long-Term Projections

14
Alternative Scenarios
CBO analyzed eight scenarios that differ from those underlying its
long-term baseline budget projections—six that vary economic
outcomes and two that vary spending or revenues.
For details about the analysis in this section, see Congressional Budget Office, The Long-Term Budget Outlook Under Alternative Scenarios for the Economy and the Budget
(July 2023), www.cbo.gov/publication/59233
.

15
Total factor productivity growth is the growth of real output (that is, output adjusted to remove the effects of inflation) per unit of combined labor and capital services in the nonfarm
business sector.
Federal Debt Under the Baseline and Two Scenarios
in Which Total Factor Productivity Growth Differs
If the productivity of labor
and capital in the nonfarm
business sector grew
0.5 percentage points per
year faster or slower than
CBO projects, federal debt
held by the public in 2053
would equal 137 percent of
GDP or 228 percent of GDP,
respectively.

16
In the higher-interest-rates scenario, the average interest rate on federal debt is boosted above the rate underlying CBO’s extended baseline by a differential that starts at 5 basis
points in 2023 and increases by 5 basis points each year (before macroeconomic effects are accounted for)—that is, the interest rate is 5 basis points higher than the baseline rate in
2023, 10 basis points higher than the baseline rate in 2024, 15 basis points higher than the baseline rate in 2025, and so on. In the lower-interest-rates scenario, the average interest
rate on federal debt is pushed below the rate underlying CBO’s extended baseline analogously. A basis point is one-hundredth of a percentage point.
Federal Debt Under the Baseline and Two Scenarios
in Which Interest Rates Differ
If the average interest rate
on federal debt was above
or below the baseline
projection by an amount that
started at 5 basis points in
2023 and changed by that
amount in each year
thereafter, federal debt held
by the public in 2053 would
be 231 percent of GDP or
143 percent of GDP,
respectively.

17
Under the greater-sensitivity scenario, the effect of federal borrowing on private investment is twice as large as it is in CBO’s extended baseline. Under the less-sensitivity scenario,
federal borrowing has no effect on private investment.
Federal Debt Under the Baseline and Two Scenarios
in Which Private Investment’s Sensitivity to Deficits Differs
If government borrowing
reduced private investment
by twice as much as it does
in CBO’s long-term
projections or had no effect
on that investment, federal
debt held by the public in
2053 would exceed
250 percent of GDP or
would equal 145 percent of
GDP, respectively.

18
In the first scenario in which spending or revenues differ, discretionary spending
and revenues are at their 30-year historical averages as a percentage of GDP
between 2023 and 2053.
Under that scenario, discretionary spending would equal 7.1 percent of GDP and
revenues would equal 17.2 percent of GDP in every year, 1.4 percentage points
more and 1.2 percentage points less, respectively, than they average in CBO’s
extended baseline projections.
The Historical Rates Scenario

19
CBO’s extended baseline projections reflect the assumption that the Social Security Administration will pay benefits as scheduled under current law regardless of the status of the
program’s trust funds. That approach is consistent with the requirement that CBO’s 10-year baseline budget projections incorporate the assumption that funding for such programs is
sufficient to make all payments required by law. For additional discussion of a scenario in which the program continues to pay benefits as scheduled under current law, regardless of
whether the program’s two trust funds have sufficient balances to cover those payments, see Congressional Budget Office, CBO’s 2023 Long-Term Projections for Social Security
(June 2023), www.cbo.gov/publication/59184
.
In the second scenario in which spending or revenues differ, Social Security
benefits are limited to the amounts payable from dedicated funding sources after
the combined trust funds are exhausted (that is, their balances reach zero) in
fiscal year 2033.
To project the effects of that change, CBO estimated the total reduction in annual
Social Security benefits that would be necessary for the program’s outlays to
match its revenues in each year after 2033.
The Payable Benefits Scenario

20
Social Security Outlays and Revenues,
With Scheduled and Payable Benefits
In CBO’s projections, Social
Security outlays in a payable
benefits scenario are smaller
than in its extended baseline
projections. The required
reduction would amount to
25 percent in 2034 and
would rise gradually to
28 percent in 2053, relative
to the amounts in CBO’s
extended baseline
projections.

21
In the historical rates scenario, discretionary outlays equal 7.1 percent of GDP and revenues equal 17.2 percent of GDP over the entire projection period. In the payable benefits
scenario, Social Security benefits are limited to the amounts payable from dedicated funding sources.
Federal Debt Under the Baseline and Two Scenarios
in Which Revenues and Spending Differ
If, between 2023 and 2053,
discretionary spending and
revenues were at their 30-
year historical averages as a
percentage of GDP, then
federal debt held by the
public in 2053 would exceed
250 percent of GDP.
If, instead, Social Security
benefits were limited to the
amounts payable from
dedicated funding sources
after the combined trust
funds are exhausted in fiscal
year 2033, federal debt held
by the public in 2053 would
equal 132 percent of GDP.

22
CBO’s Preliminary
2024 Demographic Projections
Each year, CBO provides the Congress with its projections of what
population growth would look like over the next 30 years if current
laws generally remained unchanged. That growth is determined
by births, deaths, and net immigration.
For details about these preliminary projections, see testimony of Julie Topoleski, Director of Labor, Income Security, and Long-Term Analysis, Congressional Budget Office, before the
Joint Economic Committee, CBO’s Demographic Projections (November 15, 2023), www.cbo.gov/publication/59683
.
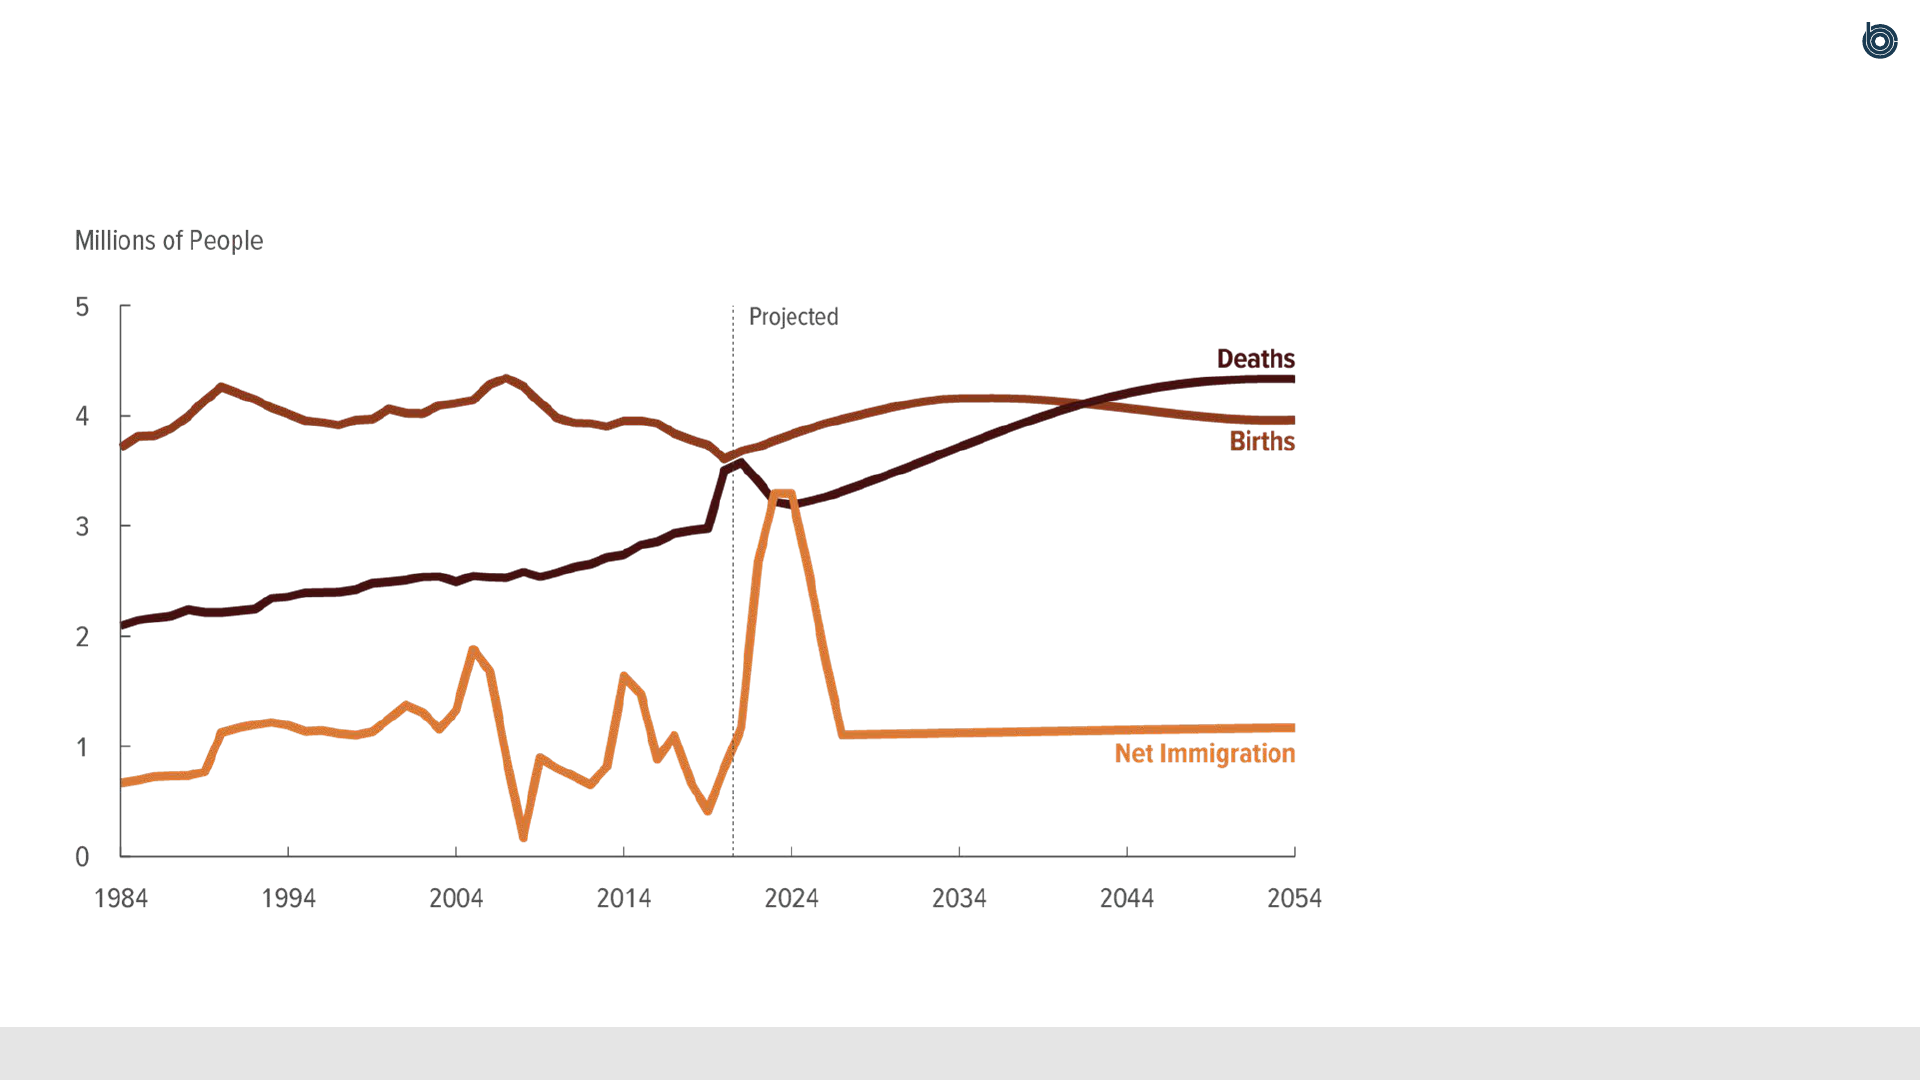
23
In CBO’s preliminary
projections, fertility rates
remain lower than the
replacement rate (the fertility
rate required for a
generation to exactly replace
itself in the absence of
immigration), mortality rates
generally continue to
decline, and immigration
becomes an increasingly
important part of overall
population growth.
Births, Deaths, and Net Immigration
