
Annual Report on Undergraduate
Admissions Requirements and
Comprehensive Review
January 2015
Board of Admissions and Relations with Schools
Systemwide Academic Senate
University of California
Page 1
Table of Contents
Executive Summary ...................................................................................................................... 3
Purpose of the Report .................................................................................................................. 3
Key Findings ................................................................................................................................ 4
Recommendations ........................................................................................................................ 7
Section I: Introduction .................................................................................................................. 8
I.1 What are Comprehensive Review & Holistic Review? ........................................................ 8
I.2 The New Freshman Admissions Policy ................................................................................ 8
Section II: Application, Admission and Yield Outcomes .......................................................... 9
II.1 Applications .......................................................................................................................... 9
II.2 Admission ........................................................................................................................... 11
II.2.1 The California Resident Freshman Admit Pool....................................................... 12
II.2.2 Recalibration of the Statewide Eligibility Index ..................................................... 14
II.2.3 Academic Indicators of Freshman Admits .............................................................. 15
II.2.4 Transfer Admission ................................................................................................. 16
II.3 Yield .................................................................................................................................... 16
II.4 Nonresident Admission ....................................................................................................... 21
II.5 Attracting and Admitting Diverse Students ........................................................................ 23
II.6 First-Term Student Performance at UC .............................................................................. 31
Section III: The Review Process: Implementing Individualized & Single Score Review ..... 31
III.1 Description of Campus Selection Processes Using Comprehensive Review .................... 32
III.2 Score Sharing and Collaboration ....................................................................................... 39
Section IV: The Future of UC’s Master Plan Commitment and Referral ............................. 40
Section V: Implementation of Transfer Policies & Initiatives ................................................ 41
Section VI: Conclusions and Recommendations ...................................................................... 42
Page 2

EXECUTIVE SUMMARY
PURPOSE OF THE REPORT
The Academic Senate’s Board of Admissions and Relations with Schools (BOARS) advises the
President and Senate agencies about the admission of undergraduate students and the criteria for
undergraduate status as provided under Regents Standing Order 105.2(a)
1
, and as outlined in
Senate Bylaw 145
2
.
The Annual Report on Undergraduate Admissions Requirements and Comprehensive Review is the
result of a mandate in Regents Policy 2104: Policy on Comprehensive Review in Undergraduate
Admissions
3
, and in Regents Policy 2103: Policy on Undergraduate Admissions Requirements
4
. It
combines two earlier reports, the Annual Report on Admissions Requirements, and the Biennial
Report on Comprehensive Review.
When the Board of Regents amended Policy 2103 in 2009 to incorporate the admissions policy
recommended by the Academic Senate, it added reporting language that reads:
(1) The Academic Senate, through its Board of Admissions and Relations with Schools
(BOARS) will evaluate and report annually and at five-year intervals on the academic and
fiscal impact of this policy; and
(2) Based on the results of these ongoing studies, the Academic Senate should periodically
consider recommending adjustments to the guarantee structure.
When the Regents adopted Comprehensive Review in 2001, Policy 2104 was written to read:
There shall be an annual review and reporting to The Regents of the effect of this action
and, in approving the action, the Board of Regents states that these comprehensive review
policies shall be used fairly, shall not use racial preferences of any kind, and shall comply
with Proposition 209.
BOARS’ last reported to the Regents on the Comprehensive Review policy in June 2010
5
and
September 2012
6
. BOARS also prepared a report for the Regents on the Impact of the New
Freshman Eligibility Policy in November 2013
7
.
The current report discusses application, admission, and yield outcomes under comprehensive
review for the years 2012-2014; the ongoing implementation of the freshman admissions policy
adopted in 2009 (Regents Policy 2103) and the Regents’ 2011 Resolution Regarding
Individualized Review and Holistic Evaluation in Undergraduate Admissions
8
; efforts by BOARS
to enhance the transfer admission path and efforts to ensure that nonresidents admitted to a campus
compare favorably to California residents; and challenges associated with the future of the referral
guarantee.
1
http://regents.universityofcalifornia.edu/governance/standing-orders/so1052.html
2
http://senate.universityofcalifornia.edu/manual/blpart2.html#bl145
3
http://regents.universityofcalifornia.edu/governance/policies/2104.html
4
http://regents.universityofcalifornia.edu/governance/policies/2103.html
5
http://senate.universityofcalifornia.edu/reports/HP_MGYreBOARS_CR_rpt.pdf
6
http://senate.universityofcalifornia.edu/committees/boars/BOARSREPORTCOMPREHENSIVEREVIEW2012.pdf
7
http://senate.universityofcalifornia.edu/reports/Nov52013BOARSReporttoRegents-Final.pdf
8
http://regents.universityofcalifornia.edu/governance/policies/2108.html
Page 3
Key Findings
OVERALL FRESHMAN ADMISSION
The number of freshman applications has increased over the past two admissions cycles,
although significantly more slowly than when the 9x9 admissions policy was first
implemented in 2012:
A 19.1% increase occurred from 2011 to 2012, followed by 10.7% and 6.2% increases
from 2012 to 2013 and 2013 to 2014, respectively.
A significant portion of the recent growth continues to be in nonresident applications.
The year-over-year increases in out-of-state national (international) applicants were
14.9% (34.5%) and 19% (20.8%) from 2012 to 2013 and 2013 to 2014, respectively;
while that for California residents was only 6.2% and 0.6% for the same periods.
UC admitted a record-high number of applicants as freshmen for fall 2014, a 6.5% increase
over the two-year period since implementation of the new admissions policy. This growth
was primarily among nonresidents, however, with the number of California residents
admitted increasing only slightly from 2012 to 2014.
Although UC has admitted more students, the number of new applicants has increased at a
faster rate. The result of this strong demand for UC can be found in increased selectivity
across the system. The admission rate declined at all UC campuses from 2012 to 2014, with
a decrease in the systemwide admission rate from 66.3% to 60.1% occurring over the two-
year period.
Students admitted to UC grew stronger academically in the years between 2012 and 2014.
The mean UC GPA for California resident freshman admits was 3.91 in 2014, up from 3.86
in 2012. In 2014, six of nine undergraduate campuses had a mean GPA of over 4.0 for
admits.
Approximately one of every two admits chooses to attend the UC, although the yield rate
varies dramatically by the residency of the admits. Although nonresidents are far less likely
to accept an admission offer, they represent an increasing percentage of matriculates to the
UC. California residents now constitute 79.8% of all admits promising to enroll at UC
(SIRs), down from 84.5% in 2012.
Matriculates have continued to succeed under the new admissions policy. For example, the
average first-term GPA of California residents was higher than in either of the previous two
years, before implementation of the new policy, while the average first-term probation rate
of this group was lower. In all, 93.1% of first-year California residents move on to their
second year.
NONRESIDENT ADMISSION
The representation of nonresidents among all SIRs increased from 15.5% for fall 2012 to
20.2% for fall 2014, as a result of a slight decrease in California-resident SIRs and
substantial increases in both domestic and international nonresidents. This is due to
expanded campus efforts to recruit higher-tuition-paying domestic and international
nonresidents in response to a budget crisis that saw UC’s state funding fall by nearly $1
billion.
Page 4
ELIGIBILITY
In 2014 the top 15.3% of California public high-school graduates were guaranteed
(eligible) or Entitled to Review (ETR) admits, well beyond the Master Plan expectation of
12.5%. More specifically:
12.9% of California public high-school graduates were guaranteed admission
2.4% were ETR
Although the total number of eligible applicants increased by 8% from 2012 to 2014, the
number who were ELC-only decreased by 5.2%. ELC-only applicants make up a small and
decreasing percentage of all eligible applicants (8.6%), admits (7.6%) and students who
submitted a statement of intent to register—SIRs (7.7%) for fall 2014.
82.7% of Statewide-eligible applicants and 72.6% of ELC-only applicants were admitted to
a UC campus to which they applied for fall 2014, significantly higher than the overall
freshman admission rate of 60.1% and the rate for ETR applicants (39.1%) and Other
applicants who are neither eligible nor ETR (14.9%).
Overall, admits and SIRs with one of the eligibility guarantees constitute an increasing
proportion of total California admits and SIRs, while ETR admits constitute a decreasing
proportion. Admits who are neither eligible nor ETR constitute the pool of applicants
receiving Admission by Exception (A by E), which continues to make up less than 2.5% of
all SIRs in keeping with UC policy limiting A by E matriculates to no more than 6%.
All eligible applicants who were not admitted to a campus to which they applied were
offered the opportunity to opt in to consider a referral offer from the only campus that had
available space – UC Merced. In 2012, 194 eligible applicants from the referral pool (2.2 %
of the referral pool) submitted an SIR, while in 2014, 239 referral-pool applicants (2.1 %)
submitted an SIR.
TRANSFER ADMISSION
At the transfer level, a more nuanced picture emerges. Among California residents, transfer
applications dropped sharply (6.2%) in 2012 and fell modestly in 2013 (0.7%) and 2014
(2.1%). The Transfer Action Team, after study and consultation with the CCC Chancellor’s
Office, has reasoned that this decline is tied to the decreased course offerings and student
support services at the CCCs during the Great Recession and will be temporary. The longer
term picture shows increasing transfer application growth. From 2003 to 2014, transfer
applications increased 50.1%. A part of that growth has come from International applicants,
which almost doubled during this period, although the vast majority of transfer applications
(83.6%) come from California residents.
Overall, UC admitted slightly more transfers in 2014 than in 2013, but still below 2012
levels. Transfer admission rates have held steady at approximately 65% for California
residents (65.1% in 2014), and international students were admitted at about the same rate
(64.8% in 2014). The number of domestic out-of-state students applying to UC remains
small, just over 1,000 in 2014, and fewer than one in four are admitted to UC upon
application.
Page 5
DIVERSITY
The data indicate that many of the goals of the eligibility reform policy have been met, as
many applicants who were ELC-only or ETR without the guarantee were admitted.
Moreover, ELC-only and ETR admits and SIRs were more ethnically diverse and more
likely to be first-generation college going and/or from low-API high schools than those
who were eligible via the statewide index.
UC experienced a slight increase in the proportions of first-generation college-attending
and low-income SIRs between 2012 and 2014. For fall 2014, 45.8% (36.6%) of all
California-resident applicants were first-generation (low income) as were 42.5% (34.4%)
of California admits and 47% (38.2%) of SIRs.
The percentages of first-generation ETR applicants, admits and SIRs for fall 2014 were
61.7%, 64.5% and 67.1%, respectively, while the percentages of first-generation ELC-only
applicants, admits, and SIRs were 83.0%, 84.6% and 85.2%, respectively. Overall, 33.8%
of all first-generation SIRs for fall 2014 were in one of the two categories of eligibility
(ETR and ELC-only) that were created or expanded by the new 9x9 eligibility policy.
19.6% of California-resident applicants for fall 2014 were from low-API high schools, as
were 18% of California admits and 20.4% of SIRs. The percentages of ETR applicants,
admits and SIRs from low-API high schools (in the bottom-two-ranking quintiles) were
25.1%, 24.2% and 26.4%, respectively, for fall 2014; while the percentages of ELC-only
applicants, admits and SIRs from low-API high schools were 60.3%, 62.1% and 62.0%,
respectively. Overall, 39.3% of all SIRs from low-API high schools were in one of the two
categories of eligibility (ETR and ELC-only) that were created or expanded by the new 9x9
eligibility policy.
39.3% of California-resident applicants, 34% of California admits, and 34.5% of SIRs for
fall 2014 were from underrepresented-minority (URM) groups (African Americans,
American Indian, and Chicano/Latino). The percentages of URM applicants, admits and
SIRs who were ETR were 54.6%, 54.2% and 55.9%, respectively, for fall 2014; while the
percentages of ELC-only URM applicants, admits and SIRs were 74%, 75.6% and 75.8%,
respectively. Overall, 39.2% of all URM SIRs were in one of the two categories of
eligibility (ETR and ELC-only) that were created or expanded by the new 9x9 eligibility
policy.
Freshman applications from each URM group have grown over the two-year period since
implementation of the 9x9 policy. African Americans experienced decreases in their
numbers of admits and SIRs, while each of the other URM groups experienced increases in
admits and SIRs over this period. Chicanos/Latinos and American Indians experienced
increases also in their proportions among all applicants, admits and SIRs over this period.
Chicanos/Latinos now constitute 29.8% of all SIRs, up from 26.7% in fall 2012. Asian-
Americans and Whites (non-URM groups) now account for 39.4% and 23.1% of all SIRs,
respectively, down from 41.3% and 24.3%, respectively, in fall 2012.
At the transfer level, all under-represented groups experienced an increase in SIRs. The
percentage of transfer SIRs that were from African-Americans increased from 3.3% to
3.8% between 2012 and 2014. Chicanos/Latinos, in keeping with their application trends,
experienced an increase from 19.5% to 22.3% over this period and remain the largest group
of URM transfer SIRs (approximately 82% of all URM transfer SIRs for fall 2014, up only
very slightly from 2012). While Whites are only the third-most populous ethnic group
Page 6
among UC freshman matriculates, they remain the largest group among CCC transfer SIRs,
at 31% of all CCC transfers for fall 2014, down from 33.3% in 2012.
REFERRAL POOL
For fall 2014, UC offered admission to 12.9% of all California public high school
graduates who met one or both of the 9x9 guarantees, resulting in a referral-pool of 11,183
students. This is up from fall 2012, when 11.7% were admitted and there was a referral-
pool of 9,060. Thus, the 9x9 eligibility policy has significantly overshot its original target
for admission guarantees of 10%, resulting in an eligibility referral pool that is
considerably larger than BOARS had expected. As a consequence, the referral system is
facing significant challenges that must be addressed in order to maintain UC’s Master Plan
commitment to California residents.
Recommendations
1. Considering that yield rates for African Americans and American Indians have been
consistently below average in past years, in comparison with systemwide yield rates,
efforts at increasing the yield rates for these groups may prove worthwhile in increasing
their enrollment numbers and should be encouraged.
2. As UC Merced becomes increasingly selective, it will become more difficult for UC to
accommodate its Master Plan commitment to provide guaranteed admission to all eligible
UC applicants. Sustaining this commitment may require BOARS to consider more
substantial adjustments to the eligibility construct or the referral guarantee. In studying a
variety of approaches, BOARS will carefully assess the potential impact on the applicant,
admit and matriculate pools and will be vigilant to maintain the University’s commitment
to the Master Plan.
Page 7

SECTION I: INTRODUCTION
I.1 WHAT ARE COMPREHENSIVE REVIEW AND HOLISTIC REVIEW?
In 2001, the Regents adopted a policy for undergraduate admissions requiring that “students
applying to UC campuses are evaluated for admission using multiple measures of achievement and
promise while considering the context in which each student has demonstrated academic
accomplishment.”
To implement the Comprehensive Review policy, BOARS established 14 criteria campuses may
use to select freshmen applicants. These include traditional academic indicators such as high
school GPA and standardized test scores, as well as completion of honors courses, extracurricular
activities, special talents, and achievement in the context of opportunity. These criteria are
enshrined in the Guidelines for Implementation of University Policy on Undergraduate
Admissions,
9
known as the “Comprehensive Review Guidelines”. The Guidelines also list nine
criteria for selecting advanced standing (transfer) applicants.
In January 2011, the Board of Regents endorsed a Resolution Regarding Individualized Review
and Holistic Evaluation in Undergraduate Admissions
10
. The resolution states that a single-score
“holistic review” process should become the way comprehensive review is implemented to admit
freshmen at all UC campuses, although the resolution also allows campuses flexibility to follow
alternative approaches that are equally effective in meeting campus and University goals.
The resolution was in part a response to BOARS’ June 2010 report on Comprehensive Review, in
which BOARS recommended that all UC campuses conduct an individualized review of all
freshman applicants. BOARS stated that holistic review should take into account both academic
and non-academic data elements in the application and the electronic “read sheet” that pertain to
the applicant’s accomplishments in the context of opportunity to derive a single “read score” to
determine admission. The contextual information includes the high school’s Academic
Performance Index score, the number of available “a-g” and honors courses, socioeconomic
indicators, and the applicant’s academic accomplishments relative to his or her peers.
I.2 THE NEW FRESHMAN ADMISSIONS POLICY
In 2009, the Board of Regents approved a revised freshman admission policy that changed the
structure of UC “eligibility” for students who entered UC beginning in fall 2012. Among the
changes were adjustments to the eligibility construct, under which well-qualified high school
graduates are offered a guarantee of admission to at least one UC campus through one of two
pathways. The first, Eligibility in the Local Context (ELC), identifies the top ranking graduates
from each participating California high school based on grade point average (GPA) in ‘a-g’
courses. The second, Eligibility in the Statewide Context, identifies the top California high school
graduates from across the state on the basis of an index involving both high school GPA and scores
on standardized admission tests. The policy expanded the ELC pathway from the top 4% to the top
9% of students in each school, and decreased statewide eligibility from 12.5% to 9%. The two
9
http://senate.universityofcalifornia.edu/committees/boars/GUIDELINES_FOR_IMPLEMENTATION_OF_UNIVER
SITY_POLICY_on_UG_ADM_Revised_January2014.pdf
10
http://regents.universityofcalifornia.edu/governance/policies/2108.html
Page 8

guarantee pathways were intended to combine to meet a 10% overall target of California public
high-school graduates being identified as eligible for referral to a campus with available space, if
not admitted to a campus to which they applied. The policy also introduced an “Entitled to
Review” (ETR) category of applicants who are guaranteed a comprehensive review (though not
admission) if they meet minimum requirements but are not identified as being eligible for referral.
When BOARS initially proposed the changes in eligibility policy seven years ago, it anticipated
that the introduction of ETR and the broader ELC category would result in increased applications
from California high school graduates. BOARS also articulated that campuses would benefit by
having the ability to select students who are better prepared academically, and that the students
who enrolled under the new policy would constitute a better representation of California’s various
communities.
In both 2012
11
and 2013
12
, BOARS reported to the Regents that the 9x9 policy has worked largely
as intended. BOARS’ November 2013 report notes that the policy has broadened access to
California students, and allowed campuses to select a group of students who are more diverse and
better prepared academically. It cites evidence that students who began at UC in fall 2012 have
higher average first-term GPAs and retention rates and lower average probation rates compared to
freshmen who were selected under the old policy and began in 2010 or 2011; that an increasing
percentage of California high school graduates from underrepresented minority groups declared
their intent to register at a UC campus between 2010 and 2013; and that more students are
applying to UC now than under the old policy, suggesting that the expansion of ELC and the
introduction of ETR have removed some of the barriers that may have discouraged students
previously. The report also notes that broader demographic and economic changes and the
transition to a single-score individualized-review admissions process that four UC campuses
implemented simultaneous to implementation of the new policy make it difficult to attribute any
academic or diversity outcome to the policy change definitively.
The 2013 report expresses concern, however, about the size of the overall eligibility pool, which
has become considerably larger than BOARS expected
13
, and also about evidence indicating that
students admitted to UC through the ELC and ETR paths have poorer overall probation and
persistence outcomes. The continued relevance of these concerns will be assessed through the
evaluation of admissions and performance-outcome data, as it becomes available.
SECTION II: APPLICATION, ADMISSION AND YIELD OUTCOMES
II.1 APPLICATIONS
Freshman Applicants. The University of California experienced steady growth in freshman
applications between 2009 and 2011 with a marked increase (19.1%) from 106,070 in 2011 to
126,229 in 2012, followed by smaller but also substantial increases in each of the two most recent
admissions cycles—a 10.7% increase to 139,758 in 2013 followed by a 6.2% increase to 148,450
in 2014 (c.f., Table 1). A significant portion of the recent growth continues to be in nonresident
11
http://senate.universityofcalifornia.edu/committees/boars/BOARSreportcomprehensivereview2012.pdf
12
http://senate.universityofcalifornia.edu/reports/Nov52013BOARSReporttoRegents-Final.pdf
13
This is likely due to the nature of the 2007 eligibility study by the California Postsecondary Education Commission
(CPEC) and it application to students who enrolled five years later. It may also be due to an increase in the number of
top high school graduates who choose to apply to UC.
Page 9

applications. For example, the year-over-year increases in out-of-state national (international)
applicants were 14.9% (34.5%) and 19% (20.8%) from 2012 to 2013 and 2013 to 2014,
respectively; while the increase for California residents was only 6.2% and 0.6% for the same
periods. Therefore, as also noted in the 2012 Report on Comprehensive Review, the growth in
freshman applications cannot be attributed solely to the eligibility-policy changes, as it also
reflects changes in the perception nonresident applicants have about UC’s openness to them as
well as a general trend among college applicants towards increasing their number of “backup”
applications.
Table 1: On-Time Freshman and Transfer Applicants (Fall 2003 through Fall 2014)
2003
2004
2005
2006
2007
2008
2009
2010
2011
2012
2013
2014
Freshman
California
65,087
63,097
65,435
70,494
73,825
79,489
80,730
81,991
84,975
93,298
99,129
99,761
% increase
-3.1%
3.7%
7.7%
4.7%
7.7%
1.6%
1.6%
3.6%
9.8%
6.2%
0.6%
Out-of-State
9,263
8,462
8,061
9,264
9,684
11,074
11,299
11,524
12,759
19,128
21,970
26,143
% increase
-8.6%
-4.7%
14.9%
4.5%
14.4%
2.0%
2.0%
10.7%
49.9%
14.9%
19.0%
International
2,581
2,500
2,656
3,083
3,704
4,638
5,973
6,805
8,336
13,873
18,659
22,546
% increase
-3.1%
6.2%
16.1%
20.1%
25.2%
28.8%
13.9%
22.5%
66.4%
34.5%
20.8%
Total Freshman
76,931
74,059
76,152
82,841
87,213
95,201
98,002
100,320
106,070
126,299
139,758
148,450
% increase
-3.7%
2.8%
8.8%
5.3%
9.2%
2.9%
2.4%
5.7%
19.1%
10.7%
6.2%
Transfer
California
19,535
21,411
21,317
21,240
20,961
22,441
24,900
29,396
31,924
29,944
29,740
29,117
% increase
9.6%
-0.4%
-0.4%
-1.3%
7.1%
11.0%
18.1%
8.6%
-6.2%
-0.7%
-2.1%
Out-of-State
1,129
987
718
795
804
845
779
827
845
1,018
959
995
% increase
-12.6%
-27.3%
10.7%
1.1%
5.1%
-7.8%
6.2%
2.2%
20.5%
-5.8%
3.8%
International
2,396
2,263
1,951
1,908
2,016
2,518
3,020
3,486
3,396
3,678
4,310
4,710
% increase
-5.6%
-13.8%
-2.2%
5.7%
24.9%
19.9%
15.4%
-2.6%
8.3%
17.2%
9.3%
Total Transfer
23,060
24,661
23,986
23,943
23,781
25,804
28,699
33,709
36,165
34,640
35,009
34,822
% increase
6.9%
-2.7%
-0.2%
-0.7%
8.5%
11.2%
17.5%
7.3%
-4.2%
1.1%
-0.5%
Total
California
84,622
84,605
86,752
91,734
94,786
101,930
105,360
111,387
116,899
123,242
128,869
128,878
Out-of-State
10,392
9,449
8,779
10,059
10,488
11,919
12,078
12,351
13,604
20,146
22,929
27,138
International
4,977
4,763
4,607
4,991
5,720
7,156
8,993
10,291
11,732
17,551
22,969
27,256
Total
99,991
98,720
100,138
106,784
110,994
121,005
126,701
134,029
142,234
160,939
174,767
183,272
Note: Data in this table represent in-progress figures from the first UC Application Processing (UCAP) file in each application cycle
Transfer Applicants. At the transfer level, a different picture emerges. As seen in Table 1,
applications from transfer students rose significantly each year from 2008 to 2011, but declined in
2012 by 4.2% and again by 0.5% in 2014, with only a small increase (1.1%) in 2013. The declines
in transfer applicants were due to a decline in resident applications, as there were modest increases
in nonresident domestic and international applications. While the decline in 2012 can be attributed
to the effect of budget cuts—declining community-college course access and increased tuition—
the decline in 2014 is more likely associated with declines in community-college enrollments that
commonly occur during an improving economy. When viewed in this context, it appears more
likely that the substantial increase in freshman applications for 2012 may be due to the new
admissions policy. As discussed in the 2012 Report on Comprehensive Review, the Senate through
Page 10

Page11
BOARS has added two new pathways for transfer admission, effective 2015, which should expand
UC’s reach to a broader range of community colleges and increase the transfer student graduation
rate.
II.2 A
DMISSION
Freshman Admits. For fall 2014, UC admitted a record 89,344 applicants as freshmen. Figure 1
shows systemwide trends in the number of freshman applicants and admits since the
implementation of Comprehensive Review in 2001-02. As is apparent from Figure 1, despite the
worst financial crisis in recent history, UC has maintained admit numbers during the past two
years, and as noted in section II.4, has continued to honor its Master Plan obligations to California
high-school graduates.
Note: Data in this table and figure are from the final UCAP file in the application cycle.
Table2:FallAdmitRatesbyUCCampus,SelectedYears,AllFreshmanApplicants
Campus 2003 2005 2007 2009 2010 2011 2012 2013 2014
System 79.7% 80.3% 81.3% 77.9% 78.6% 71.6% 66.3% 61.6% 60.1%
Berkeley 23.9% 26.6% 23.2% 21.6% 21.4% 21.6% 18.0% 17.6% 15.0%
Davis 56.8% 60.8% 58.6% 47.4% 46.3% 48.3% 45.2% 41.3% 40.6%
Irvine 53.8% 60.4% 55.6% 44.2% 45.2% 47.5% 42.4% 41.1% 37.4%
LosAngeles 23.5% 26.9% 23.6% 21.9% 22.7% 25.5% 22.0% 20.4% 18.6%
Merced 86.4% 89.6% 91.3% 88.6% 80.0% 75.6% 66.0% 67.2%
Riverside 84.0% 79.8% 86.7% 83.8% 75.9% 68.2% 62.0% 59.5% 57.7%
SanDiego 37.2% 42.6% 42.2% 36.2% 37.9% 35.3% 37.5% 36.6% 33.4%
SantaBarbara 50.0% 52.8% 54.4% 48.1% 45.5% 46.3% 44.4% 39.7% 36.4%
SantaCruz 78.9% 74.3% 81.1% 63.6% 63.8% 67.3% 60.0% 51.3% 55.8%
Note:Datadonotincludespringrolloveradmissions.Fall2014dataareinprogressasofOctober2014.

The campus data listed in Table 2 and shown graphically in Figure 2 illustrate the increased
selectivity across the system. Merced is now the only campus that accepts referrals, and it should
be noted that beginning in 2011 Merced changed is referral practice to require potential referrals to
indicate via email their interest in a referral offer; with those not responding no longer listed as
admits.
Figure 2: Fall Admit Rates by UC Campus, Selected Years, All Freshman Applicants
II.2.1 The California Resident Freshman Admit Pool
As indicated in Table 3, UC admitted 62,844 of 99,944 California-resident freshman applicants for
2014. This includes 55,131 of 86,916 public high school applicants, equal to 13% of the total
California public-high-school graduating class (estimated to be 410,964 in Table 4). The average
high-school GPA of all California-resident freshman admits was 3.90, with an average of 48
semesters of “a-g” courses (30 is the minimum) and 15 semesters of honors courses. Small
improvements in the ACT scores and in all component scores of the SAT are reflected in the
academic indicators of admits and SIRs for 2014, relative to those for 2012. California admits from
public high schools constituted 87.7% of the total California-resident admit pool in 2014, up from
86.3% in 2012.
A question arising in the public conversation about UC admissions is whether UC is meeting its
Master Plan obligations to California residents. Table 4 below shows the best estimates that the
University can provide of the percent of high school students admitted. All applicants who were
guaranteed admission (statewide or ELC) and all admitted “ETR” students are included in the
table.
0.0%
10.0%
20.0%
30.0%
40.0%
50.0%
60.0%
70.0%
80.0%
90.0%
100.0%
System
Berkeley
Davis
Irvine
Los Angeles
Merced
Riverside
San Diego
Santa Barbara
Santa Cruz
Page 12

Table 3. CA Resident Freshman Applicants, Admits, and SIRs for Fall 2011 through Fall 2014
2011
2012
2013
2014
Applicants
Admits
SIRs
Applicants
Admits
SIRs
Applicants
Admits
SIRs
Applicants
Admits
SIRs
Total
85,052
61,323
35,064
93,418
63,044
36,140
99,180
63,047
35,963
99,944
62,844
35,943
Ethnicity
African American
4,865
2,615
1,402
5,719
2,834
1,537
5,982
2,731
1,427
5,867
2,705
1,467
American Indian
624
420
223
692
438
226
710
393
201
759
455
235
Asian
27,682
22,006
14,393
30,105
22,909
14,911
30,617
22,538
14,368
31,270
22,648
14,159
Chicano/Latino
23,984
16,029
9,096
28,068
17,133
9,651
31,793
17,607
10,171
32,632
18,180
10,712
Pacific Islander
256
158
90
337
180
90
374
191
100
369
199
99
White
25,601
18,592
9,123
25,958
17,742
8,771
26,917
17,643
8,636
26,219
16,783
8,296
Unknown
2,040
1,503
737
2,539
1,808
954
2,787
1,944
1,060
2,828
1,874
975
Total URM
29,473
19,064
10,721
34,479
20,405
11,414
38,485
20,731
11,799
39,258
21,340
12,414
Sex
Female
47,695
34,685
19,591
52,200
35,495
19,955
55,057
35,046
19,819
55,651
35,154
20,083
Male
37,298
26,619
15,466
41,128
27,517
16,175
42,852
27,165
15,688
43,028
26,846
15,437
Unkown
59
19
7
90
32
10
1,271
836
456
1,265
844
423
School Type
Public
72,073
52,487
31,360
79,823
54,401
32,512
85,620
54,809
32,452
86,916
55,131
32,683
Private
11,706
8,132
3,364
12,125
7,866
3,208
12,068
7,518
3,136
12,150
7,289
3,027
Unkown
1,273
704
340
1,470
777
420
1,492
720
375
878
424
233
Low API 1-4
16,010
11,261
7,141
17,546
11,463
7,228
17,734
10,100
6,454
17,567
10,193
6,575
Academic Indicators
Average High School GPA
3.70
3.84
3.86
3.68
3.86
3.87
3.69
3.88
3.91
3.71
3.90
3.93
Average SAT - Reading
563
582
579
556
580
575
556
586
583
557
587
584
Average SAT - Math
590
611
613
581
608
608
578
612
612
578
611
610
Average SAT - Writing
572
592
590
566
592
588
560
593
590
561
594
592
Average ACT
26
26
26
25
26
26
25
27
26
26
27
27
Average Number of A-G Courses
48
49
49
48
49
48
47
48
47
47
48
47
Average Number of Honors/AP
Courses
12
14
14
12
14
14
12
14
15
12
15
15
Family Characteristics
Low Income
27,674
19,616
12,622
32,691
21,375
13,444
34,747
20,506
12,955
36,585
21,614
13,739
1st Generation College
36,325
25,426
15,838
41,565
26,539
16,423
45,311
26,457
16,590
45,730
26,718
16,885
Eligibility Category
Index and ELC
26,119
24,704
15,709
27,746
26,171
16,857
27,554
25,596
16,893
Index Only
24,960
19,387
10,126
25,904
19,229
9,816
28,360
20,653
10,300
ELC Only
5,535
4,341
2,526
5,441
3,840
2,296
5,245
3,807
2,262
Entitled to Review
27,292
13,252
7,038
29,317
12,242
6,102
28,897
11,313
5,627
Do Not Meet Above Criteria (A by E)
9,512
1,360
741
10,772
1,565
892
9,888
1,475
861
Source: UCAP 5/25/11, 5/24/12, 5/28/13, 5/27/14
Page 13

Table 4
CA Public High School Admissions Outcomes as a Percent of High School Graduates, Fall 2012-2014
2012
2013
2014
CA Public HS Graduates*
418,598
422,177
410,964
projected
All CA Pub HS Applicants
80,721
86,744
88,135
% of CA Pub HS Graduates
19.3%
20.5%
21.4%
CA Pub HS Applicants Guaranteed Admission
48,787
51,469
52,842
% of CA Pub HS Graduates
11.7%
12.2%
12.9%
Admitted "ETR" Students
11,468
10,607
10,047
% of CA Pub HS Graduates
2.7%
2.5%
2.4%
Total Guaranteed PLUS ETR Admits
53,580
53,890
53,853
% of CA Pub HS Graduates
14.4%
14.7%
15.3%
Total Admitted to Campus of Choice
51,195
51,758
51,706
% of CA Pub HS Graduates
12.2%
12.3%
12.6%
*Total CA public high school graduate totals are from California Department of Education,
projected high school graduates for 2014 are from California Department of Finance
When BOARS developed the eligibility reform policy, it projected incorrectly that the students in
the 9% Eligibility in the Local Context (ELC) group and the 9% statewide group would combine
to provide an admissions guarantee to approximately 10% of California public high school
graduates. BOARS recognized the miscalculation in 2012 after UC admitted 11.7% of public high
school graduates who met one or both of the 9x9 guarantees, which grew to 14.4% after adding
those admitted through ETR (c.f., Table 4). This trend has continued and amplified since 2012. In
2014, UC’s guarantee structure appears to be accommodating more than the top 12.5% of
California High School graduates targeted in the Master Plan. Applicants from public high schools
who qualified for the guarantee for fall 2014 (52,842) constitute 12.9% of the total graduating class
(410,964), while the admitted ETR applicants (10,047) constitute 2.4%. Overall, the combination
of these groups represents 15.3%.
Thus the 9x9 eligibility policy has overshot its original target for admission guarantees and, as a
result, the overall eligibility pool is considerably larger than expected. As a consequence, UC’s
referral system is facing significant challenges that must be addressed in order to maintain UC’s
Master Plan commitment to California residents. For example, although the new eligibility policy
reduced the referral pool from over 12,000 in 2011 to slightly above 9,000 in 2012
14
, the pool has
since grown to over 10,000 in 2013 and over 11,000 in 2014
15
.
II.2.2 Recalibration of the Statewide Eligibility Index
BOARS has taken steps to address the problem. In June 2013, on the recommendation of BOARS,
the Assembly of the Academic Senate approved
16
a recalibration of the statewide admissions index
for freshmen applicants to more closely capture the percentage of California public high school
14
http://www.ucop.edu/news/factsheets/2012/frosh_trsirs_table1.1.pdf
15
http://www.ucop.edu/news/factsheets/2014/frosh_trsirs_table1.1.pdf
16
http://senate.universityofcalifornia.edu/reports/RLP_Sakaki_StatewideIndexamendment_FINAL.pdf
Page 14
graduates who are identified as being in the top 9% of their class as specified in Regent’s Policy
2103. The new index adjusts the minimum UC Score for each weighted GPA range of 3.0 and
higher that is required to earn the statewide guarantee. The new index will take effect for students
who apply in fall 2014 for fall 2015 matriculation. The recalibration does not alter the “9x9” policy
or the target of 9% of public high school graduates who should receive a statewide guarantee.
BOARS will begin to analyze the impact of the index recalibration on application, selection and
enrollment over the coming year, as pertinent data becomes available.
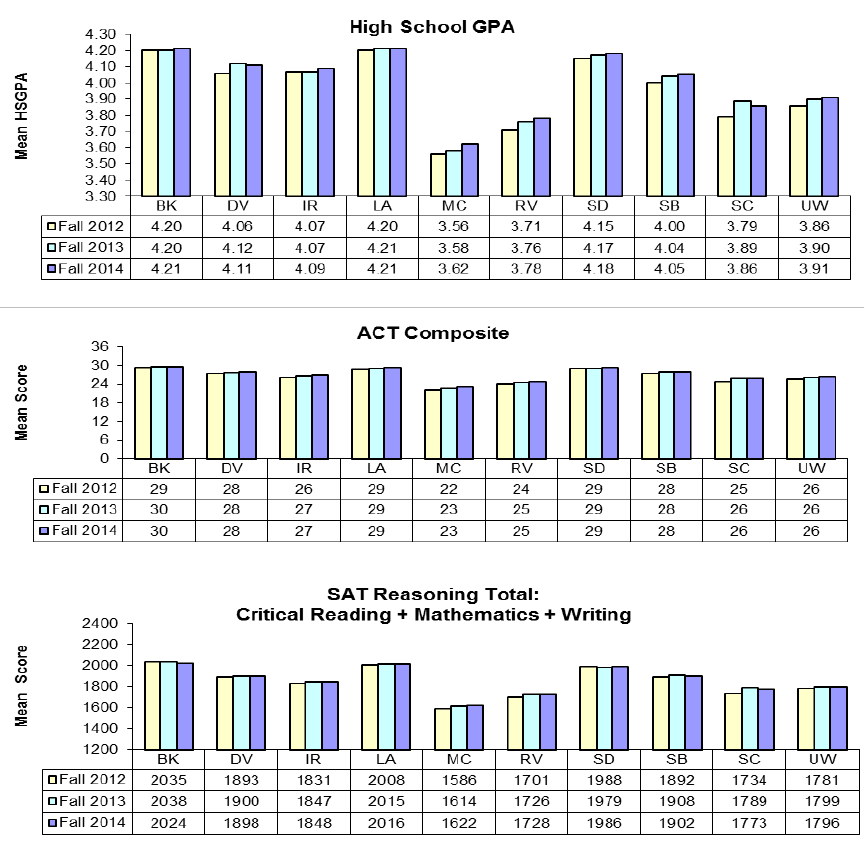
II.2.3 Academic Indicators of Freshman Admits
The academic indicators for admitted applicants for fall 2012, 2013, and 2014 presented in Figure
3 show that, notwithstanding increases in the number of admits, there continue to be small but
steady increases in the academic qualifications of admits.
Figure 3: California Freshman ADMIT Profile for 2012, 2013 & 2014
Page 15

II.2.4 Transfer Admission
As shown in Table 5, overall, UC admitted 22,358 transfer students in 2014, a very slight increase
over 2013, but still below 2012 levels. Admission rates have held steady at approximately 65% for
California residents (65.1% in 2014), and international students were admitted at about the same
rate (64.8% in 2014). The number of domestic out-of-state applicants admitted to UC remains
small, just over 1,000 in 2014, and fewer than one in four are admitted to UC upon application.
Table 5. Applicants, Admits and Admit Rates All Transfers by Residency Fall 2012-Fall 2014
2012
2013
2014
Residency Status
Applicants
Admits
Admit
Rate
Applicants
Admits
Admit
Rate
Applicants
Admits
Admit
Rate
California Residents
30,007
19,483
64.9%
29,854
19,183
64.3%
29,303
19,067
65.1%
Domestic Non-Residents
1,054
264
25.0%
950
196
20.6%
1,019
247
24.2%
International Non-Residents
5,045
3,560
70.6%
4,329
2,802
64.7%
4,699
3,044
64.8%
Total
36,106
23,307
64.6%
35,133
22,181
63.1%
35,021
22,358
63.8%
II.3 Yield
Transfer. Universitywide, 18,781 transfer admits submitted an SIR for fall 2014, slightly up from
18,623 in 2013 and 18,410 in 2012, as indicated in Table 6.1. California resident SIRs dropped
slightly, while nonresident transfer SIRs increased over each period. In 2014, nonresidents
represented 14.2% of all transfer SIRs, up from 11.8% in fall 2012 and from 10.9% in 2010
(reported in the 2012 Report on Comprehensive Review).
Table 6.1: Universitywide Transfer Statement of Intent to Register (SIR) Unduplicated Count
2012
2013
2014
California
16,228
88.1%
16,128
86.6%
16,108
85.8%
Out-of-State
116
0.6%
86
0.5%
137
0.7%
International
2,066
11.2%
2,409
12.9%
2,536
13.5%
Total
18,410
100.0%
18,623
100.0%
18,781
100.0%
Freshman. Universitywide, 45,046 Freshman admits submitted an SIR for fall 2014, up from
42,753 in 2012 and 44,016 in 2013, as indicated in Table 6.2. This is an increase of 2,293 SIRs
over the two-year period, a 5.4% increase. SIRs from California residents decreased slightly over
this period, from 36,140 in 2012 to 35,943 in 2014. Thus, the overall growth in SIRs has been
entirely due to nonresidents, the majority of whom are international. From 2012 to 2014 the
percentage of nonresidents among the total SIRs increased from 15.5% to 20.2%. Growth in
nonresident SIRs has been the result of concerted campus efforts.
Table 6.2: Universitywide Freshmen Statement of Intent to Register (SIR) Unduplicated Count
2012
2013
2014
California
36,140
84.5%
35,964
81.7%
35,943
79.8%
Out-of-State
2,772
6.5%
3,302
7.5%
3,691
8.2%
International
3,841
9.0%
4,750
10.8%
5,412
12.0%
Total
42,753
100.0%
44,016
100.0%
45,046
100.0%
Source: May UCAP files
Page 16

Figure 4 shows the numbers of California freshman applications, admits, and SIRs for the four
year period 2011-2014. Numbers of California freshman admits and SIRs have remained relatively
stable over the period examined, with a slight decrease in SIRs from 2012 to 2014. With the
increase in the number of applications and the steady number of admit offers, the admission rate
for California residents dropped from 72.1% (61,323 out of 85,052) in 2011 to 62.9% (62,844 out
of 99,944) in 2014. Among the 62,844 California-resident freshman admits for fall 2014, 35,943
submitted SIRs, representing a yield of 57.2%. This yield has remained essentially unchanged over
all four admission cycles.
Figure 4: CA resident applicants, admits, and SIRs. Applicants for fall enrollment between 2011 and 2014
Figure 5 shows numbers of California freshman applications, admits, and SIRs by eligibility status
over the past three admission cycles, from the first implementation of the 9x9 eligibility policy.
Tables 7.1 and 7.2 show the same data in tabular form along with admission and yield rates for
each applicant category, with the changes from 2012 presented in Table 7.3. The data show that
applicants who are ELC-only make up a small percentage of the total number of applicants who
are eligible (via either the Index, ELC or both); namely 9.8%, 9.2% and 8.6% for 2012, 2013 and
2014, respectively. The total number of eligible applicants has steadily increased, from 56,614 in
2012 to 61,159 in 2014 (an 8% increase), and there was an increase in the proportion of those
eligible among all applicants (eligible, ETR and Other) over the two-year period as well (from
60.6% in 2012 to 61.2% 2014). These increases were due exclusively to increases in the number of
statewide (SW) eligible applicants (some of whom may have been also ELC), however, the
number of ELC-only applicants has steadily decreased since 2012 (by a total of 5.2% from 2012 to
2014, as indicated in Table 7.3).
35,064
36,140
35,963
35,943
61,323
63,044
63,047
62,844
85,052
93,418
99,180
99,944
2011
2012
2013
2014
Applicants Admits SIRs
Page 17

Figure 5: California resident applicants, admits and SIRs under the new policy by eligibility category: 2012-2014
Page 18

Table 7.1: CA resident applicants, admits and SIRs under the new policy by eligibility category
2012
SW & ELC
SW ONLY
TOT SW
ELC ONLY
All Eligible
ETR
Other
Total
applicants
26,119
24,960
51,079
5,535
56,614
27,292
9,512
93,418
admits
24,704
19,387
44,091
4,341
48,432
13,252
1,360
63,044
SIRs
15,709
10,126
25,835
2,526
28,361
7,038
741
36,140
admission rate
94.6%
77.7%
86.3%
78.4%
85.9%
48.6%
14.3%
67.5%
yield rate
63.6%
52.2%
58.6%
58.2%
58.6%
53.1%
54.5%
57.3%
2013
SW & ELC
SW ONLY
TOT SW
ELC ONLY
All Eligible
ETR
Other
Total
applicants
27,746
25,904
53,650
5,441
59,091
29,317
10,772
99,180
admits
26,171
19,229
45,400
3,840
49,240
12,242
1,565
63,047
SIRs
16,857
9,816
26,673
2,296
28,969
6,102
892
35,963
admission rate
94.3%
74.2%
84.6%
70.6%
83.9%
41.8%
14.5%
63.6%
yield rate
64.4%
51.0%
58.8%
59.8%
58.8%
49.8%
57.0%
57.0%
2014
SW & ELC
SW ONLY
TOT SW
ELC ONLY
All Eligible
ETR
Other
Total
applicants
27,554
28,360
55,914
5,245
61,159
28,897
9,888
99,944
admits
25,596
20,653
46,249
3,807
50,056
11,313
1,475
62,844
SIRs
16,893
10,300
27,193
2,262
29,455
5,627
861
35,943
admission rate
92.9%
72.8%
82.7%
72.6%
82.3%
39.1%
14.9%
62.9%
yield rate
66.0%
49.9%
58.8%
59.4%
58.8%
49.7%
58.4%
57.2%
Table 7.2: CA resident applicants, admits and SIRs by eligibility category, by percentage
2012
SW & ELC
SW ONLY
TOT SW
ELC ONLY
Total
All Eligible
ETR
Other
Total
applicants
46.1%
44.1%
90.2%
9.8%
100.0%
60.6%
29.2%
10.2%
100.0%
admits
51.0%
40.0%
91.0%
9.0%
100.0%
76.8%
21.0%
2.2%
100.0%
SIRs
55.4%
35.7%
91.1%
8.9%
100.0%
78.5%
19.5%
2.1%
100.0%
2013
SW & ELC
SW ONLY
TOT SW
ELC ONLY
Total
All Eligible
ETR
Other
Total
applicants
47.0%
43.8%
90.8%
9.2%
100.0%
59.6%
29.6%
10.9%
100.0%
admits
53.1%
39.1%
92.2%
7.8%
100.0%
78.1%
19.4%
2.5%
100.0%
SIRs
58.2%
33.9%
92.1%
7.9%
100.0%
80.6%
17.0%
2.5%
100.0%
2014
SW & ELC
SW ONLY
TOT SW
ELC ONLY
Total
All Eligible
ETR
Other
Total
applicants
45.1%
46.4%
91.4%
8.6%
100.0%
61.2%
28.9%
9.9%
100.0%
admits
51.1%
41.3%
92.4%
7.6%
100.0%
79.7%
18.0%
2.3%
100.0%
SIRs
57.4%
35.0%
92.3%
7.7%
100.0%
81.9%
15.7%
2.4%
100.0%
Page 19

Table 7.3: CA resident applicants, admits and SIRs by eligibility category, changes since 2012
2012-13
SW & ELC
SW ONLY
TOT SW
ELC ONLY
All Eligible
ETR
Other
Total
applicants
1,627
944
2,571
-94
2,477
2,025
1,260
5,762
admits
1,467
-158
1,309
-501
808
-1,010
205
3
SIRs
1,148
-310
838
-230
608
-936
151
-177
Percent Change
applicants
6.2%
3.8%
5.0%
-1.7%
4.4%
7.4%
13.2%
6.2%
admits
5.9%
-0.8%
3.0%
-11.5%
1.7%
-7.6%
15.1%
0.0%
SIRs
7.3%
-3.1%
3.2%
-9.1%
2.1%
-13.3%
20.4%
-0.5%
2013-14
SW & ELC
SW ONLY
TOT SW
ELC ONLY
All Eligible
ETR
Other
Total
applicants
-192
2,456
2,264
-196
2,068
-420
-884
764
admits
-575
1,424
849
-33
816
-929
-90
-203
SIRs
36
484
520
-34
486
-475
-31
-20
Percent Change
applicants
-0.7%
9.5%
4.2%
-3.6%
3.5%
-1.4%
-8.2%
0.8%
admits
-2.2%
84%
1.9%
-0.9%
1.7%
-7.6%
-5.8%
-0.3%
SIRs
0.2%
4.9%
1.9%
-1.5%
1.7%
-7.8%
-3.5%
-0.1%
2012-14
SW & ELC
SW ONLY
TOT SW
ELC ONLY
All Eligible
ETR
Other
Total
applicants
1,435
3,400
4,835
-290
4,545
1,605
376
6,526
admits
892
1,266
2,158
-534
1,624
-1,939
115
-200
SIRs
1,184
174
1,358
-264
1,094
-1,411
120
-197
Percent Change
applicants
5.5%
13.6%
9.5%
-5.2%
8.0%
5.9%
4.0%
7.0%
admits
3.6%
6.5%
4.9%
-12.3%
3.4%
-14.6%
8.5%
-0.3%
SIRs
7.5%
1.7%
5.3%
-10.5%
3.9%
-20.0%
16.2%
-0.5%
The admission rate for eligible applicants has decreased each year, from 85.9% in 2012 to 82.3%
in 2014, while the yield rate
17
for these applicants has remained nearly constant (58.8% in 2014).
Decreasing admission rates for eligible applicants is consistent with the increasing selectivity of
UC campuses as discussed earlier. Overall, the admission rate for California freshman applicants
declined from 67.5% in 2012 to 62.9% in 2014, while their yield remained essentially unchanged
(57.2% in 2014). It should be noted that these rates are higher than those of the entire freshman
applicant population (including nonresidents), which were 66.3% in 2012 and 60.1% in 2014, as
indicated in Table 2 above.
Statewide-eligible applicants continue to be admitted at significantly higher rates than ELC-only
applicants (82.7% versus 72.6% for 2014), while the yield rates for these two groups remain
comparable (at approximately 59%). Among California freshman admits, those who carry only the
ELC guarantee constitute a decreasing proportion of the total number of eligible applicants, from
9% of the eligible pool in 2012 to 7.6% in 2014 (c.f., Table 7.2). The trend is the same for the
17
Yield in this report is defined as the percentage of admitted students who submit their SIR.
Page 20

number of ELC-only SIRs, with an increasing proportion of applicants deemed eligible via the
statewide index constituting the group of SIRs who are eligible.
Overall, admits and SIRs who are eligible constitute an increasing proportion of all California
admits and SIRs, while ETR admits constitute a decreasing proportion, as indicated in Table 7.2.
The admission rate for ETR applicants remains considerably lower than those of eligible applicants
(as expected), and has steadily declined from 48.6% in 2012 to 39.1% in 2014. Admission rates for
applicants who fall into the “Other” category (who are neither eligible nor ETR) are the lowest
rates of all applicant groups (at 14.9% in 2014), although the yield rate for this group has steadily
increased since 2012 (to 58.4% in 2014) and is now significantly higher than the rate for ETR
applicants and comparable with that of eligible applicants. The Other category constitutes the pool
of applicants receiving Admission by Exception (A by E), which continues to make up less than
2.5% of all SIRs in keeping with UC policy limiting A by E matriculates to no more than 6%.
All eligible applicants who were not admitted to a campus to which they applied were offered the
opportunity to opt in to consider a referral offer from UC Merced, the only campus with available
space for referrals. In 2012, 194 eligible applicants from the referral pool (2.2% of the referral
pool) submitted an SIR, while in 2014, 239 referral-pool applicants (2.1%) submitted an SIR
18
.
II.4 Nonresident Admission
The new admissions policy applies to California residents only, and while the UC has maintained
its commitment to admitting all eligible California residents under the Master Plan, campuses have
expanded their recruitment of tuition-paying domestic and international nonresidents in the wake
of a budget crisis that saw UC’s state funding fall by nearly $1 billion. As can be gleaned from
Figure 6, these efforts led to a 100% (171%) increase in the number of domestic (international)
nonresident applicants between 2011 and 2014. Domestic (international) nonresident SIRs
increased by 50% (120%) over this period. In 2014, nonresidents comprised 20.2% of all freshman
SIRs, up from 12.3% in 2011.
18
http://www.ucop.edu/news/factsheets/2014/frosh_trsirs_table1.1.pdf
Page 21

Figure 6: Applicants, Admits, and SIRs by Residency: 2011-2014
Page 22

BOARS recognizes that campuses have actively recruited nonresident students for a variety of
reasons. The additional tuition revenue allows campuses to serve more California residents, as
well as to fund access to services that benefit all UC students. BOARS also recognizes that
international and domestic nonresident students contribute to campus diversity and can enhance
the quality of the undergraduate experience for all students.
As nonresident enrollment has increased, BOARS has sought assurance from campuses that
California residents are not being turned away to make room for less-qualified, but higher-
paying non-residents. In June 2011, BOARS adopted a clarification
19
to its July 2009 principles
for the admission of nonresidents, stating that nonresidents admitted to a campus must compare
favorably to California residents admitted to that campus. In December 2011, BOARS
recommended procedures
20
for the evaluation of residents and nonresidents to ensure that
campuses meet the compare-favorably standard. BOARS also resolved that campuses should
report annually to BOARS on the extent to which they are meeting the compare-favorably
standard.
In April 2014, BOARS issued a systemwide report
21
discussing the variety of approaches
campuses used to analyze their admissions, enrollment, and UC performance data, which
indicated that all were admitting nonresident students who compare favorably to residents.
BOARS also noted the difficulty of making a true comparison between residents and
nonresidents, based on narrow academic indicators and in the absence of equivalent local
context and achievement information for both applicant groups.
II.5 Attracting and Admitting Diverse Students
To help assess the extent to which the University of California is fulfilling its mission to provide
access and opportunity to diverse populations, BOARS evaluated systemwide and campus-
specific outcomes using a range of demographic indicators, including first-generation college
attending, family-income level, high-school Academic Performance Index (API) ranking,
residency, and the representation of racial/ethnic groups, particularly those who have been
historically underrepresented at UC.
Freshman Applicants, Admits, SIRs and Diversity 2012-2014
Table 8 summarizes the diversity of UC’s Freshman applicants, admits, and SIRs over the past
three admission cycles. Numerical counts are given in Table 8.1 and percentages of the total
counts for each category are given in Table 8.2. The data shows that applications from each of
the underrepresented groups (African Americans, American Indian, and Chicano/Latino) have
grown over the two-year period since first implementation of the new 9x9 eligibility policy
(beginning with applicants for fall 2012). However, only the Chicano/Latino and American
Indian groups experienced an increase in their proportions among all applicants over this period.
These were also the only two under-represented groups that experienced increases in their
19
http://senate.universityofcalifornia.edu/reports/DS_MGY_LPBOARSNRPrinciple6.pdf
20
http://senate.universityofcalifornia.edu/reports/RMA_MGYreBOARSresolutiononevalofresidents_non-
residents_FINAL.pdf
21
http://senate.universityofcalifornia.edu/committees/boars/BOARS2013CompareFavorablyReport-Final.pdf
Page 23

proportion among the cohorts of all admits and all SIRs from 2012 to 2014. African Americans
experienced an increase in applications but decreases in their numbers of both admits and SIRs
over the two-year period.
During the past three years, the UC admit pool has also experienced growth in the proportions
of both first-generation college-attending and low-income SIRs. Figure 7 summarizes the
proportions of first-generation and low-income SIRs for the past four admission cycles.
Transfer SIRs and Diversity 2012-2014
At the transfer level, all under-represented minority (URM) groups experienced an increase
SIRs. The greatest increase occurred for the Chicano/Latino group (16.8%, from 3,354 to
3,917), then African Americans (15.8%, from 584 to 676), and lastly American Indians (4.4%,
from 160 to 167)
22
. Overall a 16.2% increase in SIRs (from 4,141 to 4,813) from URM groups
occurred between 2012 and 2014. The Chicano/Latino group has remained the largest among all
URM SIRs (approximately 81% of all URM SIRs) during this period.
Table 8.3 below shows the representation of specific ethnic groups among California
Community College (CCC) transfer applicants, admits, and SIRs. CCC transfers account for
about 90% of all UC transfers. It can be seen that the representation of African Americans
increased from 2012 to 2014 from 3.3% to 3.8% of SIRs, while Chicanos/Latinos, in keeping
with the application trends, increased from 19.5% to 22.3% of SIRs. Although Whites are only
the third most populous ethnic group among UC freshman matriculates, they remain the largest
group among CCC transfer SIRs, at 31% of all CCC transfers.
22
http://www.ucop.edu/news/factsheets/2014/frosh_trsirs_table3.2.pdf
Page 24

Table 8.1: UC Statement of Intent to Register (SIR) Counts
California Resident FRESHMEN by Race/Ethnicity: Fall 2012, 2013, 2014
2012
2013
2014
2-yr SIR
Change
App
Admit
SIR
App
Admit
SIR
App
Admit
SIR
African American
5,719
2,834
1,537
5,982
2,731
1,427
5,867
2,705
1,467
-70
American Indian
692
438
226
710
393
201
759
455
235
9
Asian American
30,105
22,909
14,911
30,617
22,538
14,368
31,270
22,648
14,159
-752
Chicano/Latino
28,068
17,133
9,651
31,793
17,607
10,171
32,632
18,180
10,712
1,061
Pacific Islander
337
180
90
374
191
100
369
199
99
9
White
25,958
17,742
8,771
26,917
17,643
8,636
26,219
16,783
8,296
-475
Unknown
2,539
1,808
954
2,787
1,944
1,060
2,828
1,874
975
21
Total
93,418
63,044
36,140
99,180
63,047
35,963
99,944
62,844
35,943
-197
Source: UCAP 5/25/11, 5/24/12, 5/28/13, 5/27/14
Table 8.2: UC Statement of Intent to Register (SIR) Percent of Total
California Resident FRESHMEN by Race/Ethnicity: Fall 2012, 2013, 2014
2012
2013
2014
2-yr % SIR
increase
App
Admit
SIR
App
Admit
SIR
App
Admit
SIR
African American
6.1%
4.5%
4.3%
6.0%
4.3%
4.0%
5.9%
4.3%
4.1%
-4.6%
American Indian
0.7%
0.7%
0.6%
0.7%
0.6%
0.6%
0.8%
0.7%
0.7%
4.0%
Asian American
32.2%
36.3%
41.3%
30.9%
35.7%
40.0%
31.3%
36.0%
39.4%
-5.0%
Chicano/Latino
30.0%
27.2%
26.7%
32.1%
27.9%
28.3%
32.7%
28.9%
29.8%
11.0%
Pacific Islander
0.4%
0.3%
0.2%
0.4%
0.3%
0.3%
0.4%
0.3%
0.3%
10.0%
White/Other
27.8%
28.1%
24.3%
27.1%
28.0%
24.0%
26.2%
26.7%
23.1%
-5.4%
Missing
2.7%
2.9%
2.6%
2.8%
3.1%
2.9%
2.8%
3.0%
2.7%
2.2%
Total
100.0%
100.0%
100.0%
100.0%
100.0%
100.0%
100.0%
100.0%
100.0%
-0.5%
Figure 7. Percentage of CA-resident low-income and first-generation college-going SIRs
Page 25

Table 8.3: UC Statement of Intent to Register (SIR) Percent of Total
California Community College Transfers by Race/Ethnicity: Fall 2012, 2013, 2014
2012 2013 2014
Residency Status
Applicants
Admits
SIRs
Applicants
Admits
SIRs
Applicants
Admits
SIRs
African American
4.5%
3.4%
3.3%
4.9%
3.8%
3.7%
4.9%
3.9%
3.8%
American Indian
1.1%
1.0%
1.0%
1.0%
0.9%
1.0%
1.0%
0.9%
1.0%
Asian
27.7%
28.5%
29.1%
25.8%
26.3%
26.9%
25.7%
26.3%
26.9%
Chicano/Latino
21.5%
20.2%
19.5%
23.3%
22.3%
21.6%
24.0%
23.0%
22.3%
White
33.5%
33.2%
33.3%
32.2%
32.2%
32.2%
30.8%
30.6%
31.0%
Unknown
3.2%
3.4%
3.4%
2.8%
2.8%
2.8%
2.7%
2.7%
2.6%
International
8.5%
10.3%
10.4%
10.1%
11.6%
11.9%
10.8%
12.5%
12.5%
Total
100.0%
100.0%
100.0%
100.0%
100.0%
100.0%
100.0%
100.0%
100.0%
During 2010-12 BOARS (with Academic Assembly approval) restructured transfer selection
beginning in 2015 to accommodate the new SB 1440 AA and AS degrees for transfer and to
incorporate major-based criteria more fully into the Comprehensive Review of transfer
applicants. The proponents and authors of SB 1440 argued that these new degrees would
simplify the transfer process for CCC students and thereby increase UC/CSU access for a more
diverse population. BOARS hopes these assertions turn out to be true in the future and is
pleased that the Senate has agreed with its plan to align transfer admission processes with these
new AA and AS degrees.
In 2013, a Transfer Action Team was charged by the President with recommending ways to
strengthen and streamline the transfer path, increase the transfer graduation rate, and expand
UC’s reach into a broader range of CCCs. 2013-14 BOARS Chair George Johnson and Vice
President for Student Affairs Judy Sakaki co-chaired the team and presented a report with
recommendations
23
to the Regents in May 2014. The recommendations include upgrading UC’s
transfer message with a new communications and technology strategy; creating a stronger
presence at every CCC to promote interest in transferring among a geographically, ethnically,
and socio-economically diverse student body; upgrading support services to help transfers
transition to and succeed at UC; and reaffirming UC’s commitment to transfer students by
engaging every campus to meet the Master Plan’s 2:1 freshman-to-transfer target. The report
also recommends building on previous efforts to align lower division requirements for specific
majors across UC campuses to enable potential transfer students to prepare for more than one
UC simultaneously, and also aligning when possible, UC’s major requirements with the
Transfer Model Curricula developed by CCC/CSU for the Associate Degrees for Transfer.
Finally, the report makes clear that UC cannot increase transfer enrollments at the expense of
freshmen nor without additional state funding.
23
http://ucop.edu/transfer-action-team/
Page 26

UC as a Vehicle of Social Mobility: The SIR Academic Profile in 2014
Table 9 details the distribution of applicants, admits, and SIRs among ethnic and eligibility
categories. This information is important because one of the goals of the eligibility changes was
to provide access to high school graduates who completed the “a-g” pattern and had strong
academic credentials, but fell short of the prior eligibility rules.
Other indicators show ways in which UC is able to be an engine of social mobility in the state.
As noted earlier, more first-generation applicants (coming from families where neither parent
had a bachelor’s degree) are seeking and gaining admission to UC. Among the 99,944
California applicants for fall 2014, 45.8% (45,730) were first-generation, as were 42.5% of
California admits and 47% of SIRs (16,885 SIRs). It is important to note that among California
applicants who met the ETR criteria (but without a statewide or ELC guarantee) the percentages
of applicants, admits and SIRs who were first-generation were 61.7%, 64.5% and 67.1% (3,776
SIRs), respectively; while among the ELC- -only group the percentages were 83.0%, 84.6% and
85.2% (1,927 SIRs), respectively. Overall, this means that 33.8% (5,703 of 16,885) of the first-
generation SIRs for fall 2014 were in one of the two categories of eligibility (ETR and ELC-
only) that were created or expanded by the 9x9 eligibility policy.
A similar pattern emerges for SIRs from schools with Academic Performance Index (API)
scores in the bottom two quintiles (“Low API”). 19.6% of the 99,944 California applicants are
from low API schools, as are 18% of California admits and 20.4% of SIRs (7,349 SIRs).
Among California applicants who were ETR the percentages of applicants, admits and SIRs
from low-API high schools were 25.1%, 24.2% and 26.4% (1,483 SIRs), respectively; while
among the ELC -only group the percentages are 60.3%, 62.1% and 62.0% (1,403 SIRs).
Overall, this means that 39.3% (2,886 of 7,349) of SIRs for 2014 from applicants at low-API
high schools were in one of the two categories of eligibility (ETR and ELC-only) created or
expanded by the 9x9 eligibility policy.
URMs constituted 39.3% of California applicants, 34% of California admits, and 34.5% of SIRs
(12,414 SIRs) for fall 2014. Among California applicants who were ETR the percentages of
applicants, admits, and SIRs from URM groups were 54.6%, 54.2% and 55.9% (3,147 SIRs),
respectively; while among the ELC-only group the percentages are 74%, 75.6% and 75.8%
(1714 SIRs). Overall, this means that 39.2% (4,861 of 12,414) of URM SIRs for fall 2014 were
in one of the two categories of eligibility (ETR and ELC-only) created or expanded by the 9x9
eligibility policy. Considering that yield rates for African Americans and American Indians
have been consistently below average in past years, in comparison with systemwide yield rates,
efforts at increasing the yield rates for these groups may prove worthwhile in increasing their
enrollment numbers and should be encouraged.
Figure 8 summarizes the data discussed above regarding first-generation, ELC-only and low-
API SIRs, including comparisons of profiles over the past three admissions cycles (2012-2014).
Overall, the data indicates that indeed many of the goals of the eligibility changes were met.
Many applicants who met the ELC guarantee alone or were ETR without the guarantee were
admitted. Moreover, ELC-only and ETR admits and SIRs were more diverse and more likely to
be first generation and/or from low-API high schools than those who were eligible via the
statewide index.
Page 27

Table 9.1: Profile of Applicants, Admits, and SIRs for Fall 2014 by Admissions Eligibility Category
Index Eligible Only
ELC Eligible Only
Index & ELC Eligible
Apps
Admits
Admit
Rate
SIRs
Take
Rate
Apps
Admits
Admit
Rate
SIRs
Take
Rate
Apps
Admits
Admit
Rate
SIRs
Take Rate
Universitywide
28,360
20,653
72.8%
10,300
49.9%
5,245
3,807
72.6%
2,262
59.4%
27,554
25,596
92.9%
16,893
66.0%
Ethnicity
African American
1,037
742
71.6%
326
43.9%
322
221
68.6%
127
57.5%
835
746
89.3%
481
64.5%
American Indian
251
176
70.1%
79
44.9%
19
14
73.7%
4
28.6%
209
189
90.4%
111
58.7%
Asian
11,065
8,853
80.0%
4,980
56.3%
888
637
71.7%
395
62.0%
10,117
9,633
95.2%
6,990
72.6%
Chicano/Latino
4,221
2,974
70.5%
1,481
49.8%
3,541
2,643
74.6%
1,583
59.9%
7,383
6,913
93.6%
4,721
68.3%
White
10,757
7,162
66.6%
3,082
43.0%
390
233
59.7%
120
51.5%
8,140
7,300
89.7%
4,125
56.5%
Unknown
1,029
746
72.5%
352
47.2%
85
59
69.4%
33
55.9%
870
815
93.7%
465
57.1%
1st Gen College
6,580
5,182
78.8%
3,151
60.8%
4,353
3,221
74.0%
1,927
59.8%
10,896
10,336
94.9%
7,620
73.7%
School Type
Public
22,224
16,575
74.6%
8,824
53.2%
5,144
3,742
72.7%
2,217
59.2%
25,333
23,575
93.1%
15,885
67.4%
Private
6,063
4,017
66.3%
1,438
35.8%
66
44
66.7%
30
68.2%
2,180
1,981
90.9%
981
49.5%
Unknown
73
61
83.6%
38
62.3%
35
21
60.0%
15
71.4%
41
40
97.6%
27
67.5%
Low API
1,128
934
82.8%
576
61.7%
3,164
2,366
74.8%
1,403
59.3%
5,158
4,932
95.6%
3,690
74.8%
Entitled to Review
Do Not Meet Other Criteria
Total
Apps
Admits
Admit
Rate
SIRs
Take
Rate
Apps
Admits
Admit
Rate
SIRs
Take
Rate
Apps
Admits
Admit
Rate
SIRs
Take Rate
Universitywide
28,897
11,313
39.1%
5,627
49.7%
9,888
1,475
14.9%
861
58.4%
99,944
62,844
62.9%
35,943
57.2%
Ethnicity
African American
2,428
875
36.0%
457
52.2%
1,245
121
9.7%
76
62.8%
5,867
2,705
46.1%
1,467
54.2%
American Indian
192
64
33.3%
32
50.0%
88
12
13.6%
9
75.0%
759
455
59.9%
235
51.6%
Asian
7,246
3,242
44.7%
1,614
49.8%
2,323
482
20.7%
279
57.9%
31,639
22,847
72.2%
14,258
62.4%
Chicano/Latino
13,166
5,190
39.4%
2,658
51.2%
4,321
460
10.6%
269
58.5%
32,632
18,180
55.7%
10,712
58.9%
White
5,273
1,739
33.0%
771
44.3%
1,659
349
21.0%
198
56.7%
26,219
16,783
64.0%
8,296
49.4%
Unknown
592
203
34.3%
95
46.8%
252
51
20.2%
30
58.8%
2,828
1,874
66.3%
975
52.0%
1st Gen College
17,836
7,293
40.9%
3,776
51.8%
6,065
686
11.3%
411
59.9%
45,730
26,718
58.4%
16,885
63.2%
School Type
Public
25,555
10,091
39.5%
5,056
50.1%
8,389
1,057
12.6%
638
60.4%
86,645
55,040
63.5%
32,620
59.3%
Private
2,786
968
34.7%
422
43.6%
894
175
19.6%
94
53.7%
11,989
7,185
59.9%
2,965
41.3%
Unknown
556
254
45.7%
149
58.7%
605
243
40.2%
129
53.1%
1,310
619
47.3%
358
57.8%
Low API
7,244
2,743
37.9%
1,483
54.1%
2,930
315
10.8%
197
62.5%
19,624
11,290
57.5%
7,349
65.1%
Page 28

Table 9.2: Profile of Applicants, Admits, and SIRs for Fall 2014
by Admissions Eligibility Category and Percentage of Total
Index Eligible Only
ELC Eligible Only
Index & ELC Eligible
Apps
Admits
SIRs
Apps
Admits
SIRs
Apps
Admits
SIRs
Universitywide
28,360
20,653
10,300
5,245
3,807
2,262
27,554
25,596
16,893
Ethnicity
Afr Am
3.7%
3.6%
3.2%
6.1%
5.8%
5.6%
3.0%
2.9%
2.8%
Asian
39.0%
31.2%
48.3%
16.9%
16.7%
17.5%
36.7%
37.6%
41.4%
Chic/Lat
14.9%
10.5%
14.4%
67.5%
69.4%
70.0%
26.8%
27.0%
27.9%
White
37.9%
25.3%
29.9%
7.4%
6.1%
5.3%
29.5%
28.5%
24.4%
1st Gen College
23.2%
18.3%
30.6%
83.0%
84.6%
85.2%
39.5%
40.4%
45.1%
School Type
Public
78.4%
80.3%
85.7%
98.1%
98.3%
98.0%
91.9%
92.1%
94.0%
Low API
4.0%
4.5%
5.6%
60.3%
62.1%
62.0%
18.7%
19.3%
21.8%
Entitled to Review
Do Not Meet Other Criteria
Total
Apps
Admits
SIRs
Apps
Admits
SIRs
Apps
Admits
SIRs
Universitywide
28,897
11,313
5,627
9,888
1,475
861
99,944
62,844
35,943
Ethnicity
Afr Am
8.4%
7.7%
8.1%
12.6%
8.2%
8.8%
5.9%
4.3%
4.1%
Asian
25.1%
28.7%
28.7%
23.5%
32.7%
32.4%
31.7%
36.4%
39.7%
Chic/Lat
45.6%
45.9%
47.2%
43.7%
31.2%
31.2%
32.7%
28.9%
29.8%
White
18.2%
15.4%
13.7%
16.8%
23.7%
23.0%
26.2%
26.7%
23.1%
1st Gen College
61.7%
64.5%
67.1%
61.3%
46.5%
47.7%
45.8%
42.5%
47.0%
School Type
Public
88.4%
89.2%
89.9%
84.8%
71.7%
74.1%
86.7%
87.6%
90.8%
Low API
25.1%
24.2%
26.4%
29.6%
21.4%
22.9%
19.6%
18.0%
20.4%
Page 29

Figure 8. Percentages of CA-resident, first-generation, low-income and low-API SIRs for 2012-2014
Page 30

Page 31
II.6 First-Term Student Performance at UC
The preceding sections have addressed outcomes of the admissions process itself. One of
BOARS’ key roles is to ensure that the students who are admitted are ready to be successful at
UC. To ensure that admission processes are working as intended, BOARS also examined the
performance of students after matriculation as freshmen at one of the nine UC campuses. The
average first-term (quarter or semester) freshman grade point average, probation rate
24
, and
persistence rate
25
were evaluated for all students who began in fall 2010 through fall 2013. The
results are presented in Table 10. A statistical significance test examining the differences in
average GPAs from one year to the next was also performed.
Table 10: First-term and First Year Academic Performance of California Freshmen Universitywide
Year of First
Term
Enrolled
Students
First Term
Average
GPA
First Term
Probation
Rate
First Term
Persistence
Rate
First Year
Average
GPA
First Year
Probation
Rate
First Year
Persistence
Rate
2010
31,349
2.99
8.76%
98.73%
3.00
5.53%
93.35%
2011
31,584
3.00
8.95%
98.60%
3.00
5.55%
93.11%
2012
32,471
3.01
8.59%
98.68%
3.00
5.56%
93.10%
2013
32,185
3.03
8.43%
98.70%
Residency status is determined based on enrollment definition.
Students have continued to succeed under the new admissions policy. Their average first-term
GPA was higher than in either of the previous two years, before implementation of the new
policy, and their first-term probation rate was lower. In all, 93.1% of first-year UC students
move on to their second year.
S
ECTION III: THE REVIEW PROCESS: IMPLEMENTING INDIVIDUALIZED AND
SINGLE SCORE REVIEW
The primary advantage of Comprehensive Review is that its multiple criteria allow campuses to
consider a wide range of student achievements, understand discrepant information (e.g. high
grades and low test scores), and evaluate student resilience and promise, in addition to standard
indicators of achievement. It is up to applicants to make their case by providing detailed
information about academic and personal accomplishments and answering essay questions to the
best of their ability. All UC applicants submit a personal statement that provides additional
information and insight for readers.
The 2010 and 2012 reports discussed the different approaches to comprehensive review at the
nine undergraduate campuses, including single score (“holistic”); two stage or multiple stage;
and fixed weight approaches, as well as the role of supplemental review, and mechanisms to
ensure the quality and integrity of the review process. Since 2012, several campuses have made
24
Probation rate is based on the number of students whose fall term GPA was less than 2.0, excluding GPAs of 0.00
if the student persisted to the next term.
25
Persistence rate is the ratio of students who begin the second term of their freshman year after completing fall
term.

Page 32
additional adjustments to their approaches and the level of cross-campus collaboration has
increased, largely in response to the adoption by the Regents in their January 2011 Resolution on
Individualized Review and Holistic Evaluation in Undergraduate Admissions (Regents Policy
2108). BOARS expects campuses to make additional adjustments and refinements going
forward.
III.1 Description of Campus Selection Processes Using Comprehensive Review
BOARS asked campuses to describe their review processes and indicate what, if any, changes
have been implemented since 2012. These statements are reproduced below. While local
practices differ, all campuses incorporate both academic and contextual factors into their
assessment of student talent and potential. At all campuses, Comprehensive Review processes
incorporate a significant amount of quantitative information about student achievement.
Campuses are implementing holistic review because they view it as a more equitable approach,
although three have chosen not to implement a single-score review system because they believe
that their current systems are producing solid outcomes using different strategies.
Berkeley
Berkeley’s holistic review system has been in place for nearly two decades, and has significantly
informed the implementation of holistic review at other campuses. At Berkeley the process has
been deeply affected by the continued dramatic growth of both resident and non-resident
applicant pools at a rate of approximately 8% per year every year over the last five years. In
particular, the resources for administering holistic review at Berkeley have been strained by the
dramatic growth of applicant pool. This includes the ongoing need to sufficiently understand the
school context information for domestic non-resident applicants and the need for specialized
staffing to review international applications, which often do not readily line up with California’s
technical eligibility requirements. The sheer volume of applicants has generated a need to read
more efficiently and we have made adjustments to our process to do just that. Our current system
is tuned to make good decisions in the selectivity range of 20-25%.
Berkeley’s Office of Undergraduate Admissions staff has continued to consult with faculty and
staff at most other UC campuses in matters relating to holistic review, although the crush of
applications has meant that Berkeley needed to simplify its reads at the low end for those
distinctions that do not affect offers of admission at Berkeley. Nonetheless the Berkeley
admissions office has continued to participate in systemwide shared reviews, sharing read scores
on overlap applicants with other campuses, but without distinctions at the low end for students
not competitive in our pool, all as part of making the process more efficient while ensuring a
baseline level of quality in the application reviews.
The effect of a much larger pool has been that selectivity at Berkeley has reached an all-time
high. For the class entering in 2014 the overall admission rate broke 20% for the first time
(19.9%). The most selective college was Engineering with a 9.9% overall admission rate, and
within Engineering, which admits by major, Computer Science had a 6% admission rate. These
numbers provide a challenge for reading accurately in a tight admissions space and Berkeley will
be addressing that in coming admissions cycles.

Page 33
Finally, athletic admissions became a matter of concern to the faculty in 2013-14. The
admissions policy committee, which has been slowly revising athletic admissions policy, added
letters of recommendation as a requirement, but with the knowledge that a much more thorough-
going revision of athletic admissions is in the works.
Davis
UC Davis completed its third year of a single score holistic review (HR) freshman process,
which was first implemented for the 2012 incoming cohort after transitioning from a two-stage,
formulaic, process that had been used the previous ten years. The campus continues to be
enthusiastic about the merits of holistic review and the individualized assessment through a
human read of all applications taking into account the 14 faculty-approved academic and non-
academic factors. All factors are considered in the context of opportunities available to the
student.
Each year, UC Davis works to create more efficient and effective processes, procedures, and
policies that enable a fair, thorough and high-quality comprehensive review in order to admit and
enroll a diverse, high-achieving freshman class. To ensure that all HR reads are of the highest
quality and normed appropriately for consistency, Undergraduate Admissions (UA) uses the UC
Davis Senate Committee on Admissions & Enrollment (CAE) guiding principles, as well as the
Guidelines for Implementation of University Policy on Undergraduate Admissions. Following
these guidelines, UC Davis Undergraduate Admissions incorporated new and enhanced tools and
processes, such as: detailed training manuals; an updated HR online profile; on-campus and off-
campus HR training and monitoring logistics; an HR reading certification and weekly norming
accountability system; the identification and training of HR Team Leaders who manage the daily
responsibilities, coaching and monitoring of their teams; the HR recruitment, screening,
selection, hiring and training of external readers; the implementation of a calibration and
reliability system; an import and export system to receive, utilize and share HR scores; the
implementation of the Augmented Review (AR) process; management of extensive quality and
control mechanisms; and the revamping, development, testing and production of new or refined
online reports and monitoring tools.
UC Davis continues to attract more applications each year through strategic recruitment efforts
from low income, first generation, Eligible in the Local Context (ELC), domestic and
international non-residents, and California resident students. The overall academic quality of the
UC Davis applicant and admitted pools was slightly higher than last year. The holistic review,
selection and admit processes allow for a more nuanced understanding of a student’s academic
and personal achievements in the context of his/her opportunities and life challenges, which is
one of several factors that have led to recent increases in our admitted and enrolled
underrepresented students. The proportion of admitted students who are first generation college
students, from low income families, or are from underrepresented minority groups all increased
this year. The largest increase, from 18% of the admitted class in 2013 to 19.6% in 2014, was
among Chicano-Latino students.
Irvine
UCI has implemented single-score Holistic Review for the past four admissions cycles. In
general, UCI found that holistic review has increased inclusiveness, flexibility, and efficiency.
Holistic review allows the campus to consider the entire application within the context of all

Page 34
information provided by and about the applicant. In comparison, previous review procedures
may have overly penalized applicants who were somewhat deficient in one or two areas, but
exhibited extraordinary achievements in others. It helps meet the campus’s goal to not
disadvantage strong students from any group (low income, middle class, or financially-
successful; educated parents or first-generation college) due to circumstances beyond their
control. In addition, the Supplemental Review process allows readers to submit applications they
believe to be “competitive” and worthy of a second review by one of the specially trained
internal readers.
The total number of applications to UCI increased (up 11% in 2012-13, 10% in 2013-14) on top
of a longer-term trend of an increased number of applicants to UCI, which continues to lead
Irvine to become more selective in admissions. Applicant GPAs have increased, SAT scores
have trended slightly up, and first generation college applicants are flat, while and low income
applicants have trended slightly down. Students who were in the top 9% in both ELC and
statewide categories fared exceptionally well as a cohort.
Los Angeles
UCLA Undergraduate Admission engages in a holistic approach to comprehensive review,
giving a rigorous, individualized, and qualitative assessment of each applicant’s entire dossier.
This ensures that academic reviews are based on a wide range of criteria approved through
Comprehensive Review including classroom performance, motivation to seek challenges, and the
rigor of the curriculum within the context of high school opportunities. Moreover, academic
achievement should not be the sole criterion for admission, as UCLA seeks well-rounded
students whose qualifications include outstanding personal accomplishments, distinctive talents,
and the potential to make significant contributions to the campus, the state of California, and the
nation. The admission review reflects the readers’ thoughtful consideration of the full spectrum
of the applicant’s qualifications, based on all evidence provided in the application, and viewed in
the context of the applicant’s academic and personal circumstances and the overall strength of
the UCLA applicant pool. In holistic review, no single criterion should be given undue weight,
nor a narrow set of criteria used to assess applicants in their selection for admission.
All applications are reviewed at least twice by professionally trained readers. After
independently reading and analyzing an application, the reader determines a holistic score that is
ultimately used in the selection process. In addition, admission managers conduct multiple
quality-control checks for consistency and completeness throughout the reading process.
Extensive reader training, full review of each application, and these quality control checks ensure
that the process is highly reliable and consistent with faculty policy. Formal tests of reliability
are conducted regularly to assure quality control.
While considered best practice within the higher ed community, holistic review is labor-intensive
and time-consuming. UCLA is fortunate to have extensive school and curriculum information
available for California high schools (API, available curriculum, California Dept. of Education
data, etc.), but continues to be challenged by a lack of similar information from schools
throughout the US and abroad. Reading international applications requires additional expertise
from staff, making the reading load challenging for those trained to read these applications. Their
job is made more challenging by a lack of helpful school-related information. UCLA’s hope is
that UC continues to develop ways to collect and share critical high school information to better

Page 35
inform the review process and continue to demonstrate the Compare Favorably standard
approved by BOARS and required for students admitted from outside of California.
In May 2012, UCLA released a report on Holistic Review in Freshman Admissions
26
authored
by UCLA Professor Robert Mare, which examined fall 2007 and 2008 holistic outcomes. The
report found that holistic scoring at UCLA is proceeding according to the criteria set by the
UCLA Admissions Committee. In summarizing his detailed and nuanced report regarding the
UCLA admission process, Professor Mare concluded, “Academic achievement and other
personal qualities that contribute to a stimulating, diverse campus environment govern holistic
ranking.” In May 2014, Professor Mare provided an update to his report, extending his analysis
to include admissions data from 2009 to 2011. Mare reported no significant variance from his
original findings. As Mare affirmed, " Grades in high school, weighted for honors and advanced
placement classes and measured relative to the local applicant pool, and standardized test scores
have the largest impact upon holistic ranking…other factors, such as whether an applicant has an
impressive profile of extracurricular activities, shows involvement in the high school or local
community, or works outside of school either in a way that is academically enriching or that
contributes to family finances, all contribute to favorable holistic ranking.”
Merced
UC Merced’s admission selection polices as of Cycle 2014 continue to remain fluid, as we work
with statisticians and our faculty admissions committee to refine the formula and human read
scoring matrix, to meet systemwide objectives and local enrollment goals. The Merced
comprehensive review model is based on the 14 criteria approved by BOARS, incorporating
relevant academic factors (75%) together with socioeconomic factors, school context, and a
human read score (25%).
For the 2014 applicant pool, we made changes to our pilot model with the goals of: (1)
strengthening our experience in applying a point driven comprehensive review to all applicants
and a human read score for a broader range of the pool. (2) fine-tuning our scoring matrix as we
learn more about the applicant pool and the effect of those scores in recent outcomes; (3)
improving procedures, training, and norming sessions for the staff; (4) enhancing the
effectiveness of making greater use of available applicant data in the selection process (e.g.,
elements related to the students’ extra activities, challenges, strengths of character, work or
volunteer experiences, and context of the learning environment); (5) ensuring that any applicants
who were denied received a full comprehensive review prior to denial; and (6) ensuring that no
particular demographic group was disproportionately impacted by practices implemented.
We followed the guidance of BOARS which allows admission of students from the full range of
applicants who meet requirements, and selected for the fall those applicants with the highest
comprehensive review scores and an augmented review for those at the margins. This approach
seems effective given the level of required selectivity (based on demand and capacity), the
current volume of applicants, and the available admissions staff. The staff met weekly to discuss
the review process, discussed difficult decisions in detail, achieved consensus on scores, and
referred some applicants for Admission by Exception review.
26
http://www.senate.ucla.edu/committees/cuars/HolisitcReviewReport.htm

Page 36
Overall, the process was successful. All applicants (100%) received a formula driven
comprehensive review. Sixty-nine percent (69%) of the qualified candidates received a formula
and human read. Another 16% of the total applicants that were reviewed by staff and determined
to not meet admission requirements therefore they did not receive a human read score. In all,
85% of the applicants were reviewed by a staff member. The top 15% were reviewed and
selected solely on the formula driven score. Highlights include the implementation of a process
that enabled us to effectively move through our current, early stage of selectivity and while we
admitted fewer students, no population was disproportionately impacted. We will continue to
work with our faculty to further adjust the values on the review factors and process as we
proceed in selection for the fall 2015.
Riverside
UCR is currently in the process of evaluating different methods for a holistic review process,
including modification of the current comprehensive review score and moving to single score
system such as that used at our sister campuses. The admissions rate at UCR has been steadily
decreasing over the past 5 years. In 2014, we admitted 57.4% of resident applicants (admit rate
was 60.2% in 2013), while the number of residents admitted has remained relatively static. The
academic senate appointed admissions committee feels that the current system, as we become
more selective, may not identify some of the more diverse, well-rounded students who will excel
not just as undergraduates but after graduation as well. We believe that a more holistic approach
is the key to identifying these students, as it allows us to identify students with the ability to
perform at a high academic level, while balancing multiple activities, which is viewed as a
positive prognosticator of success in a rigorous university curriculum.
UCR is committed to modifying our current admissions policy which currently is based
primarily on High School GPA (weighted/capped) and SAT/ACT test score, with additional
“bumps” given for number of AP/IB courses taken, first-generation designation and low-income
designation to include the following non-cognitive factors:
• Leadership/Group Contributions (examples include team captains, student government
position, community leadership positions)
•
Knowledge in a specific field/creativity (can include demonstrated dedication to a
specific pursuit (e.g. music, art, writing, engineering, etc, particularly as recognized by
honors or awards)
• Dealing with adversity/discrimination
• Community service
• Goals/task commitment (including such things as holding a job, playing a team sport,
dedicated participation in band or choir, special projects).
Implementing such a change requires considerable research into how such factors can be
efficiently and fairly quantified based on the current application packet. A set of marginal
applications from the 2012-2013 pools is currently being evaluated by our Holistic Admissions
Subcommittee to determine whether incorporating these factors is feasible based on the
information provided on the standardized application form. Statistical analysis based on the 1
st
year performance of these students will then be done to determine whether high performing
students are better identified by incorporating these additional factors. The biggest impediment
to incorporating proposed factors is determining how much they should be weighted and how the
weight shall be given from the information in the application. Finally, the relative weights of

Page 37
GPA and SAT will need to be adjusted to accommodate additional factors. Our planned timeline
is to have a proposal submitted to our executive council by Spring of 2015. We anticipate that we
would be able to implement the new model for the 2017 school year.
Santa Barbara
The UCSB Comprehensive Review process consists of two parts, the Academic Preparation
Review (APR) and the Academic Promise Review (PPR). In the Academic Preparation Review,
freshman applicants are reviewed on the basis of academic criteria and awarded points based on
their standing within the entire pool of applicants. This academic review identifies applicants
with the strongest preparation and performance. In the Academic Promise Review, applicants are
then reviewed for curricular, co-curricular, or experiential skills, knowledge, and abilities which,
when coupled with the Academic Preparation Review and a socio-economic assessment based on
multiple factors, provide a comprehensive view of an applicant’s potential for success at UCSB.
This comprehensive approach incorporates a number of features that do not lend themselves to
precise and highly calibrated measurement. A comprehensive assessment of an applicant’s
academic preparation and personal qualities is considered to be a better measure of an applicant's
ability to contribute to and to benefit from a UC education, thereby enhancing the quality of the
freshman class.
The Committee on Admissions, Enrollment, and Relations with Schools (CAERS) adopted the
following characteristics as valued in the selection of the freshmen class.
• Response to Challenges, Special Circumstances, Hardships, Persistence
• Leadership, Initiative, Service, and Motivation
• Diversity of Cultural and Social Experience
• Honors, Awards, Special Projects, and Talents
• Intellectual and Creative Engagement and Vitality
The last characteristic, “Intellectual and Creative Engagement and Vitality” was a modification
made to the Comprehensive Review process in the fall 2013 review process and is the only
substantial change since the BOARS 2012 Report on Comprehensive Review. As stated in the
2012 report, “UCSB has not implemented a holistic review procedure because it has consistently
been meeting campus and systemwide goals.” The academic profile of the incoming freshman
class as measured by GPA and test scores has consistently increased. At the same time, the
campus has succeeded in achieving the goal of greater ethnic diversity among the student body.
Per the 2012 BOARS report, “The Comprehensive Review at UCSB is based on a blended
system combining points from academic indicators with points from an individualized review as
follows: half on GPA and test scores, one quarter on other indications of academic promise given
by the read, and one quarter on socio-economic criteria. Readers undergo extensive training (30
hours) to read files and rate student achievement in context of opportunity, employing
quantitative data about the socioeconomic circumstances of each case and using all information
regarding student activities. CAERS has identified four characteristics that readers should seek
evidence for during the read: challenges, special circumstances, hardships, and persistence;
leadership, initiative, service, and motivation; diversity of intellectual and social experience; and
honors, awards, special projects, talents, creativity, and intellectual vitality. Additional files are
flagged for supplemental review if the student appears ineligible but demonstrates special talents,

Page 38
were home-schooled or attended an unaccredited high school, missed a test, or had a high
individualized review score. The eligibility check has helped identify students who could be
contacted and become eligible for admission.”
UCSB admitted 73% of fall 2014 applicants designated as ELC (as compared to 79% in 2012).
UCSB continues to use a unique school context process that compares California applicants only
to other applicants from the same high school, and admits the top applicants from each school in
numbers equal to 3% of the size of the graduating class. With the arrival of the fall 2014
freshman class, UC Santa Barbara has reached the necessary milestones required for Hispanic
Serving Institution status and will become the first member of the Association of American
Universities (AAU) to reach this distinction.
Santa Cruz
UC Santa Cruz continues to utilize Holistic Review, implemented on our campus in 2012.
Holistic review uses multiple measures to assess whether potential students exhibit the qualities
necessary to succeed academically and graduate in a timely fashion as well as demonstrate the
promise of making a positive contribution to the UCSC community. The holistic approach
employs a thorough review of each application by professionally trained readers who determine
a single score that is reflective of an applicant’s full spectrum of achievement, viewed in the
context of his/her academic and personal opportunities. The consideration of additional profile
information for each applicant provides a greater opportunity for readers to consider a more
complete set of indicators of academic excellence and promise, and to account for outstanding
achievement in specific areas.
For fall 2014 selection, the Committee on Admissions and Financial Aid (CAFA) has made
several updates to the Holistic Review scoring rubric to ensure that the incoming student body
remains diverse and well-prepared academically. UC Santa Cruz saw a 5.4% increase in
applications from frosh applicants. Of the 40,713 fall 2014 frosh applications, increases were
seen in several underrepresented categories: African-American applications increased by 5.1%,
Hispanic applications increased by 3.2%, and American Indian applications increased by 15.6%
over the previous year.
Frosh SIRs (Statement of Intent to Register) totaled 4,952, an increase of 1,075 students, up
27.7%. While some increase was expected, the increase of 18.7% California resident SIRs was
greater than anticipated. Transfer SIRs totaled 1,377, an increase of almost 10% from the
previous year.
UCSC admitted 23,242 frosh for fall 2014, an increase over the previous year of 3,202 students.
Given the increase in applications and an increased enrollment target, the admission rate for the
frosh increased from 51.9% for fall 2013 to 57.1% for fall 2014. The academic quality of the
admitted frosh cohorts was similar (across GPA and SAT scores). Given the higher than
expected yield on frosh SIRs, no students from the fall 2014 waitlist were offered admission.
For fall 2015, UC Santa Cruz will discontinue using scores from UC Berkeley and UC Los
Angeles. UC Santa Cruz readers will score all applicants. CAFA instituted new policy which
requires that some applications will receive a second read. This adjudication review is intended
to guarantee the academic quality of our students and overall scoring consistency. Tiebreak from

Page 39
within Holistic Scoring bands will be determined using a student success indicator (SSI), which
is modeled to prioritize predicted first year success of our admits. This tiebreak metric will only
be applied to applicants who have already received a Holistic Review, which has taken into
account the context of their academic performance.
San Diego
Fall 2013 represents the third year of Holistic Review Single-Score implementation. With nearly
an 11% increase in applications (67,394 vs. 60,785), there were concerns regarding the ability to
successfully complete the reading process in a timely fashion. Fortunately, a very skilled cadre of
140 external readers were hired and trained prior to the application filing period. In addition,
steps were taken to enhance the online holistic review tool, and greater utilization of the shared
scores from UCLA enabled the campus to meet the admission release deadline of mid-March.
All readers are assigned to resource team leaders who monitor the reading process, follow-up
with readers if there are problems, and serve as a valuable resource throughout the process. Files
are read by two independent readers. A team of senior Admissions staff resolve any third read
scores which may be generated. The third read rate is approximately 3%. The campus was able
to admit approximately 37% of the applicant pool.
There are also multiple internal processes designed to ensure quality control and to identify
populations for the “by school” and supplemental review processes. During the summer of 2012,
a taskforce comprised of members from the Committee on Admissions (COA) along with
Admissions Office staff conducted extensive analysis to determine how to further refine the
single-score review process to ensure that the admitted class reflects campus values of access and
excellence. Such factors include ELC (84.7%); low to medium low-income background (33.9%);
and first-generation college attendance (20.2%). These factors were used as tie-breakers.
The growing international applicant pool requires specialized training for key Admissions Office
staff. These applications are not assigned to external readers due to the specialized nature of
schooling and the unique educational environments. Therefore, the international specialists team
was expanded in order to ensure that these files were read in a timely manner. When comparing
fall 2012 vs. 2013, there was a 47% increase in international applications. In addition to
increasing the number of internal staff reading international applications, the specialized scoring
tool was redesigned.
At this time, the Admissions staff has continued to improve internal processes, recruit and train
external readers, and reassign personnel to handle the increased growth in applications. Campus
leadership has provided the additional resources to support the holistic review process. However,
with current campus discussions regarding proposed changes to the transfer admission review
process, and the continued growth of the applicant pool, there are increasing concerns regarding
whether the current staffing level can continue to absorb the extra workload without
compromising quality.
III.2 Score Sharing and Collaboration
After the Regents’ adopted their Resolution on Individualized Review and Holistic Evaluation in
Undergraduate Admissions, BOARS adopted a policy that all campuses should share scores with

Page 40
all other campuses openly. Although some had expressed hope that score sharing might increase
the efficiency of admission processing to the extent that it would be possible to implement a
single systemwide UC score, BOARS found little evidence that score sharing can be used in this
way. BOARS found that a single systemwide score is unworkable due to the differences in
culture, selectivity, and scoring methodologies on each campus. However, campuses continue to
find value in score sharing.
UC San Diego continues to receive holistic-review scores from UCLA, UCB, UCI and UCD but
uses scores from only UCLA and UCB in their holistic-review process, because of a significant
overlap in applications with these institutions (representing between 60% and 70% of the UCSD
applicant pool). UC Irvine also continues to use scores from UCLA and UCB in evaluating
applicants for freshman admission. In the past, UC Davis used holistic-review (HR) scores
received from UCLA in determining locally derived HR scores. UC Davis has since chosen to
rely instead entirely on local readers to determine HR scores.
UC Santa Barbara uses scores from UCLA and UCB in yield analysis but not in evaluating
applicants for freshman admission. The scores are used specifically in predicting whether or not
a given applicant will be admitted (based on historical data) and then matching this prediction
against the actual admission outcome based on the internal UCSB review process. The overlap of
admissions decisions with those of UCLA and UCB determined in this way helps to inform the
overall number that can be admitted at UCSB. The higher the overlap of admits, the more
applicants UCSB will have to admit in order to yield the targeted number of matriculates.
SECTION IV: THE FUTURE OF UC’S MASTER PLAN COMMITMENT & REFERRAL
Section C(4) of Regents Policy 2103 states: “Freshman applicants deemed Eligible in the
Statewide Context or Eligible in the Local Context who are not admitted to any campus where
they apply will be offered admission at a UC campus with available space.” To this point, there
has always been at least one campus with available space. However, as the number of
applications increases and UC Merced matures into a more selective campus, it is clear that this
will not be the case indefinitely.
California resident applicants who were identified as being eligible either in the statewide or
local context, but were not offered admission to a UC campus to which they applied constitute
the “referral pool”. In 2014, the total referral pool, from both public and private California high
schools, numbered 11,183
27
. These eligible applicants were offered the chance to consider
referral admission at UC Merced, and in the end 239 (2.1% of the total pool) submitted an SIR.
One of BOARS’s most significant concerns going forward is that the University will soon have
no campus with available space, which throws into question its historical ability to offer
admission to all eligible applicants. The University of California must address this quickly.
Section D of Regents Policy 2103 points to a possible avenue for action by stating:
27
http://www.ucop.edu/news/factsheets/2014/frosh_trsirs_table1.1.pdf

Page 41
D(1) The Academic Senate, through its Board of Admissions and Relations with Schools
(BOARS) will evaluate and report annually and at five-year intervals on the academic and fiscal
impact of this policy; and
D(2) Based on the results of these ongoing studies, the Academic Senate should periodically
consider recommending adjustments to the guarantee structure.
BOARS has viewed eligibility as an important element of the overall admissions process, and is
hesitant to recommend adjustments that would alter it in a significant way. However, BOARS
will continue to examine all options, from technical adjustments to structural changes to address
the fact that in the near future, capacity will limit the University’s ability to accommodate all
eligible students.
S
ECTION V: IMPLEMENTATION OF TRANSFER POLICIES & INITIATIVES
Over the past two years, BOARS has helped lead UC’s response to a range of issues and
concerns about community college transfer. BOARS strongly supports the transfer path and is
committed to policies that help clarify the transfer process for California Community College
(CCC) students interested in UC and that improve their preparation for UC-level work.
BOARS’ recent efforts in the area of transfer admission are summarized below.
• Comprehensive Review Criteria for Transfers
In December 2013, BOARS added a new comprehensive review criterion for transfer students to
the Guidelines for Implementation of University Policy on Undergraduate Admission. The new
criterion #5 recognizes students who are on track to complete an associate of arts or science
transfer degree offered by a California community college. The language will help put into
operation the new transfer pathway in Senate Regulation 476 and ensure that admissions staff
value the degrees appropriately when they are selecting applicants.
• Implementation of Transfer Policy
In June 2012, the Senate approved a new transfer admissions policy
28
that took effect in fall
2014 for fall 2015 admissions. UC transfer applicants from CCCs will be entitled to a
comprehensive admissions review (though not guaranteed admission) if they complete (1) an
“SB 1440” Associate of Arts or Associate of Science Degree for Transfer from a CCC in the
relevant major or (2) a UC Transfer Curriculum in the relevant major, with a minimum GPA set
by each campus; or (3) the current pathway specified in Senate Regulation 476 C. BOARS has
been working with the campuses to ensure they are implementing the policy. BOARS
confirmed that departments and programs are taking steps to review existing lower-division
transfer requirements in light of the systemwide UC Transfer Preparation Paths and the relevant
CSU/ CCC Transfer Model Curricula, to develop a UC Transfer Curriculum for appropriate
majors that identifies the appropriate lower division major preparation for that program, and to
examine the extent to which majors are aligning lower division major preparation requirements
across campuses and with the corresponding TMCs.
28
http://www.universityofcalifornia.edu/senate/reports/RMA_LP_SakakireSR476Camendments_FINAL.pdf

Page 42
• Universitylink
In November 2013, BOARS approved Universitylink, a UC San Diego program that gives
transfer admission preference to low-income transfer students at nine designated San Diego area
community colleges who fulfill specific academic requirements. The program responds to the
reality that some community college students, especially low income students, view their local
UC as the only viable transfer option due to work or family obligations that tie them to a
community.
• IGETC for STEM Majors
In June 2013, the Assembly approved BOARS’ revisions to Senate Regulation 478 governing
the Intersegmental General Education Transfer Curriculum (IGETC). The revision introduces a
new “IGETC for STEM Majors” option. The revision is needed to implement the new transfer
admissions policy because IGETC for STEM Majors, unlike “partial IGETC,” will be a variant
of IGETC and conform to the provision in SB 1440 mandating that the new Transfer AA/AS
degrees from CCCs include IGETC or CSU Breadth. Under IGETC for STEM Majors, transfer
student intending to enter STEM majors may complete up to three of the IGETC sequence
courses within one year after transfer, but only in the areas of Arts and Humanities, Social and
Behavioral Science, or Foreign Language, and at most one course may be completed in each
area. The revision also makes clear that “partial IGETC” allows any transfer to complete up to
two of the IGETC courses after transfer with the exception of English Composition, Critical
Thinking, or Mathematics/ Quantitative Reasoning.
• Math Preparation
In July 2013, BOARS approved a revision to the Transferrable Course Agreement (TCA)
Guidelines clarifying the faculty’s expectations for the math competency of UC transfer students
and the content of courses that fulfill the quantitative requirement for transfer admission.
BOARS’ Statement on Basic Math for All Admitted UC Students
29
articulates its position.
Community College faculty had asked UC to take a more explicit stance on a UC policy
requiring transfers to complete a one-semester quantitative reasoning (mathematics or statistics)
course with Intermediate Algebra “or its equivalent” as a pre-requisite, in the context of
alternative pathways designed to help non-STEM majors who struggle with Intermediate
Algebra successfully complete a transferable course that fulfills the quantitative reasoning
requirement. BOARS voted in favor of maintaining the requirement for an intermediate algebra
pre-requisite, but replaced the qualifier “or its equivalent” with a statement defining the
prerequisite in terms of the Common Core State Standards for Mathematics. The statement is not
intended to encourage or discourage alternative pathways, but to ensure that the content of
quantitative UC-transferrable courses is linked to college readiness standards of the Common
Core State Standards for Mathematics (CCSSM).
S
ECTION VI: CONCLUSIONS AND RECOMMENDATIONS
CONCLUSIONS
BOARS has reviewed application, admission, and yield outcomes under comprehensive review
for the years 2012-2014, as well as the ongoing implementation of the freshman admission
29
http://senate.universityofcalifornia.edu/committees/boars/BOARSStatementonBasicMath.pdf
Page 43
policy adopted in 2009 and the Regents’ 2011 Resolution on Individualized Review and Holistic
Evaluation. BOARS finds that together, these innovative policies have helped increase
opportunity, excellence, and fairness, eliminated unnecessary barriers to admission, allowed
campuses to select from a larger and more diverse pool of students, and strengthened the
university’s position as an engine of social mobility in the state. Demand for a UC education
continues to grow, and UC continues to meet its Master Plan obligation to California residents,
even as UC becomes an increasingly selective institution and campuses expand efforts to recruit
higher-tuition-paying nonresidents in response to a budget crisis that saw UC’s state funding fall
by nearly $1 billion.
Many of BOARS’ goals for comprehensive review and the new 9x9 policy are being met. Under
the new policy, campuses are selecting students who are better prepared for UC, more likely to
come from underrepresented minority (URM) groups, and once admitted perform well
academically and persist to graduation at very high rates. The two categories of eligibility (ETR
and ELC-only) that were created or expanded by the new policy have helped expand access to
more first-generation college and URM students and students from under-resourced high
schools. In 2014, UC offered freshman admission to more California resident Chicano/Latino
students than any other group for the first time, reflecting the state’s shifting demographics. At
the same time, the number of African-American admits and SIRs decreased, suggesting the need
for new targeted efforts to increase yield rates and outreach to specific communities.
The transfer path to UC from the California Community Colleges (CCC) continues to be popular
and robust, but after three years of declining transfer applications and concerns about the
complexity of the process, BOARS has increased its focus on policies that help clarify the
transfer path for CCC students interested in UC and improve their preparation for UC-level
work.
Although nonresidents are far less likely to accept an admission offer, they represent an
increasing percentage of application and admission growth. BOARS is satisfied that campuses
are meeting its compare favorably standard for nonresident admission and will continue to
monitor campus practices and outcomes to ensure that California residents remain the first
priority in the admission process.
Budget and space pressures and the continued viability of the referral pool are looming
challenges with implications for admissions and UC’s ability to meet the Master Plan. The 9x9
policy has significantly overshot its original 10% target for admission guarantees. For fall 2014,
UC offered admission to 12.9% of all California public high school graduates who met one or
both of the 9x9 guarantees, resulting in a larger than expected referral-pool. BOARS has taken
steps to address the problem by recalibrating the statewide admissions index used to identify the
top nine percent of California public high school graduates. The referral process, with the
guarantee of admission to at least one UC campus for all eligible applicants, is still Regents
policy. While the referral guarantee is not important to most high school students, who are
primarily concerned about whether they are admitted to the UC campus of their choice, some do
value the guarantee, and BOARS considers it an important promise to Californians. And
although Merced is currently able to accommodate the full yield from the referral pool, space and
budget constraints at UC campuses make its long-term future less clear.

Page 44
BOARS will continue to monitor outcomes and work toward solutions that minimize the referral
pool but maintain the eligibility construct. BOARS looks forward to working with campuses,
UCOP, and the Regents to ensure that UC admissions policies and practices continue to meet our
collective goals and maintain UC’s status as the best public university system in the world.
RECOMMENDATIONS
1. Considering that yield rates for African Americans and American Indians have been
consistently below average in past years, in comparison with systemwide yield rates,
efforts at increasing the yield rates for these groups may prove worthwhile in increasing
their enrollment numbers and should be encouraged.
2. As UC Merced becomes increasingly selective, it will become more difficult for UC to
accommodate its Master Plan commitment to provide guaranteed admission to all eligible
UC applicants. Sustaining this commitment may require BOARS to consider more
substantial adjustments to the eligibility construct or the referral guarantee. In studying a
variety of approaches, BOARS will carefully assess the potential impact on the applicant,
admit and matriculate pools and will be vigilant to maintain the University’s commitment
to the Master Plan.
Respectfully submitted,
Ralph Aldredge, Chair (D)
Vickie Scott (SB)
Henry Sanchez, Vice Chair (SF)
Minghui Hu (SC)
Richard Rhodes (B)
Charles Thorpe (SD)
Rena Zieve (D)
Fernando Echeverria, Undergraduate (LA)
Gilbert Gonzalez (I)
Mary Gilly, ex officio
Kathleen Lytle-Hernandez (LA)
J. Daniel Hare, ex officio
Christopher Viney (M)
Michael LaBriola, Committee Analyst
Kathryn DeFea (R)
ACKNOWLEDGEMENTS
BOARS collaborated closely with UCOP and benefited from regular consultations with Vice
President for Student Affairs Judy Sakaki, Associate Vice President for Undergraduate
Admissions Stephen Handel, and Director of Undergraduate Admissions Michael Treviño, who
updated BOARS about application, admissions, and SIR outcomes; transfer policies, initiatives,
and legislation; the President’s Supporting Undocumented Students initiative; meetings with
student groups; community outreach; admissions messaging; feedback from counselor
conferences; campus-based concerns; and other issues. Associate Vice President Handel and
Director Treviño also worked closely with the Data Analysis Subcommittee. Associate Director
Monica Lin attended each meeting, worked closely with the A&E Subcommittee, and briefed
BOARS on high-school ‘a-g’ course certification issues, the UC Curriculum Integration
Institutes, Smarter Balanced Assessment Consortium, and other topics. BOARS also received
valuable support and advice from Institutional Research Coordinator Tongshan Chang, who
provided the committee with critical analyses, Admissions Policy Coordinator Adam Parker,
Institutional Research Analyst Allison Cantwell and Student Affairs Coordinator Liz Tamayo.
