Support for this study was provided by Apple.
The conclusions and opinions expressed are exclusively those of the authors.
The Continued Growth and Resilience
of Apple’s App Store Ecosystem
Juliee Caminade, Ph.D.
Jonathan Borck, Ph.D.
May 2023

The Continued Growth and Resilience of Apple’s App Store Ecosystem
1
The App Store ecosystem: 2022 at a glance
The App Store ecosystem facilitated a groundbreaking $1.1 trillion in billings and sales worldwide in 2022. More than 90%
of this figure originated from transactions that did not happen through the App Store, meaning that these amounts
accrued solely to developers and other third parties, and that Apple collected no commission on them.
Over the past few years, through the ebbs and flows of the COVID-19 pandemic, the App Store ecosystem grew at a
substantial and remarkably steady rate (between 27% and 29% annually), consistent with a flourishing marketplace.
This steady overall growth hides important variations within app categories that reflect consumers’ changing habits as
the pandemic evolved. For example, some categories grew substantially in 2022 as many people returned to in-person
activities, with travel (up 84%) and ride hailing services (up 45%) leading the way. Other categories, such as grocery sales,
food delivery, and digital goods and services consumed on iOS apps, grew more modestly in 2022 aer booming at the
height of the pandemic. In-app advertising on iOS apps grew at a faster pace in 2022 than 2021, driven by the strong
performance of social media, podcasts, and general retail apps.
Variations across regions were also notable, with a number of factors at play in certain regions in a challenging global
economic environment: Inflation, a stronger US dollar, and regulatory headwinds in the video game industry in China.
These factors should be considered when interpreting our global results and regional variations.
Fieen years of the App Store
The App Store has been a safe and secure home to a large and varied array of apps for 15 years. Users today have
access to over 123 times more apps than they did at the end of 2008, and annual downloads on the App Store
increased 15-fold between 2009 and 2022. Users have downloaded apps more than 370 billion times and developers
have earned more than $320 billion in earnings directly on the App Store since its launch. Over the past 15 years, the
App Store has supported new and growing sectors of the economy and has provided businesses with new ways to
engage with customers and lower costs.
Apple has implemented rules and policies, such as the strict App Review process, to foster user trust. These
policies have prevented billions of dollars in fraudulent transactions. Apple has also supported developers over
the past 15 years through a variety of technical tools, analytics, and education initiatives, all of which have helped
developers add new functionality to their apps, track their performance on the App Store, and receive support from
Apple experts.
$1.1
trillion
ecosystem in 2022
+29%
growth in the
ecosystem in 2022
+84%
in iOS-app-based
travel sales in 2022
+45%
in iOS-app-based
ride hailing sales in
2022

The Continued Growth and Resilience of Apple’s App Store Ecosystem
2
The App Store ecosystem
The App Store ecosystem globally in 2022
We estimate that the App Store ecosystem facilitated more than $1.1 trillion in billings
and sales worldwide in 2022, up from $868 billion in 2021, $643 billion in 2020, and $519
billion in 2019. Of that total, $104 billion, or 9%, originated from billings and sales of digital
goods and services consumed on iOS apps; $910 billion, or 81%, from sales of physical
goods and services made on iOS apps; and $109 billion, or 10%, from in-app advertising on
iOS devices. (See Table 1.)
Apple only collects a commission on app purchases, in-app purchases, and in-app
subscriptions that go through the App Store. No commission is collected on purchases
of digital goods and services that happen outside of apps (e.g., purchasing a subscription
to a newspaper through a web browser), on purchases of physical goods and services
through apps (e.g., when a user pays for a ride on a ride hailing app or buys groceries
online), or on in-app ad revenue. More than 90% of the $1.1 trillion in billings and sales
facilitated by the ecosystem occurred outside the App Store, meaning that these
amounts accrued solely to developers and other third parties and that Apple collected
no commission on them. The share of billings and sales that accrue solely to developers
has continued to increase year-to-year. (See Appendix Table 1 for further methodological
details.)
Table 1: Estimated Billings and Sales Facilitated by the App Store Ecosystem, Worldwide,
2019-2022 ($ Billion)*
2019 2020 2021 2022
Digital Goods and Services** $61 $86 $102 $104
Physical Goods and Services $413 $511 $678 $910
M-Commerce
General Retail $268 $383 $471 $621
Travel $57 $38 $56 $102
Food Delivery and Pickup $31 $36 $66 $77
Grocery $14 $22 $43 $52
Ride Hailing $40 $26 $33 $48
Digital Payment $4 $5 $9 $10
In-App Advertising*** $45 $46 $88 $109
Total $519 $643 $868 $1,123
* Totals may not sum due to rounding.
** Billings and sales from digital goods and services are not the same as App Store billings. We include sales from digital goods and services purchased elsewhere
but used on apps on Apple devices, and we subtract billings from in-app purchases made via the App Store but used elsewhere. The estimate relies on third-
party sources and Apple data. See Appendix for details.
*** iOS in-app ad revenue; does not include mobile web, search ads, and Apple Search ads.
In 2022, over
90%
of billings and
sales facilitated
by the ecosystem
occurred outside
the App Store.
Billings and Sales
“Billings” refers to app
purchases and in-app
purchases, including
subscriptions, which use
Apple's in-app payment.
“Sales” refers to money
spent by customers
purchasing goods and
services in general. We use
the term “facilitated” to
include the various ways
in which apps contribute
to generating billings and
sales.

The Continued Growth and Resilience of Apple’s App Store Ecosystem
3
As in previous years, most of the billings and sales facilitated by the App Store ecosystem
came from the sales of physical goods and services through iOS apps. Of those, general
retail remained the largest category by far. Two other categories jockeyed for the next
two spots: In 2021, food delivery and pickup temporarily surpassed travel as the second-
largest category, while in 2022, travel once again was number two, with $102 billion in sales
through the App Store. (See Figure 1.) The consistently high amount of sales of physical
goods and services demonstrates that the App Store ecosystem continues to provide
a trusted platform for developers to sell such products. For example, Apple Pay is an
important tool that supports developers in this segment: Apple Pay offers a standardized,
secure, and seamless way for customers to pay for physical goods and services in-app.
Figure 1: Estimated Billings and Sales Facilitated by the App Store Ecosystem by App
Category, 2019-2022 ($ Billion)*
Digital Goods and Services**
Physical Goods and Services
Digital Payment
Ride Hailing
Grocery
Food Delivery and Pickup
Travel
General Retail
In-App Advertising***
* Totals may not sum due to rounding.
** Billings and sales from digital goods and services are not the same as App Store billings.
*** iOS in-app ad revenue; does not include mobile web, search ads, and Apple Search ads.
$519
2019
$45
$57
$31
$40
$61
$14
$4
$268
$36
$86
$22
$5
$643
2020
$46
$38
$26
$383
$868
2021
$88
$38
$56
$66
$102
$43
$33
$9
$471
$1,123
2022
$109
$38
$102
$77
$104
$52
$48
$621
$10
Methodology
“iOS apps” include apps on
iPhone and iPad devices.
Apps developed by Apple,
such as Apple Music, as
well as mobile browser
apps, such as Google
Chrome, are excluded from
this analysis. Third-party
apps featured within Apple
TV are included in our
analysis of video streaming.
Categories as presented in
this report do not reflect
App Store categories.
In-App Ad Sales
Estimates of in-app ad
sales for iOS apps include
revenue generated
from the publishing of
advertisements within
apps only. Estimates do
not include advertising on
mobile web (such as on
mobile browser apps) or
search advertising, such as
Apple Search Ads.

The Continued Growth and Resilience of Apple’s App Store Ecosystem
4
Estimating the size of the App Store ecosystem
The direct monetization of apps represents a small fraction of the overall commerce
the App Store facilitates, because developers can monetize their apps in several
ways that do not involve payments through the App Store, such as:
1. Selling digital goods and services outside of the App Store for use within apps
on Apple devices (e.g., news and magazine subscriptions, music and video
streaming)
2. Selling physical goods and services through apps on Apple devices (e.g., food
and grocery delivery or ride hailing)
3. Offering ad-supported content within apps (e.g., ad-supported games)
While our analysis captures the major app monetization strategies, we do not capture
all of the ways in which the App Store ecosystem facilitates sales or all of the benefits
created by apps. For example, we do not include benefits that companies derive from
“companion apps” that raise the value of their goods and services, including smart
home apps (e.g., Nest, Ring) and health apps, among many others.
A complete description of our methodology is included in the Appendix.
To read about our estimates of billings and sales facilitated by the App Store in
2019 and 2020, please see our previous reports: How Large Is the Apple App Store
Ecosystem? and A Global Perspective on the Apple App Store Ecosystem.

The Continued Growth and Resilience of Apple’s App Store Ecosystem
5
Global trends (2019-2022)
The App Store ecosystem grew 27% between 2020 and 2021 and 29% between 2021 and
2022, in line with the 27% growth from 2019 to 2020.
1
Overall, such growth is a sign of a
flourishing marketplace, where apps innovate, grow, and compete.
i
Each of the three top-level ecosystem categories grew each year, but at somewhat
different rates. (See Table 2.) Specifically, iOS-app-based sales of physical goods and
services accelerated, growing 30% from 2020 to 2021 and 34% from 2021 to 2022. In-app
advertising in iOS apps continued to grow at high rates: Increasing 10% from 2020 to 2021
and 24% from 2021 to 2022.
The size of digital goods and services facilitated by the App Store grew by 19% from 2020
to 2021 before plateauing (up 2%) in 2022. These changes reflect a period of rapid growth
in 2020 as people shied to a more digital world during the pandemic, followed by a
gradual transition through 2022 to a new normal, with sustained higher levels of digital
billings and sales.
Digital goods and services: Within digital goods and services consumed on iOS apps,
we saw large increases in 2020 in enterprise, education, and fitness apps, following a
shi toward remote work, online schooling, and online fitness due to gym closures.
Enterprise apps have continued to grow in popularity since the pandemic, and in 2022
represented one of the fastest growing digital goods and services categories in our
ecosystem estimate of billings and sales, only behind app-based entertainment. In 2022,
business-oriented apps represented five of the top 25 most downloaded apps in the
US (Zoom, Microso Teams, Microso Outlook, Microso Intune Company Portal, and
Authenticator). Billings and sales continued to increase significantly for all categories
of digital goods and services in 2021 and then stabilized in 2022, as people had largely
adapted to remote and hybrid models of work and school, and were returning to in-person
activities in many regions of the world. Online dating services, for example, grew faster in
2021, as many people got vaccinated against COVID-19 and returned to in-person dating,
and continued to grow in 2022.
ii
One exception to the stabilization seen in other categories in 2022 was app-based
entertainment services, a category that includes live-streaming apps, horoscope apps,
and group chat apps, which saw the largest growth among digital goods and services
categories. One notable trend within app-based entertainment services is the growth of
apps supporting the creator economy in recent years; examples of these apps include live-
streaming apps Twitch and BIGO LIVE, and chatroom app Discord.
1 All changes in this report are calculated using the most current figures for 2019 and 2020. We updated some
of the estimates from our previous reports to account for (1) methodological improvements and refinements
developed over time, and (2) retroactive changes made by third-party data sources. We rely on the updated
numbers, rather than our original estimates, to calculate changes compared to 2019 and 2020, as they will more
accurately reflect underlying trends, rather than methodological improvements or updates in third-party data.
See Appendix for more details.
Mobile general
retail sales on
iOS apps have
increased by
64%
since 2020.
Billings and sales
of digital goods
and services
consumed on
iOS apps have
increased by
21%
since 2020.

The Continued Growth and Resilience of Apple’s App Store Ecosystem
6
Physical goods and services: Looking at iOS-app-based purchases of physical goods
and services, the consistent and substantial growth in 2021 and 2022 reflects multiple
factors: A continued shi to buying goods and services through apps – in particular, for
general retail, grocery, and travel; the dramatic growth of categories such as food delivery
and pickup, and grocery delivery; the strong recovery of categories negatively affected
by the pandemic, such as ride hailing and travel, following a return to in-person activities
as vaccines were rolled out and pandemic restrictions were relaxed in many countries
and regions in 2021 and throughout 2022; and global macroeconomic impacts, including
inflation in some regions, changing interest rates, and foreign exchange headwinds from a
strong US dollar.
The category that experienced the largest growth in both 2020 and 2021 was iOS-app-
based grocery sales.
2
The pandemic led many people to change their grocery shopping
habits, buying groceries online – particularly on their iPhone – using delivery services or
ordering ahead and picking them up at the store. These changes in habits were reflected
in 67% growth from 2019 to 2020 and 74% growth from 2020 to 2021. iOS-app-based
grocery sales stabilized in 2022, still increasing at a substantial rate of 20%, suggesting
that this shi in consumer habits is here to stay. For the second year in a row, iOS-app-
based grocery sales remained larger than ride hailing in the App Store ecosystem in 2022,
making it the fourth largest m-commerce category.
Similarly, owing to pandemic restrictions on indoor dining and changes in consumer
habits, sales of food delivery and pickup on iOS apps grew substantially throughout the
pandemic (up 40% and 41% in 2020 and 2021, respectively), and continued to grow in 2022
though at a somewhat more modest clip (up 17%). This strong growth led food delivery
and pickup to briefly become the second-largest m-commerce category in the App Store
ecosystem (behind general retail) in 2021 before returning to third (behind general retail
and travel) in 2022. The pandemic also continued to drive an increase in digital payments
in 2021 (up 59%, compared to 54% in 2020) as contactless payment methods replaced
cash, a shi that appears to reflect a longer-term change in payment methods (9% growth
in 2022).
2 Grocery refers to purchases of food and beverages for pickup or delivery from the online stores of large
supermarkets (e.g., Walmart), internet retailers (e.g., Amazon Fresh), dedicated grocery delivery services (e.g.,
Instacart), and subscription-based services (e.g., HelloFresh). Food delivery and pickup refers to orders of
prepared meals from restaurants directly or through platforms (e.g., JustEat) for direct consumption.
iOS-app-based
grocery sales
increased nearly
3.5x
since 2019.
iOS-app-based
food delivery
and pickup sales
increased nearly
2.3x
since 2019.
The Continued Growth and Resilience of Apple’s App Store Ecosystem
7
General retail sales on iOS apps – the largest m-commerce component of the ecosystem
– showed strong growth in 2021 (up 24%) and grew even more in 2022 (32%). This increase
in general retail was partially driven by an increase in the share of iOS device usage in
China,
iii
which has historically been the largest contributor to the general retail category.
As vaccines became available and pandemic restrictions were relaxed in 2021, travel and
ride hailing reversed their pandemic-related declines. These two categories grew 47% and
30%, respectively, in 2021, and an impressive 84% and 45% in 2022. iOS-app-based sales in
both categories in 2022 exceeded their pre-pandemic levels.
In-app advertising: Ad spend was substantially higher in 2022 compared to 2021. This was
consistent with broader macro trends in the ad space, which had a strong year overall
despite challenges from some individual players. The ad market saw strong growth for
certain short-video apps, retail (e.g., Amazon), and podcasts, driving the overall increase
in in-app advertising. The increase in iOS usage shares in China also drove some of this
growth.
Table 2: Yearly Changes in the App Store Ecosystem, Worldwide, 2019-2022
2019 to 2020 2020 to 2021 2021 to 2022
Digital Goods and Services*
,
** +41% +19% +2%
Physical Goods and Services +26% +30% +34%
M-Commerce
General Retail +42% +24% +32%
Travel -33% +47% +84%
Food Delivery and Pickup +40% +41% +17%
Grocery +67% +74% +20%
Ride Hailing -33% +30% +45%
Digital Payment +54% +59% +9%
In-App Advertising**
,
*** +23% +10% +24%
Total +27% +27% +29%
* Billings and sales from digital goods and services are not the same as App Store billings.
** Changes between both 2019 to 2020 and 2020 to 2021 are based on updated numbers. See Appendix for more details.
*** iOS in-app ad revenue; does not include mobile web, search ads, and Apple Search ads.

The Continued Growth and Resilience of Apple’s App Store Ecosystem
8
Regional dynamics on the App Store ecosystem
The App Store ecosystem by region in 2022
In 2022, roughly as in previous years, the US accounted for almost 25% of the billings and
sales facilitated by the App Store ecosystem, China
3
accounted for 51%, and Europe 11%.
Physical goods and services were the largest category in each region. (See Table 3, as well
as Appendix Table 2 for the analogous 2021 table.) Within physical goods and services,
general retail dominated in all regions, with slight differences in the ordering of the other
m-commerce subcategories.
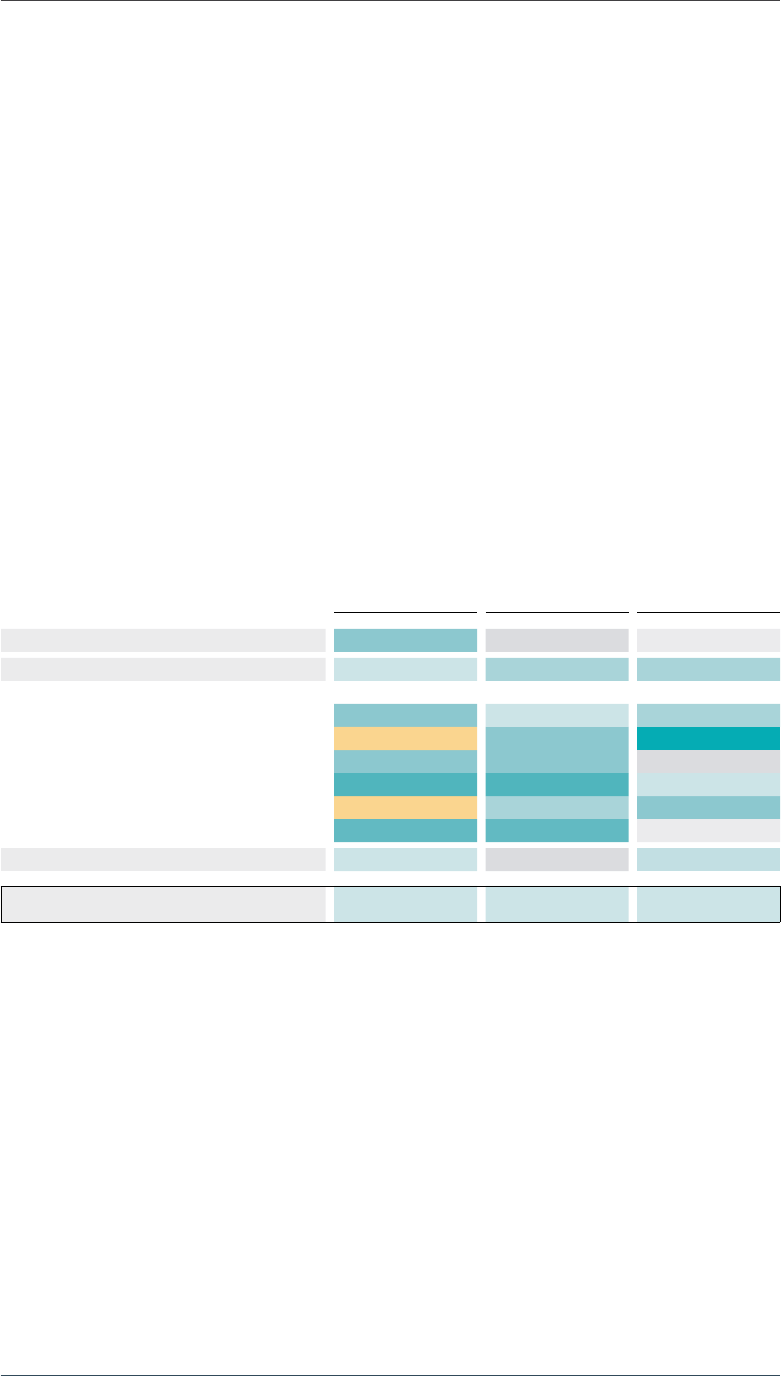
Table 3: Estimated Billings and Sales Facilitated by the App Store Ecosystem,
Large Regions, 2022 ($ Billion)*
US China Europe****
Rest of the
World Total
Digital Goods and Services** $41 $21 $11 $30 $104
Physical Goods and Services $182 $523 $93 $111 $910
M-Commerce
General Retail $96 $411 $51 $63 $621
Travel $27 $32 $21 $22 $102
Food Delivery and Pickup $21 $36 $9 $11 $77
Grocery $13 $25 $6 $8 $52
Ride Hailing $22 $14 $6 $6 $48
Digital Payment $4 $6 - - $10
In-App Advertising*** $50 $25 $15 $19 $109
Total $273 $570 $119 $160 $1,123
* Totals may not sum due to rounding.
** Billings and sales from digital goods and services are not the same as App Store billings.
*** iOS in-app ad revenue; does not include mobile web, search ads, and Apple Search ads.
**** Europe includes countries in Western, Central, and Eastern Europe (including the UK and the Nordic Region, not including Russia).
3 Throughout the report, China refers to Greater China.

The Continued Growth and Resilience of Apple’s App Store Ecosystem
9
The UK remained the largest contributor to the App Store ecosystem in Europe, in part
thanks to its large m-commerce sector and relatively high iOS market share. In most
countries, general retail, travel, and food delivery and pickup remained the three largest
subcategories within m-commerce. (Italy is an exception; see Table 4.)
Table 4: Estimated Billings and Sales Facilitated by the App Store Ecosystem,
Select European Countries, 2022 ($ Billion)*
UK Germany France Italy Spain
Digital Goods and Services** $3.2 $2.1 $1.3 $0.5 $0.3
Physical Goods and Services $40 $15 $8.9 $3.4 $3.4
M-Commerce
General Retail $23 $7.1 $5.4 $1.6 $1.7
Travel $6.3 $4.8 $2.1 $1.3 $1.2
Food Delivery and Pickup $5.1 $1.7 $0.5 $0.2 $0.2
Grocery $2.7 $0.7 $0.5 $0.3 $0.2
Ride Hailing $2.2 $0.5 $0.5 $0.1 $0.2
In-App Advertising*** $4.8 $2.1 $1.8 $0.9 $0.5
Total $48 $19 $12 $4.9 $4.2
* Totals may not sum due to rounding.
** Billings and sales from digital goods and services are not the same as App Store billings.
*** iOS in-app ad revenue; does not include mobile web, search ads, and Apple Search ads.
We find that general retail remained the largest stream of iOS-app-based sales in both
Japan and South Korea in 2022, while in Australia and New Zealand, travel became the
largest m-commerce category within physical goods and services, ahead of general retail.
Travel was the second largest category in Japan, while food delivery and pickup remained
the second largest category in South Korea. (See Table 5.)
Table 5: Estimated Billings and Sales Facilitated by the App Store Ecosystem,
Select Countries and Regions, 2022 ($ Billion)*
Japan South Korea
Australia and
New Zealand
Digital Goods and Services** $14 $1.8 $1.9
Physical Goods and Services $25 $26 $10
M-Commerce
General Retail $14 $17 $3.6
Travel $5.1 $2.6 $4.1
Food Delivery and Pickup $1.8 $4.5 $0.7
Grocery $3.4 $1.7 $0.9
Ride Hailing $0.7 $0.5 $1.2
In-App Advertising*** $7.1 $1.1 $2.1
Total $46 $29 $14
* Totals may not sum due to rounding.
** Billings and sales from digital goods and services are not the same as App Store billings.
*** iOS in-app ad revenue; does not include mobile web, search ads, and Apple Search ads.

The Continued Growth and Resilience of Apple’s App Store Ecosystem
10
Regional trends (2019-2022)
In the US, China, and Europe, billings and sales of digital goods and services facilitated
by the App Store ecosystem stabilized between 2021 and 2022 as categories that initially
grew during the onset of the pandemic plateaued in 2022, due in part to regulatory
headwinds in the video game industry in China.
iv
In 2021 and 2022, by contrast, iOS-app-
based sales of physical goods and services increased steadily in the US (up 26% and 20%),
while growth in China almost doubled due to an increase in the adoption of iOS relative to
Android (24% in 2021 compared to 52% in 2022). While the digital goods and services and
physical goods and services categories were stable in Europe between 2021 and 2022, this
is at least partially aributable to the strong US dollar compared to the euro and British
pound. In local currency, the eurozone grew comparably to the United States. Over the
longer, three-year time frame, the size of the ecosystem doubled in Europe and China and
grew by more than 80% in the US. (See Table 6.)
Table 6: Yearly Changes in the App Store Ecosystem, Large Regions, 2019-2022
US China Europe****
‘19 to ‘20 ‘20 to ‘21 ‘21 to ‘22 ‘19 to ‘20 ‘20 to ‘21 ‘21 to ‘22 ‘19 to ‘20 ‘20 to ‘21 ‘21 to ‘22
Digital Goods and Services*
,
** +51% +17% +7% +30% +18% +6% +44% +28% +1%
Physical Goods and Services** +26% +26% +20% +23% +24% +52% +54% +49% +2%
M-Commerce
General Retail +69% +15% +12% +30% +20% +50% +101% +41% -15%
Travel -37% +76% +54% -27% +7% +158% -33% +77% +79%
Food Delivery and Pickup +52% +24% +5% +4% +56% +37% +96% +50% -0%
Grocery +128% +77% +52% +65% +69% +21% +54% +88% +4%
Ride Hailing -41% +27% +32% -21% +8% +108% -13% +53% +18%
Digital Payment +186% +57% -9% +10% +60% +24% - - -
In-App Advertising**
,
*** +28% +4% +22% +19% +15% +49% +21% +22% +8%
Total +30% +20% +18% +23% +24% +50% +47% +43% +2%
* Billings and sales from digital goods and services are not the same as App Store billings.
** Changes from both 2019 to 2020 and 2020 to 2021 are based on updated numbers. See Appendix for more details.
*** iOS in-app ad revenue; does not include mobile web, search ads, and Apple Search ads.
**** Europe includes countries in Western, Central, and Eastern Europe (including the UK and the Nordic Region, not including Russia).

The Continued Growth and Resilience of Apple’s App Store Ecosystem
11
Between 2019 and 2022, the categories of iOS-app-based purchases of physical goods and
services saw large changes across regions.
Sustained increases in general retail, grocery, and food delivery categories in the US
and China; slower growth or decreases in Europe. In 2020, we saw large increases in the
general retail, grocery, and food delivery and pickup categories in the US and Europe, a
trend that continued in 2021 as more consumers used apps for purchases. Food delivery
apps such as DoorDash (US) and Deliveroo (Europe) expanded their reach.
v
Grocery
delivery startups such as Weee (US) are launching and growing as a result of these shis,
vi
and major grocery retailers such as Tesco (UK) are moving to in-app ordering. Some of
these trends slowed in 2022, particularly food delivery in both regions and general retail in
Europe.
In 2021, grocery and food delivery and pickup increased the most in China, with growth
rates of 69% and 56%, respectively. The lockdowns and strict quarantine measures in
China that followed the rise of new coronavirus variants and outbreaks were likely the
drivers of these changes.
vii
In 2022, the growth rates for grocery and food delivery remained
high (21% and 37%). (See Sidebar.)
iOS-app-based
general retail
sales increased
more than
2x
in all regions
since 2019.
iOS-app-based
grocery sales in
the US increased
6x
since 2019.
iOS-app-based
food delivery and
pickup sales in
Europe and China
increased more
than
2x
since 2019.
US
Europe
China
Rest of World
150
200
250
300
100
2019 2020 2021 2022
General Retail
200
300
400
600
500
100
2019 2020 2021 2022
Grocery
150
200
250
300
100
2019 2020 2021 2022
Food Delivery and Pickup
The above figures show sales
between 2019 and 2022, indexed on
2019 (i.e., 2019=100). The underlying
data behind sales of physical
goods and services categories were
retroactively updated from previous
reports. Figures are produced based
on updated numbers for 2019 and
2020.
Categories with Sustained
Increases in Sales,
2019-2022

The Continued Growth and Resilience of Apple’s App Store Ecosystem
12
A continuing rebound in travel and ride hailing. The travel and ride hailing categories
declined in all major regions in 2020, as mobility and tourism halted worldwide. In 2021,
these categories rebounded in the US and Europe, with both categories rising above pre-
pandemic levels in Europe. China followed suit in 2022, reflecting the differing impact of
the pandemic and restrictions on travel in different regions. The increase in travel-related
in-app spend reflects the changing consumer m-commerce trends towards one-stop-
shop convenience. Major airlines now have dedicated apps to help plan and book travel.
In 2022, travel was well above pre-pandemic levels in all regions; ride hailing was as well,
except in the US, where it was back to its pre-pandemic level. (See Sidebar.)
A rebound in in-app ad revenue in the US and China. In-app advertising revenue was
substantially higher in both the US and China in 2022 compared to 2021 (up 22% in the
US in 2022 compared to 4% in 2021, 49% in China in 2022 compared to 15% in 2021). This
growth was driven by ad spend in non-gaming apps such as video apps, retail apps, and
podcasts.
Looking ahead
While the world in 2021 began to adjust to a “new normal” in which hybrid models and
in-app purchases became increasingly prevalent, COVID-19 pandemic-driven restrictions
gradually relaxed or phased out across regions throughout 2022. 2022 also came with
global and economic challenges, such as the war in Ukraine, regulatory headwinds in the
video game industry in China, higher gas prices, supply chain disruptions, inflation, higher
interest rates, and foreign exchange headwinds. On the App Store ecosystem, in-app
purchases of digital goods and services stabilized, while the growth in in-app purchases
of physical goods and services and in-app advertisement was strong. We anticipate that
the App Store ecosystem will continue to evolve and adapt to the dynamic needs of
customers across regions.
In the US,
iOS-app-based
travel-related
sales increased
54%
since 2021.
In Europe
iOS-app-based
ride hailing sales
increased
58%
since 2019.
The above figures show sales
between 2019 and 2022, indexed on
2019 (i.e., 2019=100). The underlying
data behind sales of physical
goods and services categories were
retroactively updated from previous
reports. Figures are produced based
on updated numbers for 2019 and
2020.
Categories with
Rebounding Sales,
2019-2022
US
Europe
China
Rest of World
100
150
200
250
50
2019 2020 2021 2022
Travel
100
150
200
50
2019 2020 2021 2022
Ride Hailing

The Continued Growth and Resilience of Apple’s App Store Ecosystem
13
Fieen years of the App Store
By the Numbers
iOS APPS AND
USER CHOICE
370+ billion
downloads since 2008
123x more apps available
now compared to the end of
2008
15x more annual
downloads in 2022 than 2009
650+ million average
weekly visitors to the App Store
TRUST AND
SAFETY
1.7 million App Store
submissions rejected in 2022
$5+ billion
in
fraudulent transactions
prevented since 2020
SUPPORT FOR
DEVELOPERS
40+ SDKs & 250,000 APIs
Education
Developer Academies, Apple-
certified trainings, Entrepreneur
Camps, and learn to code programs
More ways
to process payments:
50 storefronts with carrier billing
20+ storefronts with third-party
electronic wallets
40+ billion average weekly
automatic app updates
DEVELOPER
GROWTH
$320+ billion
developer earnings since 2008
126x more earnings in
2022 than 2009
200+ countries with active
developers in 2022
(vs 69 in 2008)
54% downloads from outside
developers’ home country
By the Numbers

The Continued Growth and Resilience of Apple’s App Store Ecosystem
14
An explosion of opportunities and choices
The App Store was the first of its kind when it opened in 2008. For the past 15 years, it has
offered a seamless and trusted way for users to download apps and new technologies.
In doing so, the App Store has supported an explosion of opportunities for developers of
various types of apps, leading to a proliferation of app-based products and services across
app categories for consumers.
Users can now choose from tens of thousands – sometimes hundreds of thousands – of
apps across more than 20 categories that they can download. Users today have access
to over 123 times more apps than they did at the end of 2008. Annual downloads on the
App Store have increased 15-fold between 2009 – the first full year the App Store was in
operation – and 2022. Since the launch of the App Store, users have downloaded apps
more than 370 billion times.
Developers of all sizes from all over the world have found opportunities on the App
Store. At the end of 2008, developers who published apps on the App Store hailed
from 69 countries; today, they come from nearly every country in the world. The share
of developers from regions other than the US and Europe has grown from 18% to 48%
between the end of 2008 and 2022, with the share of developers from China climbing from
1% to 12%. The App Store provides opportunities for developers to distribute their apps
globally: In 2022, 54% of downloads occurred in storefronts outside of developers’ home
countries.
Developers earned over $320 billion in total on the App Store between 2008 and the
end of 2022, and yearly developer earnings have grown 126-fold between 2009 and
2022. Monetization options have expanded: When the App Store started, developers
could only monetize their apps directly via the App Store through app purchases; now,
app purchases are responsible for less than 1% of earnings. In-app purchases account
for the majority of developer earnings (about two-thirds), and subscriptions, which now
account for about one-third of earnings, are growing. Subscriptions have been increasing
globally, and are offered by many different businesses, ranging from physical bookstores,
to e-commerce stores, to streaming platforms.
viii
The App Store is no exception, and
developers have embraced this global trend. The App Store provides features like the
ability to cancel subscriptions easily, as well as a reduced developer commission rate on
revenue from subscriptions aer the first year. Over the years, more and more developers
across different categories have embraced subscriptions as their preferred monetization
strategy.
Many segments have seen an enormous increase in choices for users and opportunities
for developers on the App Store. By the end of 2008, for example, users could choose
from only 3,200 games; by the end of 2022, they could choose from nearly 220,000, more
than a 60-fold increase. Business apps have become more important for users in recent
years, especially during and in the aermath of the COVID-19 pandemic: The App Store
went from hosting only 350 business apps at the end of 2008, to over 190,000 by the end of
Our 2022 study, “The
Success of Third-Party Apps
on the App Store,” provides
more detail on how the
options for developers and
content creators to reach
consumers have changed
over time.

The Continued Growth and Resilience of Apple’s App Store Ecosystem
15
2022. Also, both education and health and fitness are important categories that now offer
consumers tens of thousands of choices.
Figure 2: Number of iOS Apps at the End of 2008 and 2022,
Select App Store Categories
220K
3,200
190K
170K
90K
Games
Business
Education
Health &
Fitness
350
1,000
430
2022 2008
This increase in choices has transformed many aspects of our daily life. As just one
example, consider how the experience of going on a trip has been transformed by apps.
Prior to the App Store, a typical travel experience included printing paper boarding passes
from one’s computer, waiting at a taxi stand or bus stand for a ride from the airport to one’s
destination, using unwieldy folding maps to navigate a new city or expensive and clunky
GPS devices while driving, and waiting to get back home to share photos and videos
with family and friends. Since the advent of the App Store, this experience has been
transformed: Mapping apps make it easier to navigate a new destination and find reviews
of aractions and restaurants, ride hailing apps allow travelers to get around an unfamiliar
city, and communication and social media apps allow travelers to share photos and videos
in real time.
Supporting new and growing sectors of the economy
The ability to distribute soware – specifically, apps – seamlessly through hundreds of
millions of devices, paired with Apple’s hardware and soware advances, made entirely
new types of apps possible and allowed other categories of apps to scale massively.
˿ Mobile gaming: In the early days, mobile games such as Tetris and solitaire offered
a simple experience to pass the time. Since then, advances in hardware, soware,
graphics, and screen quality have led to an explosion of mobile gaming. Games that
use heightened processing capabilities, realistic graphics, and augmented reality
provide a state-of-the-art gaming experience without the need to buy a console.
˿ Transportation platforms and food delivery: Since launching nearly 10 years

The Continued Growth and Resilience of Apple’s App Store Ecosystem
16
ago, ride hailing platforms have revolutionized how people get around worldwide,
leveraging riders’ and drivers’ use of connected devices that can track their
locations. This new paradigm has been extended with the emergence of micro-
mobility apps that offer bike, e-bike, and scooter sharing, and car sharing apps
that allow users to rent a car for a few hours. Similarly, food delivery apps connect
a network of customers, restaurants, and delivery drivers by taking advantage
of mapping and location technology. Apps give users and workers the ability to
complete these transactions without needing to carry cash or credit cards.
˿ Music streaming and video streaming: The ability to stream content at any time and
in any place contributed to the expansion of music and video streaming services.
Improvements in baery life, screen size, and screen quality have made watching
content on iPhone and iPad more enjoyable. Additionally, digital rights management
features, such as technology that prevents users from screen recording while the
video is playing, have helped protect content owners and allowed video streaming
services to flourish.
˿ Education: Education apps are used by teachers, parents, and students to support
learning. Apps can help teachers manage classrooms, communicate with parents
and students, and help students study or explore new topics. The use of education
apps to support learning also increased during the pandemic when in-person
schools were temporarily closed. Outside of the classroom, apps have also helped
people of all ages learn new languages and new skills.
˿ Connected home devices: The App Store has also enabled a new generation of
physical products like smart thermostats, doorbells, locks, baby monitors, and light
bulbs, which make users’ homes more comfortable, functional, and secure. Users’
ability to remotely control these devices or view the data they collect via apps has
greatly improved their utility.
˿ Civic engagement: Governments increasingly rely on apps to facilitate interactions
with citizens. For example, apps allow citizens to report non-emergency issues,
check the schedule of trash pickup, find federally funded health centers, or apply
for assistance aer an emergency. During the COVID-19 pandemic, public health
authorities created apps to track exposure through the Exposure Notifications
APIs developed by Apple and Google, and to provide citizens access to COVID-19
screening tools and information, among other features.
Honkai: Star Rail (China,
2023) is a role-playing
space fantasy game that
was one of the most
highly anticipated and
successful RPG releases
of 2023.
Weee! (US, 2014)
is a grocery delivery app
that allows users to shop
for Asian and Latino food
options.
Ten Percent Happier (US,
2015) is a meditation app
that helps users start and
sustain a mindfulness
practice.
Twinkl (UK, 2017) is an
educational app that
provides teachers access
to a variety of educational
resources, including
worksheets, lesson plans,
educational games, and
more.
Examples of apps
from new and growing
sectors of the economy

The Continued Growth and Resilience of Apple’s App Store Ecosystem
17
Connected home devices
The market for connected home devices has grown quickly over the last five
years.
ix
In 2022, categories of connected home devices that typically rely on apps to
control, and sometimes use, the device and view data generated $49 billion in global
revenue.
x
These devices include security devices like Ring and smart camera, home
entertainment devices like Sonos, energy management tools like Nest, and comfort
and lighting tools like GE’s smart light bulbs controlled by the Cync app.
The growth of connected home devices has been a global phenomenon: For
example, $13 billion in revenue came from Europe in 2022.
xi
Global manufacturers
of connected home devices include Siemens, a multinational corporation
headquartered in Germany that offers a suite of connected home devices controlled
via an app; Arkifi, a Chilean-based company offering smart locks; and tado°, a
German-based company producing smart thermostats.
Supporting users’ everyday health
Users can find thousands of apps on the App Store to help them adopt healthier
lifestyles. Many of these apps take advantage of Apple’s HealthKit API, which allows
the use of sophisticated sensors on iPhone and Apple Watch, while ensuring that
user data is safe according to Apple’s rigorous privacy and data security protocols. In
addition, there are an increasing number of connected devices that work alongside
HealthKit-enabled apps. Popular consumer-targeted health apps include:
̥ Running apps like Nike Run Club
̥ Fitness apps like MyFitnessPal
̥ Sleep apps like Rise: Energy & Sleep Tracker, SnoreLab, and Pillow
̥ Meditation and mindfulness apps like Calm, Headspace, and Ten Percent
Happier
̥ Hearing-related apps like SonicCloud
̥ Nutrition apps like WeightWatchers and Lose It!
̥ Medication and symptom tracking apps like Pt Pal Pro and Medisafe
Medication Management
̥ Apps that work alongside connected devices like Qardio heart health to
measure blood pressure, Withings Health Mate to measure weight, and
ReSound to work alongside hearing aids

The Continued Growth and Resilience of Apple’s App Store Ecosystem
18
New ways to engage with customers and to lower costs
Many traditional businesses have used apps in innovative ways to improve their
customer experiences and/or provide their services more efficiently. For example,
airlines have developed apps that provide an ever-growing array of features for their
customers. Through apps, users can conveniently store and access mobile boarding
passes, check flight status, modify reservations, receive gate and baggage updates, access
the plane’s entertainment system, and more. Some of these features have reduced costs
as well, such as the cost savings from phasing out in-flight entertainment system screens
or printing paper boarding passes.
xii,xiii
Similarly, banks have developed apps that facilitate mobile check deposit using the phone
camera, send fraud alerts, and allow customers to quickly check balances or transfer
money. The extra convenience for consumers has also led to lower costs for banks
from the reduction in in-person visits to physical branches.
xiv
Supermarket apps allow
consumers to order items on the go, check savings and deals, look up store maps and
aisle locations, scan items for prices, and pay directly through the app.
App-based innovations also extend to cultural and recreation activities: Visitors to art
museums can now use mobile apps to take a wide variety of self-guided tours or listen to
audio descriptions of individual artwork that catch their aention. Theme parks have apps
that allow visitors to view wait times for popular rides, navigate the park, and view activity
schedules. Many ski resorts now offer apps that allow visitors to check real-time weather
conditions and forecasts, get updates on li closures, and view trail maps.
United Airlines (US,
2011) United Airlines'
app allows users to book
flights, access in-flight
entertainment, pay for
in-flight snacks and
drinks, check in for flights
and download boarding
passes, track bagages,
and more.
USAA (US, 2009) United
Services Automobile
Association was one of
the first financial service
companies to offer mobile
check deposit using
iPhone’s camera.
John Lewis & Partners
(UK, 2011) is a department
store app that allows
users to browse products,
use augmented reality
features to "try before you
buy," and get notifications
when products are back
in stock.
Examples of apps that
provide new ways to
engage with customers
The Continued Growth and Resilience of Apple’s App Store Ecosystem
19
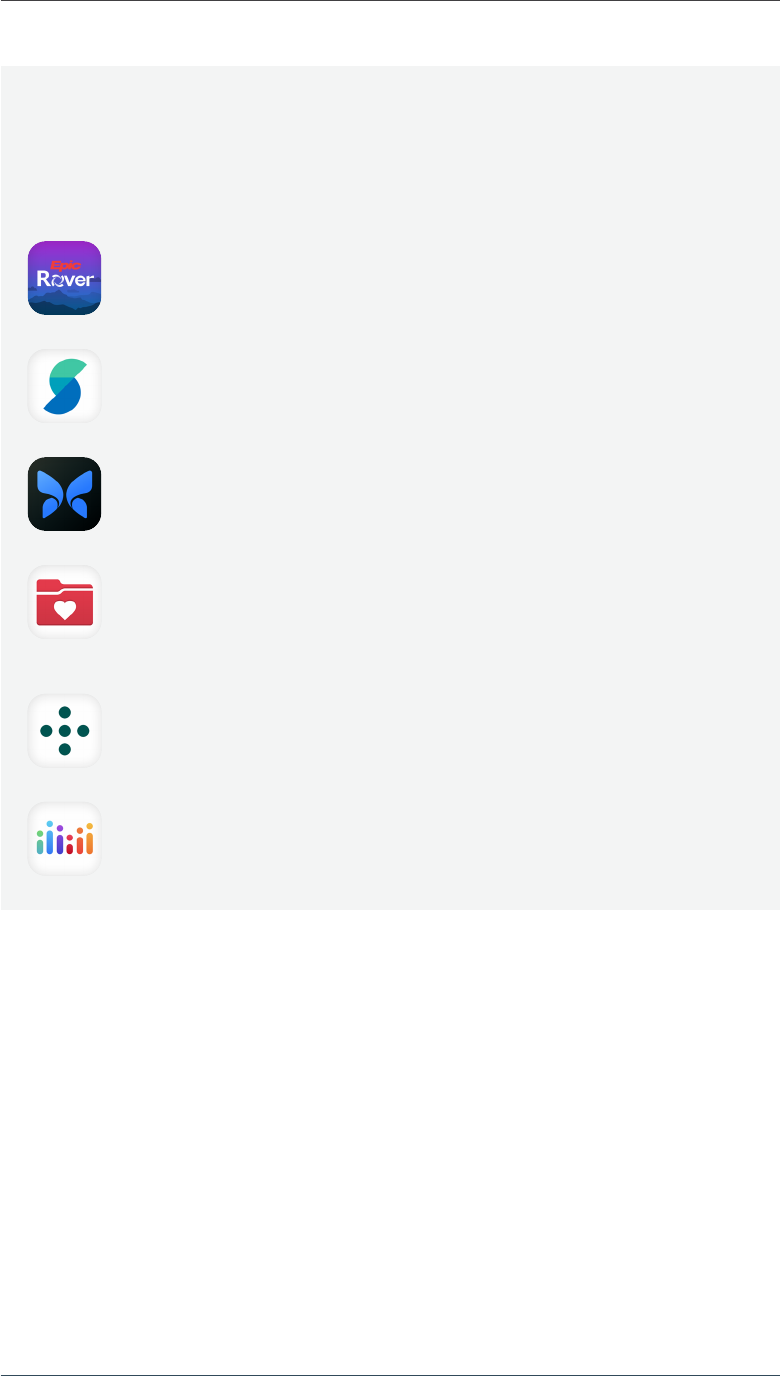
Innovations from healthcare providers and the medical community
Healthcare providers and the medical community use apps to deliver cuing-edge
care to patients and conduct groundbreaking research. These apps include:
Epic Rover, which helps manage clinical communication by pairing
iPhones with patient charts and has a scanning feature to streamline the
administration of medication.
StrivePD, which uses Apple’s Movement Disorder API to help measure
and record tremors and muscle movements associated with Parkinson’s
disease.
Buerfly iQ+, a handheld ultrasound device that was built using Apple’s
developer tools and has expanded access to ultrasound imaging.
Epic’s MyChart app, which is integrated with HealthKit and paired with
third-party medical devices (for example, blood pressure cuffs and
glucose monitors), and provides digital medicine programs for patients
with hypertension and diabetes.
One Medical, which allows patients to participate in telehealth video
appointments in the app, schedule visits, message with providers via
video or chat, manage prescriptions, and view health records.
Apple Research, built on the ResearchKit framework, which is
broadening the scope of possibilities for researchers while maintaining
complete control over data sharing for participants.

The Continued Growth and Resilience of Apple’s App Store Ecosystem
20
Scholarship in economics and business strategy shows
that digital marketplaces create value by facilitating
interactions between different sets of users.
xv
The
App Store, a digital marketplace, makes it easier for
Apple iOS device owners and developers to interact. This
means that the App Store has the incentive to bring both
sides on board and encourage their interactions.
xvi
Apple
benefits if iOS users have more positive experiences
downloading and using apps, and if developers have the
tools and support from Apple to create beer apps.
To succeed, digital marketplaces need to actively
manage the interactions between developers and iOS
users and create trust to ensure continued participation
from both sets of users.
To do so, digital marketplaces rely on technology,
processes, and policies to improve the quality of
interactions on the platform.
xvii
This is an iterative
process that requires work and investment, adjusting
to changing conditions, and incorporating new
technologies as they become available.
Apple’s focus on device owners and developers
contributes to making the App Store a vibrant
marketplace with over 650 million average weekly
visitors, and over 747 million and 1.5 billion average
weekly downloads and redownloads, respectively.
1.7m
App Store
submissions
rejected in 2022
$5b+
in fraudulent
transactions
prevented since
2020
950,000+
apps rejected for
privacy violations
since 2020
690m+
fraudulent
customer accounts
deactivated since
2020
Apple device owners: Providing a safe, secure, and private
platform for users to discover new apps
Trust and safety have been central to the growth in app downloads and usage
over time. Compared to the early 2000s, when downloading soware always
came with the risk of infecting the device with a virus or becoming victim to
a scam, the App Store has brought peace of mind to users downloading apps.
Apple’s unique approach integrates hardware, soware, and other services, such
as safe payment options, to provide users with a secure and private experience
to discover and enjoy new apps. Apple’s policies and rules, for example for App
Review, ensure the App Store remains a safe marketplace.
Apple has heavily invested in the development of policies to foster user trust
and the deployment of resources to enforce them. Many of these rules apply
even before apps are released on the App Store. Before submiing new apps
for review, Apple requires developers to provide detailed information about
how the apps, and any third-party products integrated into the apps, deal with
privacy and user data. Once developers submit their apps, Apple’s screening
mechanisms ensure that apps and all in-app content meet the App Store Review
Guidelines, are periodically updated, and do not represent a privacy risk for
users. Additionally, automatic app updates make it easy and seamless for users
to have the latest and safest app versions. Apple has also developed multiple
mechanisms to remove bad actors and prevent fraud on the App Store, including
by removing fraudulent reviews, removing fraudulent users and developers, and
preventing payment and credit card fraud.
The need to encourage platform usage on both sides

The Continued Growth and Resilience of Apple’s App Store Ecosystem
21
Serving Developers: Tools to foster success
Apple’s continual investments in the iOS ecosystem facilitates the
development and discovery of new apps, gives developers the ability to add
new functionality to their existing apps, and provides access to metrics to
track app usage.
Since 2008, Apple has released over 40 SDKs and 250,000 APIs for
developers, including HealthKit (2014), which provides a secure option
to create apps based on user health data, and the Metal API, which can
improve running time and be used to create state-of-the art 3D designs
for games. Technical tools like Xcode and Swi (2014) lower the
technical barriers to design, and make it easier to debug and optimize
apps. And testing tools such as TestFlight (2014) connect developers
and users during the app’s testing phase. Apple also provides
developers with the option to collect data on app performance, which
can inform improvements to their apps.
Apple’s App Analytics tools, such as “Peer Group Benchmark,” allow
developers to track the performance of their apps by monitoring
downloads, active sessions, paying users, and in-app content.
The App Store gives developers multiple alternatives to monetize their apps,
including by offering subscriptions and/or employing different business models
(free, freemium, paid, paymium). It also supports many payment methods,
including payments in local currencies, carrier billing (which allows users to pay
developers through their monthly phone bill), Apple Pay, and other methods that
leverage third-party companies.
Support for
students
through programs such
as “Everyone Can Code,”
“Develop in Swift”, and
“Swift Playgrounds”
Support for
new developers
through Developer
Academies and
Apple-certified trainings
Support for iOS
entrepreneurs
through Entrepreneur
Camps, App
Accelerators, and
developer workshops
around the world
Our 2021 study, “A
Global Perspective of
the Apple Ecosystem,”
provides more details
on how Apple supports
developers.
73
storefronts where Apple
offers the option to pay in
local currency
Thanks to the App Store, developers can seamlessly distribute their apps around the world and make sure users
discover their apps. The App Store facilitates on average more than 747 million app downloads, 1.5 billion
redownloads, and 40 billion automatic app updates each week. The App Store’s global marketing team, editors, and the
“Today,” “App of the Day,” and “Game of the Day” features are examples of how Apple helps developers drive discovery of
their apps.
50
storefronts that offer carrier billing,
including O2 in Germany (2015), BYT
in France (2017), Optus in Australia
(2019), and WOM Nextel in Chile (2022)
26
storefronts that offer third-party
electronic wallets including Alipay in
China (2016), Kakaopay in Korea (2019),
and Dana in Indonesia (2020)

The Continued Growth and Resilience of Apple’s App Store Ecosystem
A1
Appendix
Appendix Table 1: Breakdown of Where Apple Collects a Commission on Billings and
Sales Facilitated by the App Store
Apple does not collect a commission on:
Q Digital goods and services that are purchased outside of the
App Store, for example:
* Subscriptions to multiplatform video streaming apps like Hulu
* Subscriptions to audiobook apps like Audible
* Subscriptions to music streaming apps like Spotify
* Subscriptions to news and magazine apps like the NY Times
Q Physical goods and services ordered within-app, for example:
* Ordering a ride through the Uber app
* Placing an order on the Amazon app
* Ordering grocery delivery through Instacart
* Transaction fees on digital payments occurring through apps
Q In-app advertising for apps that make money through in-app
advertising, for example:
* Non-gaming apps like Pinterest and YouTube
* Gaming apps like Rolly Vertex and Helix Jump
Apple collects a commission on:
Q Digital goods and services that are
purchased in or through the App Store,
for example:
* In-app subscriptions to multiplatform
video streaming apps like Hulu
* In-app subscriptions to education
apps like Duolingo
* In-app purchases of a game's bonus
features
* In-app subscriptions to news and
magazine apps like the NY Times
Billings and Sales Facilitated by the App Store Ecosystem: $1,123 Billion
No commission: More than 90%
Commission: Less than 10%
Appendix Table 2: Estimated Billings and Sales Facilitated by the App Store Ecosystem,
Large Regions, 2021 ($ Billion)*
US China Europe****
Rest of the
World Total
Digital Goods and Services** $38 $20 $11 $33 $102
Physical Goods and Services $153 $344 $91 $90 $678
M-Commerce
General Retail $86 $273 $60 $52 $471
Travel $17 $13 $12 $14 $56
Food Delivery and Pickup $20 $26 $9 $11 $66
Grocery $8 $21 $5 $8 $43
Ride Hailing $17 $7 $5 $5 $33
Digital Payment $4 $5 - - $9
In-App Advertising*** $41 $17 $14 $16 $88
Total $232 $381 $116 $139 $868
* Totals may not sum due to rounding.
** Billings and sales from digital goods and services are not the same as App Store billings.
*** iOS in-app ad revenue; does not include mobile web, search ads, and Apple Search ads.
**** Europe includes countries in Western, Central, and Eastern Europe (including the UK and the Nordic Region, not including Russia).

The Continued Growth and Resilience of Apple’s App Store Ecosystem
A2
Methodological approach
To arrive at our results, we distinguish among three primary app monetization strategies
that developers use:
˿ The first monetization strategy is to sell and distribute digital goods and services.
Sales and distribution of digital goods and services can occur through the
App Store in the form of paid app downloads and in-app purchases, or through the
sale of digital content and subscriptions from multi-platform apps that allow for the
use and consumption of the app, both on the App Store ecosystem and elsewhere.
Examples of apps using this monetization strategy include those for gaming, dating,
video and music streaming, fitness and health, and news and magazines.
˿ The second monetization strategy is to sell physical goods and services through
the app. Apps using this monetization strategy are m-commerce apps generally,
including apps for ride hailing, food delivery and pickup, grocery delivery and pickup,
general retail, and travel, as well as digital payment apps.
˿ The third monetization strategy is to sell in-app advertising. Examples of apps
using in-app advertising as their primary monetization strategy are social media and
short video sharing apps.
We employ different methodologies to estimate billings and sales facilitated by the
App Store ecosystem for each of these monetization strategies. In so doing, we rely on
a variety of data sources, including data from Apple, app analytics companies, market
research firms, and individual companies. To ensure the reliability and robustness of our
estimates, we validate and compare key inputs from different data sources.
4
We are continually working to improve on our methodology and to adjust for changes
in underlying third-party data. As a result, estimates and changes seen throughout
this report may differ from those presented in previous years’ reports. Where and when
applicable, we have made note of reliance on updated estimates.
Sales and distribution of digital goods and services
Apps used to sell and distribute digital goods and services fall into two subcategories:
˿ Certain app developers choose to monetize their iOS apps only through the
App Store, and those apps can only be used on the iOS platform.
5
Most billings from
these apps come from games, which involve a one-time payment or, more oen,
in-app payments that allow app users to remove ads, unlock bonus levels, or access
premium features.
6
This category also includes most photo-editing apps and dating
4 This methodological approach is consistent with the one used in our 2019 and 2020 App Store ecosystem
studies.
5 Developers may also offer the same digital goods and services through apps on other platforms, such as
Android.
6 Our analysis does not include billings generated from the Apple Arcade gaming service. Apple Arcade provides
participating developers with an additional business model – distinct from the App Store – in which Apple
supports the development costs of Apple Arcade games. Many small and independent developers with games
in Apple Arcade also monetize with other free-to-play or paid games on the App Store.

The Continued Growth and Resilience of Apple’s App Store Ecosystem
A3
apps, as well as apps for short video, among others.
˿ Other apps allow for the consumption of digital goods and services both within the
App Store ecosystem and elsewhere. These so-called multi-platform apps allow
consumers to pay through either the App Store or another platform or device. In
other words, consumers use non-device-specific subscriptions or purchases to
enjoy the digital goods and services provided. Multi-platform apps can be further
divided into consumer apps and enterprise apps.
- Consumer apps typically offer paid digital content – such as movies, music,
audiobooks, news, meditation courses, and fitness classes – that can be
consumed within the app. Moreover, they may offer paid digital services obtained
on the app, such as educational services, password management, job search,
and access to job platforms.
- Enterprise apps allow businesses and organizations to provide tools and
capabilities through smartphones and tablets. These include communication
and collaboration apps, mobility management solutions, cloud-based business
apps, and file hosting services. These apps usually make money by selling
subscriptions to corporations and institutions outside of the App Store.
To distinguish between these two subcategories of apps, we manually review the
most popular apps in each App Store category, focusing on their business models and
monetization strategies. We use this information to ascertain (1) whether the app can be
used on mobile or computer browsers, or on a different app platform; and (2) whether an
app on an Apple device can be used through a subscription or purchase made outside the
App Store.
Methodology for iOS apps that sell only through the App Store
For iOS apps that sell digital goods and services only through the App Store, we count
total billings, which include Apple’s commission.
7
We use billings because they represent
the total amount customers pay.
7 In 2022, Apple’s commission rate was 30% for the sale of digital goods and services; for subscriptions, it was
30% for the first year and 15% for any subsequent years. Developers who made up to $1 million in 2021 for all
of their apps, as well as developers new to the App Store, qualify for the Small Business Program and pay a
reduced commission of 15%.

The Continued Growth and Resilience of Apple’s App Store Ecosystem
A4
Methodology for multi-platform apps
Background. For multi-platform apps, estimating the volume of sales facilitated by the
App Store is complex because subscriptions and purchases associated with them are not
device specific. The lack of device-specificity creates a dual challenge:
˿ First, consumers can pay to access multi-platform digital goods and services in
different ways, regardless of where they consume those goods and services. In
some cases, consumers pay through the App Store, but sometimes they do not.
˿ Second, multi-platform apps allow users to access content and services across
different devices, including non-Apple devices. For example, consumers can
stream videos through smart TVs, connected TV devices, video game consoles,
smartphones, tablets, and web browsers, and across different platforms (Apple,
Android, etc.).
Because of these two characteristics of multi-platform apps, billings that flow through the
App Store are not necessarily a reliable indication of Apple users’ engagement with multi-
platform apps. Consequently, we must be deliberate about aributing the appropriate
share of billings and sales to the App Store ecosystem.
Example. To illustrate these challenges, consider the video streaming service Hulu. The
Hulu app is free to download, but a subscription is necessary to watch content on the
iPhone, iPad, and Apple TV apps. A Hulu subscription can be purchased in one of two
ways:
˿ Through the Hulu app on an Apple device, in which case the purchase happens
through the App Store. But a subscription purchased through the App Store can
also be used to watch Hulu on other platforms. Consequently, it would be incorrect
to aribute all of the App Store billings (the full subscription amount) to the
App Store ecosystem because it would overstate the value of the Hulu product
enjoyed on Apple devices specifically.
˿ Outside of the app (on a Mac or PC via web browser, for example), in which case
the purchase does not happen through the App Store, and there are no App Store
billings. However, the subscription can be used to watch content on Hulu using
apps on Apple devices. Consequently, it would be incorrect to use the App Store
billings (which are zero) as an input to our App Store ecosystem results, because
it would understate the value of the Hulu product enjoyed through apps on Apple
devices.
Methodology. To address these challenges, we generally do not rely on App Store billings
for multi-platform apps. Instead, we rely on the proportion of use that occurs on apps in
the App Store ecosystem to estimate how much of the total sales of multi-platform apps
(App Store plus non-App Store) is facilitated by the App Store ecosystem.

The Continued Growth and Resilience of Apple’s App Store Ecosystem
A5
Consider, for example, not just Hulu but the entire video streaming industry, a market
with more than $30 billion in total annual sales in the US in 2022.
xviii
Users consume video
streaming content over a mix of smartphone apps, tablet apps, desktop browsers, smart
TVs, connected TV devices, and video game consoles. To estimate the volume of sales
facilitated by the App Store ecosystem, we first take the portion of hours streamed on
smartphone apps, tablet apps, and smart TVs of all types. We then apportion this share to
Apple devices specifically, using the Apple market share for each device category.
Using this framework and approach, we estimate the volume of sales facilitated by the
App Store ecosystem for several categories of apps offering similar types of goods and
services. The app categories for which we estimate sales facilitated by the App Store
are video and music streaming, e-books and audiobooks, newspapers and magazines,
and enterprise. We use third-party research to account for the variation in users’ app
consumption habits across categories and countries. For example, consumers oen listen
to music and audiobooks through apps on mobile devices, while they are more likely
to stream videos on smart TVs. Those consumption habits may also vary by geography.
Additionally, when the data are available, we take into account any variation in the
consumption paerns of iOS (and non-iOS) users by app type and geography.
For each app category, we estimate total sales by geography by relying on inputs from
third-party sources, typically market research firms.
xix
We then apportion those sales
using the share of content consumed on apps on any platform by geography, based
on information collected from marketing surveys, company reports, or data on usage
paerns.
xx
Finally, we apportion usage to Apple iOS devices specifically by using the iOS
market share for each device category in each geography.
xxi
We use a more tailored approach for enterprise apps for a number of reasons. First, usage
paerns are more heterogeneous for enterprise apps. Second, app-based usage and
desktop-based usage of enterprise products tend to be more integrated. Third, the pricing
of enterprise products is less transparent and more complex than for consumer apps.
With these complexities in mind, we individually estimate sales from 10 major enterprise
apps or families of apps; Microso Office 365, Google Workspace (i.e., enterprise versions
of Google productivity tools such as Gmail and Google Docs), Adobe (Acrobat), WPS
Office, Dropbox, Box, Baidu Drive, Webex, Zoom, and Slack. We also include an aggregate
market-level estimate for mobility management apps, which allow employees to securely
access business content.
Finally, for some categories of apps, we use billings from the App Store as a proxy for
sales facilitated by the App Store ecosystem. We do this for categories of apps, such as
education or fitness apps, for which consumers typically consume the content within
the app but may purchase it outside of the App Store. This methodology likely results in
a conservative (or lower) estimate compared with an estimate relying on usage-based
apportionment.

The Continued Growth and Resilience of Apple’s App Store Ecosystem
A6
Sales of physical goods and services through the app
Many developers monetize their apps by selling physical products through their apps.
These include:
˿ Apps that let customers purchase physical goods and services. We broadly refer to
these as m-commerce apps. The group includes apps for general retail, ride hailing,
food delivery and pickup, grocery delivery, and travel.
˿ Apps that enable digital payments or transfers, such as mobile point-of-sale apps
that rely on QR codes and peer-to-peer transfer apps.
M-commerce
Globally, mobile apps are an increasingly important e-commerce channel due to
their convenience. This growth has been most pronounced in China, the leader in
m-commerce.
8
Apps of retailers such as Amazon and Target allow consumers to browse
and purchase physical goods directly in the app and offer in-store pickup or delivery. In
addition, mobile apps – including those for ride hailing, food delivery and pickup, grocery
delivery and pickup, and mobile pickup ordering – have been central to the creation or
expansion of certain business models.
Sales on m-commerce apps do not flow through the App Store.
9
We therefore use
third-party data to estimate the volume of sales of physical goods and services from
transactions on mobile apps.
10
We provide results for several categories of apps: general
retail, food delivery and pickup, travel, grocery, and ride hailing.
For many of our m-commerce categories, we rely on Statista’s Digital Market Outlook and
Mobility Market Outlook data for online sales revenue. In 2022, Statista updated their
methodology to estimate industry revenues to use current exchange rates, rather than
fixed exchange rates, with the goal of being more accurate. As a result, their 2019, 2020
and 2021 estimates were retroactively updated.
For each app category, we estimate the total volume of e-commerce or m-commerce
sales by geography, relying on estimates of third-party sources, typically market research
firms.
xxii
We then apportion the volume of sales, if necessary, to purchases that occur via
smartphone and tablet apps. For example, for online food delivery and pickup, customers
may place orders via an app, a mobile browser, or a desktop browser. We estimate the
share of each app category’s sales that occur via mobile apps, within each geography,
8 In China, more than 80% of online retail is mobile. Additionally, most mobile commerce occurs through apps
and to a lesser – but increasing – extent through “mini-programs” on platforms such as WeChat, Baidu, and
Alipay. See, eMarketer; QuestMobile, "China Mobile Internet 2019 Half Year Report"; Aladdin, "2019 Mini-
Programs White Papers," January 2, 2020.
9 Since the launch of the App Store, Apple’s policy has been to not charge a commission on sales of physical
goods and services or advertising.
10 The sales associated with purchases made on mobile browser apps are excluded.

The Continued Growth and Resilience of Apple’s App Store Ecosystem
A7
using information collected from marketing surveys or data on usage paerns.
xxiii
Finally,
we apportion usage to Apple platforms based on the overall iOS share market share.
11,xxiv
Digital payments
Digital payment apps have become increasingly popular worldwide, although the
landscape differs substantially across countries. In China, currently the largest market for
digital payments, two QR code-based payment apps, Alipay and WeChat Pay, dominate
both online and brick-and-mortar points of sales. These apps charge merchants a fee on
purchases paid for with their apps. In the US, app-based payment systems are a relatively
nascent market
xxv
while peer-to-peer transfer apps such as Venmo and Cash App are
already popular and have grown significantly in recent years.
xxvi
In this year's study, we also
consider India’s growing digital payment market driven by PhonePe; however, they remain
significantly smaller than the US and China.
We estimate the transaction fees collected by developers from customers or merchants
for payments and transfers occurring through apps on the iOS platform.
12
For QR code-
based payment apps in China, we start with an estimate of total payment volume (TPV)
from a third-party research firm.
xxvii
We then estimate WeChat Pay and Alipay total
transaction fees using their published fee rates and deductible policies. For peer-to-peer
transfer apps in the US, we use the ratio of total transaction fees to TPV from Venmo and
Cash App to estimate the transaction fees collected by the apps. For digital payment
apps in India, we start with a third-party estimate of total transaction value of digital
payments,
xxviii
as well as PhonePe’s revenue and market share to back-out the total fees
and average fee rate generated from digital payments. Finally, we apportion usage to Apple
platforms based on data on the overall iOS share in each region.
xxix
In-app advertising
In-app advertising is a frequently used and effective method of monetizing apps whereby
developers publish advertisements within their apps. Prominent examples of apps that
primarily make money through in-app advertising are Instagram, Twier, YouTube, and
Pinterest, and Sina Weibo in China. Examples of games are Rolly Vortex and Helix Jump.
These apps tend to be free to download and use, but in-app advertising can also be a
complementary monetization strategy for paid apps or apps with in-app purchases.
Users have been spending more and more time on their mobile devices, particularly using
apps, which has led to an increased share of digital marketing expenditures going toward
in-app advertising. Given that apps are used frequently throughout the day – for example,
during commutes or moments of downtime – in-app advertising allows advertisers to
reach users in ways that other marketing channels cannot. Compared with mobile web,
11 Apportioning by iOS market share almost certainly results in a conservative estimate because owners of iOS
devices tend to spend relatively more than owners of Android devices. See, e.g., Comscore.
12 Our study excludes digital payment apps and services based on near-field communication, such as Apple
Pay. Mobile commerce transactions that occur within an app and are paid with Apple Pay are included in
m-commerce sales.

The Continued Growth and Resilience of Apple’s App Store Ecosystem
A8
the app environment is a more effective way for advertisers to reach their audiences, with
in-app advertisements allowing for personalized and contextually relevant ad messages.
Technology research firm Omdia estimated that in-app ad sales for iOS apps were $109
billion in 2022, with almost $27 billion (25%) tied to gaming apps.
xxx
This estimate includes
revenue generated from the publishing of advertisements within apps only, and excludes
advertising on mobile web (including mobile browser apps), search advertising, and Apple
Search Ads. Omdia derived this estimate based on ad sales reported by large digital
advertising firms, and then used data analytics from mobile ad platforms to apportion the
iOS share, limited to in-app advertising only (i.e., by removing mobile web advertising),
and to adjust for ad price differences between the iOS and Android app platforms. We
use Omdia’s research in this study. In 2021, Omdia considerably remodeled their historical
estimates to account for the display advertising market. In all years, we use Omdia’s
retroactively updated estimates.
Additional dimensions not included in our estimates
The App Store has also made it easier and more secure for consumers to sign up for
subscriptions and make purchases of digital goods and services. This may lead to
incremental sales for app developers regardless of the platform chosen by users to
consume the digital goods and services. Apps have also allowed traditional firms and
industries to expand their offerings of a wide range of products via connected devices –
devices that typically require the use of apps to control and monitor them. The App Store
has enabled a new generation of home devices like smart thermostats and doorbells, for
example, as well as new possibilities for health like connected blood pressure cuffs, smart
scales, and even hearing aids.

The Continued Growth and Resilience of Apple’s App Store Ecosystem
About the authors
Juliee Caminade, Ph.D., is a vice president at Analysis Group. Dr. Caminade specializes
in the economic analysis of various antitrust issues and complex business disputes in
multiple industries, including health care, pharmaceuticals, and consumer and industrial
goods. Her articles have appeared in publications such as the Journal of Competition Law
& Economics and The Antitrust Source. She has taught competition economics at the
undergraduate level in the economics department at Dartmouth College.
Jonathan Borck, Ph.D., is a vice president at Analysis Group and an adjunct lecturer in
public policy at the Harvard Kennedy School. Dr. Borck specializes in the application
of statistics and economics to topics in business and public policy. He has testified in
disputes and directed projects in areas such as antitrust and competition, technology
and digital platforms, health care, mortgages and housing, and the environment. He has
taught probability, statistics, and economics to both undergraduates and master’s degree
students.
Analysis Group is one of the largest international economics consulting firms, with more
than 1,200 professionals across 14 offices in North America, Europe, and Asia. Since
1981, Analysis Group has provided expertise in economics, finance, health care analytics,
and strategy to top law firms, Fortune Global 500 companies, and government agencies
worldwide.

The Continued Growth and Resilience of Apple’s App Store Ecosystem
Sources
i Caminade, Juliette and Markus von Wartburg, The Success of Third-Party Apps on the App Store, April 2022.
ii The New York Times, “Has the Pandemic Changed Dating Forever?” May 7, 2021.
iii Counterpoint Research, “iPhone Reaches Highest Ever Monthly Market Share in China,” December 1, 2022.
iv See e.g., Reuters, “China’s video game makers come in from the cold as crackdown eases,” January 19, 2023.
v Business of Apps, “Food Delivery App Revenue and Usage Statistics (2022),” May 4, 2022; Business of Apps,
“Deliveroo Revenue and Usage Statistics (2022),” May 4, 2022.
vi Grocery Dive, “Weee Aims to be the Top Grocer for Asians in North America,” October 7, 2020; Business of Apps,
“Deliveroo Revenue and Usage Statistics (2022),” May 4, 2022.
vii NPR, “China Is Imposing Strict Lockdowns To Contain New COVID Outbreaks. But There’s A Cost,” September 2,
2021.
viii Forbes, “The Growth of Subscription Commerce," July 15, 2022.
ix Statista, “Digital Market Outlook.”
x Statista, “Digital Market Outlook.”
xi Statista, “Digital Market Outlook.”
xii United Airlines, 10-K 2021.
xiii The New York Times, “Those Seatback Screens on Planes Are Starting to Disappear,” January 1, 2018; Forbes,
“Airlines Sound The Death Knell for In-Flight Seatback Screens,” October 13, 2019.
xiv RubyGarage, “Why Banks Need Mobile Apps: 7 Significant Benefits,” June 20, 2018.
xv Belleflamme, Paul, and Nicolas Neysen, “Platform Strategies: A Guidebook for Entrepreneurs in the Platform
Economy,” (1st ed.), Routledge, 2023.
xvi Evans, David and Richard Schmalensee, “Matchmakers: The New Economics of Multisided Platforms,” Harvard
Business Review Press, 2016.
xvii Belleflamme, Paul, and Nicolas Neysen, “Platform Strategies: A Guidebook for Entrepreneurs in the Platform
Economy,” (1st ed.), Routledge, 2023.
xviii Statista, “Digital Market Outlook.”
xix Statista, “Digital Market Outlook”; Conviva, “Conviva’s State of Streaming Q2 2022”; Comscore, “UK Share of
App Minutes and Unique Visitors, 2022” and “US Share of App Minutes and Unique Visitors, 2022”; other market
research.
xx Comscore “UK Share of App Minutes and Unique Visitors, 2022”; Comscore, “US Share of App Minutes and
Unique Visitors, 2022”; Conviva, “Conviva’s State of Streaming Q2 2022”; Quantum Marketer, “Spotify Statistics
2023: Users, Market Share, Growth & Revenue”; Company Annual Reports; other market research.
xxi StatCounter; United Nations 2022 World Population Prospects; Newzoo; JustWatch; Parks Associates; Strategy
Analytics.
xxii Statista, “Mobility Market Outlook”; Statista, “Digital Market Outlook”; eMarketer, “Country Retail mCommerce
Sales”.
xxiii J.P. Morgan, “2020 E-Commerce Payments Trends Report;” other market research.
xxiv StatCounter; Comscore, “Mobile Commerce Analysis Report,” 2018.
xxv Forbes, “Why the U.S. Still Lags Behind China in Mobile Wallet Adoption,” June 25, 2019.
xxvi Marketwatch, “Venmo and Square’s Cash App Were Going Gangbusters Before the Pandemic – Now They’re
Doing Even Better,” June 20, 2020.
xxvii iResearch.
xxviii Statista, “Digital Payments – India.”
xxix StatCounter; United Nations 2022 World Population Prospects; Newzoo.
xxx Omdia, “App Ecosystems Forecast – 2022–2027,” February, 2023.
