NBER WORKING PAPER SERIES
DESIGNING QUALITY CERTIFICATES:
INSIGHTS FROM EBAY
Xiang Hui
Ginger Zhe Jin
Meng Liu
Working Paper 29674
http://www.nber.org/papers/w29674
NATIONAL BUREAU OF ECONOMIC RESEARCH
1050 Massachusetts Avenue
Cambridge, MA 02138
January 2022
We are grateful to eBay for providing access to the data. None of us has a significant financial
relationship with eBay. The content and analyses in this paper reflect the authors' own work and
do not relate to any institution or organization with whom the authors are affiliated. All rights
reserved. All errors are our own. The views expressed herein are those of the authors and do not
necessarily reflect the views of the National Bureau of Economic Research.
NBER working papers are circulated for discussion and comment purposes. They have not been
peer-reviewed or been subject to the review by the NBER Board of Directors that accompanies
official NBER publications.
© 2022 by Xiang Hui, Ginger Zhe Jin, and Meng Liu. All rights reserved. Short sections of text,
not to exceed two paragraphs, may be quoted without explicit permission provided that full
credit, including © notice, is given to the source.

Designing Quality Certificates: Insights from eBay
Xiang Hui, Ginger Zhe Jin, and Meng Liu
NBER Working Paper No. 29674
January 2022
JEL No. D47,D82,L86
ABSTRACT
Quality certification is a common tool to reduce asymmetric information and enhance trust in
marketplaces. Should the certificate focus on seller inputs such as fast shipping, or include output
measures such as consumer ratings? In theory, incorporating output measures makes the
certificate more relevant for consumer experience, but doing so may discourage seller effort
because outputs can be driven by random factors out of seller control. To understand this tradeoff,
we study a major redesign of eBay's Top Rated Seller (eTRS) program in 2016, which removed
most consumer reports from the eTRS criteria and added direct measures of seller inputs. This
change generates immediate selection on certified sellers, and homogenizes the share of certified
sellers across product categories of different criticalness in consumer ratings. Post the regime
change, sellers improve in the input measures highlighted in the new certificate. These effects are
more conspicuous in categories that had less critical consumer ratings, in part because the new
algorithm automatically removes the potential negative bias for sellers in critical markets and a
clearer threshold motivates sellers to just reach the threshold. The new regime also makes sales
more concentrated towards large sellers, especially in the categories that face more critical
consumers.
Xiang Hui
Washington University in St Louis
Ginger Zhe Jin
University of Maryland
Department of Economics
College Park, MD 20742-7211
and NBER
Meng Liu
Washington University in St Louis
1 Introduction
Since Akerlof (1970), economists view reputation and quality certification as two mechanisms to
address asymmetric information on quality. Many online platforms generate and aggregate buyer
feedback on sellers. Accordingly, a large literature examines how buyers respond to online seller
reputation, what determines the content of online reputation, and how changes in an online repu-
tation system affect buyers and sellers (Tadelis, 2016). In comparison, much less attention is paid
to quality certification, although it is widely used by many online platforms in parallel with online
reputation. In this paper, we study a major redesign of the quality certificate on a leading online
marketplace.
As a pioneer in e-commerce, eBay has become a textbook example of online reputation. In a
nutshell, consumer feedback of past transactions helps to distinguish between reputable and non-
reputable sellers, which in turn motivates sellers to earn and maintain a good consumer rating on
eBay. However, consumer feedback is imperfect, as consumers may not observe all aspects of sellers’
true quality, some reviews may be inauthentic or exaggerated, and many factors out of seller control
could affect consumer experience (e.g., logistic delays due to shipping carriers). Out of retaliation
and other concerns, the distribution of consumer feedback is highly skewed on eBay (on average,
99% of feedback ratings are positive), which could make eBay’s rating system less informative than
an ideal reputation system if consumers interpret the ratings literally.
As well as recording feedback, eBay has accumulated years of other data on seller performance,
including Detailed Seller Ratings (provided by consumers but less visible to most buyers than
percentage positive ratings), consumer claims, consumer returns, seller cancellations, and package
tracking. Some of them, similar to the public-facing consumer feedback, reflect consumer-generated
output, which may be subject to noise out of seller control. However, other metrics such as seller
cancellations and package tracking are more directly related to seller inputs, and could help eBay
identify slacking sellers and address the moral hazard problem.
In 2009 eBay adopted a certification program (eBay Top Rated Sellers, or eTRS), awarding
the eTRS badge to sellers that meet certain criteria. The initial design of eTRS aimed to cap-
ture comprehensive information about a seller’s quality performance (including consumer feedback,
Detailed Seller Ratings, consumer claims, consumer returns, seller cancellations, late shipping),
though consumers can observe both the eTRS badge and consumer feedback on eBay.
Interestingly, in February 2016, eBay narrowed the eTRS criteria to a subset of input measures,
1
and decoupled eTRS from consumer feedback and other output measures that consumers report
to eBay. At the first glance, the decoupling reduces the information contained in the eTRS badge,
which seems to not only defy the common wisdom of the more information the better, but also
deviate further from consumer-reported experience. However, consumer feedback is always visible
to consumers, and thus it is a priori unclear how the decoupling would affect buyers, sellers, and
the whole platform.
Based on the classical principal-agent theory, we develop a model to characterize how sellers
would respond to a new eTRS system that removes consumer-generated noise. The model yields a
few insights: (1) a certificate that no longer conditions on output measures is immediately friendlier
to sellers that operate in a product category with more critical consumers; (2) an emphasis on
input rather than output measures should encourage seller efforts on the focal inputs, and a clearer
threshold may motivate sellers to just reach the threshold; and (3) the algorithmic change and
the resulting effort change may make the proportion of certified sellers more homogeneous across
markets with different output noise.
To test these predictions, we use eBay’s proprietary data from October 2014 to August 2016.
Since the old eTRS system requires badged sellers to satisfy some standards on the output measures
(e.g., consumer feedback, detailed seller ratings, consumer claims), we define consumer criticalness
of a product category as the share of transactions that are considered “bad” based on the old eTRS
system out of all transactions that are considered “good” based on the new eTRS system. By
definition, it captures the noise in the old eTRS system that arises due to criticalness in ratings,
rather than seller misperformance based on the input-based measures according to the new eTRS
requirements.
Since the new regime eliminates most output measures from the eTRS criteria and thus reduces
the noise driven by consumer criticalness, we observe a more homogeneous share of certified sellers
across categories immediately after the introduction of the new eTRS. Six months into the new
regime, sellers demonstrate significant improvement in the input measures highlighted by the new
regime, and the improvement is larger in less critical markets, mostly because the new algorithm
automatically removes the potential negative bias for sellers in critical markets and thus these
sellers have less pressure to reach the new threshold relative to sellers in non-critical markets. For
sellers whose metrics are near the new threshold upon the announcement of the new eTRS criteria,
we observe a significant threshold effect: those just below the threshold improve much more than
those just above it.
2
We also explore seller heterogeneity in seller size. Because the old eTRS system uses metrics
that average across all the qualifying orders of a seller, a seller that completes a smaller number of
orders is subject to greater randomness in each average metric. However, the noise from seller size
could benefit or harm a small seller: a mediocre seller could get badged if his small clientele is too
nice to give negative feedback, but a hardworking seller may not qualify for the badge if his small
clientele is unusually picky. In our data, we find that the new algorithm has a greater negative
selection effect on larger sellers (where seller size is measured by the number of eTRS-qualifying
orders before the regime change), which in turn motivates larger sellers to improve more in the
eTRS-highlighted metrics post the regime change. That being said, the effort improvement of large
sellers is less in critical markets than in non-critical markets, because the new algorithm becomes
friendlier to sellers in critical markets. We also find sales become more concentrated in critical
markets (relative to non-critical markets) after the regime change, probably because large sellers
can gain more from the eTRS status and the average item value is higher in critical markets.
Our results have a few implications for market designers and digital platforms. First, there is
a trade-off between information relevance and noise when deciding whether to use output-based
measures, such as consumer reports, in quality certification. Our study focuses on one design
approach: certifying sellers entirely based on seller input while providing output-based measures as
a separate signal. This design approach can preserve the informativeness of different information
sources and reduce the noise in certification to incentivize seller effort. Second, reducing noise in
certification has two opposing effects on seller effort: it encourages seller effort, as the principle-
agent theory predicts, but also discourages some sellers’ effort, as they can more precisely target
their effort level to just meet the certification threshold. Market designers need to consider these
two forces when choosing the amount of noise in certification requirements. Lastly, if a quality
certification uses input-based criteria, it may result in consumers’ benefiting from a homogenization
of certified sellers across markets if consumers value the ability of interpreting the certification signal
consistently across different markets.
1.1 Literature Review
Our results highlight how noise in consumer reports and the discrete nature of quality certifica-
tion affect seller behavior, thus enriching the classical welfare comparison between reputation and
certification (Shapiro, 1983; Leland, 1979). Specifically, our paper contributes to a few strands of
empirical literature.
3
The first relevant strand of literature studies the design of information disclosure and certi-
fication systems. As summarized in Dranove and Jin (2010), “from cradle to grave, consumers
rely on quality disclosure to make important purchases.” Because consumers value information on
seller quality, well-designed information disclosure can select high-quality sellers into the market
and encourage their quality provision efforts. One of the earliest empirical studies that leverage
abrupt changes in consumer information for identification is Jin and Leslie (2003), who show that
mandatory display of hygiene quality grade cards motivates restaurants to improve hygiene quality.
Since then, there have been a plethora of papers that use natural experiments to study the effect of
information disclosure on seller behavior. A summary of these papers can be found in Dellarocas
(2003), Dranove and Jin (2010), and Einav et al. (2016).
In our context, quality disclosure takes the form of the eTRS program. Previous work has
shown that consumers value the eTRS certificate, and that it is equivalent to a 7% increase in
buyer willingness to pay on eBay’s U.K. site (Elfenbein et al., 2015) and a 3% increase in sales
price on eBay’s U.S. site (Hui et al., 2016). Additionally, certification requirements can have a large
impact on seller selection and behavior: In the context of eBay, Hui et al. (2017) show that the
stringency of the eTRS certificate affects the quality distribution of entering sellers, and Hui et al.
(2020) show that adding an intermediate certification tier can mitigate the reputation “cold-start”
problem of young, high-quality sellers. Outside eBay, Farronato et al. (2020) show that occupational
licensing adds little information value above and beyond consumer ratings on a platform that offers
home services. In comparison, Jin et al. (forthcoming) find that partial and mandatory licensing of
food sellers on Alibaba, following the 2015 Food Safety Law of China, improved the average quality
of surviving food sellers.
Our paper contributes to this literature by studying how different content in certification re-
quirements, namely input-based or output-based information, affects seller incentives and market
outcomes. We find that the dichotomous nature of certification matters, because rational sellers
will target their effort to just meet the threshold — a behavior that has also been documented in
contexts where ratings are rounded to half a star (Hunter, 2020).
The certification in our context is partially based on consumer reports. Therefore, our paper also
relates to a big literature that studies the value of consumer feedback, both as an informational
device for buyers and as a motivational device for sellers. Regarding consumer feedback as an
informational device, researchers have shown that higher reputation leads to higher prices and
sales in various contexts, including e-commerce (Chevalier and Mayzlin (2006), Vana and Lambrecht
4
(2021) and Park et al. (2021)), online labor markets (Barach et al. (2020)), review websites (Luca
(2016)), the hotel industry (Hollenbeck et al. (2019)), and eBay (Dewan and Hsu (2004), Resnick
et al. (2006), and Saeedi (2019)). Ratings also improve consumer welfare (e.g., Wu et al. (2015),
Lewis and Zervas (2016), and Reimers and Waldfogel (2021)). See Dellarocas (2003) and Tadelis
(2016) for summaries of this line of work.
Regarding consumer feedback as a motivational device, Cabral and Hortacsu (2010) have shown
that eBay sellers change their effort in response to negative feedback. Recently, a growing empirical
literature shows that the design of rating systems can have profound effects on market outcomes.
For example, many marketplaces use bilateral rating where both buyers and sellers can rate each
other. However, bilateral rating gives sellers an opportunity to retaliate on buyers who leave them
negative feedback and, therefore, dilutes the value of ratings (Dellarocas and Wood, 2008; Bolton
et al., 2013; Fradkin et al., 2019). Moving from bilateral to unilateral rating systems — where only
buyers can rate sellers, increasing market transparency — can further increase seller effort (Klein
et al., 2016) and improve the pool of surviving sellers in the marketplace (Hui et al., 2018). Besides
its impact on the distribution of quality in the market, rating systems can also affect other market
outcomes such as innovation (Leyden, 2021).
Our paper contributes to this line of work by studying the benefits and costs of using consumer
reports in the eTRS certificate. Specifically, our results suggest that the noise borne in consumer
reports can demoralize sellers, and that the market designer needs to weight the informational
benefit of incorporating consumer reports against its negative effect on effort incentives. These
results shed light on the optimal aggregation of input- and output-based quality measures, such as
the first steps taken by Dai et al. (2018).
2 Background
In this section, we describe eBay’s reputation and certification systems. In 1995, eBay began using a
reputation system where buyers and sellers can rate their experience as positive, neutral, or negative
after each transaction. eBay then aggregates this feedback into two metrics on the item listing page:
percent positive (number of positive ratings divided by the sum of positive and negative ratings)
and feedback score (count of positive ratings minus count of negative ratings). Later, in 2008,
eBay switched to a unilateral feedback system in which only buyers are allowed to leave negative
feedback to sellers. In addition, buyers can choose to give Detailed Seller Ratings (DSR) to a seller
5

Table 1: Misperformance measures included in eBay’s eTRS criteria
Before After
1. Negative or neutral feedback (/)
2. Low DSR on item as described (/)
3. Buyer claims (/) Unresolved buyer claims (*)
4. Seller cancellation (*) Seller cancellation (*)
5. Low DSR on shipping time (/) Late delivery based on tracking information (*)
Notes: (*) denotes input-based measures; (/) denotes output-based measures; DSR means Detailed Seller Ratings.
in four dimensions: item as described, communication, shipping speed, and shipping charge. Unlike
the classical feedback system, DSR use a 5-star scale and are anonymous in that the seller cannot
tell the identity of the reviewer.
Besides feedback and DSR, eBay introduced the eBay Top Rated Seller (eTRS) certification
program in September 2009. The goal was to endorse sellers who meet a quality threshold based
on consumer feedback, DSR, and the platform’s internal data. In particular, sellers are evaluated
on the 20th of each month against a set of requirements. The eTRS requirements during the
sample period before the regime change (from October 2014 to January 2016) consist of two parts.
First, a seller needs to have a minimum of $1,000 in sales and 100 transactions in the past 12
months. Second, a seller cannot have a defect rate greater than 2%, where defect includes negative
or neutral feedback (measure 1 in Table 1), 1- or 2-star rating on item-as-described DSR (measure
2), buyer claims due to item being not as described or not received (measure 3), seller cancellations
(measure 4), and 1- or 2-star rating on shipping speed DSR (measure 5). The evaluation period
for the defect rate is the past three months if a seller has at least 400 transactions in the past three
months; otherwise, it is based on the transactions in the past twelve months.
In September 2015, eBay announced a change in eTRS requirements, effective February 2016.
1
The goal of the policy change was to create a simpler and more objective standard. Specifically,
defects in the new criteria are limited to two measures: unresolved buyer claims where eBay finds
the seller at fault (a subset of previous measure 3) and seller cancellation (same as previous measure
4).
2
Because of this change, eBay reduced the maximum defect rate from 2% to 0.5% for eTRS
eligibility.
3
In addition, eBay introduced a new measure for shipping performance, namely whether
1
See the cached (historical) announcement page on 09/11/2015 at http://bit.ly/3t93hPm.
2
When a buyer files a claim on an order and the seller cannot resolve it in three days, the case is escalated to
eBay. It is counted as a defect if eBay decides the seller is at fault.
3
This adjustment was made so that there would be no significant change in the number of eTRS sellers, according
to eBay’s policy announcement.
6

the seller ships out the item on time according to the tracking information.
4
In comparison, the old
system measured shipping time by buyer-reported DSR only. This change places more emphasis
on seller effort toward timely shipping rather than the realized delivery time and, therefore, shields
the seller from potential delay of the shipper. Accordingly, eBay sets the maximum late delivery
rate as 5% in the new eTRS criteria and takes late delivery out of the defect counts.
In short, the new certification regime moves from output-based to input-based measures. Out-
puts such as non-positive feedback (measure 1), low DSR on item-as-described (measure 2), and
resolved buyer claims (part of measure 3) no longer count towards seller defects, and the metric on
shipping time is based on tracking information rather than consumer reports (measure 5). These
changes reduce the noise embedded in consumer-reported outputs, which could arise because of
third-party faults (e.g., shipper delay) or subjective evaluation. As a result, sellers may find it
easier to manage and predict future eTRS eligibility. For example, a seller eager to earn the eTRS
badge may refund the buyer when there is a claim, refrain from cancellation, and ship the item as
soon as possible.
In theory, many measures mentioned above are visible to an attentive buyer familiar with
the eBay system. In reality, the visibility of the metrics used varies and depends on how they
are aggregated and presented by eBay. Figure 1 shows two example listings of Apple iPad: the
upper one is from a non-badged seller with 100% positive feedback and a total feedback score of
3093. Clicking on the seller’s name leads to the seller’s profile page, which has more details about
the seller’s positive, neutral, and negative feedback as well as his star ratings in the four DSR
dimensions. Using clickstream data from eBay, Nosko and Tadelis (2015) show that less than 1%
of buyers ever go to the seller’s profile page. This implies that DSR are much less visible to buyers
than aggregate consumer feedback metrics (positive feedback and feedback score).
The lower example in Figure 1 is from another seller with 98.4% positive feedback, a total
feedback score of 1556, and a Top Rated Plus badge on the upper right corner of the page. This
badge is shown on the listing page when the seller is qualified for the eTRS and offers one-day
handling plus 30-day return for this particular listing.
5
A buyer can also click on the seller’s profile
page for more detailed seller status such as “Top Rated”, “Above standard”, or “Below standard.”
However, since less than 1% of buyers visit the seller profile page, the visibility of the eTRS badge
largely depends on whether an eTRS seller offers fast handling and easy return on a particular
4
If tracking information is not available, eBay will ask the buyer if the item was delivered on time when she leaves
feedback and the delivery will be considered late if the buyer indicates late delivery.
5
During the sample period, the Top Rated Plus badge resembles a gold medal, the same as the one in Figure 2.
7

Figure 1: Example Listing Pages
(a) Example 1: A listing without an eTRS plus badge
(b) Example 2: A listing with an eTRS plus badge
listing. Around 70% of listings from eTRS sellers have the Top Rated Plus badge, partly because
of the rule on badge visibility and partly because an eTRS seller will receive a 10% discount off the
commission fees on any of her listings with the eTRS badge.
Another difference in visibility is on the search page. Figure 2 shows how two listings appear
together on a search page. This page is loaded when buyers search for products, which usually
occurs before buyers click on a listing page. The badge is highlighted on the search page, but
consumer feedback and DSR do not appear on this page.
In combination, Figures 1 and 2 imply that the eTRS certification is more salient to buyers
than aggregate consumer feedback metrics, which are in turn more salient than DSR on the seller
profile page that consumers rarely visit. If we define reputation as consumer perception of a seller
based on consumer reports of the seller’s past behavior, the eBay setting suggests that aggregate
consumer feedback metrics — namely percent positive and total feedback score — contribute much
8

Figure 2: Example Search Page
more to seller reputation than DSR do.
In comparison, some measures in the eTRS system — for example, buyer claims (measure
3 in Table 1) and seller cancellation (measure 4) — are not shown to buyers anywhere but are
incorporated in the eTRS certificate. While buyer claims are still a form of consumer-reported
output, the new system excludes resolved buyer claims and thus puts more emphasis on seller
effort to resolve buyer claims. This change does not completely rule out consumer-driven noise,
because consumers decide whether, when, and how to file a claim.
3 Model
3.1 Model Setup and Predictions
In this section, we present a stylized model describing the impacts that the new eTRS regime
could have on individual sellers. Consider one period in a market of many sellers and even more
homogeneous buyers. Each seller offers one unit of a standard product with zero production cost.
Each buyer may purchase at most one unit. We assume the product on sale is good enough relative
to the buyer’s outside option, and thus every product is sold at a price that is equal to its expected
quality given the buyers’ information set.
Suppose the true quality of seller j (q
j
) solely depends on seller effort e
j
. We assume that
buyers do not observe e
j
directly, but observe a binary certificate signal provided by eBay. The
key question for eBay is how to construct the certificate signal in order to motivate seller effort to
maximize the platform’s interest. This is a classical principal-agent problem: eBay is the principal
9

that cares about the overall sales revenue (because its commission is a fixed fraction of sales), while
each seller wants to maximize his own sales minus effort costs.
Here we model seller effort as one dimension. In reality, seller effort can be multi-dimensional,
for example, one on shipping and handling and one on answering customer questions about the
product. In that case, consumers may perceive seller quality as a sum of seller efforts in all
dimensions, and eBay may provide multiple signals for multi-dimensional efforts, for example a
summary of consumer feedback (“reputation”) and the eTRS (“certificate”). Even if the signals
are not orthogonal, as long as their definition is known to the public, rational consumers can
redefine them so that each signal captures one dimension of effort independent of other dimensions.
In this sense, our model can be thought as a model of one-dimensional effort conditional on other
dimensions of effort already being covered by other signals.
Let us assume eBay observes a noisy proxy s
j
for e
j
, where the noise
j
conforms to a normal
distribution with mean zero and standard deviation σ:
s
j
= e
j
+
j
j
∼ N (0, σ).
In the old system, eBay defines a binary certificate signal eT RS
old
= 1 if the sum of the proxy s
j
and another noise (
R
j
) is above a minimum threshold κ. We introduce
R
j
to reflect noisy consumer
opinion not captured in seller reputation, not directly observable to consumers, but embodied in
the old eTRS, for example DSRs and resolved buyer claims.
eT RS
old
j
= 1 if s
j
+
R
j
= e
j
+
j
+
R
j
≥ κ
The new eTRS system simplifies the certificate signal based on s
j
only. This is equivalent to
excluding
R
j
:
eT RS
new
j
= 1 if s
j
= e
j
+
j
≥ κ.
Because the eTRS is calculated by an absolute threshold, whether a seller can qualify for the
eTRS depends on not only his effort but also the mean and dispersion of the noises. We assume
R
conform to a normal distribution with mean µ
R
and standard deviation σ
R
:
R
j
∼ N (µ
R
, σ
R
).
10

We allow
R
j
to be biased in the mean because the seller may operate in a product category in
which consumers are known to be harsh (µ
R
< 0) or lenient (µ
R
> 0). As a result, sellers in a
harsh category were subject to a higher eTRS standard in the old system than in the new system
(i.e. s
j
≥ κ − µ
R
vs. s
j
≥ κ). This leads to an algorithmic selection effect:
Prediction 1: The change in eTRS requirements will immediately improve the certificate signal
for seller j if j operates in a category subject to more consumer criticism on average (µ
R
< 0) and
consumer opinion is removed from the new certificate.
The more negative µ
R
is, the more improvement there should be in the new certificate signal.
By definition, these changes are driven by the eTRS algorithmic change before seller j adjusts
efforts.
To complete the model, we assume eBay’s payoff is proportional to total sales on the platform:
π
eBay
∝
X
j
E(q
j
|eT RS
j
)
but seller j must incur effort costs that are increasing and convex in e
j
. Hence seller j’s problem is
choosing e
j
to maximize his expected revenue net of eBay commission (at rate r) and effort costs:
π
j
= (1 − r) · E(q
j
|eT RS
j
) − C(e
j
).
Apparently, moral hazard arises because the principal (eBay) does not observe seller effort
and would like all sellers to exert maximum effort despite their private effort costs. In a classical
principal-agent model (for example Baker (1992)), the principal would set the agent’s wage con-
ditional on an observable outcome that depends on agent effort. Here, eBay does not pay wages
to sellers directly but seller revenue depends on buyer perception of seller quality, which in turn
depends on the certificate signal provided by eBay. In this sense, the eTRS signal can be translated
into signal-based revenue to sellers. The strength of the incentive depends on the noises in the
signal, and how the signal affects consumer belief of seller quality.
Because the certificate signal is binary, we have:
π
j
= (1 − r) · E(q
j
|eT RS
j
) − C(e
j
)
= (1 − r) · {prob(eT RS
j
= 1) · E(e
j
|eT RS
j
= 1) + prob(eT RS
j
= 0) · E(e
j
|eT RS
j
= 0)} − C(e
j
)
= (1 − r) · {E(e
j
|eT RS
j
= 0) + prob(eT RS
j
= 1)
| {z }
P rob of eT RS
· [E(e
j
|eT RS
j
= 1) − E(e
j
|eT RS
j
= 0)]
| {z }
quality premium for eT RS=∆q
} − C(e
j
)
11

Let F(.) represent the CDF of standard normal, we have
prob(eT RS = 1) = prob(e
j
+
j
+
R
j
≥ κ)
= 1 − F
κ − e
j
− µ
R
q
σ
2
+ σ
2
R
At the optimal choice of e
j
, the marginal cost of effort should be equal to the marginal benefit
of effort, which depends on how e
j
affects the probability of reaching the eTRS threshold and how
consumers perceive the average e
j
conditional on the seller’s eTRS status. However, consumer’s
quality expectations are not specific to seller j’s actual effort, they are only conditional on seller
j’s eTRS status. Hence, the quality premium for badged sellers, denoted as ∆q, is a constant from
seller j’s perspective if the seller is only one of many sellers in the same market. Consequently, let
f(.) denote the pdf of standard normal, we can derive seller j’s first order condition with respect
to e
j
:
(1 − r) ·
∂prob(eT RS
j
= 1)
∂e
j
· ∆q =
∂C
∂e
j
(1 − r) · f
κ − e
j
− µ
R
q
σ
2
+ σ
2
R
·
∆q
q
σ
2
+ σ
2
R
=
∂C
∂e
j
(1 − r) · ∆q · f
κ − e
j
− µ
R
q
σ
2
+ σ
2
R
=
∂C
∂e
j
·
q
σ
2
+ σ
2
R
Figure 3 plots the two sides of the equation respectively as a function of e
j
, for a seller that
operates in a critical market (µ
R
< 0) and has constant marginal cost of effort (MC). Their
intersection denotes the optimal e
j
, if we assume seller j takes ∆q as given. As shown in Figure 3,
the impact of the new eTRS regime on e
j
can be decomposed into three parts:
• Effect 1 on e
j
|∆q: Reduce overshooting (undershooting) in the categories with
µ
R
< 0 (µ
R
> 0). In the old regime, sellers in a category with harsh consumer criticism
(µ
R
< 0) must exert extra efforts to reach the eTRS threshold, as indicated by point A. This
overshooting is no longer necessary in the new regime, as indicated by point B. The effort
change from A to B is a reduction in overshooting. This effect is reversed in a lenient product
category (µ
R
> 0), because, sellers in that market were closer to the threshold in the old
regime but this institutional help is no longer available in the new regime, and thus they
12
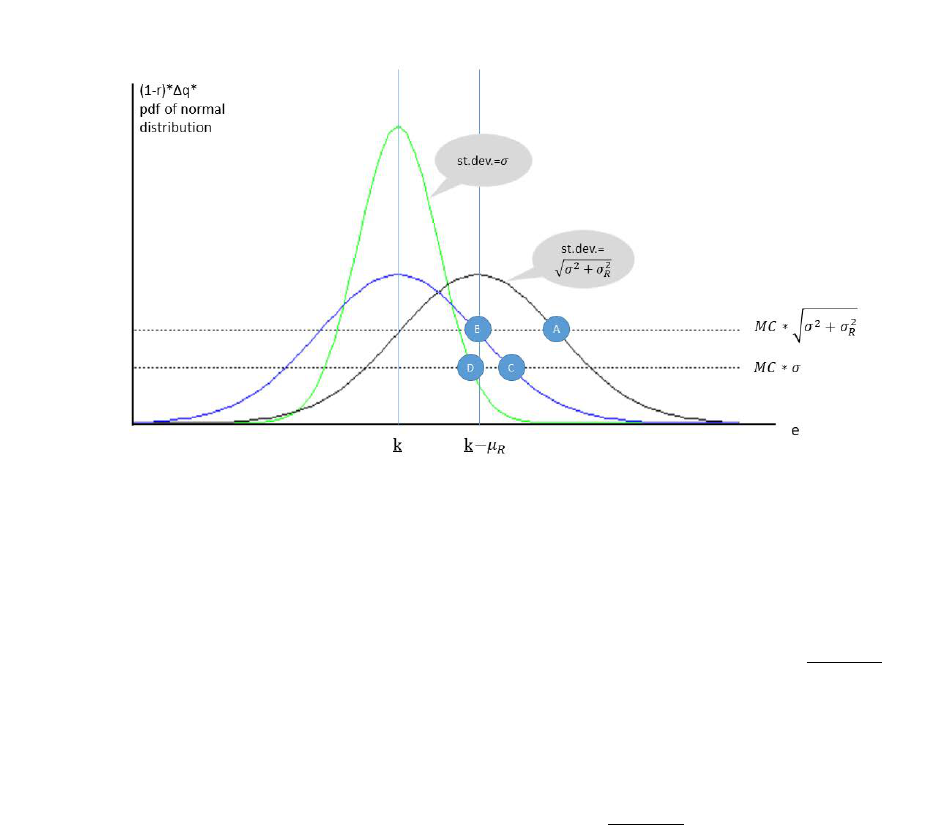
Figure 3: Decomposition of the Impact of the New Regime on Individual Seller Effort (assume
µ
R
< 0)
must exert more efforts to reach the same threshold. This is a reduction of undershooting.
• Effect 2 on e
j
|∆q: Motivate more effort to target a more precise goal: because the
standard deviation of the noise in the new eTRS certificate is reduced from
q
σ
2
+ σ
2
R
to σ,
sellers can better predict how their effort affects the probability of reaching the eTRS thresh-
old. Following the standard principal-agent theory, reducing noise in performance outcome
can translate effort into outcome more effectively, thus motivating effort. In Figure 3, this
amounts to a reduction of the right hand side from MC ·
q
σ
2
+ σ
2
R
to MC ·σ, which implies a
move from point B to point C. Note that this change is independent of µ
R
regardless whether
the seller operates in a harsh or lenient category. Moreover, illustrated in Figure 3 is a seller
whose marginal cost is low enough so that he has tried to reach the eTRS even in the old
regime. If the seller’s marginal cost is sufficiently high, he may have given up on eTRS in the
old regime but finds it worthwhile to aim for eTRS in the new regime. In that case, Effect 2
would be greater than what is shown in Figure 3 because point B in that case should denote
zero effort in the old regime.
• Effect 3 on e
j
|∆q: Sharpen the classical threshold effect. Reduced noise in the new
13

eTRS also makes the marginal benefit of effort more sensitive to the distance to the threshold.
When the effort is below but close to the threshold, the gain from extra effort increases sharply
in the new regime; but when the effort exceeds the threshold or is far away from the threshold,
the gain from extra effort drops sharply. In Figure 3, this effect is represented by moving the
bell curve from blue to green, resulting in a reduction of effort from point C to point D. Like
Effect 2, this effect is sensitive to the magnitude of σ
R
but independent of µ
R
.
The above three effects assume individual sellers take the market-wide quality premium ∆q as
given. However, when every seller adjusts his effort in the new regime, consumers will update ∆q
accordingly. This brings:
• Effect 4: Consumers update the quality premium for badged sellers (∆q). When
sellers adjust e
j
because of the above three effects, the adjustment on ∆q tends to go to the
opposite direction: for example, sellers in a harsh category (µ
R
< 0) were known to face a
higher threshold in the old system (κ − µ
R
), thus consumers had reason to believe that those
badged in the old system were of higher quality. When the new system restores the threshold
to κ, sellers in the harsh category find it easier to reach the new threshold, which also implies
that rational consumers should lower the quality premium for badged sellers. This market-
wide adjustment counters Effect 1. Conversely, if the new eTRS motivates most sellers to
barely pass the threshold, consumers should believe that the average quality of badged sellers
is barely above the threshold. This market-wide adjustment counters Effect 3. Furthermore,
if everyone is motivated to exert more effort because the certificate signal is more precise
(Effect 2), it may be cancelled out in the relative difference between badged and non-badged
sellers.
In combination, we have:
Prediction 2: The new eTRS system has ambiguous effects on e
j
, depending on how the above
four effects play out in sum.
Later on in the empirical section, we will present evidence on the overall effort changes before
and after the eTRS regime shift (a sum of the four effects), the relative effort changes in critical
versus non-critical categories (Effect 1), seller efforts around the new eTRS threshold (Effect 3),
and the change in the average quality premium for eTRS-certified sellers (Effect 4).
The above two predictions focus on individual seller incentives in a product category with
specific µ
R
and σ
R
. Assuming the distribution of seller’s marginal cost of effort (M C) is the same
14
across categories, we can compare the effect of the new eTRS regime across categories. In particular,
Effects 1, 2 and 3 imply that individual seller’s effort choice will become more homogenized across
categories because the new system eliminates the incentive differential driven by category-specific
µ
R
and σ
R
. Effect 4 speaks to the quality premium of eTRS within each category, which depends
on µ
R
and σ
R
as well. If seller efforts are more homogenized across categories, ∆q should also be
more homogenized because it reflects consumer expectation of average effort conditional on eTRS
status. This implies:
Prediction 3: The new eTRS system may homogenize the probability of getting eTRS certified
across categories, if every product category has the same distribution of marginal cost of effort
among individual sellers.
We will provide evidence for Prediction 3 by studying temporal changes in the distribution of
certified sellers across product categories.
3.2 Numerical Simulation in eTRS
The model clarifies that the new regime eliminates µ
R
and σ
R
from eTRS criteria. Later on, we
will compute average consumer criticalness across categories, which corresponds to a distribution
of µ
R
and will naturally lead to variations in σ
R
.
A less obvious source of variation for σ
R
is seller size. Sellers of different size are subject to
different amount of noise because all eTRS-relevant metrics are averaged across a seller’s qualifying
orders. Assuming draws of
R
are independent across orders, the mean of this random noise (µ
R
)
may be the same for different sellers in the same category, but a seller with more qualifying orders
will have a more precise average metric relative to his true quality (and thus a lower σ
R
).
To illustrate how µ
R
and σ
R
affect the certificate signal in the old eTRS system, we conduct
a numerical simulation where every seller makes maximum effort in the actual performance (say,
sellers always describe the item perfectly, always ship immediately, and never cancel), but a seller
earns an eTRS certificate if and only if the defect rate observed by eBay is no higher than 2%.
The signal reflects an average of previous consumer reports on the seller, and each consumer report
conforms to a Bernoulli distribution with probability p for value 1 (i.e., a bad consumer report)
and 1 − p for value 0 (i.e., a good consumer report). One can think of these binary signals as
low DSR ratings on the seller-profile page, or claims that consumers file to eBay. Given this, the
seller’s probability of getting eTRS badge follows a binomial distribution. To fit in our model,
the simulation is equivalent to setting µ
R
= −p (negative because DSR and consumer claims are
15

criticism by definition) and σ
R
=
q
p(1−p)
n
where n is the seller’s total number of qualifying orders.
To reflect different consumer criticalness in different product markets, we assume p is fixed in
each category but ranges from 0 to 1 across categories. On seller size, we consider two types of
sellers in each product category: a small seller has only 20 orders qualified for eTRS calculation,
while a big seller has 2000 qualified orders. For each type of sellers in a category with criticalness
p, we simulate the probability of being certified for a typical small seller and a typical big seller in
that category. Figure 4 presents the simulated results. The horizontal axis is consumer criticalness
p. The vertical axis is the probability that a seller satisfies the old eTRS requirement. The vertical
line indicates the 2% cutoff. We present two curves for small and large sellers respectively.
Figure 4: Seller Size and Rating Criticalness
Notes: This figure plots the probability of being certified against rating criticalness for a typical small seller
and a typical big seller. Sellers always deliver high quality, and rating criticalness is the probability of getting
a negative feedback. The certification bar is at 98% positive feedback, as repented by the vertical line. The
probabilities are calculated using the binomial probability mass function.
Figure 4 demonstrates two patterns. First, the probability of getting certified decreases by
consumer criticalness for all sellers. This reflects Prediction 1: when the draw of the noise is more
negative on average (µ
R
< 0), the certificate signal is more negative. Second, when consumer
reports are more accurate than the certificate cutoff (p < 2%, the left side of the vertical line),
small sellers are more vulnerable to consumer criticalness than large sellers. Essentially, the Law
of Large Numbers guarantees that a perfect-performing large seller will almost always pass the
minimum threshold, but chances play a bigger adverse role for sellers with only a few transactions.
This pattern is reversed when consumer criticalness is larger than the certificate cutoff (p > 2%,
the right side of the vertical line), because it is easier for a small seller to have enough lucky draws
16

to get above the certificate cutoff.
What does the regime change mean in our simulation? Because the new eTRS system excludes
consumer feedback, low DSRs, and resolved buyer claims, it essentially lowers p to p
0
for all markets,
where p
0
reflects other noises that remain in the new system (e.g. cancellation due to factors out
of seller control or traffic jam from the seller’s warehouse to the postal office). This implies that we
should observe less heterogeneity across critical and non-critical markets, conditional on the same
seller performance. However, as long as p
0
is positive, heterogeneity across small and big sellers still
exists, and how that heterogeneity changes depends on where p and p
0
are in reality. If p is to the
left of the certification threshold, say around 1%, then a reduction to p
0
would disproportionately
benefit small sellers, as they were more adversely affected by the old eTRS rules than big sellers. If
p is to the right of the certification threshold, say around 3%, then a reduction to p
0
would benefit
big sellers, because they are almost never certified under the old eTRS rules.
In short, the simulation emphasizes the importance of the interaction between feedback crit-
icalness of a market and seller size on the algorithmic selection effect: the regime change should
immediately benefit all sellers in more critical markets; additionally, it should disproportionately
benefit small sellers in non-critical markets and large sellers in critical markets. These insights are
consistent with Prediction 1. Lastly, small and large sellers may become more homogenized in the
share of certified sellers after the regime change, as (a simple extension of) Prediction 3 indicates.
4 Data
4.1 Sample Construction
We use proprietary data from eBay’s U.S. site. Our starting point is the set of all listings on
eBay from 11 months before to 11 months after the month when eBay announced the eTRS regime
change, excluding the listings in Motors and Real Estate categories. We define three periods based
on the policy announcement date and implementation date: “before” refers to the 11 months
before the policy announcement (October 20, 2014 to September 19, 2015); “interim” refers to
the 5 months between the policy announcement and its implementation (September 20, 2015 to
February 19, 2016); “after” refers to the 6 months after the policy implementation (February 20 to
August 19, 2016).
6
To focus on professional (rather than occasional) sellers, we first condition the
6
The policy announcement date is September 11, 2015. Therefore, the first month in the interim period is the
first full month after the policy announcement.
17

sample construction on sellers who had sold at least $5,000 in the year before the month the policy
was announced. We then keep sellers who listed at least one item in each of the before, interim,
and post periods, to mitigate the potential problem of dynamic entry and exit.
To better understand across-market variations, we remove small markets from a total of 428
markets on eBay, where a market refers to a product category as defined by eBay.
7
Specifically, we
remove all markets with less than $300,000 in sales in the first three months of the sample period,
including one market with missing sales data. This procedure leaves us with a sample of 380,978
sellers in 336 markets, which accounts for 99.7% of the total sales without market restrictions.
Conditional on these sellers, we aggregate transaction data at the seller and seller-month levels for
seller analysis, and at the market-month level for market analysis.
4.2 Summary Statistics
Our goal is to test our model’s predictions of how a regime change from output-based to input-based
certification requirements would affect (1) the algorithmic selection of eTRS certified sellers before
any effort change by sellers; (2) how sellers may respond to the regime change in their effort choice;
and (3) how markets may become homogenized as the new regime eliminates some cross-market
differences from the certification criteria. The first item is an automatic change that immediately
happened when eBay announced the new eTRS algorithm, in September 2015, while the other two
items are endogenous changes that may occur after the announcement date.
To illustrate market trends, in Figure 5 we plot monthly averages of some key variables from
sellers included in our sample. To get a data point in the figure, we first get a summary statistic
for each market in a month, and then we calculate the average of that summary statistic across
markets. Month 0 refers to the first month of the new eTRS policy implementation (February 2016),
as illustrated by the black vertical lines. eBay announced the then forthcoming eTRS change in
Month -5, as illustrated by the blue vertical lines. All monthly averages are normalized by the value
in the first month of our sample (i.e., October 2014), to keep eBay’s business data confidential.
Because a key heterogeneity in our model is consumer criticalness in a market, we plot the series
separately for non-critical and critical markets. We define consumer criticalness in a market by the
share of transactions that were considered defect in the old eTRS system out of all transactions
that are considered good in the new system. For example, these transactions contain packages that
were scanned by the post office on time but received a low DSR on shipping speed. The share of
7
Examples of categories include Video Games, Women’s Clothing, and Cell Phones & Smartphones.
18
these transactions among all transactions that would be good under the new eTRS criteria gives
us a continuous measure of consumer criticalness at the market level. Throughout the paper, we
label a market “critical” if its criticalness is above the median of all 336 sampled markets, and
“non-critical” otherwise. By definition, we have 168 critical markets and 168 non-critical markets.
Figure 13a plots the normalized sales volume (in USD) over time. The data points exhibit
strong seasonality, as indicated by large spikes in sales in Month -3 (November 21 to December
20, 2015) and in the same calendar month the previous year (Months -15). There are no obvious
changes in overall sales before and after the policy announcement month for either market type.
Figure 13b shows a clear increase in the number of eTRS-certified sellers after the policy im-
plementation. Moreover, this increase is larger in critical markets than in non-critical markets.
The reason is twofold. First, as stated in Prediction 1, because consumer criticalness is larger in
critical markets (corresponding to µ
R
< 0 in the model), the algorithmic change that eliminates
µ
R
in certification will lead to disproportionately badging more sellers in critical markets. Second,
the algorithmic selection also incentivizes sellers to change their behavior subsequently because of
reasons described in Prediction 2, which can also contribute to a higher share of eTRS sellers after
the policy implementation. Specifically, sellers overall seem to demonstrate better performance in
the input measures highlighted by the new eTRS system: while Figure 13c and Figure 13d show
no clear overall change in unresolved claim rate and seller cancellation, both measures are lower
in critical markets, consistent with the argument that the new regime incentivizes sellers in these
markets to exert more effort (Effect 2 under Prediction 2). In Figure 13e, sellers seem to have
an overall decrease in late delivery after the policy announcement, although this can be partially
driven by the pre-existing trend. However, month-by-month variation in this measure is clearly less
after the regime change, suggesting that sellers may have taken this measure more seriously in the
new eTRS regime.
Lastly, Figures 13f, 5g, and 5h plot three output measures that are no longer included in the new
certification requirements: the share of transactions that have items not as described (as reported
in DSR or buyer claims), the share of transactions that have items not received, and the share of
positive feedback ratings among all consumer feedback. We do not observe any systematic change
in these measures neither across time nor across markets.
19
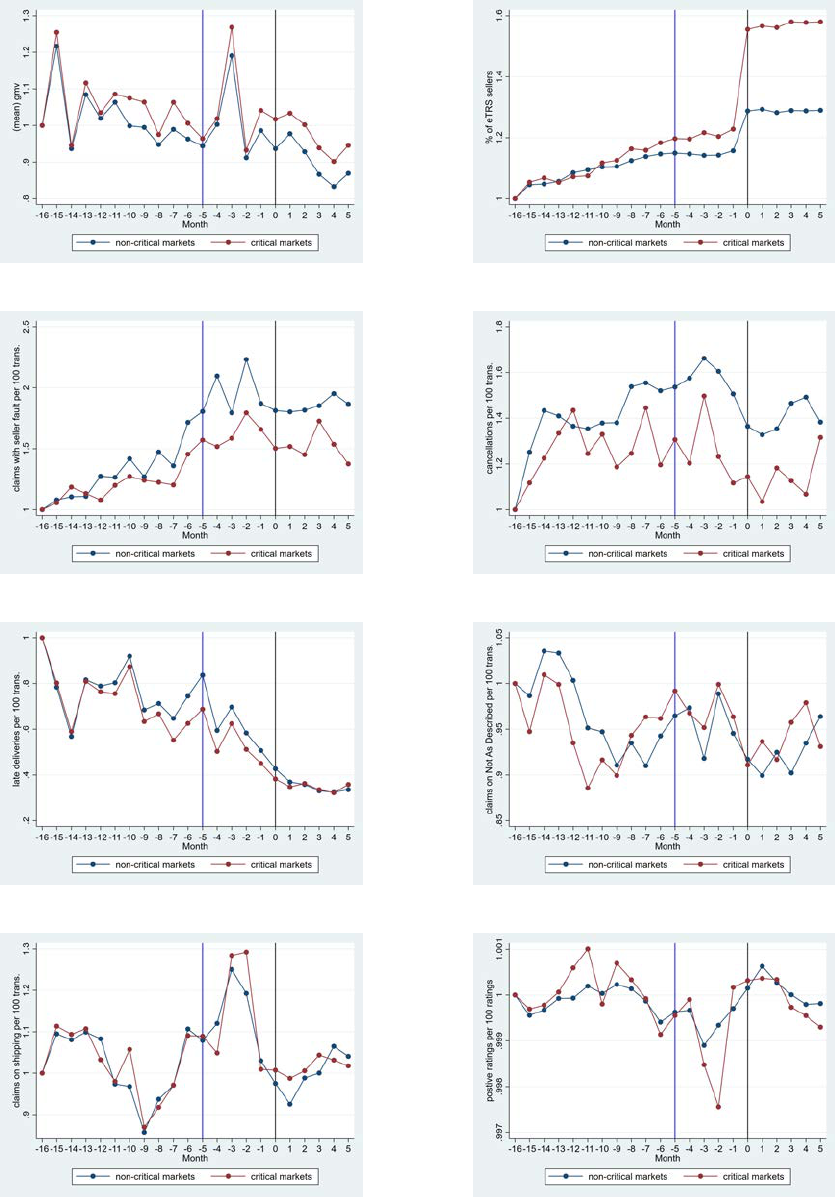
Figure 5: Normalized Time Series by Rating Criticalness
(a) sales volume (USD) (b) share eTRS sellers
(c) share transactions with unresolved claim (d) share transactions with seller cancellation
(e) share transactions with late delivery (f) share transactions not as described
(g) share transactions not received (h) share of positive feedback if any
Notes: All variables are normalized by the value in the first month of our sample. Rating criticalness is defined as
the share of transactions that are considered “defect” by the old system out of all transactions that are considered
good by the new system. Markets are divided into non-critical and critical based on a median split. Blue and black
vertical lines indicate the policy announcement and implementation months, respectively.
20

4.3 Certification Premium
A necessary condition for sellers to care about certification is that it must benefit certified sellers,
as has been established in previous papers using eBay data (Elfenbein et al., 2015; Hui et al., 2016).
For confirmation, we estimate the eTRS premium in our sample and describe how it changes before
and after the eTRS regime shift. Recall that Effect 4 in Prediction 2 predicts that the badge
premium could go either way.
Because the degree of eTRS certification differs greatly by product, we match transactions from
certified and non-certified sellers by product ID and calendar week of sales.
8
The goal of matching
is to control for unobserved product heterogeneity and temporal demand and supply shocks that
could be correlated with sales price and a seller’s eTRS status. The matching procedure yields
a sample of 101,642 unique sellers in 126 markets, with more than 6 million transactions in our
sample period. We then regress the logarithm of sales price on whether a seller of that listing had
earned the eTRS badge at the sales time, and its interaction with a dummy of the new regime,
controlling for the seller’s percent of positive feedback, product-week fixed effects, and seller fixed
effects.
Estimation suggests that being an eTRS seller is associated with a 1.5% increase in sales price
before the regime change, and 1.8% after, with both estimates and the difference being statistically
significant at the 1% level. These positive premiums imply that sellers should have an incentive to
meet the eTRS requirements both before and after the regime change.
5 Results
5.1 Algorithmic Selection by Market Criticalness and Seller Size
As described in Section 3, the regime change should have two effects: an immediate effect on
which sellers are certified by the new eTRS algorithm, based on their previous performance, and a
subsequent, indirect effect when sellers choose to adjust their efforts in response. We refer to the
former as algorithmic selection, and to the latter as seller behavioral change.
To measure the selection effect, we simulate a seller’s hypothetical eTRS status by applying
the new requirements against the seller’s performance metrics on the policy announcement date
(September 2015, or Month -5). At that time, sellers had not yet had an opportunity to change
8
Product ID is eBay’s finest catalog, which is defined for homogeneous products only. For example, an unlocked
128GB black iPhone 12 has a unique product ID that is different from that of another version of iPhone.
21

their efforts in response to the new policy, so the difference between the seller’s actual and simulated
eTRS status should capture only algorithmic selection.
9
Our model predicts the algorithmic selection effect should differ by consumer criticalness across
markets and by seller size. Figure 6 plots the algorithmic selection effect (subject to measurement
error) across a continuous, market-specific measure of consumer criticalness. Each circle represents
a product subcategory (market) as defined by eBay. On the y-axis is a ratio between the number
of simulated eTRS sellers upon the policy announcement (Month -5) in market m and the actual
number of eTRS sellers at that time in that market according to the old algorithm. Since we may
not report the exact value of the ratio, we normalize it by a constant. Note that this ratio is smaller
than the one in almost all markets in our sample, which means that the algorithm has a negative
selection effect in almost all markets. On the x-axis is the average consumer criticalness of the
market (in percentage points, based on data from the three months before the policy announcement
date (i.e., Month -8 to -6), as defined in Section 4. Circle size corresponds to total dollar sales of
the market in these three months (Months -8 to -6).
We draw a few insights from Figure 6. First, we find that almost all markets experience negative
selection from the algorithm change. That is, the share of sellers who meet the new certification
requirements is significantly smaller than the share of eTRS under the old regime. A big part of the
drop in the eTRS share is mechanical and a direct outcome of the difference between the old and
the new system — sellers were targeting their behavior towards the old system, which naturally
warrants a lower probability of meeting the new requirements, because we define selection as the
change in the eTRS share by applying the new criteria to the existing behavior of sellers. Secondly,
there is a clear positive correlation between the simulated change in eTRS sellers and consumer
criticalness. This is consistent with Prediction 1 and the corresponding numerical simulation in
Figure 4: sellers are handicapped in markets with harsh criticalness; as a result, the new regime
generates greater positive selection for sellers in these markets. Lastly, the figure suggests that
markets with more consumer criticalness tend to have a larger sales volume.
9
Note that there could be measurement errors when we simulate a seller’s eTRS status. For example, we observe
the number of unresolved claims (or other certification metrics) that a seller received. If eBay first thought the seller
is at fault but reversed the decision after the seller appealed with more evidence, that transaction should no longer
be counted as a defect by eBay. However, we would still label this instance as a defect because we do not observe
metrics revision in our sample. In the presence of measurement errors, we can no longer be certain of the absolute
magnitude of the algorithm selection effect, because the difference between the actual and simulated eTRS status
on the policy announcement date reflects not only algorithmic selection but also measurement error. Despite this
shortcoming, we can still study how the relative selection effect differs by market type and seller size if we assume
that the measurement error is independent of the two variables. Additionally, we can still study changes in seller
behavior by comparing simulated eTRS status over time if we assume that the measurement error is constant over
22

Figure 6: Selection by Rating Criticalness
Notes: Rating criticalness on the x-axis is the share of transactions that are considered defect by the old
system out of all transactions that are considered good by the new system. The ratio on the y-axis is based
on sellers’ simulated and actual eTRS status on the announcement date. We normalize this ratio by a
constant. Circle size corresponds to dollar sales in Month -8 to -6.
Next, our conceptual framework predicts that when consumer criticalness is below the old eTRS
cutoff, removing consumer criticalness from the certification requirements would immediately select
more small sellers into the eTRS certification; on the other hand, the selection should be more
positive for sellers in critical markets where sellers were subject to larger noise in certification. To
test these patterns using real data, in Figure 7, we plot the “before” (Month -5) and simulated
(at Month -5) shares of eTRS sellers across different percentiles of seller sizes, where seller size
is measured by the number of qualifying orders based on a seller’s historical sales at the time
of the policy announcement (recall that the method for order counts does not change with the
regime shift). We do this separately for critical and non-critical markets. To comply with the
data agreement, the simulated shares of eTRS sellers are normalized by a constant (i.e., the same
constant across time for both sub-figures). The vertical line around the 90 percentile is the cutoff
time.
23
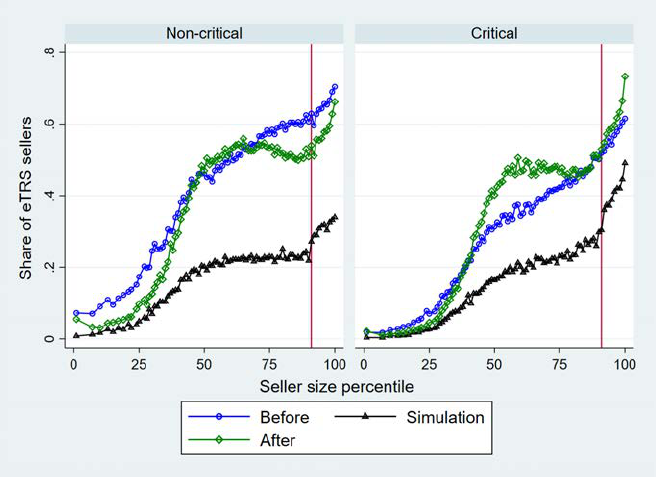
Figure 7: Policy Effect by Seller Size and Rating Criticalness in Markets
Notes: Rating criticalness is defined as the share of transactions that are considered defect by the old system
out of all transactions that are considered good by the new system. Markets are divided into non-critical
and critical based on a median split. Vertical line indicates the percentile cutoff for large sellers. Simulated
share of eTRS sellers (represented by triangles) is normalized by a constant. “Before” refers to Month -5;
simulation is done at Month -5. “After” refers to Month 5.
for large sellers. By both old and new algorithms, sellers that have 400 or more orders in the past
three months are defined as “large”, and their performance metrics are computed based on orders
in the past three months rather than the past twelve months.
Several patterns emerge from Figure 7. First, the share of certified sellers increases in seller size
most of the time, regardless of the type of market and whether the share is actual or simulated.
This makes sense because (1) the certification has requirements on a minimum number of past sales
and (2) seller size may be positively correlated with seller quality.
Second, Figure 7 suggests that the algorithmic selection is more positive (or less negative) in
critical markets than in non-critical markets. This can be seen from a smaller negative distance
between the simulated curve and the “before” curve for all seller sizes. There are two reasons for
this result. First, fixing effort, sellers are less likely to be badged in critical markets because of
more criticism in consumer reports — a key insight shown in our numerical exercise in Figure 4 and
in Prediction 1. The second reason is the behavior incentives induced by the noisier certification
requirements under the old regime. We will elaborate on this point in Section 5.2, where we analyze
sellers’ change in behavior. But the key idea is that in the presence of consumer reports in the
24

certification requirements, on the one hand, sellers that intend to be badged need to overshoot
on quality metrics that they can control in order to overcome consumer criticalness (Effect 1 in
Prediction 2) and to mitigate the uncertainty in consumer reports (Effect 3 in Prediction 2). To
the extent that seller size is a proxy for seller quality, this explains why the black curve (simulated
eTRS at Month -5) is higher for large sellers in critical markets than for large sellers in non-critical
markets. On the other hand, sellers with higher effort costs may be discouraged from exerting effort
because of the noise in certification (Effect 2 in Prediction 2); therefore, the black curve is slightly
lower for the smallest (a proxy for lower-quality) sellers in critical markets.
Third, the difference between the “before” and simulated shares of certified sellers is less negative
for small sellers in both non-critical and critical markets. According to our numerical simulation in
Section 3, this can happen if both types of markets are to the left of the certification threshold (the
red line at 2% in Figure 4).
10
The reason is that small sellers were disproportionately affected by
random noise because of their small number of orders, and a reduction in this noise immediately
helps them gain the eTRS badge.
Fourth, the difference between the “after” and simulated shares of certified sellers, which roughly
represents seller behavioral change (up to some measurement error in simulation and our normal-
ization of simulated shares), suggests more improvement among larger sellers. One can think of
several reasons for this result: first, larger sellers may expect more immediate benefits from their
current behavioral change, because they are subject to a shorter look-back window in the eTRS
algorithm; second, since the eTRS status brings a positive premium to each transaction, sellers
that predict a larger volume of orders should expect more benefits in total; third, larger sellers may
enjoy a greater economy of scale in their effort improvement if such improvement entails some fixed
costs.
Fifth, quality improvement is smaller among sellers that operate in critical markets. This result
is due to the behavior incentive induced by the new regime, as we elaborate in the next subsection.
Lastly, we observe homogenization in the share of certification across seller sizes and across
markets. Specifically, if we ignore the smallest sellers below the 50th percentile, the “before” curve
has a positive slope everywhere from the 50th to 100th percentiles, but the post-curve is almost flat
between the 50th and 90th percentiles and slopes up only beyond the 90th percentile. This suggests
10
This is certainly plausible because many previous papers have shown that negative feedback is rare on eBay
(around 1% among all feedback ratings). Also, sellers can contact eBay’s customer service to remove wrong negative
feedback, such as a negative rating indicating an item was not received by the buyer when tracking information shows
the item was successfully delivered.
25

that the new regime homogenizes the share of certification among sellers in the middle range of the
seller size distribution.
11
Next, to see homogenization in the share of certification across markets,
Figure 7 suggests that fewer sellers are certified in critical markets before the regime change, but
the simulated shares are much more similar across the two types of markets, and the “after” shares
of certification are essentially identical except for the largest sellers. This suggests that the cross-
market homogenization is driven by both algorithm selection and seller behavioral change, in line
with Prediction 3. More analyses on this result are presented in Section 5.3.
Now, we summarize the above findings on heterogeneity in algorithmic selection via the following
seller-level regression:
Y
i
= β
0
+ β
1
∗ Large
i
+ β
2
∗ AvgCriticalness
i
+ β
3
∗ Large
i
∗ AvgCriticalness
i
+
i
, (1)
where i denotes a seller, Y
i
is a categorical variable describing the difference between the seller’s
simulated and actual certification status in Month -5: it is equal to 1 if a non-certified seller gains a
simulated eTRS because of the new eTRS algorithm, -1 if a certified seller loses the eTRS in simu-
lation, and 0 if the simulation does not generate any status change. Moreover, Large
i
is a dummy
indicating whether seller i had at least 400 transactions in Months -8 to -6; AvgCriticalness
i
indi-
cates the degree to which seller i operates in critical markets: it is constructed based on consumer
criticalness in each market that seller i operated in during Months -8 to -6, weighted by the seller’s
sales share in that market in Months -8 to -6. Note that equation 1 is at the seller level because
a seller’s eTRS status is evaluated at the seller level (not product or listing level). Since we focus
on the selection effect at Month -5, it is based on a cross-section of 380,978 sellers, following the
sample construction procedure described in Section 4.1.
Results are reported in Table 2, and we do not report the constant term, to comply with eBay’s
data policy. From column (1), we see that on average, the net selection effect is 0.149 more negative
for large sellers, and 0.138 more positive for sellers in critical markets (relative to the scale of the
dependent variable from -1 to 1). The two coefficients correspond to the second and third points
when discussing Figure 7. In column (2), we further include an interaction of large seller and critical
markets. The positive coefficient on this interaction suggests an extra positive selection for large
11
The curvature on the first half of these curves may be an artifact of the eTRS algorithm: because sellers below the
50th percentile sold fewer than 10 orders in Months -6 and -4, many of them may not meet the minimum threshold for
eTRS inclusion (i.e., 100 orders and $1000 sales in the past 12 months). The part of the curve for these smaller sellers
tends to slope up, probably because those in a higher percentile have a greater chance of meeting the eTRS threshold
on minimum sales. This mechanical effect exists in both the old and new regimes, as the minimum threshold does
not change.
26

Table 2: Seller Selection
(1) (2)
net selection net selection
Large -0.077*** -0.091***
(0.002) (0.003)
Avg. Criticalness in operation markets 0.152*** 0.149***
(0.001) (0.001)
Large* Avg. Criticalness in operation markets 0.030***
(0.005)
Observations 424,607 424,607
R-squared 0.030 0.030
Notes: Seller-level cross-sectional regressions. Outcome is the difference between a seller’s simulated and actual
certification status on the policy announcement date. Large is a dummy for having sold at least 400 transactions
in the three months before the policy announcement. Critical is a sales-weighted measure of rating criticalness
in the markets that a seller operates in. We also control for the constant term in the regression. Standard
errors in parentheses. *** p<0.01, ** p<0.05, * p<0.1.
sellers, relative to small sellers, in critical markets. This positive coefficient is consistent with the
second point on behavior incentives in the discussion of Figure 7.
5.2 Changes in Seller Effort
5.2.1 Old Regime Induces Bimodal Effort
We start by illustrating the behavior incentive induced by the old regime, which is based on both
output- and input-based measures. Facing negative µ
R
in critical markets, sellers need to overshoot
on the input-based measures, to overcome the more critical consumer reports (Prediction 2, Effect
1). In the meantime, critical markets may also have a higher σ
R
if the random noise
R
is binary
as in our numerical simulation in Figure 4. In that case, sellers with sufficiently high effort costs
may give up on exerting effort (Prediction 2, Effect 2). Therefore, if we compare the distribution
of seller quality in critical versus non-critical markets before the policy announcement, we should
see that it has fatter tails in critical markets.
We test this hypothesis in Figure 8. In the left graph, the effort measure is based on the
old certification requirements, and is calculated based on the “before” data. The vertical line at
2% indicates the certification threshold under the old regime. The quality distribution in critical
markets (represented by hollow bars) indeed has fatter tails than that in non-critical markets
(represented by solid bars). Note that because we proxy effort by the old requirements, which
contain consumer reports, there will be larger (negative) noise in this proxy in critical markets;
27
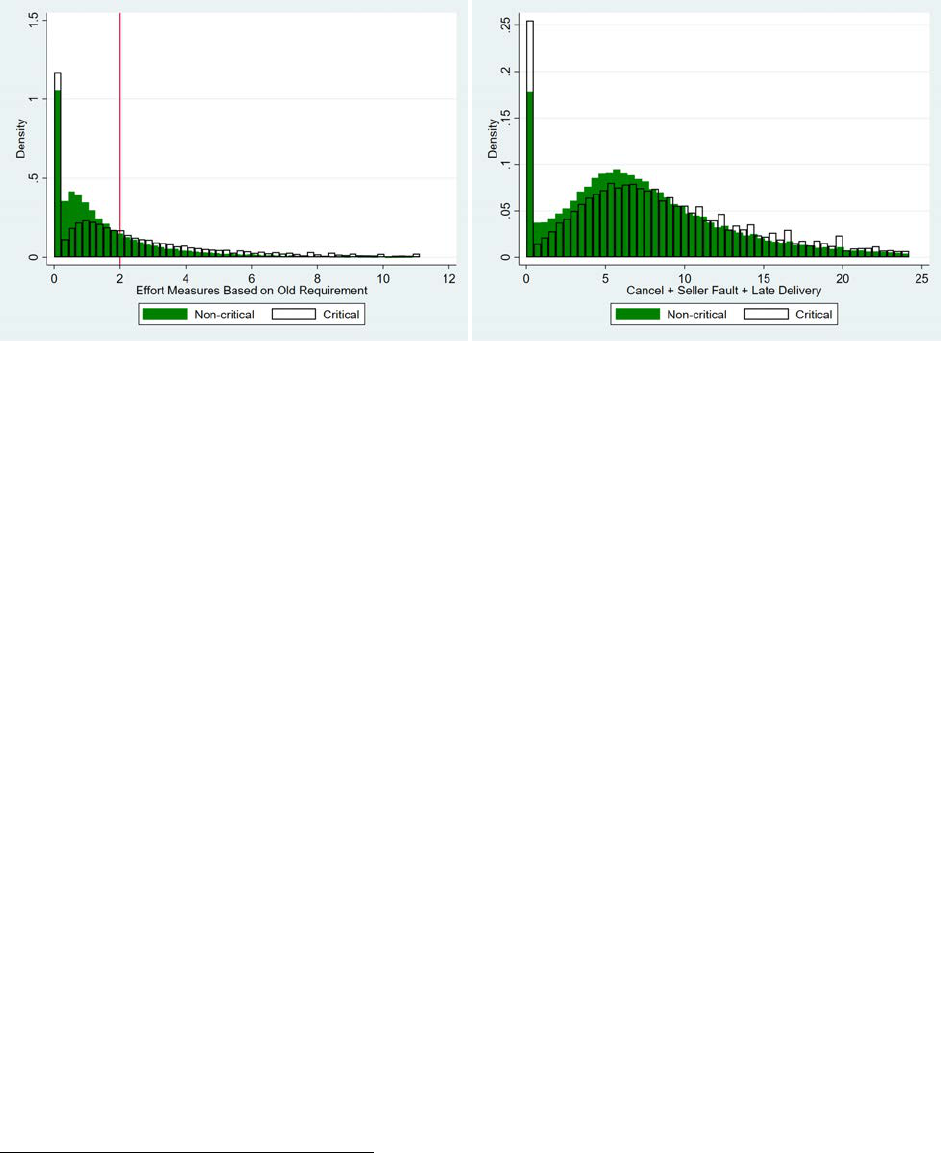
Figure 8: Quality Distribution of Sellers in Different Markets
Notes: The effort measure is based on the old certification requirements in the left graph, and based on
the new certification requirements in the right graph. Both effort measures are calculated using data from
the “before”period. Markets are divided into non-critical and critical based on a median split. Vertical line
indicates the certification threshold under the old regime.
therefore, the distribution of true effort could have even fatter tails in critical markets. To see this,
in the right graph, we use another effort measure based on new certification requirements, again
using the “before” data.
12
Here we see a clearer pattern of fatter tails in the distribution of seller
quality in critical markets. Both graphs are consistent with the behavior incentive induced by the
old certification requirements, which are in turn consistent with the shape of the black curve on
the selection effect described in Figure 7.
13
5.2.2 New Regime Induces Threshold Effect
To examine the behavior incentive induced by the new regime, we start by analyzing how seller
behavior changes over time. In Figure 9, each line corresponds to sellers’ simulated badge status
in a month. The simulation is based on seller performance evaluated in that month against the
new certification regime. We interpret the vertical distances between lines as changes in seller
effort as measured by metrics in the new eTRS requirements. As before, the evaluation is based
on transactions in the past three months if a seller has at least 400 transactions in that period, or
the past twelve months if otherwise. To preserve eBay’s data confidentiality, the values in Figure
9 are normalized by one constant so that they can be compared across time and across markets.
14
12
We do not draw a vertical line here because there are two thresholds for seller defects and late delivery rate.
13
Note that another explanation for the fatter tails is survival bias, which we discuss in Appendix A.
14
As mentioned in footnote 9, we do not observe revisions in consumer reports in our dataset; therefore, the
simulation is based on the initial consumer reports. This can explain the difference in the shape of the curve
28

Figure 9: Policy Effect on Seller Performance by Seller Size and Rating Criticalness
Notes: A seller’s eTRS status in a month is simulated based on the new requirements. Rating criticalness
is defined as the share of transactions that are considered defect by the old system out of all transactions
that are considered good by the new system. Markets are divided into non-critical and critical based on a
median split. Vertical line indicates the percentile cutoff for large sellers. Simulated shares in the two types
of markets are normalized by a constant.
A few patterns are worth noting in Figure 9. First, all sellers except the very small ones increase
their effort, as indicated by an upward shift of the curve over time. Very small sellers do not increase
their efforts, probably because they are too small to be eligible for certification. Second, the sellers
that improved their efforts improved the most in the month right after the policy announcement
(between Month -5 and Month -4).
Third, we see that effort improvement is smaller in critical markets than in non-critical markets.
This result may seem prima facie counterintuitive, because classical agent theory would predict a
higher effort incentive when the observability of effort increases (Prediction 2, Effect 2). However,
this argument ignores the binary nature of certification: once a seller has reached the certification
threshold, there is no benefit of exerting additional effort. This gives rise to the threshold effect,
which is the phenomenon that sellers target their effort level so that they just pass the threshold.
In our setting, since more sellers are already certified from algorithmic selection in critical markets
corresponding to Month 5 in the critical markets in this figure, and the shape of the curve corresponding to the
“post” period in Figure 7: medium-size sellers (between the 50th and 90th percentiles) in critical markets are more
likely to request revisions in consumer reports, such as consumer claims, because the average value of items is typically
higher in these markets and a negative report can really hurt a medium-seller’s percentage positive metrics.
29
(as shown by the higher black curve for larger sellers), they have less incentive to increase their
effort relative to sellers in non-critical markets. We will show direct evidence of the threshold effect
below.
Fourth, if we compare the effort improvement of large and small sellers (e.g., sellers in the 90th
and 50th percentiles) across the two types of markets, we see that large sellers improve their effort
less (relative to small sellers) in more critical markets. This finding is again consistent with the fact
that large sellers in more critical markets benefit more from algorithmic selection and therefore do
not need to increase their effort as much to gain the new badge.
We now provide direct evidence on the threshold effect, as described in Effect 3 of Prediction
2. In Figure 10, we plot the time series of seller effort for different seller types, where types are
defined based on seller effort in the period before the policy announcement. The left and right
graphs plot the defect rate and late delivery rate, respectively, both in percentage point terms. The
vertical lines correspond to the policy announcement month and implementation month, and the
horizontal line indicates the thresholds for both metrics under the new regime. In both graphs, we
see a convergence towards the threshold for all seller types. That is, on the one hand, sellers who
excelled in their effort measures before the policy announcement (i.e., the first black lines) shirk
and hence their effort measures gravitate towards the threshold after the policy announcement.
On the other hand, sellers who are short of the certification requirements improve their effort and
therefore their effort measures also gravitate towards the thresholds. As argued before, the fact
that sellers target the thresholds explains why the improvement in quality provision is smaller in
critical markets.
We adopt a regression-discontinuity design (RDD) to identify the threshold effect with more
rigor. Recall that the new certification requirements take into account two metrics: defect rate and
late delivery rate. To construct the sample for our RDD analyses, we find sellers who meet the bar
on defect rate but whose late delivery rate is between 4% and 6% (i.e., within 1% around the 5%
threshold). Because we want to capture seller types with these metrics, they are computed based
on the “before” data, and the average is based on look-back windows depending on seller sizes.
We focus on sellers who meet the bar on defect rate but vary in whether they meet the bar on
late delivery rate because the latter is much more binding than the former; we do not have many
sellers (an order of magnitude less) to do the analogous RDD where sellers meet the more binding
requirement on late delivery rate but do not meet the less binding requirement on defect rate.
30
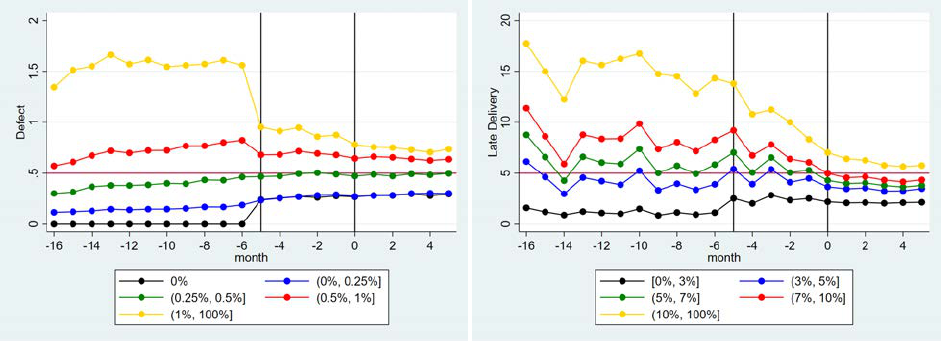
Figure 10: Threshold Effect
Notes: The effort measure is based on the old certification requirements in the left graph, and based on the
new certification requirements in the right graph. Vertical lines indicate the policy announcement month
and implementation month. Horizontal line indicates the certification thresholds under the new regime.
We estimate the threshold effect using the following seller-month-level regression:
Y
it
=
q=3
X
q=1
β
q
∗ P re
q
∗ N otBadgedSim
i
+ γ
1
∗ P ost
Announce,t
∗ N otBadgedSim
i
+ γ
2
∗ P ost
Implement,t
∗ N otBadgedSim
i
+ η
i
+ ξ
t
+
it
,
(2)
where Y
it
is the outcome variable for seller i in month t; NotBadgedSim
i
equals 1 if seller i
does not meet the new certification requirement on the policy announcement date by simulation;
P ost
Announce,t
is the dummy for the months after the policy announcement month; P ost
Implement,t
is the dummy for the months after the policy implementation month; P re
3
is the dummy for Month
-13, -12, and -11; P re
2
is the dummy for Month -10, -9, and -8; P re
1
is the dummy for Month -6
and -7; η
i
and ξ
t
are seller and month fixed effects, respectively.
Our parameters of interest are γ
1
and γ
2
, which capture the difference in the temporal changes
in effort between sellers that are immediately selected to be eTRS by the algorithm and those that
are not, among the set of sellers who are in the RDD sample we constructed before. The βs capture
any pre-existing differences in the two groups of sellers before the policy announcement. Since the
omitted group in the regression is Month -16, -15, and -14, all these estimated coefficients should
be interpreted relative to the difference in the baseline outcome in these three months.
Results are reported in Table 3. Column (1) shows that sellers who are simulated not to be
badged (i.e., those with a pre-existing average late delivery rate between 5% and 6%) improve
31

on delivery speed relative to sellers who are simulated to be badged (i.e., those between 4% and
5%) after the policy announcement date. This result is consistent with the threshold effect that,
relatively speaking, sellers just below the bar are motivated to exert effort because the marginal
benefit of doing so is large, and sellers just above the bar tend to shirk to stay just above the bar.
In column (2), we control for P ost
2
and find that the threshold effect is even stronger also after the
policy implementation date. In column (3), we add the dummies for the months before the policy
announcement and the insignificant estimates are consistent with the parallel trend assumption.
Table 3: Threshold Effect
(1) (2) (3) (4) (5) (6)
late late late defect defect defect
delivery delivery delivery
NotBadgedSim*P ost
Announce
-0.622*** -0.456*** -0.449*** -0.016 -0.013 -0.005
(0.042) (0.052) (0.070) (0.015) (0.017) (0.018)
NotBadgedSim*P ost
Implement
-0.313*** -0.313*** -0.006 -0.006
(0.058) (0.058) (0.023) (0.023)
NotBadgedSim*Pre3 0.047 0.002
(0.067) (0.007)
NotBadgedSim*Pre2 -0.015 0.016**
(0.071) (0.008)
NotBadgedSim*Pre1 -0.009 0.016*
(0.078) (0.009)
Observations 1,013,079 1,013,079 1,013,079 1,013,079 1,013,079 1,013,079
R-squared 0.102 0.102 0.102 0.091 0.091 0.091
seller FE X X X X X X
month FE X X X X X X
Notes: One observation is a seller-month. Outcome variables are late delivery rate and defect rate in percentage
point terms. NotBadgedSim equals 1 if the seller does not meet the new certification requirement on the policy
announcement date. P ost
Announce
and P ost
Implement
are the dummies for the months after the policy announcement
month and implementation month, respectively. Pre3 is the dummy for Month -13, -12, and -11; Pre2 is the dummy
for Month -10, -9, and -8; Pre1 is the dummy for Month -6 and -7. The omitted group in the regression is Month -16,
-15, and -14. We also control for the constant term in the regression. Standard errors in parentheses and clustered
at the seller level. *** p<0.01, ** p<0.05, * p<0.1.
In columns (4) to (6), we estimate equation 2 using the monthly defect rate as the outcome
variable. Unlike the results on late delivery rate, we do not see any statistically significant change
in sellers’ defect rate after the policy announcement. This makes sense because all the sellers
in our estimation sample had met the bar on defect rate before the policy announcement date;
therefore, the threshold effect predicts that they should have little incentive to further improve on
this measure, which is what we see.
32

5.3 Homogenization of Share of Certified Sellers across Markets
According to Prediction 3, there should be a potential homogenization in the share of certified
sellers across markets. To review the argument, because the old certificate criteria include noisy
consumer reports, different markets may vary in the average level of consumer criticalness (µ
R
)
or its dispersion (σ
R
). As a result, sellers in critical markets may overshoot, sellers in non-critical
markets may undershoot, and all sellers have a hard time aiming for a clear threshold. These
variations should be reduced under the new regime because of algorithmic selection and seller
behavioral change.
Figure 11 plots the distribution of the share of certified sellers across all 336 markets in each
month before and after the regime change. The six lines with cold colors represent the share of
sellers with actual eTRS in the months before the regime change (Month -6 to -1), the lines with
warm colors represent the share of sellers with actual eTRS in the months after the regime change
(Month 0 to Month 5), and the light blue line corresponds to the density of the simulated eTRS
status upon policy announcement (Month -5) normalized by a constant.
Figure 11: Share of Certified Sellers across Markets
Notes: Lines with cold (resp., warm) tones are for months before (resp., after) the policy change. The light
blue line corresponds to simulated eTRS status, normalized by a constant.
There are three takeaways from this graph. First, the center of the distributions shifts to
the left when we apply the new eTRS algorithm on sellers (from warm hues to light blue) even
without the normalization, indicating that the immediate algorithmic selection effect of the policy is
negative. Next, the location of the cold-hue distributions is to the right of the light blue distribution,
33
indicating that the new eTRS algorithm motivates more seller effort on average, consistent with
Figure 7. More importantly, the across-market distribution of the share of eTRS sellers becomes
more concentrated with the new algorithm in both the simulated eTRS and the actual eTRS. This
indicates that the across-market homogenization is driven by algorithm selection (Prediction 1) and
across-market improvement in seller efforts (Prediction 2).
5.4 Sales and Market Concentration
So far, we have established the effect of the eTRS regime change on the algorithmic selection and
behavioral changes of sellers. The reason for this focus is that our conceptual framework is mainly
about expected seller quality, because the model assumes that each seller sells only one unit and
there are more buyers than sellers so that every seller can sell. In reality, a higher expectation on
seller quality could help sellers to achieve a higher price and more sales. If the policy effect on
sales differs across sellers, as is the case for quality provision, then the regime change can alter the
probability of sales across sellers, changing seller concentration within each market. To the extent
that critical markets may be more affected by the removal of noise, we leverage the following DiD
specification at the market-month level:
Y
mt
= β
1
∗ 1
critical,m
∗ P ost
Announce,t
+ β
2
∗ 1
critical,m
∗ P ost
Implement,t
+ η
m,
˜
t
+ µ
m
+ ξ
t
+
mt
, (3)
where Y
mt
are outcomes in market m in month t; P ost
Announce,t
and P ost
Implement,t
are the dummies
for whether month t is after the policy announcement (Month -5) and implementation (Month 0)
date, respectively; 1
critical,m
indicates whether market m is critical (depending on whether its ex
ante measure of consumer criticalness is above or below the median); and µ
m
and ξ
t
are market and
month fixed effects, respectively. We also use η
m,
˜
t
,
˜
t ∈ {1, 2, 3, 4}, which is market-specific quarter
fixed effects, to control for different seasonality in markets. All regressions cluster standard errors
by market. The times series of the market outcomes are reported in Figure 13 in the Appendix.
Results are reported in Table 4. In columns (1) and (2), the outcome variables are logarithm
of sales in USD and in quantity. There are no statistically significant differences in these variables
across markets with different rating criticalness neither after the policy’s announcement nor after
its implementation.
Next, we study how sales and market concentration change. The outcome variables in columns
(3) and (4) are the logarithm of the number of sellers who have any sales and the logarithm of the
34

Table 4: Sales and Market Concentration
(1) (2) (3) (4) (5) (6)
log(sales log(sales log(number log(HHI) share sellers share sales
volume quantity) sellers with with sales (USD) from
USD) any sales) who are small small sellers
1
critical
∗ P ost
Announce
-0.101 -0.067 -0.093 0.025 -0.011*** -0.008
(0.129) (0.091) (0.071) (0.031) (0.002) (0.005)
1
critical
∗ P ost
Implement
-0.003 -0.013 -0.026* 0.076** 0.002* -0.001
(0.033) (0.025) (0.015) (0.030) (0.001) (0.004)
Observations 7,479 7,479 7,479 7,450 7,450 7,450
R-squared 0.868 0.928 0.944 0.953 0.982 0.970
market FE X X X X X X
month FE X X X X X X
market-quarter FE X X X X X X
Notes: Market-month level regressions. Post1 and post2 are dummies for transactions after the policy announcement
date and implementation date, respectively. Critical is a dummy based on the median split. We use market-quarter
FE to control for market seasonality. HHI ranges from 0 to 10,000. Observations with top and bottom 1 percentiles of
outcome variables removed. In parentheses are standard errors clustered at the market level. *** p<0.01, ** p<0.05,
* p<0.1.
HHI index (potentially ranges from 0 to 10,000) based on dollar sales per seller in our sample. For
both measures, there are no significant changes post policy announcement, because at that time
the new eTRS policy had yet to be implemented and buyers had not observed any changes related
to the new certification requirements. Post policy implementation, in critical markets there is a
decrease in the share of sellers who successfully made a sale and an increase in HHI, relative to
non-critical markets. Both estimates suggest that critical markets become more concentrated in
sales post policy implementation.
Lastly, we study changes in the market share of small sellers. Column (5) shows that out
of all sellers with positive sales, the proportion of small sellers becomes smaller in more critical
markets. In column (6), the outcome variable is the share of sales (in dollars) that come from small
sellers. While the estimates are not statistically significant, the signs are negative. Therefore, both
estimates suggest that small sellers are less likely to sell and they have a smaller (but not statistically
significant) market share when they sell in more critical markets after the regime change.
Taken together, these results suggest that the certification regime change from output-based
to input-based metrics may alter market concentration in the long run. Prima facie, one would
expect such a regime change to benefit small sellers more, because in the old regime random noise
of consumer opinion is less likely to cancel out in the average metrics for small sellers than for big
35

sellers. However, our framework and empirical evidence suggest that the exact impact on market
concentration would depend on market conditions and, in particular, on the specific rules of the
certification requirements.
15
In our setting, sellers gain the eTRS status at the seller level (instead
of at the item level) and a seller needs to have a minimum number of past sales to be eligible for
certification. Both rules make the incentive to improve effort stronger for large sellers. The results
on market concentration may flip in other marketplaces where these two rules are different.
6 Conclusion
We study a major redesign of the certification program of a leading e-commerce platform. The
redesign changes the certification metrics from output-based to input-based, by replacing some
consumer reported outputs with more input-oriented and more verifiable measures. From the
platform’s perspective, the key trade-off is that incorporating output measures into certification
metrics makes it more relevant for the ultimate consumer experience, but doing so may discourage
seller effort because consumer-reported outputs can be driven by random factors out of seller control.
We find that the policy change causes an immediate algorithmic selection effect, which dispro-
portionately helps small sellers eligible for certification and the sellers that operate in the markets
that faced more consumer criticalness before the regime change. Moreover, the new regime mo-
tivates sellers to exert effort, especially those close to the new threshold. Both the algorithmic
selection and its induced behavioral changes homogenize the share of certified sellers across mar-
kets, which may arguably provide a more consistent experience for consumers.
Overall, the new regime reduces the bias and noise in the eTRS certificate and encourages seller
effort to meet the new certification criteria. In addition, a clearer goal generates a threshold effect
and discourages seller effort once a seller’s average metrics satisfy the new threshold. Our results
suggest that an input-based certification can affect market concentration and within-platform com-
petition in the long run. The magnitude of these effects would depend on the specific rules of
the certification and, in particular, on how sellers can reap the benefits of certification by exerting
effort.
Our study is subject to a few caveats. First of all, the analysis is based on a 22-month period of
a single marketplace in the U.S. Lessons learned from this exercise may not be readily applicable
to other marketplaces, other times, or other countries. Second, because all sellers in our sample are
15
Fradkin and Holtz (2021) present a similar argument that the impact of rating design depends on specific market
institutions.
36

subject to the regime change, we do not have a clean control group. We can only compare different
groups of sellers on the same platform, assuming that other important factors are comparable for
these sellers before and after the regime change. Third, we do not observe the costs of seller effort;
therefore, we cannot say much about the overall welfare impact of the new eTRS system. Although
we observe an increase in sales concentration in critical markets (relative to non-critical markets),
this change may be welfare enhancing because large sellers may be more responsive to the eTRS-
provided incentives and more cost-efficient in effort improvement. Finally, we do not have any
information on consumer search, which could change in light of the new certification system and
how the certificate is incorporated in the platform’s search algorithm. The role of certification in
consumer search is a topic that warrants future research.
References
Akerlof, George A., “The Market for “Lemons”: Quality Uncertainty and the Market Mecha-
nism,” The Quarterly Journal of Economics, 1970, 84 (3), 488–500.
Baker, George P, “Incentive contracts and performance measurement,” Journal of political Econ-
omy, 1992, 100 (3), 598–614.
Barach, Moshe A, Joseph M Golden, and John J Horton, “Steering in online markets: the
role of platform incentives and credibility,” Management Science, 2020.
Bolton, Gary, Ben Greiner, and Axel Ockenfels, “Engineering trust: reciprocity in the
production of reputation information,” Management science, 2013, 59 (2), 265–285.
Cabral, Luis and Ali Hortacsu, “The dynamics of seller reputation: Evidence from eBay,” The
Journal of Industrial Economics, 2010, 58 (1), 54–78.
Chevalier, Judith A and Dina Mayzlin, “The effect of word of mouth on sales: Online book
reviews,” Journal of marketing research, 2006, 43 (3), 345–354.
Dai, Weijia, Ginger Z Jin, Jungmin Lee, and Michael Luca, “Aggregation of consumer
ratings: an application to yelp.com,” Quantitative Marketing and Economics, 2018, 16 (3), 289–
339.
Dellarocas, Chrysanthos, “The digitization of word of mouth: Promise and challenges of online
feedback mechanisms,” Management science, 2003, 49 (10), 1407–1424.
and Charles A Wood, “The sound of silence in online feedback: Estimating trading risks in
the presence of reporting bias,” Management science, 2008, 54 (3), 460–476.
Dewan, Sanjeev and Vernon Hsu, “Adverse selection in electronic markets: Evidence from
online stamp auctions,” The Journal of Industrial Economics, 2004, 52 (4), 497–516.
Dranove, David and Ginger Zhe Jin, “Quality disclosure and certification: Theory and prac-
tice,” Journal of Economic Literature, 2010, 48 (4), 935–63.
37

Einav, Liran, Chiara Farronato, and Jonathan Levin, “Peer-to-peer markets,” Annual Re-
view of Economics, 2016, 8, 615–635.
Elfenbein, Daniel W, Raymond Fisman, and Brian McManus, “Market structure, reputa-
tion, and the value of quality certification,” American Economic Journal: Microeconomics, 2015,
7 (4), 83–108.
Farronato, Chiara, Andrey Fradkin, Bradley Larsen, and Erik Brynjolfsson, “Consumer
Protection in an Online World: An Analysis of Occupational Licensing,” Technical Report,
National Bureau of Economic Research 2020.
Fradkin, Andrey and David Holtz, “More Reviews May Not Help: Evidence from Incentivized
First Reviews on Airbnb,” arXiv preprint arXiv:2112.09783, 2021.
, Elena Grewal, and David Holtz, “Reciprocity in Two-sided Reputation Systems: Evidence
from an Experiment on Airbnb,” 2019.
Hollenbeck, Brett, Sridhar Moorthy, and Davide Proserpio, “Advertising strategy in the
presence of reviews: An empirical analysis,” Marketing Science, 2019, 38 (5), 793–811.
Hui, Xiang, Maryam Saeedi, and Neel Sundaresan, “Adverse Selection or Moral Hazard,
An Empirical Study,” The Journal of Industrial Economics, 2018, 66 (3), 610–649.
, , Giancarlo Spagnolo, and Steve Tadelis, “Certification, Reputation and Entry: An
Empirical Analysis,” Unpublished Manuscript, 2017.
, , Zeqian Shen, and Neel Sundaresan, “Reputation and regulations: evidence from eBay,”
Management Science, 2016, 62 (12), 3604–3616.
, Zekun Liu, and Weiqing Zhang, “Mitigating the Cold-start Problem in Reputation Systems:
Evidence from a Field Experiment,” Available at SSRN, 2020.
Hunter, Megan, “Chasing Stars: Firms’ Strategic Responses to Online Consumer Ratings,”
Available at SSRN 3554390, 2020.
Jin, Ginger Z., Zhentong Lu, Xiaolu Zhou, and Chunxiao Li, “The Effects of Government
Licensing on E-commerce: Evidence from Alibaba,” Journal of Law & Economics, forthcoming.
Jin, Ginger Zhe and Phillip Leslie, “The effect of information on product quality: Evidence
from restaurant hygiene grade cards,” The Quarterly Journal of Economics, 2003, 118 (2), 409–
451.
Klein, Tobias J, Christian Lambertz, and Konrad O Stahl, “Market transparency, adverse
selection, and moral hazard,” Journal of Political Economy, 2016, 124 (6), 1677–1713.
Leland, Hayne E., “Quacks, Lemons and Licensing: a Theory of Minimum Quality Standards,”
Journal of Political Economy, 1979, 87 (6), 1328–1346.
Lewis, Gregory and Georgios Zervas, “The welfare impact of consumer reviews: A case study
of the hotel industry,” Unpublished manuscript, 2016.
Leyden, Benjamin T, “Platform Design and Innovation Incentives: Evidence from the Product
Ratings System on Apple’s App Store,” 2021.
38
Luca, Michael, “Reviews, reputation, and revenue: The case of Yelp. com,” Com (March 15,
2016). Harvard Business School NOM Unit Working Paper, 2016, (12-016).
Nosko, Chris and Steven Tadelis, “The limits of reputation in platform markets: An empirical
analysis and field experiment,” Technical Report, National Bureau of Economic Research 2015.
Park, Sungsik, Woochoel Shin, and Jinhong Xie, “The fateful first consumer review,” Mar-
keting Science, 2021.
Reimers, Imke and Joel Waldfogel, “Digitization and pre-purchase information: the causal
and welfare impacts of reviews and crowd ratings,” American Economic Review, 2021, 111 (6),
1944–71.
Resnick, Paul, Richard Zeckhauser, John Swanson, and Kate Lockwood, “The value of
reputation on eBay: A controlled experiment,” Experimental economics, 2006, 9 (2), 79–101.
Saeedi, Maryam, “Reputation and adverse selection, theory and evidence from eBay,” RAND
Journal of Economics, 2019.
Shapiro, Carl, “Premiums for high quality products as returns to reputations,” Quarterly journal
of economics, 1983, pp. 659–679.
Tadelis, Steven, “Reputation and feedback systems in online platform markets,” Annual Review
of Economics, 2016, 8, 321–340.
Vana, Prasad and Anja Lambrecht, “The effect of individual online reviews on purchase
likelihood,” Marketing Science, 2021.
Wu, Chunhua, Hai Che, Tat Y Chan, and Xianghua Lu, “The economic value of online
reviews,” Marketing Science, 2015, 34 (5), 739–754.
39
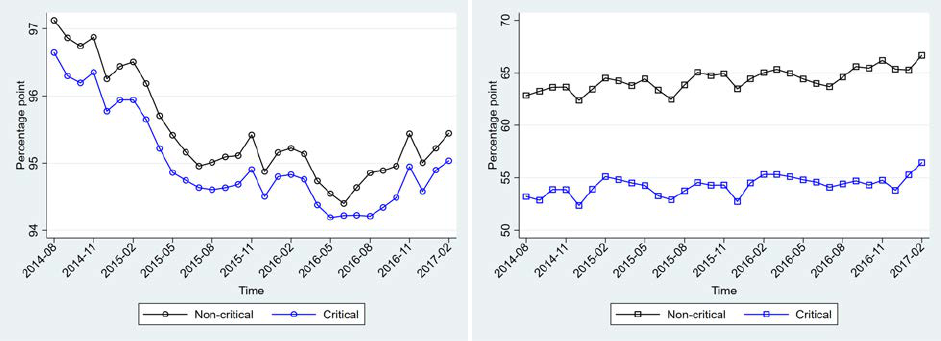
Appendix A Survival Effect
In this section, we provide evidence on the survival effect. Suppose that the distribution of sellers
is identical across critical and non-critical markets. Then it should follow that the survival rate
is lower in more critical markets; thus, the quality of surviving sellers should be higher in critical
markets than in non-critical markets. This argument rests on the premise that consumers care
about feedback ratings and certification when they decide which sellers to buy from, as argued in
Section 4.3.
In Figure 12, each point corresponds to one entering seller cohort, namely the sellers that have
their first listing ever on eBay in the month corresponding to the value on the x-axis. The graph on
the left plots the percentage point of sellers that survive in the first six months after entry, where
surviving is defined as having at least one sale in that period. We plot the average survival rate for
each cohort for both critical markets and non-critical markets. The graph on the right is similarly
constructed, except that survival is defined as having at least one sale between the seventh and
twelfth month after seller entry. The values on the y-axes in both graphs are normalized by one
constant. Consistent with our hypothesis, in both graphs the survival rate is higher for sellers in
non-critical markets and the gap in terms of percentages is larger in the longer time horizon.
Figure 12: Survival Rates in Different Markets
Notes: Each point corresponds to one entering seller cohort. Left and right graphs show the percentage
point of sellers who made any sales in their first six months after entry, and between the seventh and twelfth
month, respectively. The values on the y-axes are normalized by one constant.
Appendix B Figures
40
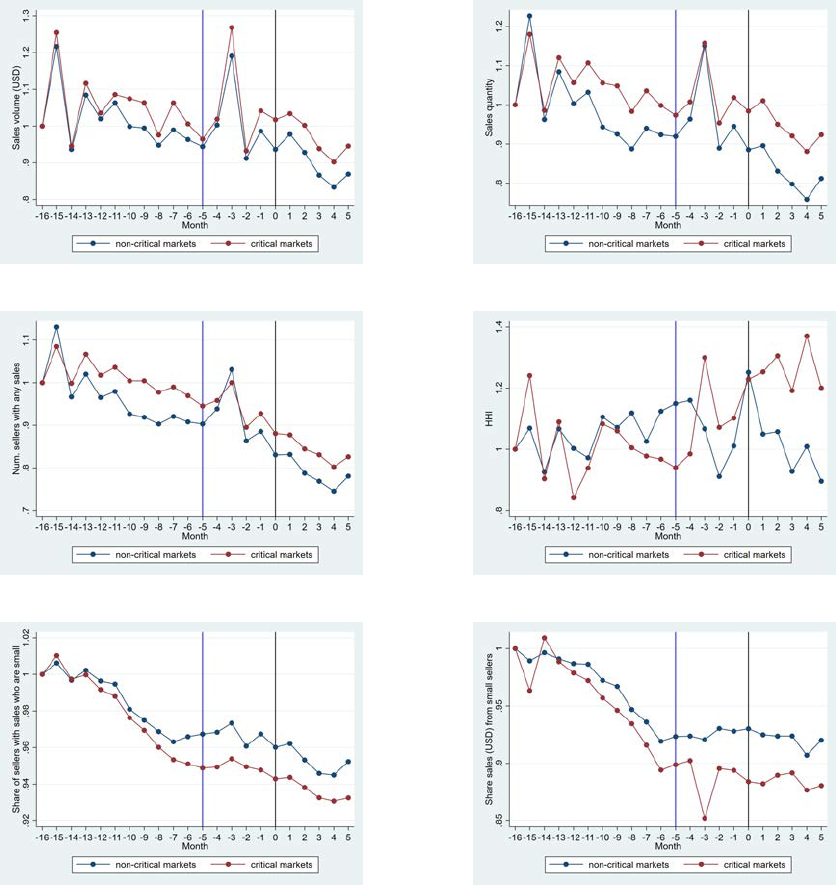
Figure 13: Normalized Time Series of Dependent Variables in Market-level Analysis
(a) Sales volume (USD) (b) Sales quantity
(c) Num. sellers with any sales (d) HHI
(e) Share of sellers with sales who are small (f) Share sales (USD) from small sellers
Notes: All variables are normalized by the value in the first month of our sample. Markets are divided into non-
critical and critical based on a median split. Blue and black vertical lines indicate the policy announcement and
implementation months, respectively.
41
