2O2O

RESEARCH TEAM
THE
This study is a product of the collaboration and vision of multiple people.
Led by researchers from the Nashville Area Chamber of Commerce and Exploration Group:
Joanna McCall
Coordinator of Applied Research,
Nashville Area Chamber of Commerce
Barrett Smith
Coordinator of Applied Research,
Nashville Area Chamber of Commerce
Jacob Wunderlich
Director, Business Development and Applied Research,
Exploration Group
The Music Industry Report 2020 includes the work of talented student interns who went
through a competitive selection process to become a part of the research team:
Alexander Baynum
Belmont University
Kate Cosentino
Belmont University
Patrick Croke
University of Virginia
Shruthi Kumar
DePaul University
Isabel Smith
Elon University
In addition, Aaron Davis of Exploration Group and Rupa DeLoach of the Nashville Area
Chamber of Commerce contributed invaluable input and analysis. Cluster Analysis and
Economic Impact Analysis were conducted by Alexander Baynum and Rupa DeLoach.
2

3
TABLE OF CONTENTS
Letter of Intent
Aaron Davis, Exploration Group
and Rupa DeLoach, The Research Center
Executive Summary
Introduction
How the Music Industry Works
Creator’s Side
Listener’s Side
Facets of the Music Industry Today
Traditional Small Business Models, Startups, Venture Capitalism
Software, Technology and New Media
Collective Management Organizations
Songwriters, Recording Artists, Music Publishers and Record Labels
Brick and Mortar Retail Storefronts
Digital Streaming Platforms
Non-interactive Digital Services, Radio
Touring, Booking, Venue Management, Music Festivals and Live Music Production
Merchandise
Music Education
Synchronization Licensing
The Impact of the Music Industry
Sector and Cluster Analysis
Economic Impact and Contribution Analysis
Large Musical Events
Independent Venues
Diversity and Inclusion
Evaluation of Trends by Genre in the Nashville Region
Alternative/Indie
Christian and Gospel
Classical
Country
EDM/Electronic
Folk/Americana
Hip-Hop and Rap
Jazz
Latin
Musical Theatre
Pop
Punk, Emo, Hardcore and Metal
Rock
Singer/Songwriter
Soul, R&B and Blues
All Genres
5 - 6
7 - 23
25 - 27
29 - 34
36 - 78
80 - 99
101 - 143

4
Music Industry Workforce Assessment
Workforce Category #1: Studio / Performing Musicians, Recording
Artists, Vocalists, Producers, DJs
Workforce Category #2: Songwriters, Composers, Lyricists, Arrangers,
Conductors, Bandleaders
Workforce Category #3: Live Music, Non-Technical Occupations:
Concert Promoter, Talent Buyer, Booking Agents, Tour Manager, Music Festival
Operations, Venue Manager, Venue Operations, Artist Hospitality
Workforce Category #4: Live Music, Technical Occupations: Sound
Engineering Technicians, Studio Maintenance, Live Sound,
Engineer, Instrument, Production, Audio, Equipment Technicians,
Lighting and Production Design, Rigging, Live Crew
Workforce Category #5: AM/FM Radio, Internet Radio, Satellite Radio
Workforce Category #6: Music Education, Music Therapy
Workforce Category #7: Public Relations, Journalism, Social Media, Creative Agency,
Artist Manager, Business Manager
Workforce Category #8: Financial Planning, Consulting, Accounting, Banking,
Entertainment Law
Workforce Category #9: Music Publishing Creative Operations (Sync Pitching,
Marketing, Talent Scouting, etc.), Sync Licensing, Music Supervision,
Advertising, Catalog Administration, Rights Management, Metadata
Organization, Performance or Mechanical Copyright Society Operations,
Record Label Operations (A&R, Marketing, Radio Promotion, Distribution,
Human Resources, etc.)
Workforce Category #10: Technology Development, Software Engineering,
Digital Service Platform Operations, Research Analytics,
Record Label Operations (A&R, Marketing, RadioPromotion, Distribution,
Human Resources, etc.)
Workforce Category #11: Brick and Mortar Music Retail Operations
The Finale
A Look Back
Conclusion
Final Thoughts from the Music Industry
Resources
Acknowledgements
Glossary
Endnotes
Other Works Cited
Appendices
144 - 214
216 - 223
225 - 226
227 - 231
232 - 235
236 - 239
240
240
5
LETTER OF INTENT
Aaron Davis, Co-founder and CEO of Exploration Group, and Rupa DeLoach, Vice President of
Research at the Nashville Area Chamber of Commerce:
Wendell Berry writes: “It may be that when we no longer know what to do we have come to our real
work and that when we no longer know which way to go we have come to our real journey. The mind that
is not baffled is not employed. The impeded stream is the one that sings.” In our inaugural publishing of
the Music Industry Report, we hold to this sentiment.
Exploration has teamed up with the Nashville Area Chamber of Commerce and several leading trade
associations and educational institutions to study the state of the Music Industry, its individual sectors,
and its functioning as a collective body. In our research we’ve analyzed how folks worked in the past and
how their efforts have been affected by COVID-19.
Chip and Dan Heath in their bestselling book, Switch, inform us: “data are just summaries of thousands
of stories—tell a few of those stories to help make the data meaningful.” That is just what the research
team has done in the compelling narrative within this study.
The Music Industry Report 2020 was conducted in three main parts: 1) in depth interviews with
individuals to learn how their businesses and organizations have been personally affected 2) detailed
surveys of large groups of members of our community to garner a broader perspective 3) economic
impact data, demographic statistics and cluster analysis of the Nashville, Tenn. region with other music-
centric areas. This method gave us a comprehensive understanding of some of the opportunities and
challenges the music industry faces.
So as you read, we ask you to witness the dynamic and innovative nature of the music industry and the
opportunities it presents to both creatives and entrepreneurs in addition to the economic power of the
music industry here in the Nashville Region (in terms of jobs, monetary impacts and what it means to the
regional and national landscape). We believe this report will demystify how the music industry works and
offer insights on how recession and pandemics can be navigated by those most critical to the industry
yet most vulnerable.
Thank you to the contributors and project leads who helped produce this study and all of the folks who
made it possible. To properly analyze such a large and complex industry was no easy task; the results
stand as a testament to the merit, grit, and perseverance of everyone in this industry.

6
In addition to anticipated findings from this report, we took into consideration a few overarching
principles. It has been important for us to embody them in order to put our best foot forward and in
order for our work to stand in full integrity. We are committed to truthful reporting on the findings
of this research. Transparency of data means making all findings available in addition to a complete
methodology. We are also committed to a spirit of collaboration and mutual benefit. This project would
not be possible without the collective effort of the countless individuals and organizations who comprise
this industry.
The high-level findings of the study illuminate that Nashville is not only where the world comes to
record and listen to music, but where music comes to do business. Data suggests that our resolve must
be strengthened to address the sustainable viability of independent venues in addition to issues of
compensation and inequity that were further exacerbated by the COVID-19 pandemic—deficits in social
programs available for musicians and staff, in gender and racial bias and in a balanced revenue share
for creators. We also learned there is much work to do in educating all participants in the music supply
chain regarding the value and importance of metadata.
Finally, we all agree (whether its among those in the music industry or the wider public) that music is
worth fighting for, that it enriches our daily lives and keeps our souls intact. Now, more than ever, we can
meet the challenges and opportunities uncovered by this research in Nashville and around the world.
We are optimists. We believe the best is yet to come. We view the great challenges of our times as
opportunities to work together, utilizing our collective intellect in order to derive creative and adaptive
solutions to more effectively reach our common goals. We are grateful and have high regard for the
many individuals who share this belief and have contributed so much in helping us produce the Music
Industry Report 2020.
We’ll see you down the road. This is how the music business works.
Aaron Davis
Co-Founder and CEO
Exploration Group
Rupa R DeLoach
Vice President of Research
Nashville Area Chamber of Commerce

7
EXECUTIVE SUMMARY
Industry follows art. Creation is the nucleus of human experience and music is the communication of
human experience over sound waves from one mind to another. It is the lullabies you sang from birth,
the way you learned the alphabet, the mosh pit you joined when you were thirteen, the rst CD you ever
bought, the guitarist who shook your hand, the long rides home listening to your favorite radio station,
the symphony orchestra, the gospel choir, the bass drop at Coachella.
A music industry is what happens when “the roadies take the stage, pack it up and tear it down,” to
quote Jackson Browne. It is the money changing hands before the crowd rolls in. It is the royalties and
commissions and licensing fees and salaries of over 1.9 million people who exist to facilitate an ex-
change of value between music creators and listeners.
The Music Industry Report 2020 establishes market research exploring innovation and change driving
growth in the music industry with an emphasis on the impacts of COVID-19.
METHODOLOGY
Our premise is to encourage the music industry to represent itself.
More than one hundred music
industry experts shared their time
and insights over video conference
interviews between March and
September of 2020. Their words
informed two largescale online
surveys to 2,589 combined
recipients: a 98-question survey
to the Music Industry investigating
workforce dynamics (with a 95%
condence level and +/-2.19%
margin of error), and a 50-question
survey to Music Consumers (with
a 95% condence level at 4.08%
margin of error). Survey to the Music
Industry skews by 1.0% toward males,
Consumers’ Survey by 10.0% toward
females; Music Industry survey by
13.7% toward whites, Consumers’
survey by +6.7% toward whites.

8
Eighty-seven percent of respondents to the Survey to the Music Industry indicate they live in the United States;
55.3% are from the Nashville Metropolitan Statistical Area. 77.2% of respondents to the Consumers’ Survey indi-
cate they live in the United States; 48.1% are from the Nashville Metropolitan Statistical Area.
Three focus groups of 6-12 people each helped to rene topics of considerable importance and address demo-
graphic limitations from the surveys:
LIVE MUSIC
PROFESSIONALS
ARTISTS
SONGWRITERS
MUSICIANS
PRODUCERS
Data sets from federal, state and private sector resources garnered an in-depth picture of direct, music-related
employment specic to the Nashville region then to the broader USA.
The regional and national employment gures were used to calculate the economic impact of the music industry
through input-output modeling using the IMPLAN economic impact software. IMPLAN is an economic impact
modeling software that can take direct inputs of a given sector and calculate the total economic impact of that
sector on the entire economy in terms of direct effect (direct trade ows within the industry or industries involved),
indirect effect (capturing the impact of the supply chain or value chain) and the induced effect (the impact of
income and wages on spending). Employment was used as the baseline input variable to calculate the economic
contribution and impact analysis for this report.
The 2013 Music Study from the Nashville Chamber of Commerce incorporated employment and economic data
that included both Music and Entertainment Industries. Data tools at the time limited the ability to pull out a purely
music industry dataset. In 2020 data tools allow researchers to rene the data so that a purely music industry data
set could be delineated. This updated study includes both an assessment of the economic impact of the Music
and Entertainment Industry in 2019 for comparison with the impact as measured in 2013’s study as well as an up-
dated evaluation of the data examining the economic impact of the Music Industry exclusively.
Outside of primary data collected by the research team, occupational data used in the Workforce Assessment and
elsewhere throughout the report is also collected from both Economic Modeling Specialists Inc. (EMSI, a labor
market analytics rm) and Chmura Economics and Analytics (an applied economic consulting rm delivering ad-
vanced economic analysis). These rms utilize data from the Bureau of Labor Statistics directly to create analytics.
This report uses this data to examine over fty occupations identied as having all, or some, employment concen-
tration in the music industry. These occupations are broken up into eleven workforce categories based on similar
music industry activity.
DIVERSITY AND
INCLUSION
IN THE
NASHVILLE MUSIC
INDUSTRY

9
Key Music Industry-Centric Regions
Nashville MSA
EMSI data provides measurements in terms of retirement risk, racial and gender diversity per workforce group.
Chmura data provides information regarding historical employment growth, current employment, relative
concentration of employment, occupational unemployment, as well as median, entry level and experienced level
wages. Chmura data is also used to provide occupational employment projections based on two scenarios: one
where employment levels are taken at the most recently published quarter and historical patterns are applied to
this starting point without consideration of COVID-19; and another where the immediate effects of COVID-19 are
taken into account, oftentimes resulting in a sharp dip in employment. There is also an assumption of a vaccine that
is widely-spread by mid-to-late 2021. Accounting for all occupations and metrics provided for nine metro regions in
addition to the United States, the Music Industry Report 2020 includes over 12,500 data points.
Finally, to ensure a robust
understanding of current and recent
research and trends within the
industry, the research team conducted
a literature review and dove into
secondary qualitative research at the
onset of this report. This review and
examination of recent publications
centers on the music industry and
its component parts allowing the
research team to explore comparative
benchmarks, as well as gain insight
into what the industry looked like prior
to COVID-19 and how others project
it to evolve. Examples of this research
and selected literature is cited
throughout the study.
The Nashville MSA, given its high
concentration of music industry
activity, provides a logical starting
point from which to investigate the
global dynamics of the music industry.
Davidson
Wilson
Smith
Trousdale
Dickson
Robertson
Sumner
Macon
Rutherford
Cannon
Williamson
Cheatham
Maury
POPULATION
13,000,000 - 19,000,000
9,000,000 - 13,000,000
3,000,000 - 9,000,000
1,500,000 - 3,000,000
1,000,000 - 1,500,000

10
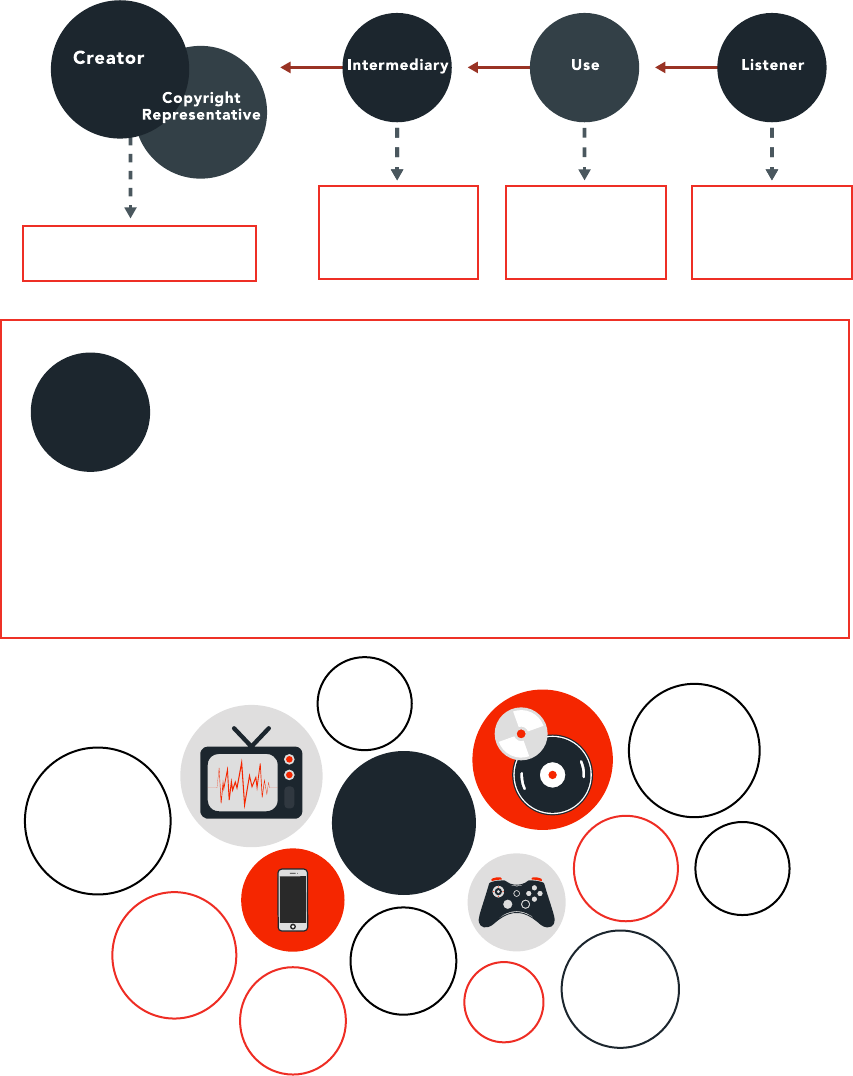
HOW THE MUSIC INDUSTRY WORKS
United States copyright law governs what you can and what others cannot do with creative expression xed in a
tangible medium. Any use of intellectual property by someone other than the copyright owner requires them to
obtain a license and pay royalties.
Two primary functions of the music industry:
1. Provide musical experiences to the Listener.
2. Return value to the music Creator.
From the Creator side, this value exchange operates as a function of the music creator’s rights and the authorization
of licenses for another party to use them. Copyright representatives help music creators better manage and exploit
their compositions and sound recordings. Intermediaries help license musical content to users, but can be bypassed
in some circumstances. Uses provide circumstances in which people can listen to music and create a royalty payment
owed to the music creator or copyright owner.
From the Listener side, music listeners create value with their time, attention and money. Uses monetize this
listener value and pay for the exploitation of a music creator’s rights in the form of a royalty. Intermediaries help
get this royalty from a music use back to the original creator or copyright owner. Outside of ticket revenue from live
performances, this is how creators generate income from their work.
Receives value in exchange
for exploitation of rights
Collects and
distrubutes
royalties generated
from uses
Monetizes value
from listener
and exploits
copyrights
Contributes value
in exchange
for access
to music
Creates
Musical
Content
Provides Copyright
Administration
and Management
Licenses
musical content
for use
Provides listener
access to
musical
experiences
Enjoys
musical
experiences

11
This full diagram below provides a basic picture of this combined exchange of value:
The music industry is constantly adapting to new developments in the ways people both listen to and create music,
but the essential relationship remains the same.
FACETS OF THE MUSIC INDUSTRY TODAY
Nashville is not only where the world comes to listen to music; it is also where music comes to do business.
Industry dynamics in the region exemplify and often inspire global trends.
Eleven facets detail the music industry’s current status. 1. Traditional Small Business Models, Startups and Venture
Capital; 2. Software, Technology and New Media; 3. Collective Management Organizations; 4. Songwriters,
Recording Artists, Music Publishers and Record Labels; 5. Brick and Mortar Retail Storefronts; 6. Digital Streaming
Platforms; 7. Non-Interactive Digital Services, Radio; 8. Touring, Booking, Venue Management, Music Festivals and
Live Music Production; 9. Merchandise; 10. Music Education and Therapy; and 11. Synchronization Licensing.
SMALL BUSINESS OWNERSHIP
43.3% applied for the Paycheck Protection Program; 84.2% were accepted.
Half of small business owners anticipate their companies bouncing back in 1 to 2 years.
78.7% of small business owners lost revenue since the onset of COVID-19.
REMOTE WORK
67.2% transitioned to remote work; of those just 36.4% say it decreased their prociency.
54.7% agree the music industry adapts well to new technology.
LIVESTREAMING
50.2% of consumers say a livestream is nowhere near the real experience.
82.8% of music creators performed a live stream between March and April of 2020.
Livestreaming was ranked #1 among prospective sources of non-live revenue.
RADIO
36% listen to AM/FM radio, second among listening options only to Spotify.
33.3% discover new music from AM/FM radio.
The following statistics are most noteworthy.

12
COPYRIGHT
MERCHANDISE
Consumers rank physical merch second among non-live actions that pay artists the most
money.
LIVE MUSIC
93% rank the music industry’s dependence on live music above seven on a scale of 1-10.
50.4% of recording artists have performed zero times since March 2020.
Bookings for live performances in 2021 are lower for 86.9% of respondents.
LISTENING OPTIONS
39.7% of consumers report listening to more music since the onset of COVID.
Most consumers listen to music at home (52.3%), in a car (31.5%) or at work (11.5%).
DIGITAL STREAMING
Spotify is the most popular listening option for all age groups surveyed.
74.9% of consumers subscribe to a music streaming platform.
An extensive music library is most valued in a digital streaming service by consumers.
EDUCATION
Only 21.6% rank the value of their degree above six on a scale of 1-10.
62.1% of music industry pros have at least a bachelor’s degree.
MUSIC CREATORS
73.5% of music creators surveyed are making less music because of COVID-19.
82.3% have lost scheduled gigs, studio work or residency; 40.5% have cancelled or postponed tours.
54.6% disagree that commercial charts are an effective metric for distributing royalties.
76.9% feel unprepared for The Mechanical Licensing Collective.
59% of respondents rank the importance of metadata between 1 and 8 on 1-10 scale.
95% of music creators surveyed own all or some of their music copyrights.

13
ECONOMIC & CLUSTER ANALYSIS
Industry clusters are groups of related businesses that function together creating a competitive hub sharing
common markets, occupational skills and technologies within a region. The music industry is a strong
traded cluster with global reach that imports and exports products, talent and services from throughout the
Nashville region to the rest of the world. Please note that cluster and economic impact analysis relies on
historical data. As such, this section does not contain reference to COVID-19; however, those impacts are
addressed in very real terms in the following section on independent music venues.
The Music Industry cluster, excluding its linkages in the Nashville Metropolitan Statistical Area (MSA),
represents 16,298 jobs (2019) with average annual earnings of $81,521 or $66,358 (when averaging
without artist/performer wages). Direct music industry employment has increased by 29% in the region
since 2012 to 21,878 total jobs in 2019.
Nashville is third in the nation in terms of jobs in the music industry behind Los Angeles and New York.
The region has the highest location quotient of employment in the music industry of any MSA in the United
States. A location quotient (LQ) tells the amount of a region’s share of employment in a specic industry as
a percent of total national employment for that industry. Accordingly, the highest concentration of workers
with the skills specialized for the music industry are located in the Nashville Region.
Looking at the top ten MSAs in the U.S. for music industry jobs and job growth, over the ten-year period
from 2009 to 2019, the Nashville MSA ranks rst for net job growth and growth rate. Even in terms of
net job growth, the Nashville MSA had ve times the net job growth of Los Angeles and 200 times the
job growth of New York.
REGIONAL MUSIC AND ENTERTAINMENT ECONOMIC IMPACT ANALYSIS – 2013 VS. 2020
Economic impact analysis for the Nashville MSA determined that the Music and Entertainment Industry is
responsible for 80,757 jobs within the Nashville area offering employee compensation of $6.3 billion and
adding $9.9 billion to the local Gross Domestic Product (GDP) with a total economic impact of $15.6 billion.
Location Quotient Chart (2019 LQ & 10 Year LQ Growth)

NASHVILLE MUSIC INDUSTRY ECONOMIC IMPACT ANALYSIS – 2013 VS. 2020
Researchers utilized a stafng pattern matrix to determine music-related employment from all related industry
sectors that was further rened to calculate net music-related jobs by industry. In 2013, the music industry directly
contributed $2.1 billion to regional GDP with another $1.5 billion added through indirect and induced effect for
a total of $3.6 billion. This grew by $1.7 billion to $5.3 billion (an increase of 47%) in 2020.
Overall economic impact of the music industry in the Nashville MSA in 2020 is
$8.6 billion which represents an increase of $2.6 billion (43%) since 2013’s $6.1B.
USA MUSIC INDUSTRY ECONOMIC IMPACT ANALYSIS – 2013 VS. 2020
Total employment in the United States accounts for 2.8M jobs in 2020 growing by 137,000 jobs (an increase of 5.2%).
Overall economic impact of the music industry in the United States in 2020
is $514B which represents an increase of $43B (9.2%) since 2013’s $471B.
NOTE: While the studies have been published in 2013 and 2020 respectively, the values above represent 2012 and 2019 data.
1 - Direct
2 - Indirect
3 - Induced
Total
21,878
10,336
11,735
43,948
$1,618,928,267
$618,297,135
$653,351,180
$2,890,576,582
$3,199,613,641
$997,357,889
$1,084,013,965
$5,280,985,496
$5,018,186,861
$1,773,683,204
$1,848,075,502
$8,639,945,567
1 - Direct
2 - Indirect
3 - Induced
Total
17,008
8,050
9,149
34,206
Employment
Type Impact
$1,124,803,911
$440,562,035
$453,628,945
$2,018,994,891
Labor Income
$2,134,218,695
$722,116,710
$744,810,291
$3,601,145,697
Value Added
$3,470,329,912
$1,302,725,584
$1,277,102,742
$6,050,158,238
Output
2020
2013
1 - Direct
2 - Indirect
3 - Induced
Total
1,317,858
744,542
707,646
2,770,046
$88,521,039,359
$46,603,402,636
$39,399,976,293
$174,524,418,288
$138,795,206,869
$74,065,133,894
$65,373,681,654
$278,234,022,417
$265,132,048,545
$137,452,111,059
$111,452,143,903
$514,036,303,507
1 - Direct
2 - Indirect
3 - Induced
Total
1,193,864
760,405
678,851
2,633,120
Employment
Type Impact
$72,734,642,791
$42,845,166,299
$33,660,960,314
$149,240,769,403
Labor Income
$120,346,812,923
$69,361,232,400
$55,274,598,152
$244,982,643,475
Value Added
$245,617,257,298
$130,244,185,069
$94,779,115,567
$470,640,557,933
Output
2020
2013
14

INDEPENDENT MUSIC VENUES
Overall, independent music venues, represented by Nashville group the Music Venue Alliance, in Metro Nashville lost 72%
of their overall revenue and 73.5% of their employment. In 2019 independent music venues had a total economic impact
of $49.6 million in Davidson County. Because of COVID-19, the total economic effect to date is a loss of $35.7 million
dollars which represents a loss of $22.6 million in revenue to these independent music businesses. The impact on regional
employment is a net loss of 275 full time equivalent jobs which equates to $17.1 million in lost wages and a loss of $24.8
million to Davidson County’s Gross Domestic Product.
In the words of Chris Cobb, Nashville independent music venue
owner, this scenario created by COVID-19 is “Extinction Level!”
1 - Direct
2 - Indirect
3 - Induced
Total
74
11
16
102
$4,778,987
$878,929
$1,164,453
$6,822,368
$6,589,022
$1,472,797
$1,790,924
$9,852,744
$8,829,253
$2,257,887
$2,833,003
$13,920,143
1 - Direct
2 - Indirect
3 - Induced
Total
279
42
56
377
Employment
Type Impact
$16,689,824
$3,209,802
$4,042,515
$23,942,142
Labor Income
$23,036,243
$5,411,504
$6,217,820
$34,665,567
Value Added
$31,430,744
$8,353,173
$9,835,737
$49,619,654
Output
2020
2019
15

DIVERSITY AND INCLUSION
According to Economic Modeling Specialists, Inc. (EMSI), only 9% of music industry professionals in the
United States are Black or African American. This compares to 8% in the Nashville region. In the United States
approximately 13% of the population is Black or African American. This compares to approximately 16% in the
Nashville region.
#TheShowMustBePaused is a movement founded on social media by Brianna Agyemang, Atlantic Records, and
Jamila Thomas, Platoon, after the killing of George Floyd in Spring of 2020 to push for greater representation in
the music industry for Black people.
The research team conducted a focus group to examine the impacts of this event and ongoing diversity and
inclusion efforts in the city of Nashville.
Hiring and Job Creation: Diversity has to be a commitment at all levels, especially in management, in order for
the music industry to improve. It has to be built into the infrastructure of the music industry for it to last.
Intentionality: #BlackoutTuesday was key to opening the door regarding conversations about diversity in many
spaces. Yet, representation is still an issue.
Ownership: To ensure a more equitable industry, it is crucial for Black professionals to have access to ownership
of record labels, venues for Black creatives and places like the National Museum of African American Music.
Sustainable Opportunities: Creating sustainable and repeatable business opportunities and infrastructure for
creators is necessary for representation and inclusivity to endure.
Key Takeaways
Overall, there is momentum around diversity and inclusion in this moment. Therefore, there is a great need for
Nashville to decide what they want to do with the brand “Music City” and make a commitment to diversity. That
starts with creating spaces, having conversations and asking questions, funding individuals and groups, valuing
diversity and remembering music is best when everyone has a seat at the table.
16

EVALUATION OF TRENDS BY GENRE
IN THE NASHVILLE REGION
The Nashville region is well-known for country music. However, other burgeoning music scenes are
equally important to the cultural and economic landscape. The following information comes from both
the Music Consumer Survey and the Survey to the Music Industry.
Alternative / Indie
Christian & Gospel
Classical
Country
EDM/Electronic
Folk / Americana
Hip-Hop & Rap
Jazz
Latin
Pop
Punk / Emo / Hardcore & Metal
Reggae
Rock
Singer / Songwriter
Soul, R&B & Blues
38
8
16
35
9
28
21
22
8
35
20
9
46
39
43
50
13
21
42
11
40
34
23
9
48
25
12
51
42
58
26
15
12
55
5
32
15
19
5
43
8
3
35
44
39
The primary genre for
music creators (%)
Genre
Evaluation of Trends by Genre in the Nashville Region
A favorite genre to
listen to (%)
A favorite genre to
experience live (%)
17

Terminated an agreement
with an entity representing
me or my music.
Entered into an agreement
with an entity to represent me
or my music.
Had to take on an additional
job unrelated to music.
Had to take on an additional
job related to music.
Purchased new gear, audio
equipment and/or musical
instruments.
Devoted resources toward
building a home studio.
Cancelled or postponed
my tour.
AS A RESULT OF COVID-19, I HAVE...
18
200
100
0
IMPACTS OF COVID-19 PER GENRE

AS A RESULT OF COVID-19, I HAVE...
Loss of scheduled
gigs, studio work, or
residency.
Loss of revenue,
employment, or
benets.
Had to sell gear,
equipment,
or personal
belongings.
Participated in a
livestream concert for
no compensation.
Participated in a
livestream concert
for compensation.
Promoted my music
on Tik Tok.
Started a social
media campaign or
crowd-funding to raise
money.
Delayed a music
release.
19
300
200
100
0

20
MUSIC INDUSTRY
WORKFORCE ASSESSMENT
Many of the people who contribute to the music industry both directly and indirectly fall outside of
traditional, measurable categories. The following list accounts for a music industry workforce assessment
developed to harmonize data from this report’s Survey to the Music Industry with related occupational
groups from the Bureau of Labor Statistics classications.
STUDIO & PERFORMING MUSICIANS, RECORDING ARTISTS, VOCALISTS,
PRODUCERS AND DISC JOCKEYS
Total employment growth is down 5.1%. Nashville’s LQ is higher than any other comparable MSA.
53% of musicians surveyed hold multiple jobs.
79.4% of musicians surveyed have experienced unemployment since March; 96% due to COVID.
67.5% project their 2020 annual income will be at or below $36,000— a $10,000 drop from 2019’s average.
SONGWRITERS, COMPOSERS, LYRICISTS, ARRANGERS, CONDUCTORS, BANDLEADERS
Nashville has the third highest historical 10-year growth rate among comparable MSAs.
Wages in the Nashville MSA are lower than in all other comparable MSAs.
Nashville’s MSA is lowest of all music cities when it comes to gender diversity.
67.5% say COVID-19 has negatively impacted their mental health.
LIVE MUSIC, NON-TECHNICAL OCCUPATIONS: BOOKING, TOURING,
VENUE MANAGEMENT, ETC.
Nashville MSA’s LQ of agents and managers is the second highest behind L.A.
52.3% say their current work does not provide a comfortable living standard; 54.7% say it did in 2019.
96% surveyed are seeing less work; 43% have not been able to transition to remote work.
Nashville has the least racial diversity of all peer music cities in this workforce category.
LIVE MUSIC, TECHNICAL AND OPERATIONS OCCUPATIONS
By 2025, the Nashville region will have only ~40 more lighting technicians than it has today.
44.3% of those in lightning, audio and live production have been working in the industry for 21+ years.
22.3% surveyed do not have health insurance.
COVID-19 will decrease 2020 annual income for 93% of survey respondents.
RADIO
Nashville is the only MSA with positive 10-year employment growth.
Broadcast technicians make the 3rd highest annual median wage among comparable MSAs.
Radio employees surveyed are experiencing unemployment 14.7% below average.
54.6% maintained or increased their prociency with remote work.

21
MUSIC EDUCATION AND THERAPY
All MSAs show positive 10-year total employment growth for postsecondary music teachers.
Nashville has lost 57.2% of its recreational therapists over the past 10 years.
67.0%
of music educators and therapists surveyed have more than one job.
44% of music educators say their current occupations will not offer a comfortable living standard this year.
PUBLIC RELATIONS, JOURNALISM, SOCIAL MEDIA, CREATIVE AGENCY, ARTIST
AND BUSINESS MANAGERS
46.1% of survey respondents are between the ages 20-34.
19.5% surveyed are considering permanent relocation from their large urban center.
Survey responses project the amount of people making $0 - $12,760 will increase by 23% in 2020.
Unemployment is 19.6% lower than the 53.8% survey average.
FINANCIAL PLANNING, CONSULTING, BANKING, ACCOUNTING AND ENTERTAINMENT LAW
Most are salary-based employees or company owners, not freelancers.
Only 20% surveyed have experienced unemployment since March 2020, well below average.
86.4% were able to transition to remote work.
62.5% are seeing less work due to COVID-19.
MUSIC PUBLISHING AND RECORD LABEL OPERATIONS, SYNC LICENSING, CATALOG ADMIN,
COPYRIGHT MANAGEMENT
98.7% have at least some college education.
27.2% are newcomers to this occupation and have zero to ve years of experience.
Only 8% could not transition to remote work.
Unemployment is 25.6% below the survey average.
TECHNOLOGY DEVELOPMENT, SOFTWARE ENGINEERING, DIGITAL SERVICE PLATFORMS,
RESEARCH ANALYTICS
74.4% of people have maintained or increased their prociency with remote work.
Negative mental health effects and unemployment due to COVID-19 are both lower than survey average.
37.3% are new entrants to this occupation with zero to ve years of experience.
45.8% believe COVID-19 will not affect their annual income for 2020.
BRICK AND MORTAR RETAIL OPERATIONS
58.6% are self-employed or work with one to ve others.
All music retailers surveyed are seeing less work since the onset of COVID-19.
40% have not been able to transition to remote work.
84.6% surveyed received a stimulus check for $1,200 under the CARES Act.

22
THE FINALE
A VALUE GAP?
Survey to the Music Industry respondents rank “the inability for artists to make a living wage from their music” as
number one among issues they consider most important for the music industry to address within the next ve years.
Industry professionals overwhelmingly agree that songwriters (79.6%), recording artists (65.4%) and backing musicians
/ vocalists (61.5%) are not compensated fairly for their work. Consumers similarly agree for songwriters (61.6%) and
recording artists (48.7%).
And nally, when presented with the statement, “A disparity exists between the value listeners get from music and the
revenue that creators get for the use of their music,” 81.9% agree.
COVID-19 highlighted areas of considerable pre-existing weakness in the music industry. If the music industry is to
continue to exist, capital must return to those directly responsible for it: creators.
MUSIC INDUSTRY DENSITY
With a LQ of 6.1 for the music industry, the Nashville MSA has an employment concentration
triple that of the Los Angeles area (LQ 2.2) and nearly ve times that of New York City’s MSA
(LQ 1.4). To further illustrate this point, long term job specialization growth (2012 – 2019) in the
music industry is highest in the Nashville MSA with the Los Angeles area coming in second
followed by New York.
Music Publishers
Record Production and Distribution
Other Sound Recording Industries
Musical Intrument Manufacturing
Sound Recording Studios
Musical Groups and Artists
Software; Other Prerecorded
Radio Networks
Radio Stations
Total
39.70
24.75
7.58
7.45
6.18
6.18
3.32
2.69
1.34
6.11
5.09
4.70
1.87
1.72
4.09
2.85
1.59
1.71
0.77
2.16
1.82
3.89
1.25
1.72
1.70
1.38
0.57
1.76
0.87
1.37
1.22
0.79
1.64
1.30
2.42
1.30
2.25
0.45
0.75
1.13
0.51
1.38
0.76
0.83
0.81
0.95
2.08
0.57
0.61
0.84
0.10
0.19
0.68
0.12
1.01
1.00
2.44
1.43
1.06
1.00
1.14
1.62
1.43
0.08
1.70
0.94
1.18
0.59
1.11
1.00
1.20
0.88
1.03
0.41
0.93
1.10
2.48
0.14
1.27
1.07
1.50
1.03
0.18
0.03
1.03
1.83
0.03
1.13
0.62
1.09
Nashville
Los
Angeles
New
York
Austin Chicago Denver Miami Memphis
New
Orleans
Industry Description
Location Quotient Table (2019)

LIMBO FOR TECHNICAL OPERATIONS
The majority of live music technical operations workers have not been able to go remote. They face a choice
either to wait until live music comes back, re-skill and/or leave the industry.
DIRECT ARTIST SUPPORT
Forty-seven percent of music consumers stated they had participated in crowdfunding or donated to
another source of supplementary income for artists during COVID-19.
NOSTALGIA-DRIVEN TRENDS
Vinyl record sales are outperforming CDs for the rst time since the 1980s. Community radio is thriving
via regular fundraisers according to interviewees. Legacy catalogs are experiencing resurgence among
synchronization licensors. Catalog acquisitions are on the rise.
DIGITAL CONSUMPTION VS. LICENSING RIGHTS
Although social media and digital streaming platforms account for the most popular music discovery and
listening formats among consumers, many licensing structures and royalty payouts to copyright owners
remain ambiguous. The Mechanical Licensing Collective is poised to help.
THE STATE OF LIVE MUSIC
Livestreaming provides a means for performers to continue to work, but data suggests it does not replace
the in-person experience. Live music is suffering right now but will return.
Most consumers surveyed believe live music will go back to the way it was before the pandemic in nine to
eighteen months. Nearly forty-six percent of respondents would not feel comfortable attending a live
concert until there is a vaccine for COVID-19.
GENRE DIVERSITY
In Nashville, support for music genres outside of country creates a richer music ecosystem and more industry
growth for all. Neglecting to foster all genres is a missed opportunity.
The Music Industry Report 2020 provides one with a comprehensive data set from which
they can make informed decisions. Full results are delineated in the following pages.
23


25
INTRODUCTION
Creative industries are unique. Fitting artistic and cultural expression into the framework of current economic
systems can be a difcult task for those working in these industries and for those attempting to understand them.
At a time when the world is experiencing uncertainty in the midst of a global pandemic, many people are turning
to art for comfort. Yet, creative industries are among the most negatively impacted economically. In light of this,
we want to thank the people who make art and music. This report is produced as an act of support for creatives
and the business infrastructures built around them. A goal of this research is to provide a resource for individuals
who work in the music industry. Through a deeper understanding of the music industry’s structure, its relation to
other industries and its present challenges, there is an opportunity to strengthen it.
Creatives not only work tirelessly to provide music, art and culture for the world to enjoy, but often face uncertain
compensation and conditions for their work. This dynamic exists beyond the COVID-19 pandemic and has only
been exacerbated by it. Many jobs are created related to music business activity. This activity forms a group, or
cluster, of businesses that often exist in geographic proximity to each other and function in a symbiotic way, a
phenomenon well-demonstrated by the Nashville music industry and its history.
After Queen Victoria told the Fisk University Jubilee Singers in 1873 that they “must come from a music city,”
Nashville’s tragectory was launched. Almost one hundred years later, the city was ofcially dubbed “Music City,
USA” in the 1950s by WSM announcer David Cobb. The music business has evolved to become an integral part
of the region’s economy today.
In 1892, what is now known as the Ryman Auditorium began drawing crowds. It quickly became known for its
atmosphere and then-central location in the United States. The Ryman would host the Grand Ole Opry (1943-
1974) and then The Johnny Cash Show (1969-1971). Meanwhile, Jefferson Street, not far from historically Black
Fisk University, was quickly establishing itself as a hub for the nascent entertainment scene. Legendary artists
such as Jimi Hendrix, Otis Redding, Etta James and Little Richard would eventually perform there.
In the early 1950’s, Owen and Harold Bradley began to lay the roots for Music Row. To capitalize not only on this
growing industry, the reasonable real estate prices and the proximity to the hub of industry, many more music
businesses would follow the Bradley pair. John Dotson, founder of the Music Row Neighborhood Association,
notes, “It was a purposeful design to facilitate collaboration…it was a beehive of one on one and group activity.”
Music Row can certainly be credited with the commercial reach and popularization of country music. In the
coming years, as country music and the Nashville music business scene grew, venues began to sprout up all
around Nashville.

26
Nashville MSA
The late 80’s and early 90’s witnessed Lower Broadway teem with life and country music become synonymous
with Nashville, culminating into a Music City that continues to symbolize country music and serve as a destination
for musicians and songwriters in the genre.
Off Music Row and the busy streets of Broadway, a growing number of live venues, record stores and recording
studios now provide space for musicians and independent music businesses giving rise to genres outside of
country music and new schools of thought in how music business should occur.
The Music Industry Report 2020 focuses on the Nashville region music industry and contextualizes it by
examining other metro-areas with strong music industries as well as national and global trends. The maps below
show both the Nashville Metropolitan Statistical Area as well as the other metro areas this study will examine
comparatively. Throughout the report, “MSA” and “region,” or “metro region,” are used interchangeably:
Davidson
Wilson
Smith
Trousdale
Dickson
Robertson
Sumner
Macon
Rutherford
Cannon
Williamson
Cheatham
Maury
Nashville

27
Key Music Industry-Centric Regions
In the spring of 2020, cities across the United States began to shut down non-essential parts of their
economies to slow the spread of COVID-19. Shutdowns in Tennessee and Davidson County began in March.
Due to a better understanding of how to mitigate spread—and to strategic alterations of certain kinds of
events, gatherings and business activity—most areas in the United States have opened back up to some
degree. Safety is still the number one priority. At time of writing, many areas in the United States including
the Nashville MSA and rural Tennessee are experiencing rises in case counts. The future, in terms of an end
of the pandemic, remains uncertain. Within this dynamic, the heart of the music industry, live music, has come
to a grinding halt around the world. Most of the industry, if not employed directly in this subsector, is directly
or indirectly affected by its halt, a circumstance which adds urgency to this work.
While COVID-19 has taken the industry by storm and exposed pre-existing systemic weaknesses, it has also
revealed solidarity, resilience and opportunity for a few. Relief funding has been directed toward people
in the music industry. Subsectors have banded together to create safety nets for those out of work. Online
social networks have been used to foster community and stay connected. And, many are looking to recovery
as an opportunity for restructuring parts of the industry that were not efcient or equitable.
This is an important time to deepen understanding of the music industry. The research team approaches this
task humbly and Exploration and the Nashville Area Chamber of Commerce are excited to present the Music
Industry Report 2020.
Los Angeles
Denver
Chicago
Nashville
Memphis
Atlanta
New Orleans
Austin
POPULATION
13,000,000 - 19,000,000
9,000,000 - 13,000,000
3,000,000 - 9,000,000
1,500,000 - 3,000,000
1,000,000 - 1,500,000
New York


29
MUSIC INDUSTRY
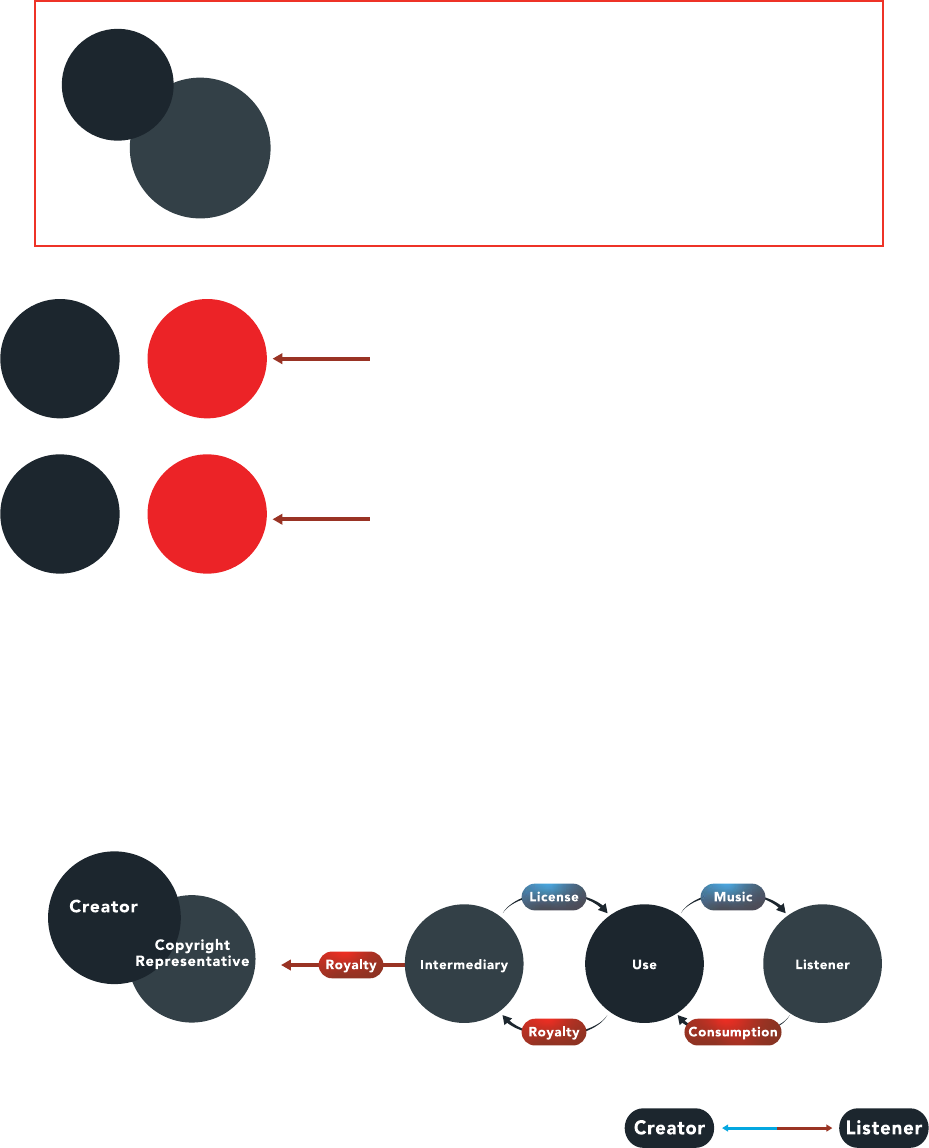
The music industry is based upon a relationship between the listener and the music creator.
At this fundamental level, it performs two essential tasks:
WORKS
1. Provide musical experiences to the listener.
2. Return value to the music creator.
Here we can observe a simple exchange
in utility. However, in today’s music
environment, the space between the two
ends of this exchange is quite complex.
Within the space between the creator and listener is a workforce of some 1.9
million people (RIAA, 2018) who strive to support the listener-creator relationship.
These people, businesses and organizations are what we call the music industry.
We can categorize the music industry into two channels of exchange—one dedicated to the
distribution of the creator’s musical experiences, the other to the distribution of listener value.
Creates
musical
content
Provides copyright
administration
and management
Licenses
musical content
for use
Provides listener
access to
musical
experiences
Enjoys
musical
experiences
Receives value in exchange
for exploitation of rights
Collects and
distrubutes
royalties generated
from uses
Monetizes value
from listener
and exploits
copyrights
Contributes value
in exchange
for access
to music
HOW THE

30
Creates
musical
content
Provides copyright
administration
and management
Licenses
musical content
for use
Provides listener
access to
musical
experiences
Enjoys
musical
experiences
CREATOR’S SIDE
The creator’s side of the exchange operates as a function of the creator’s rights and the
authorization of licenses. One can observe this process through the following four steps:
As someone who brings a creative work to life, a creator contributes to some aspect of
a song in its xed and nal form. Under United States Copyright Law, this makes them a
copyright owner. Copyright ownership endows an individual with six exclusive rights.
When it comes to their musical work, only they may authorize the following:
However, when listening to a song, you
are often appreciating the talent and
contributions of several creators. This
primarily includes songwriters (the people
writing the song) and recording artists
(the people performing the song to be
recorded). Notwithstanding, background
musicians, audio engineers and producers
are other essential contributors.
To balance the rights of the two primary contributors, copyright law associates two different types of
rights with a single song.
• A composition copyright for the songwriter
• A sound recording copyright for the recording artist
Therefore, for someone who is not the copyright owner to use music in any way, the rights
holder must license either the composition, the sound recording or both.

31
Creators often outsource the management and administration of their
copyrights to music publishers and record labels. These companies can
also serve the role of Copyright Representative. Among other tasks,
representatives help to issue licenses, administer royalties and establish
relationships with intermediaries. A representative’s primary goal is
to generally exploit composition and sound recording copyrights on
behalf of their clients.
Creator
Copyright
Representative
Intermediary
Intermediary organizations specialize in the widespread licensing of musical
works for use. These organizations also serve as royalty collection agencies
when returning value to the creator. Due to the variety of licenses and
royalties, different intermediaries specialize in different licensing activities.
Examples of royalty collection agencies in the United States include ASCAP,
BMI, Music Reports, the Harry Fox Agency, The MLC and SESAC.
Use
A use is a transaction that exploits one or more of the creator’s exclusive
rights. The creator or the copyright administrator authorizes this use through
a license. Companies who use the creative works in one of the six ways
mentioned above obtain this license which allows them to provide musical
experiences to listeners.
Listener
The listener receives emotional and artistic utility from musical experiences.
These songs will shape their day-to-day lives, inuence their perspective and
embellish their experiences. In exchange, listeners contribute value back to
creators as detailed on the next page.
32
Receives value in exchange
for exploitation of rights
Collects and
distrubutes
royalties generated
from uses
Monetizes value
from listener
and exploits
copyrights
Contributes value
in exchange
for access
to music
LISTENER’S SIDE
The alternative function of the music industry is to return value to the creator. This is a
function of collecting value and distributing royalties. On a broad scale, we can observe this
process through four steps.
Listener
Listeners contribute both monetary and nonmonetary value to creators in
exchange for access to musical experiences. This can be money out of the
listener’s pocket or simply their time and attention. The listener accesses
musical experiences in a variety of ways, many of which you likely encounter
daily. Whether you know it or not, you contribute value when accessing musical
experience—by paying for a subscription to a streaming platform, viewing an
ad before a YouTube video or listening to a catchy song in a car commercial. Ad
revenue, stream counts and radio spins create value which is then measured,
collected and monetized by companies or organizations who directly facilitate a
musical experience.
Musical
Experiences
Streaming
Songs
Watching
Online
Videos
Hearing
Background
Music
In
Public
Watching
Live
Music
Music
In Ads
Downloading
Digital
Music
Listening
to the
Radio
Film/TV
Music in
Video
Games
Sheet
Music,
Tabs, Lyrics
33
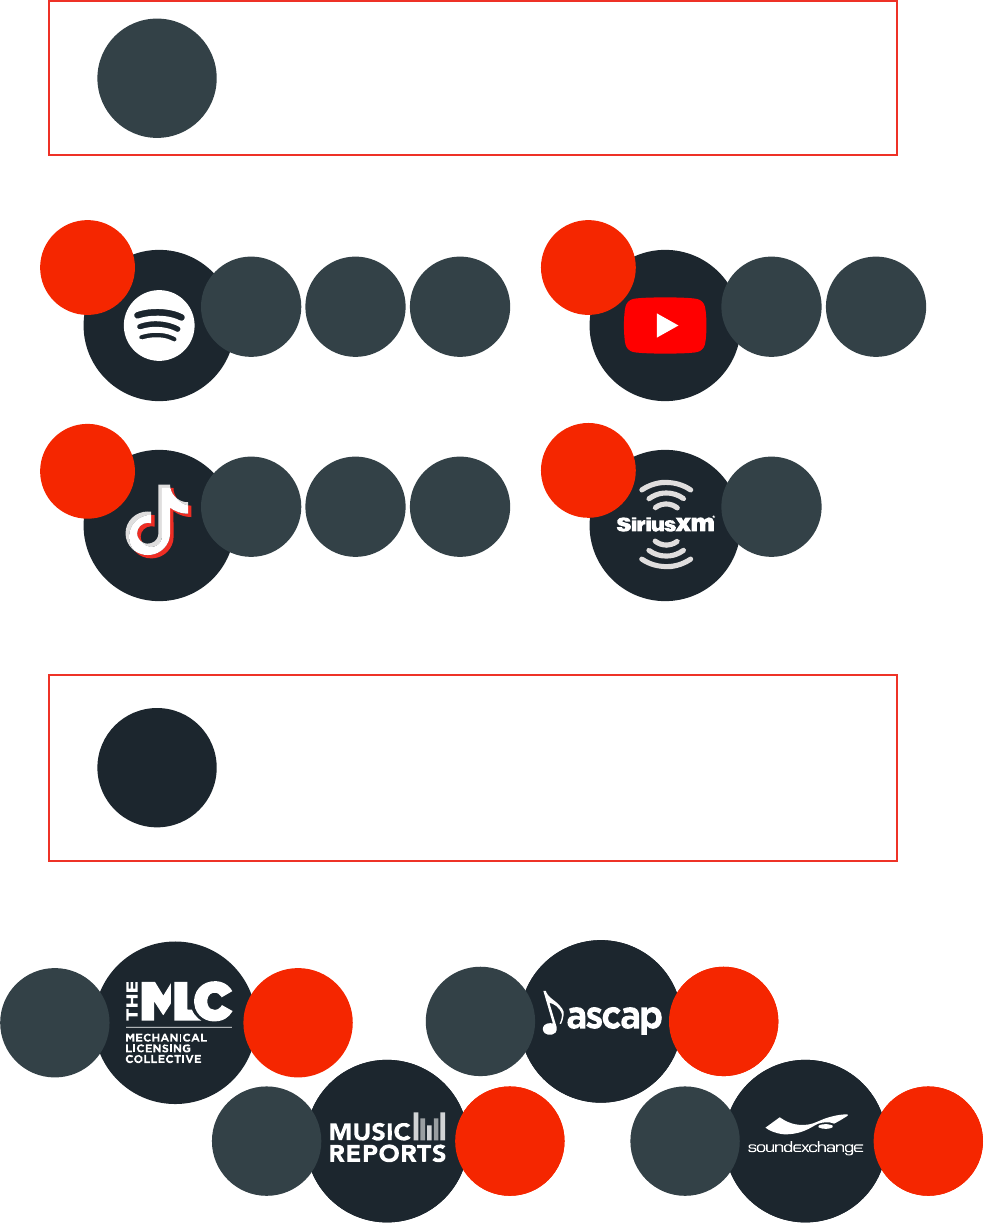
Use
A use is a transaction that grants the listener access to a musical experience.
Non-copyright owners are liable in the form of royalty payment for any use
of music that exploits one of the six exclusive rights mentioned above.
Below are just a few examples of some familiar uses and their respective royalties in the United States.
Intermediary
Every use of a musical work is associated with some form of royalty. Due
to the sheer volume of these royalties, intermediary organizations often
specialize in royalty collection. Because there are a diverse set of uses and
royalties to account for, different intermediaries specialize in different rights
management activities.
Below are just a few examples of some familiar Intermediary Organizations and their respective royalties in the US .
Streaming
TikTok
Youtube
Satellite
Radio
Performance
Royalty
Mechanical
Royalty
(Interactive)
Master-Use
Royalty
Mechanical
Royalty
Sync
Royalty
Performance
Royalty
Sync
Royalty
Performance
Royalty
Performance
Royalty
Mechanical
Royalty
Mechanical
Royalty
Collection
Agency
Performing
Rights
Organization
Composition
Performance
Royalty
Mechanical
Royalty
Mechanical
Royalty
Collection
Agency
Sound
Recording
Performance
Royalty
Sound
Recording
Performing
Rights
Organization
Music publishers typically serve the role of Copyright Representative
for songwriters while record labels serve this role for recording artists.
Music publishers and record labels collect the royalties for their
respective creators and pay them accordingly. Contracts between
creators and representatives typically specify a length of time, how
creator’s exclusive rights are transferred and the administrator’s
compensation.
Creator
Copyright
Representative
Industry workers appear to recognize a
discrepancy between compensation for
creators and the value they provide. Most
respondents to the Survey to the Music
Industry asserted that both songwriters and
recording artists are not compensated fairly for
their work. Sixty-ve percent of respondents
do not believe songwriters are compensated
fairly for their work and 52.3% do not believe
recording artists are compensated fairly for
their work. This compensation structure has
powerful inuence over the creator’s livelihood
and facilitates the nal step in the exchange of
value.
This exchange supports the listener – creator relationship and effectively the entire industry.
Through these two channels of exchange, from the Creator’s Side and the Listener’s Side, money and music
certainly appear to be thrown in every direction, exchanged by multiple parties. It may come across as quite the
juggling act. But all else aside, the basic goal is to facilitate the experience of a listener and the livelihood of a
music creator. A rich ecosystem of businesses, organizations and people make this exchange possible.
Not only are there many caveats to this process, it is also subject to
constant change. The industry adapts to new developments in the way
people both listen to and create music.
At the end of the day, the entire act is dedicated to the two most important contributors and their essential
relationship: the listener and the creator.
Songwriter Publisher
Recording
Artist
Record
Label
Composition
Royalties
Sound
Recording
Royalties
34


FACETS OF THE
MUSIC INDUSTRY TODAY
The music industry is worth over $50 billion. Two categories, live music and recorded music, account
for $20.2 billion and $25.6 billion of this total, respectively, leaving approximately $10 billion for
music publishing, $3.5 billion for music merchandise licensing and $6 billion for musical instrument
retail, among other sources of revenue.
Recorded Music 30.6%
15.2%
38.9%
9.1%
5.3%
1%
Percentage
Source of
Music Industry Revenue
(2019 Global)
20.2
10
25.6
6
3.5
0.7
66.0
Count
(By Billions)
Music Publishing
Live Music
Merchandise
Instrument and Equipment Retail
Other
Total
Each of these revenue sources account for a network of business operations explored in following details.
TRADITIONAL SMALL BUSINESS MODELS,
STARTUPS AND VENTURE CAPITALISM
A few large corporations—Sony Music Entertainment, Warner Music Group and Universal Music Group—
traditionally dominate market share in the recorded music industry. According to research rm MIDiA, 2018 saw
the “Big 3” comprising 70% of $18.9B in total revenue.
Small businesses, on the other hand, provide a unique glimpse into the health of an industry. Newer companies
act as hotbeds for innovation through technological development and operational efciency. Corporations often
enlist the services of startups in the world of music publishing and recorded music. And to the watchful eye,
venture capital represents a signpost for the most successful music businesses of tomorrow.
Though the small business and startup environment may be tumultuous, opportunities and emerging markets
continue to develop in the face of adversity.
36
1 2 3
4 5
6
WHO RUNS THE SHOW?
Small businesses and startups represent a smaller and more concentrated eld compared to the size and
inuence of larger corporations that make up the music industry. This report’s Survey to the Music Industry
tracked a population of 271 company owners ltered only to those who own companies employing less than
one hundred people (263).
CURRENT STATUS BY THE NUMBERS
Nearly seventy-nine percent of small business owners report losing revenue since the onset of COVID-19.
For those facing lost revenue and mounting expenses, lay-offs, furloughs and other reductions in staff
inevitably come under consideration. Most small business owners have delayed hiring, laid-off or furloughed
employees since the onset of COVID-19. Twenty-nine percent report having laid off or furloughed at least one
employee. Only 5.9% have hired on.
As for benets and other forms of relief offered to employees, 88% have not offered additional monetary
or other relief since the onset of COVID-19. Many companies who were able to provide employees with
additional relief cite the Paycheck Protection Program.
Insurance plans have largely remained unchanged for small business owners, though 48.2% of respondents
say their companies do not offer health insurance.
More than half of respondents anticipate their companies bouncing back to similar levels of revenue in one
to two years, about one fth expect to return to similar levels of revenue in seven to twelve months and still
fewer predict recovery for their company in three to four years. Signed clients are decreasing in value for nearly
60% of respondents.
Many small businesses have been able to remain alive during the COVID-19 pandemic thanks to government
aid from the U.S. Small Business Administration through the Paycheck Protection Program (PPP) and Economic
Injury Disaster Loans (EIDL). Out of 114 survey respondents who applied for PPP, 84.2% were accepted. Out of
74 survey respondents who applied for EIDL, 77% of small business owners were accepted.
Seventeen percent of respondents have altered their standard agreements with clients in a material way.
Examples include pandemic clauses, lowering rates, exible cancellation and shorter terms.
37

SUCCESS METRICS AND OUTLOOK
Uncertainty almost never bodes well for an economy in the short term. Investors tend to hold off and mitigate
risk during periods of unrest and widespread change. Even small businesses and startups—traditionally the
inheritors of relatively signicant levels of risk—naturally contract under losses in revenue by hiring fewer
people and investing less in growth.
COVID-19, in addition to being an international health crisis, may spell the end for many small businesses in
the music industry. Nonetheless, a few will inevitably rise to the top.
Heather McBee of the Nashville Entrepreneur Center (NEC) and music industry veteran shares her perspective
on the music business’ impact on the music-minded entrepreneur culture in Nashville. The NEC runs a startup
accelerator called Project Music which brings together business leaders and tech entrepreneurs in the music
industry.
“The music industry works together to tackle its collective challenges. You can see that in an
organization like Leadership Music which brings together industry leaders from all sectors
to learn and collaborate. In the NEC’s Project Music program, we emulate the industry’s
collaborat[ive] nature by bringing together the entrepreneurs who are taking risks that drive
industry innovation. As they build their businesses and immerse in the music business, they
too work together to thrive.”
38

CURRENT STATUS BY THE NUMBERS
Nearly forty-eight percent of respondents from the Survey to the Music Industry somewhat or completely
disagree that the music industry adapts well to new technology. 4.8% don’t know.
Many were able to make the transition to remote work in 2020 and utilize video streaming technology to
maintain operational efciency. Only 16% of company owners reported remote work was not an option for
their business. Seventeen percent of those surveyed were not able to make the transition to remote work
during COVID-19. Only 19.8% of those who were able to make the transition claim remote work decreased
their working efciency day-to-day.
Some companies interviewed for this report, including Bandzoogle and Exploration, have always been remote-
rst and therefore did not require transition.
The Mechanical Licensing Collective (The MLC), discussed further later in this report, is an excellent example
of a large organization developing in the face of adversity. Currently operating with a staff of roughly 40
employees, it has never experienced in-person operations. Nearly all of its activities have occurred remotely
over 2020.
“Due to COVID, we have had to build [The MLC] as a fully remote and fully distributed
company,” says Kris Ahrend, “and we’ve been able to lean in and leverage a variety of
technology platforms that support remote working to ensure our team can continue to
function effectively during the pandemic.”
The Mechanical Licensing Collective
SOFTWARE, TECHNOLOGY
AND NEW MEDIA
Digital music is the most dominant form of music consumption in the world today. With the proliferation of
accessible technology and the renement of user experience, music consumers continue a steady advance in
their dependence on new media and technology. According to Mary Meeker’s BOND “Internet Trends 2019,”
total digital media usage is accelerating by 5% year-over-year based on daily hours spent with digital media per
adult user.
The adage “necessity is the mother of invention” proves accurate as it applies to the music industry’s
technological response to the COVID-19 pandemic. Newer forms of communication help maintain business
operations; newer entertainment media help sell advertisements; and newer catalog management tools help
intellectual property holders control their metadata.
39
7

40
“My reality of what my expectations are has had to kind of reset and my communication
with people has gotten a lot tighter. I’ve been scheduling a lot more calls. I’m less reliant
on email. I guess I’ve been trying to hone my relationships better. It’s actually given me
time to reach out to people and speak to them for longer than 10 minutes which I’ve
never really done before—it’s always been email, slack, [and] direct messages.”
Joel T. Jordan, Founder & President, Synchtank
“Conducting business in person is very different than conducting it on a Zoom call. I think
people have adjusted in the sense that they’re more productive…at the same time, on any
given day a signicant amount of members used to come by our ofce or we would go visit,
go out with after work, see at shows—that kind of spontaneous business isn’t happening.”
Richard James Burgess, President & CEO,
American Association of Independent Music
“I’m content to be where we are right now. The biggest downside for me in being
remote is the impact on our culture; its maintenance and development. Our productivity
seems to be as robust as ever. It’s just very hard to enfranchise or to bring on new people
to our workforce from a cultural perspective. That’s a very important aspect for me. For
us. Culture drives everything.”
Randy Goodman, CEO, Sony Music Nashville
“Given the way the music industry landscape began changing several years ago, our
company proactively built itself around everyone working remotely. It was part of our
strategy to save overhead and foster growth. We’ve stayed remote for six years now.”
Rene Merideth, Co-Founder/COO, Exploratiotion Group
Video conference meetings and working from home were frequent topics of conversation during
interviews with music industry stakeholders for this research.
“There is an opportunity to connect with new people who are based in L.A. or New York
who you might normally not have gotten a chance to work with but now because of COVID
they might be more willing to take a chance working with an upcoming artist.”
Anonymous A&R Consultant & Artist Manager

41
SUCCESS METRICS AND OUTLOOK
Livestreaming is a promising new media emerging during COVID-19 for performing artists. It is unclear, however,
whether this will result in any signicant revenues for the music industry.
While 83.9% of music creators surveyed did not perform any livestream concerts between March and April of
2019, 82.8% of music creators performed at least one live stream concert between March and April of 2020. One
respondent performed over one hundred livestreams.
“Right around March when I stopped playing on Broadway—which is what I do when I’m
home. That shut down so I had to adapt and gure it out.
So, I set up this crazy room I’m sitting in now. I do livestreams four nights a week and
that feeds my family and keeps all the bills paid. It’s interesting that I worked my whole
life to get to where I am right now and then all of this got shut down.”
Tyson Leslie, Rock Artist
“No artist can sustain [live]streaming for free forever. Until recently, the platforms that
many artists were ocking to for livestreams—namely the ones that were most familiar
to them, like Facebook and Instagram—could not be monetized at all. You could do a
charity stream, but it was impossible to get tips from fans directly to your own account
on the platform. Essentially, in exchange for artists losing all their revenues from touring,
they had to go online and do the same thing for free. It was a huge value gap.”
Data from the Consumer Survey sends some mixed messages when it comes to the “success” of livestreaming.
58.5% of respondents attended a livestream between March and April of 2020. This is an improvement from
March through April of 2019 during which only 26% of people reported attending a single livestream concert.
Most people surveyed watch over half of a livestream but not all of it. 71.3% of respondents said they did not
pay for any of the livestream concerts they attended. Thirty-nine percent said they were unsure if they would
ever pay to attend a livestream concert. Most (89%) concur that the cost of a ticket to a virtual concert should be
less than the cost of an in-person concert.
Comparing a live concert experience to a digitally streamed concert, 50% said it is nowhere near the real
experience. 31% of people said it is “pretty good but not the same.”
The research team spoke with Cherie Hu, Founder of Water & Music, for her perspective.

42
Regarding how artists can make livestreaming sustainable:
“There are a couple different approaches that I’ve seen work. One is high frequency,
or livestreaming often, at the pace of once a week or even once a day, to help build
a regular schedule and habit of engagement with fans. Another is high intimacy and
interactivity — namely, showing the fans the totality of the artist as a person during the
stream and/or giving people the opportunity to contribute to and inuence the outcome
of the stream. The third category would be high production value, on the level of a
Netix lm or concert documentary or even an in-game concert, that pushes the needle
on what a livestream musical experience really is. This is also a question of what [fans]
would be willing to pay for. I think for a super high-production, interactive, immersive
viewing experience, you can put a price tag on that and fans will be willing to pay. I
would say 99% of fans have never paid for a livestream before, but that’s also because
they never had the opportunity to.”
COLLECTIVE MANAGEMENT
ORGANIZATIONS
Among all sources of revenue within the music industry, recorded music generates the most, second only
to live music revenue. Licensing the use of this music is no simple task; it accounts for massive volumes of
musical works requiring the help of collective management organizations (CMOs). When a licensee pays for
a mechanical license, they pay for the right to reproduce a composition through the process of recording,
manufacturing and distributing the work. Money generated from plays on an interactive streaming service,
for example, result in a mechanical royalty for rights owners. Performance royalties are generated from public
performance of the song—live, on a streaming platform or any place where people gather.
The primarily digital nature of mechanical and performance licensing helps to uphold these organizations’
operations during the COVID-19 pandemic. However, the National Independent Venues Alliance has revealed
that 90% of its members will be closed in October of 2020 which means venues have not been open to host
events that would garner performance royalties. Businesses and companies typically open to the public seem
to have maintained their membership with CMOs. However, uncertainty remains with growing concerns about
continued pandemic restrictions and a hyper-focus on correct metadata.
WHO RUNS THE SHOW?
ASCAP, BMI, SESAC and GMR are the performing rights organizations (PROs) for the United States. The
Harry Fox Agency, Music Reports, Inc. and now The Mechanical Licensing Collective are the mechanical
rights organizations for the United States. SoundExchange is a rights organization hand-picked by the U.S.
Government to handle master performance royalties in the United States. The Mechanical Licensing Collective
and SESAC are headquartered in Nashville, SESAC on 35 Music Square East; ASCAP, BMI and the Harry Fox
Agency are headquartered in New York City and host afliate branches in Nashville.
Cherie Hu, Founder of Water & Music
8

43
Notable CMOs around the world include PRS in the U.K., GEMA of Germany, FILSCAP of the Philippines,
SACM of Mexico, SOCAN in Canada, SACEM in France and SGAE in Spain. Most collective management
organizations around the world account for both performance and mechanical royalties; the United States
separates each license type.
Administrators can play a key role in managing a CMO’s metadata to increase royalty payments from users of
music to copyright owners. ICE, BMAT, and Exploration Group are notable examples.
CURRENT STATUS BY THE NUMBERS
Numbers from this report’s Survey to the Music Industry yield compelling insights. Regarding PROs,
future venue blanket license renewal appears to be shrouded in uncertainty. Of respondents involved
directly in venue operations, 35.4% were unsure as to whether they would renew their blanket licenses
with their country’s respective PRO.
The Mechanical Licensing Collective (The MLC) is currently preparing to manage all Section 115 Digital
Licensing in the United States which will fundamentally change how both rightsholders and digital service
platforms operate. Strategically located in Nashville, this initiative was contracted under the 2018 Music
Modernization Act and is scheduled to begin operations in January of 2021. As Kris Ahrend, CEO of The
MLC, explains:
“The MLC will be receiving sound recording data from the U.S. digital audio services that
secure the new statutory blanket license and then matching it with the musical works
data that we maintain in our new musical works database, in order to determine how
to distribute the mechanical royalties we receive to publishers and self-administered
songwriters entitled to receive those royalties. Since we are the exclusive administrator
of the new blanket license, every music publisher and self-administered songwriter in
the country and any in the world whose songs are made available on U.S. digital audio
services will receive at least a portion of their mechanical royalties from those U.S. digital
audio services from The MLC. We began rolling out the rst version of our new user
portal at the end of this past September, and we have now invited almost 7,000 music
publishers, administrators, and self-administered songwriters to set up their portal user
accounts and member proles. We will continue to invite more and more members to set
up their portal accounts in the coming weeks and months.”
Kris Ahrend, CEO, The Mechanical Licensing Collective
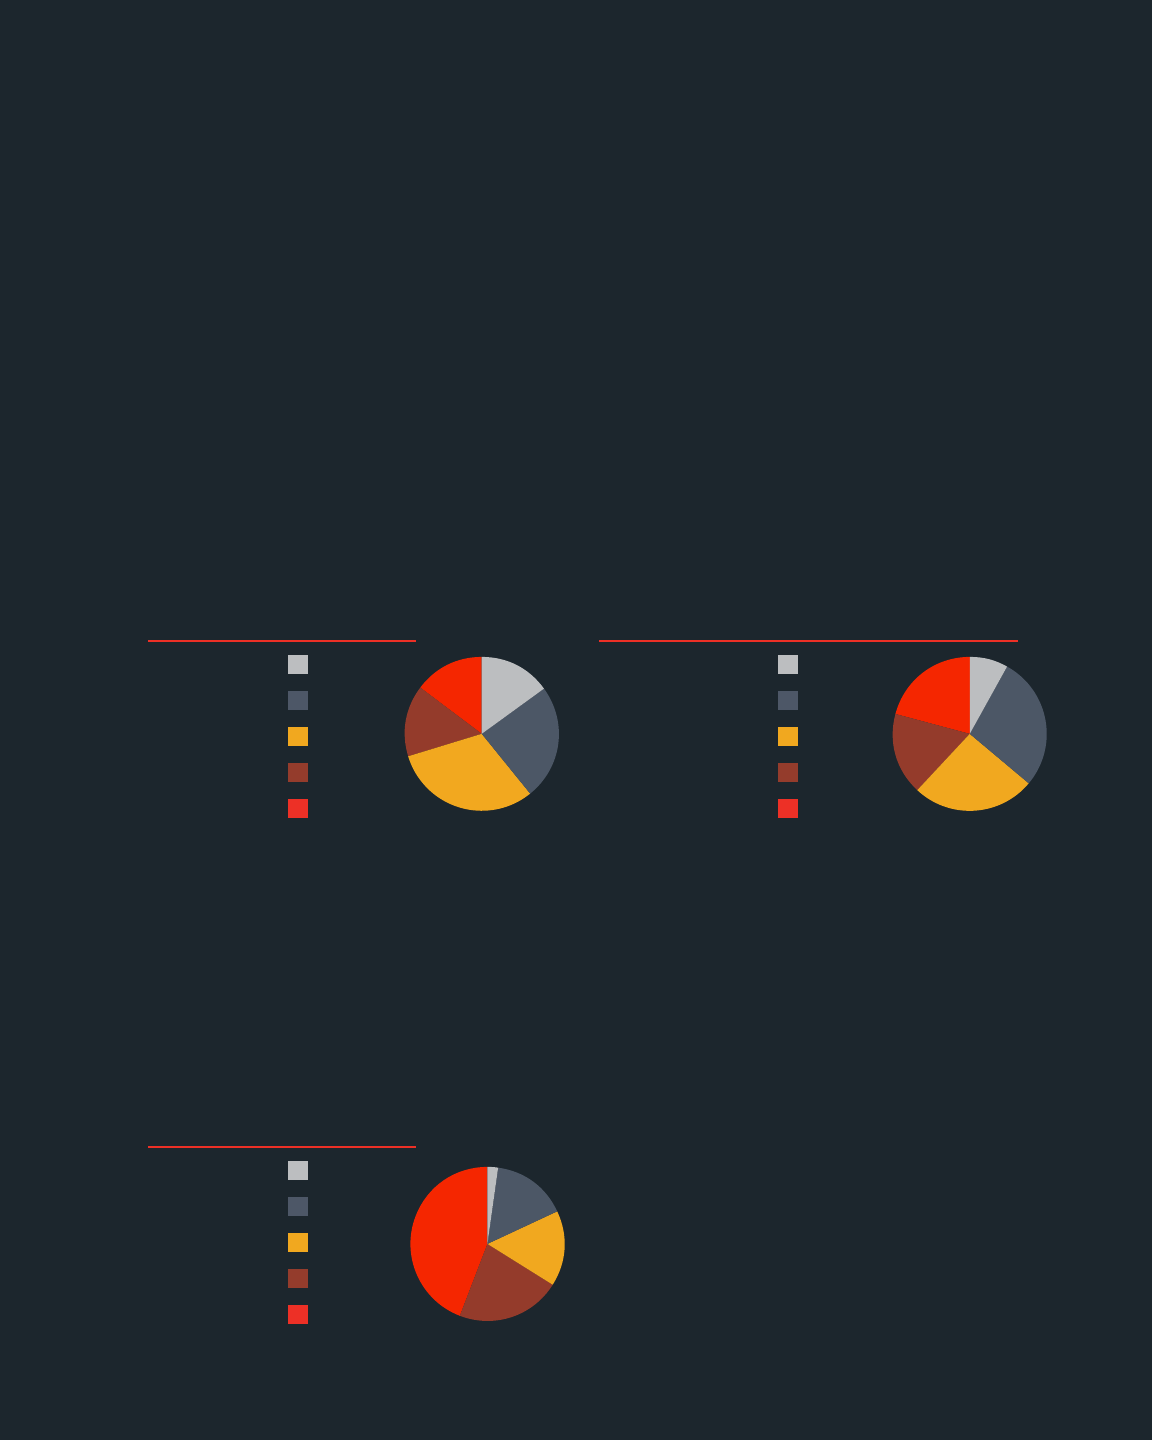
44
Not at all (0)
Please rank your preparedness for The Mechanical Licensing Collective (Scale: 0-10)
It should be noted that no aspect of this research is intended as a criticism of CMOs, The Mechanical
Licensing Collective or its efforts. Our purpose in asking about preparedness is to gauge awareness of
metadata dependence and utility by professionals in the music industry, as well as to measure the music
industry preparedness for a major shift in the payment of mechanical royalties come 2021. Towards this aim,
the research indicates that a signicant portion of music industry professionals who do not directly deal with
metadata remain unaware of its importance in revenue generation.
In the Survey to the Music Industry, researchers asked U.S. respondents to rank their preparedness for
The Mechanical Licensing Collective on a scale of 1 – 10 with a zero indicating the respondent is not at all
prepared. Approximately 15% of all music industry professionals indicate they are not at all prepared for this
change when asked to rank their preparedness for The MLC. Approximately 24.4% of respondents indicate
low preparedness. Nearly 31% of these respondents selected 5, or the midpoint in the scale. When reviewing
this data, it became unclear if these respondents were truly selecting the midpoint as an indication of their
preparedness or if they were indifferent to the question of preparedness, signifying this question was of
little importance to them. For this reason, we separated the midpoint responses as neutral. Given this, we
determined 14.9% of overall respondents fall into a moderate level of preparedness and 14.6% are in the
high preparedness category.
Low (1-4)
Midpoint (5)
Moderate (0-6)
High (0-6)
Not at all (0)
Low (1-4)
Midpoint (5)
Moderate (0-6)
High (0-6)
All Music Industry Professionals Songwriters, Composers, Lyricists and Arrangers
15.0%
24.4%
31.0%
14.9%
14.6%
8.3%
28.0%
25.8%
17.2%
20.7%
Songwriters, Composers, Lyricists and Arrangers are more likely to feel prepared for The MLC. Just 8.3% feel
completely unprepared. Since 25.8% again selected the midpoint response on the scale, we determined
28.0% indicate a low level of preparedness, 17.2% a moderate level and 20.7% a high level of preparedness.
Respondents classied as being in Music Publishing Creative Operations and/or Catalog Administration,
Rights Management, and Metadata Organizations were most likely to be prepared for The MLC, with 44.1%
indicating a high level of preparedness and another 21.8% indicating they are moderately prepared. Just
18.3% of those who self-identied as being in this category of the industry indicate no or low preparedness.
Not at all (0)
Please rank your preparedness for The Mechanical Licensing Collective (Scale: 0-10)
Low (1-4)
Midpoint (5)
Moderate (0-6)
High (0-6)
All Music Industry Professionals
2.4%
15.9%
15.9%
21.8%
44.1%

45
Not at all (0)
Low (1-4)
Midpoint (5)
Moderate (0-6)
High (0-6)
All Music Industry Professionals
0.6%
8.0%
19.7%
25.2%
46.5%
Please rank the music industry’s dependence on copyright metadata (Scale: 0-10)
Not at all (0)
Low (1-4)
Midpoint (5)
Moderate (0-6)
High (0-6)
Performance or Mechanical Rights Society Operations or in the eld of
Catalog Administration, Metadata Organization, and Rights Management
0.9%
0.9%
7.4%
14.8%
75.9%
Please rank the music industry’s dependence on copyright metadata (Scale: 0-10)
Digital Service Platform Operations personnel predominantly indicate they feel unprepared, with 14.3%
indicating they were not prepared at all, another 35.7% having a low level of preparedness and 14.3%
indicating a high level of preparedness. It should be noted the sample size of this category of music
professional was extremely small (approximately 14 responses) and the researchers would not normally
include this breakout were it not for the fact that music listening on digital service platforms like Spotify
and Apple Music accounts for mechanical royalties paid through The MLC to publishers and songwriters;
DSPs also fund The MLC in part through administrative fees.
The business operations of Collective Management Organizations depend heavily upon information
associated with the ownership and association of musical works. Much of this information gets
documented in the form of digital code or metadata.
Respondents to this report’s Survey to the Music Industry are largely aware of the dependence of the music
industry on copyright metadata with 46.5% considering it of high importance and 25.2% considering it of
moderate importance.
Respondents involved in Record Label Operations are even more likely to understand the high metadata
dependence of the music industry with 58.8% ranking it as high and 39% ranking it as moderate. Music
Publishing Creative Operations rank metadata dependence even higher with 68.1% considering the music
industry highly dependent.
Not surprisingly, respondents who work in Performance or Mechanical Rights Society Operations or in the
eld of Catalog Administration, Metadata Organization, and Rights Management are most likely to highly
rank metadata dependence in the music industry with 75.9% considering it as high and 14.8% as moderate.

46
SUCCESS METRICS AND OUTLOOK
Though CMOs may have averted some negative impacts of the pandemic, their members and users maintain a
high level of risk.
Digital mechanical royalties account for a large portion of revenue generated in the music industry. CMOs like
The Mechanical Licensing Collective exist to facilitate these payments to the correct rightsholder. Accurate
metadata is crucial for this to occur. Recommended steps rights owners can take today are to utilize free
online catalog management software, request an audit from a reputable rights manager and participate in The
Mechanical Licensing Collective’s Data Quality Initiative (DQI). Regarding DQI, Kris Ahrend notes,
“Our data quality initiative allows our members to compare their musical works data with
the musical works data we have assembled in our database, to give people a really clear
way to see the discrepancies between their data and ours. Members who participate will
receive a report showing them only the discrepancies between our data and theirs, which
will enable them to identify and correct any errors in the data we have for their works.
Addressing these discrepancies now will ensure that their data is as accurate as possible
in advance of our rst distribution of royalties next spring.”
As the Nashville Songwriters Association International slogan goes: “Everything starts with a song.”
Songwriters are a primary source of intellectual property in the music industry.
Often, a writer’s catalog is partially owned and/or represented by music publishers or publishing administration
companies who take a portion of revenue in exchange for business opportunities for the songs and for the
songwriter. Nearly twenty-six percent of songwriters, composers, lyricists and arrangers from this report’s
Survey to the Music Industry are signed to a music publisher.
Performing and recording artists account for the other primary source of intellectual property in the music
industry, sound recordings. Artists are a driving force of the musical economy bringing beloved songs to life
either independently or through a record label’s investment.
An artist’s catalog can be partially owned and/or represented by record labels or record label services
companies. Traditional deals require the artist to sign over their master rights for a recoupable advance.
According to the Survey to the Music Industry, only 15.7% of all recording artists, vocalists and studio/
performing musicians are signed to a record label.
Given the large-scale acquisition of independent record labels and music publishers over the past two decades
by three major companies, in addition to the rise of “independence” as a marketable characteristic, lines have
blurred on a standard denition of what it means to be an independent artist. The Survey to the Music Industry
shows that an individual music creator’s concept of themselves as “independent” correlates strongly, but not
exclusively, with copyright ownership. Of the subset of music creators surveyed who consider themselves to be
independent artists, 75.8% own all of their music copyrights and 22.4% own some.
SONGWRITERS, RECORDING ARTISTS,
MUSIC PUBLISHERS AND RECORD LABELS
9
47
With a growing number of independent creators nding mainstream success, copyright administrators offer a
means for independent songwriters and artists to build the value of their intellectual property which not only
positions them well for a future publisher and/or label partnership but offers them a way to support themselves
over the life of their career.
WHO RUNS THE SHOW?
The record industry is dominated by the “big three” record labels—Universal Music Group (UMG), Sony Music
Entertainment (SME) and Warner Music Group (WMG). They consist of multiple sub-labels each with its own brand
and genre identity. These respective three entities also control the top music publishers in the music industry:
Universal Music Publishing Group (UMPG), Sony ATV and Warner Chappell. Other “mini-major” music publishing
companies include Kobalt and BMG. Each of these companies have afliate branches in Nashville.
Outside of the majors, independent songwriters, music publishers, recording artists and record labels comprise
a sizable portion of market share. Some of the most high-prole independent record labels and music publishers
include Domino, Reservoir Media, Round Hill, 4AD, XL, Sub Pop, Stones Throw, Spirit Music Group, Downtown
Music Publishing and Concord.
Readers may be familiar with the names of producers and track writers like Max Martin, Dr. Luke, David Guetta
and Timbaland. The names Shane McAnally, Ryan Tedder and Ester Dean might ring a bell for viewers of the
hit songwriting show Songland. But for the most part, songwriters who are not recording artists do not become
household names. Meanwhile, their creative work powers the world’s most recognizable songs. Marcus Hummon,
the songwriter behind Miranda Lambert’s “House That Built Me,” and Benny Blanco, who co-wrote Katy Perry’s
“Teenage Dream,” Kesha’s “TikTok” and Ed Sheeran’s “Castle on the Hill” are two prominent examples. For
more examples and for information on songwriting culture, please see the Evaluation of Trends by Genre in the
Nashville Region later in this study.
CURRENT STATUS BY THE NUMBERS
Since March, Bart Herbison, Executive Director of Nashville Songwriters Association International (NSAI), has
worked alongside state and federal government to pass legislation to protect songwriters and other freelance
workers who were not previously able to apply for government aid. According to Herbison, due to this legislation,
“Gig workers [and] songwriters are eligible for unemployment, paycheck protection loans, emergency injury
disaster loans and whatever else they do for the rest of the pandemic.”
COVID-19 has created huge changes to the workow of music creators since March. Collaborating with other
artists, musicians, writers and producers from home is a process that some say hinders their creativity and makes
them feel less engaged. Seventy-four percent of music creators surveyed are making less music since the onset
of COVID-19. Thirty-seven percent report it is more difcult to nd time to create. Be it the emotional and
mental struggles induced by the pandemic, technological issues, or loss of time and inspiration, music making has
taken a hit since March.
10

48
As a direct result of COVID-19:
Independent
Artists/Songwriters
Non-Independent
Artists/Songwriters
Terminated an agreement with an
individual or company that was
representing me or my music
Entered into an agreement with an
individual or company to represent
me or my music
Had to take on an additional job
related to music
Had to take on an additional job
unrelated to music
Purchased new gear, audio
equipment and/or
musical instruments
Devoted resources toward
building a home studio
Cancelled or postponed my tour
Loss of scheduled gigs,
studio work or residency
Loss of revenue, employmentor
benets
Had to sell gear, equipment or
personal belongings
Participated in a livestream concert
for compensation
Participated in a livestream concert
for no compensation
Promoted my music on TikTok
Started a social media campaign or
crowd-funding to raise money
6.9% 5.7%
4.2% 0%
23% 17.1%
9% 5.7%
32.5% 31.4%
24.8% 17.1%
45.7% 28.6%
77.9% 85.7%
74% 85.7%
31% 28.6%
27.2% 17.1%
46.3% 34.3%
7.8% 0%
6.6% 8.6%
Delayed a music release
34.6% 22.9%

2.460 million
2.175 million
1.966 million
1.886 million
1.886 million
1.868 million
1.725 million
1.676 million
1.640 million
1.530 million
Total
Album
Equivalent
Consumption
Artists
57,000
439,000
28,000
93,000
20,000
315,000
33,000
283,000
19,000
26,000
Album
Sales
390,000
664,000
116,000
586,000
119,000
552,000
281,000
652,000
271,000
311,000
Digital
Songs
3.019 billion
2.134 billion
2.720 billion
2.290 billion
2.422 billion
1.854 billion
2.123 billion
1.736 billion
2.074 billion
1.965 billion
On-Demand
Audio Streams
Drake
The Weeknd
Lil Uzi Vert
Post Malone
Youngboy Never Broke Again
Eminem
Lil Baby
Billie Eilish
Roddy Ricch
DaBaby
3.019 billion
2.134 billion
2.720 billion
2.290 billion
2.422 billion
1.854 billion
2.123 billion
1.736 billion
2.074 billion
1.965 billion
On-Demand
Video Streams
1
2
3
4
5
6
7
8
9
10
49
On the record label and publisher side of things, companies are still signing talent. Some have pivoted to
managing more than just musicians—Sam Saideman at Innovo Management, for example, added a few social
media inuencers to Innovo’s roster.
An artist manager and A&R Consultant explained that they are scouting through “Shazam charts, YouTube,
Spotify, Apple [Music], Amazon [Music]…all of the different kinds of research playlists and tastemaker
playlists. TikTok is a big one.”
SUCCESS METRICS AND OUTLOOK
2020 Billboard Mid-Year charts, the Top 10 Artists by Total Consumption
11

Billboard charts like the one above account for just a small picture of the larger music industry. Of the respondents
to this report’s Survey to the Music Industry only 15.3% agreed that commercial industry charts are an effective
metric for distributing music royalties.
Success metrics for songwriters, artists, music publishers and record labels are the accumulation of a variety of
income, often including merchandise, live performance, etc. in addition to digital streaming revenue or physical
sales. Although live music is largely defunct at the time of writing, music streaming is up 13.8% between March
and July of 2020 and apps like TikTok are helping artists promote their work. Many social media giants—like
TikTok, Facebook and Instagram, plus even digital service providers like Spotify—have in the past often fallen
under criticism for a perceived negligence to properly license and pay out royalties to copyright owners for the
use of music on their platforms. Advocacy groups and rightsholders continue to push for greater transparency in
royalty accounting and higher licensing rates. The Mechanical Licensing Collective represents signicant progress
on this front.
In addition to performance and mechanical royalties from digital sources, synchronization can be a huge revenue
stream for songwriters, music publishers, recording artists and record labels alike who are willing to put in the
time and effort or hire a licensor. However, placements can be a more sporadic income source compared to
performance and mechanical royalties.
50
12 13

51
In relatively recent history, the operation of home music studios in Nashville has been controversial. In the
late 1990s, Metro Nashville-Davidson County updated its zoning code. This overhaul included regulation
stipulating that home businesses were not allowed to have paying clients on the premises nor employees
that did not live in the residence. This regulation was not proactively enforced on home studios. Rather,
the regulation was complaint-driven. If an individual reported the business to the city, Metro Codes took
action by evaluating and requesting modications of the home business’ operations. Over time, there have
been multiple attempts from members of Metro Council to amend these rules, notably a failed bill in 2011
applying to many types of businesses and a bill specic to music recording studios that was withdrawn
before vote in 2012 due to resistance from neighborhood associations.
In early July of 2020, the Nashville Metro Council adopted legislation (Bill BL2019-48) allowing certain
types of businesses to operate in residential homes by creating new permitting regulations. “This decision
came after councilmembers held nine months of sometimes-tedious debates on the impact that allowing
a permit could have on neighborhoods. ” One theme of these debates was that these sorts of uses in
residential areas had been occurring for some time and this was an opportunity for these home-businesses
to operate above-board. Among other stipulations, the bill loosens restrictions on both paying clients
and employees permitted to visit home-based businesses. It applies to home studios as well as other
uses—personal instruction, general ofce, personal care services, multimedia production and artisan
manufacturing. The addition of other uses in the push for this legislation was very likely a contributor to its
passing. This regulation affects many more residential businesses than just home studios which broadens
the conversation and the potential impacts.
The arguments surrounding expanding the use and operations of home studios are multifaceted.
There is lower overhead cost for a residence-based studio versus a commercial location. The change to
operations of home studios leaves some neighbors concerned, however, that the residential character of
their neighborhood will disappear. According to Bill Herbert and Emily Lamb with Nashville Metro Codes
Department, this is usually the primary driver behind opposition to zoning updates.
At the time of writing, Metro Codes has received applications for 16 permits for all uses and one for
multimedia production, the classication home music studios fall under. It will be interesting to monitor the
progress of permitted home studios in Nashville.
Nashville Home Studios
14

Building Community
Community has always been important to creatives. In the 2015 book, Beyond the Beat, Vanderbilt
Sociologist Professor Daniel Corneld presents a sociological framework for artists, using Nashville
musicians as an example. “The sociological theory of artist activism presented here addresses how artist
activists build a peer community for sustaining the livelihoods of individuals and the whole occupation.” He
denes artist activism as “acts of occupational self-determination taken by artist peers in organizing and
reorganizing their peer community.” In an increasingly freelance era, artists are pushed to individualize risk
and ght for their own success, but artists that take on the artist activist role envision “a new community
or institution that manages and minimizes the risk of joblessness inherent in the music scene. ” These
perceived risks include the artist themselves, other peers and gatekeepers, as well as technological,
political, legal and market forces.
What is the importance of this role in a world where artists are largely isolated from each other, their
support networks and their audiences? How has the pandemic presented challenges and opportunities to
community-building efforts?
Collectivism can be found online. Artists and songwriters have utilized and created online spaces for writing
and playing together and have grouped together to raise funds so that creatives are able to survive in
the face of mass unemployment. Interviews with songwriters and music publishers including Emily Falvey
(SMACKSONGS), Katie Fagan (Head of A&R at Prescription Songs) and Livia Piomelli (Big Noise Publishing)
all mention taking advantage of Zoom co-writing sessions to bypass geographic restraints.
It can be found in the efforts of Nashville’s largest trade union, the Nashville Musicians Association AFM
Local 257 to raise money for a crisis fund like what they did after the 2010 ood. Local 257 President Dave
Pomeroy cites the current unpredictability factor of the COVID-19 pandemic as the thing that scares their
community.
Collectivism can also be found in areas where artists are forming community around causes exemplied by
groups like Nashville Musicians for Change. This group was formed in the Spring of 2020 by local musician
Alayna Rae. Nashville Musicians for Change is a “diverse coalition of Nashville residents who are committed
to creating a sustaining positive change in our community. Our mission is to help musicians become
conscious activists, empowering them through their journey. We will educate, organize and take action
to help our city ourish. ” While this movement is specically aligned with progressive politics and social
justice rather than sustaining musician livelihood, it is a recent and potent example of creating community.
52
15
16

THE STUDIO MUSICIAN
Alternative Income Sources
While studio musicianship is for some musicians a full-time gig, others do it occasionally or part-time which
has been a saving grace during the COVID-19 pandemic.
As stated by Recording Connection, an educational music website, “The more genres in which you’re
comfortable playing, the more gigs will be available to you. It’s that simple. Ability to pick up the song
quickly—in the studio, time is money. Studio musicians need to be able to learn the song quickly and play it
as though they were part of the band.”
For jazz musicians, folk musicians and musicians of other genres procient in their instrument, improvisation,
music theory, etc., studio musician work is a possible income stream.
AFM STUDIO MUSICIAN UNION RATES
“It pretty much decimated all of my income and potential/current job opportunities no
matter where they came from. I think it’s a similar situation for everyone I know as we
all saw our schedules kind of get wiped clean. It’s still at the point where my calendar
is almost completely empty except for church gigs and in-person sessions that are very
slowly coming back.
At the beginning of the pandemic everyone’s in-person sessions were either canceled
or postponed and all postponed sessions got cancelled unless there was a way for the
player to record the parts remotely from home. With guitarists/bassists/keys players
(me!) we were a little lucky in this situation, since it’s more practical and often quieter
for us to record from home. For my drummer/percussionist friends, they got pretty
freaked out since a lot of them don’t have the space/facilities to record themselves,
and even if they could gure that part out, the gear needed to perform those duties
for them is unbelievably expensive.
In-person sessions that I was involved in proceeded very cautiously here around early
June with as few people in the room and as little time spent together as possible often
with no congregating in the control room. From everyone else I’ve talked to even in
other cities, that’s how they’ve been doing it too! It’s gotten slightly more relaxed
as far as people limits since we’ve all settled into the mask and sanitization rules.
People have been making sure to keep track of who they’ve been around and take
responsibility for their own health. It’s been quite an adjustment and a lot of studio
musicians have started doing remote sessions from their houses/apartments/friends’
studios in order to compensate for wage losses and pretty much just to record and
make music as often as possible!”
Luc DiGiuseppe, Studio Musician/Session Guitarist
53
17
18

54
SONGS ON DEMAND
Alternative Income Sources
The COVID-19 pandemic has left many music industry professionals with less business opportunities. For
unsigned songwriters and musicians, a slew of song-on-demand websites have popped up as alternative
streams of income. Songlorious, Songnch and other companies allow songwriters to write songs direct to
consumer about whatever they want. They can exibly pick up however many songs they can record from
home for a set amount of money per song while maintaining their royalties and rights.
PATREON
“Patreon has been a very valuable tool for our artists during this time. It’s an easy way
for artists to create opportunities for their fans to interact with and support them.
Additionally, the resources Patreon provides help artists understand best practices for
optimizing their income within the platform. It’s obviously not a complete replacement
for in-person touring income and fan interactions, but Patreon has been a great
recurring income stream for our artists while we’ve been homebound. The part I am
most excited about is that this revenue stream doesn’t go away when live touring
comes back!”
Erin O. Anderson, Olivia Management
Patreon is an American membership platform that provides business tools for content creators to run a
subscription service. It helps creators and artists earn a monthly income by providing rewards and perks to
their subscribers. Musicians of various genres are turning to Patreon subscriptions to fund projects and/or
stay aoat monetarily especially in Folk/Americana.
DIRECT-TO-ARTIST SUPPORT
Forty-seven percent of music consumers surveyed have participated in crowdfunding or donated to
another source of supplementary income for artists during COVID-19.
Singer-songwriter and founder of Roaring Girl Records, Miranda Mulholland, sees the responsibility of
bettering the music industry for everyone resting partially on listeners.
“I truly believe music fans want to help artists but might not understand how best to
do that. Subscribing to a music service and not using the free tier, buying merch, even
writing online reviews - those are all ways to better support artists.”
Being intentional with support for your favorite artists can go a long way.
19
20

55
Health Insurance for Musicians
Many self-employed musicians or music industry professionals who work for smaller companies do not have
health insurance. Thirteen percent of participants in the Survey to the Music Industry are among them. For
self-employed and freelance workers surveyed, the percentage jumps to 16.8%. Even those who do have
health insurance often nd themselves unable to navigate a confusing and expensive system when they
need medical treatment.
Enter Music Health Alliance, a non-prot resource for healthcare solutions and access. Tatum Allsep, MHA’s
Founder & CEO, chose to develop a new model for healthcare support based on her experience that would
simplify the process of healthcare access while removing a prot motive allowing for a safer and more
trusted environment.
“For me, it became a personal mission to gure out how to stop this from happening
to an industry that had helped pick me up when I was crumbling. There’s this magnolia
curtain that separates the [Vanderbilt] medical center over here…from Music Row two
streets over. Why do they not speak the same language?”
COVID-19 presents a particular challenge for those without health insurance. In the last three months, Music
Health Alliance’s advocacy efforts have increased by 200%. Halfway through the year, they had already seen
their combined number of clients from 2019. Allsep noted calls beginning last March were no longer about
nding a doctor but about nding food, diapers, baby formula. “We realized really quickly that we needed
to pivot and provide these basic life necessities because that’s the foundation of health. We were able to
do that using the same model we use for healthcare access.” This pivot inspired Music Health Alliance to
provide 3,795 lives with almost 703,000 free meals via food gift cards.
According to Allsep, COVID-19 affected people in three phases.
“First, it was a lot of the 1099 and contract workers who lost their gigs downtown
[Nashville] or were ushers, touring crew, who were no longer on payroll. Then, we had
a second level of agents, tour managers, production managers, lighting coordinators,
a lot of high-level touring folks who were losing their benets.” 55.2% of live music
technical and non-technical occupations from this report’s Survey to the Music Industry
applied for and received unemployment benets. “And this last phase, we’re kind of
entering [it] now, is really higher-level music executives, artist managers who thought
we’d be done with this by now. A lot of it is guring out if [they’re] going to cut health
insurance policies to staff. So, we’re helping them compare all the options to keep
their staff aoat as well.”

56
Health Insurance for Musicians
For those seeking health insurance: An open enrollment period began on November 1st and ends
December 15th, 2020. If you are in the music industry and make between $12,700 and $50,300 adjusted
gross income—meaning your income after deductions for car mileage, home ofce, instrument
equipment, etc.—you will qualify for subsidies or discounts off your monthly costs for health insurance.
If you make on the lower end of this income bracket, the federal government will also pick up some of
your out of pocket expenses like deductibles. Again, to get those discounts, apply for health insurance
between November 1st and December 15th. (For print copy: apply for health insurance by going to
healthcare.gov and navigating to the page called “Get ready to apply for 2021 coverage.”)
Allsep warns, “If you are looking for health insurance, not all policies are created equal. If it looks
too good to be true, it is too good to be true. The only place to get an ACA compliant policy—a
policy that covers you from head to toe that does not exclude pre-existing conditions—is through
healthcare.gov in the state of Tennessee. If you’re outside of Tennessee, you still need to go through
the marketplace.”
Music Health Alliance operates on your donations. To nd out how you can help support their work, visit
“Resources” at the end of this study or go to their website.
A nal word from Allsep for those struggling to navigate the healthcare system.
MHA’s number is 1-615-200-6896.
“Take the rst step and call us. There is no wrong, dumb or bad question when it
comes to your health. To be successful in our business you really need to be healthy of
mind, body and spirit. We feel like it’s a basic human right and we want to make sure
our industry can have access to it so they can keep playing music.”

57
BRICK & MORTAR
RETAIL STOREFRONTS
Brick and mortar retail storefronts account for the sale of physical music goods including musical instruments,
musical/recording equipment, sheet music, CDs, vinyl and other music products.
Due to COVID-19 stay-at-home orders and government mandates forcing non-essential businesses including
music retailers to close their doors. The brick and mortar retail industry is nding new ways to reach
consumers moving online or otherwise facing potential shutdown.
WHO RUNS THE SHOW?
Nation-wide storefronts like Guitar Center and Sam Ash corner market share. Some instrument
manufacturers, such as Gibson Brands, Inc., have toyed with the idea of creating a retail environment for their
products. Other key brands like Martin Guitars, Taylor and Steinway Piano Gallery set up oor showcases
within their factories and rent out space in boutique music stores around the country. See Rudy’s Music Store
in Manhattan, New York, for example.
Vinyl record stores account for the bulk of physical product sales. Popular stores in the Nashville area include
Grimey’s, The Groove, Boulevard, Vinyl Tap and Third Man Records.
Brick and mortar retail storefronts often sell merchandise as well. Find a segment exploring music
merchandising in depth later in this study.
CURRENT STATUS BY THE NUMBERS
Physical products accounted for 10% of music industry revenues in 2019 down 0.6% year-over-year at $1.15
billion according to RIAA’s 2019 Revenue Report. A decline of 12% in revenues from CDs to $615 million offset
a 19% increase to $504 million from vinyl records. This represents the largest revenues from vinyl since 1988
and 14 years in a row of growth for vinyl albums, but the category only represents 4.5% of total revenues in
the music industry.
People visit a musical instrument retail location for testing gear to purchase musical instruments and recording
equipment for repairs, music lessons and professional advice. Musical instrument purchases and recording
software sales are on the rise as consumers presumably view learning a musical instrument and recording
their own music as a challenging and enjoyable hobby during pandemic shutdowns.
Record stores are often viewed as the cornerstones of a city’s music ecosystem. People gather in them to
purchase and discuss music in its physical form. Some even offer concerts for local artists, album release
parties and other events for the community. COVID-19 has seen many of these stores labeled “non-essential”
and therefore closed either temporarily or permanently.
When asked to rank revenue sources they believe to be the most lucrative in the next ve years, people
who owned or worked in Brick and Mortar Retail for Music Products (such as vinyl, gear and merchandise)
consistently ranked “selling online merchandise” as number one.
21
22
23
24
25
26

58
This group was also asked what trends they see in the industry that others do not. Answers ranged, but many
discuss a strong hunger and future for physical product and online sales, plus a desire to see more high-prole
titles put to vinyl.
When this group was asked to provide free-response thoughts, there were a few interesting ideas about
consolidating more music industry brick and mortar functions under one physical roof, diversifying income
streams, more government funding for the arts, a noticeable shift to buying from independent stores—but one
theme repeatedly stood out—more vinyl!
Brick and mortar retail storefront owners interviewed for this report include Todd Hedrick, owner of Vinyl
Tap and Caroline Bowman, salesperson at Vinyl Tap and co-owner of independent record label Cold Lunch
Recordings. Todd mentions Record Store Day as a bright spot in the middle of a very tough year for Vinyl Tap.
Caroline discusses the importance of spaces like Vinyl Tap.
“When I came on to Cold Lunch, I realized there needed to be places and events where you
could go. And, you could nd whatever you were looking for whether that was a new band
you wanted to hear or a new musician that you wanted to play with later. There needed to be
a way for the creatives in our community to bump into each other, create and do something
productive together. Places like Vinyl Tap are hubs of creativity and the thought of those
places and venues dying or closing down is heartbreaking to me.”
Caroline Bowman, Cold Lunch Recordings
SUCCESS METRICS AND OUTLOOK
At the time of this writing, some retail outlets are opening back up as pandemic restrictions lift.
Shoppers are moving online in droves to places like Sweetwater, Reverb.com and Amazon for the same physical
music products they would otherwise purchase in-store. Certain retailers, such as record stores and boutique
musical instrument stores, may continue to survive thanks to their cultural importance and favored status within
their music communities. However, even some of the most beloved record stores in the nation have closed shop
permanently over the last decade. One example is industry giant Tower Records: 1960 – 2006.
A glimmer of hope is the so-called “vinyl resurgence” of recent years. Reinforcing the highest sales in vinyl
since the 1980s, there is a phenomenon of younger demographics purchasing more physical music product
in the form of vinyl records. This is good news to companies like Nashville’s own United Record Pressing LLC,
an employer of approximately 150. According to this report’s Consumer Survey, vinyl is the fth most popular
way to listen to music for respondents, behind (in order) Spotify, AM/FM Radio, YouTube Music and CDs. It will
be interesting to watch physical product sales when consumers are once again presented with the option of
spending their money on live shows after the pandemic.

59
DIGITAL STREAMING PLATFORMS
The advent of digital music streaming left an indelible mark on industry revenues for over a decade. 1999
marked the height of compact disc sales and historic levels of prot with the recorded music industry
accounting for $22.4B in revenue adjusted for ination. The historically signicant highs that both precede
and briey follow this year seem to be directly tied to physical media sales (vinyl records, cassettes, CDs).
Along with the introduction of digital downloads in 2004 and the introduction of legal digital music streaming
services around 2005, however, revenue for copyright holders began to fall across the board.
It would do so until 2014. Each consecutive year after this one has marked growth in music industry revenue,
due largely to increases in subscriber counts around the globe.
Digital music streaming platforms provide more access to music than has ever existed before. Relatively low
barriers-to-entry thanks to digital distributors like CDBaby and DistroKid mean more artists can now release
their music for the world to hear. This creates an interesting ecosystem in which to promote and market
sound recordings. Record labels are using streaming data as an A&R tool and pitching songs to playlists
in order to break an artist. Depending on deal terms with a recording artist, streaming royalties can act
somewhat as a “loss-leader” for labels. Marketing done on the platform goes toward helping an artist build
their audience who will eventually go out and see them live, buy merch, etc.
Royalties for the use of music on a digital platform are a topic of erce debate particularly for songwriters
and music publishers. Some feel the current payment structures need revision and view a lack of fairness in
current licensing structures with DSPs.
One respondent to the Survey to the Music Industry offered this analogy: “Give someone a pass for every
hotel room in the world for $50; see how long the hotel industry lasts.” But what if my success as a hotel room
designer (an artist, to follow the analogy) hinges upon as many people staying in my room as possible? What
if the hotel doesn’t own the rooms and it merely gives designers the opportunity to present their rooms to
guests? And what if my desire as a guest is to visit as many rooms as possible, pick the ones I like most, then
support them elsewhere?
Streaming’s ubiquity is beyond debate. Music industry professionals will continue to balance wider access to
music and proper compensation for music creators in the digital age.
WHO RUNS THE SHOW?
Interactive digital service platforms popular in the United States include Spotify, Apple Music, Soundcloud,
Amazon Music, Bandcamp, YouTube Music, Deezer and TIDAL.
27

60
CURRENT STATUS BY THE NUMBERS
By the nature of this technology, consumers have access to nearly any song in the world at the click of a
button—no matter where they are. According to this report’s Consumer Survey, most listen at home (52.3%), in
a car (31.5%) or at work (11.5%). These each represent what you are doing while listening to music, giving rise
to a class of “passive listeners” or those who listen to music while at the same time completing another task.
Major digital music streaming companies have forever changed not only how people listen to and perceive
music, but how professionals promote, market and communicate music’s value. Their inuence on popular
music and the music industry cannot be ignored by anyone wishing to build a fanbase—particularly in a young
demographic.
To date, two tiers of digital music streaming exist.
According to data from the Recording Industry of America Association (RIAA), total revenues from streaming
music grew 19.9% to $8.8 billion in 2019 accounting for 79.5% of all recorded music revenues. This includes
both premium subscription services and ad-supported interactive services (such as YouTube and Spotify). It also
includes non-interactive music streaming radio services like SiriusXM or Pandora. Paying subscribers continue
to be the largest source of revenue growth for music streaming services. For 2019, the number of total DSP
subscriptions grew 29% to an average of 60.4 million compared with 46.9 million for 2018. Revenues from ad-
supported tiers grew 20% annually to $908 million.
Advertiser-Supported / “Freemium”: Music streaming is free for all users in this
tier; the digital service provider will collect revenue in the form of advertisements.
Subscription / Premium: The digital service provider charges a monthly subscrip-
tion fee to users in this tier, who can stream music without advertisements.
SUCCESS METRICS
74.9% of respondents to the Consumer Survey subscribe to a music streaming service. Second only to word of
mouth, music streaming services are the primary way that respondents to the Music Consumers Survey discover
new music (20.9%).
Among survey respondents, Spotify was by far the most popular listening option among digital service
providers and the overall most popular form of listening to music for all age groups. YouTube Music was the
second most popular interactive digital streaming option followed by Apple Music, then Pandora. AM/FM
Radio was second overall; CDs and vinyl records were fourth and fth, respectively. As of early November 2020,
Spotify is testing a new feature that will enable recording artists and record labels to boost specic tracks in the
digital service platform’s recommendation algorithms it uses for radio and autoplay functions—if the artist or
label agrees to a “promotional” (i.e. lower) rate for those streams.
For those 24 years old and under, Spotify remains a clear winner among listening options; TikTok is the second
highest choice. CDs and vinyl records each follow close behind implying popularity for these media even among
young people. For those 45 years old and above, CDs are the number one most popular choice; AM/FM radio
is the second most popular choice.
28
29
30

61
The most valuable feature out of all survey respondents is the extensive music library (56.3%) offered by
interactive digital music streaming platforms. Other options include curated playlists (8.4%), user interface/
mobile experience (9.9%), music discovery features (15.1%), lower subscription fees (7.5%), social sharing
(0.3%) and availability of other media types (0.3%).
Among the more than half of survey respondents with a Spotify subscription, roughly a quarter report listening
to Spotify-curated playlists in which editorial staff and algorithms search through music submitted to the
platform and choose songs for inclusion. Some of these playlists reach into the millions of followers making
them catalysts for artist promotion and A&R tools for breaking rostered talent.
Spotify’s push into other media forms, especially podcasts and audiobooks, is well-documented representing
a strong example of the rise of podcasts. Statista, a German company specializing in market and consumer
data, reports that more than half of all U.S. consumers above the age of 12 listen to podcasts. Still, only 8.8%
of survey respondents from the Music Consumers Survey report listening to podcasts and audiobooks on any
platform more than music.
As for devices, mobile is a top choice for most consumers. When asked to split their time between various ways
of listening to music, mobile devices had the highest average, 51.7%, and computer (desktop and laptops) had
the second highest average, 35.5%. Improvements to the mobile in-app experience from major digital service
platforms continue to account for this trend.
OUTLOOK
Legislation attempts to place guidelines around licensing structures and royalty payouts in the age of digital
streaming largely thanks to the efforts of lobbyists in the music publishing, songwriting and recorded music
communities.
As technologies surrounding royalty accounting improve with time and as awareness increases around the
merits of database uniformity and metadata accuracy, efforts undertaken by all parties—The Mechanical
Licensing Collective, music publishers, independent songwriters, copyright administrators, record labels and
interactive digital service platforms—will continue to smooth over previously contentious relationships in the
industry and provide a fairer model for revenue allocation. “A signicant part of my job is reviewing the latest
regulations from the U.S. Copyright Ofce to make sure SoundCloud remains compliant and positions itself
for success,” states one Head of Publisher Relations, for a well-known DSP..
Simultaneously, the music industry is bleeding ever more into the technology sector. Social media is a primary
form of music discovery particularly among younger demographics. It was the third most popular choice
among respondents to the Consumer Survey. Newer platforms like TikTok blur the line between source of
entertainment and social media hub. And this year, Facebook paid $5.7B for a 9.9% stake in the parent
telecommunications company of India’s largest streaming service, JioSaavn. Major tech companies Apple,
YouTube and Amazon have each developed their own digital streaming platforms. Social media giants like
Facebook, Instagram and TikTok face similar scrutiny for allowing uses of music on their platforms without a
clear way to pay royalties due back to copyright owners.
33
31
32

62
Finally, with barriers for widespread music distribution out of the way the function of a record label appears to
be solidifying into all-in-one artist career development along with the subsequent marketing of recorded music.
NON-INTERACTIVE
DIGITAL SERVICES AND RADIO
The radio industry has its roots extending back to the early 20th century beginning with thousands of
amateur radio operators experimenting with broadcasts of music and speeches. In the 1920s, large
corporations such as GE, Westinghouse and AT&T banded together to form the Radio Corporation of
America (as patent pooling was the solution to the issue of each company owning essential patents for radio
broadcasting).
The rst commercial American radio station, KDKA, in Pittsburgh, PA, begin broadcasting in 1920. However,
within only six years, over ve million U.S. families owned broadcast radios and at that time, music comprised
much of what was played on broadcast radio (66%). From 1920 to 1970, the radio industry share of GDP
closely matched record sale revenues evidencing the impact of radio music on the music industry’s revenues.
New formats from the CD to streaming have caused an ebb and ow to radio’s prominence over the
decades. However, it still serves as the most powerful, widespread medium in the U.S., not necessitating
internet connection and accessible in most personal vehicles reaching 92% of Americans every week.
Non-interactive digital streaming platforms like SiriusXM and Pandora offer another source of performance
income for creators.
One non-interactive radio executive interviewed for this report, when asked about Spotify CEO Daniel Ek’s
recent declaration that traditional radio would become obsolete within the next 20 years, comments: “I think
he spoke too soon. Radio is incredibly popular among certain demographics particularly for country
music listeners.”
WHO RUNS THE SHOW?
Some of the primary jobs associated with radio and non-interactive streaming include disc jockeys (DJs) and
announcers, program directors, music directors, producers, board operators, sound engineers and account
executives. Each of these occupations are critical in supporting, overseeing and carrying out operations
related to radio.
Some of the leading non-interactive music sources include internet radio (IHeartRadio, Pandora, Last.FM),
SiriusXM or satellite radio and Music Choice or cable music channels.
34

CURRENT STATUS BY THE NUMBERS
While radio may feel antiquated amidst the rise of interactive streaming services like Spotify and Apple
Music, there is no denying the reach and breadth that radio has and its continued relevance today. There are
nearly 5,000 AM and 6,600 FM stations in the U.S. alone. This ubiquity allows radio to remain a popular way
to listen to music for many. According to Nielsen’s 2017 Comparable Metrics Report, if you add up the total
minutes of AM/FM radio and streaming audio in the US this equates to more than 202 billion minutes per
week, and of those 202 billion minutes AM/FM radio represents 93% of total weekly audio listening minutes
as compared to only 7% for streaming audio.
According to Neilson’s 2020 Total Audience Report, Working from Home Special Edition, people indicated
that the number one type of TV and streaming content viewed while working from home was news. Thirty-
three percent of people listen to their news updates on a music radio station and 28% of people listen
to a public radio station for their news. This highlights the diversity of radio’s program offerings and radio’s
resiliency even during COVID-19.
Results from this report’s Consumer Survey show that 33.3% of respondents discover new music from AM/
FM Radio and 25.1% indicated that they discover new music from Satellite radio. Additionally, in response
to “how do you usually listen to music?” 36% of respondents listen to AM/FM radio—the second highest
response behind only Spotify. Nearly twenty-ve percent listen to SiriusXM (satellite radio) and 11.2%
listen to Pandora.
Another important aspect of radio and non-interactive streaming—especially given the apparent rise of
media conglomerates buying up radio stations, owning multiple stations in each market and offering the
same playlists in every city —is the sense of community independent stations can build in a geographical
area. Randy Fox, Co-founder and Program Director at WXNA, in an interview with the research team spoke to
the importance and impact of community radio in Nashville specically.
“The constant narrative especially for people who have been in Nashville for a long
time is that we’re losing Nashville’s identity. Nashville has always had this kind of
unique quirky identity that wasn’t as obvious to outsiders. I call it a stealth weirdness.
There was a sense that Nashville was losing that sense of community when we came
on the air in 2016. We were bowled over by people’s response to us. Other cities have
free-form radio stations, but nobody has free-form radio stations like Nashville. All of
our programming is created by people from Nashville or the surrounding counties. We
don’t run syndicated programs. The DJs are all people that live here and understand
the local scene for the music they’re playing in this city.”
63
35
36
37

METRICS FOR SUCCESS AND FUTURE OUTLOOK
Most information around tracking success for radio and non-interactive digital services is related to consumption
(number of listeners, listening time), reach and revenue generation through means such as donations or
advertising.
Collectively AM/FM radio and their web versions as well as pure-play webcasters generate a total of $16.1
billion in advertising revenue per year. While terrestrial radio stations do not pay sound recording performance
royalties to the master copyright owner, Citi Group estimates that U.S. radio still generated around $600 million
in revenue for songwriters. While most radio stations are owned by just a handful of corporations, there is still
room for growth for the unique content that community radio stations bring to their cities.
Additionally, satellite radios have become much more prominent as 75% of all new vehicles in the U.S. sold after
2016 have satellite radio installed. Also with the continued rise and prevalence of personal computers, tablets
and smart phones, Internet radio has also seen steady growth.
Since its creation, radio has continually evolved and will likely continue to do so as it continues to have a wide
and impactful presence on music listeners and the industry as a whole.
“I think there’s this real opportunity there for these grassroots media outlets. That
includes radio, that includes small local publications, just a whole host of things. The
feedback that I get from other community radio stations is that that’s what’s really
happening; people are beginning to value this more. The more things become digital
and homogenized the more opportunity there is for the gritty grass roots to spring up.”
Randy Fox, Co-Founder and DJ, WXNA
TOURING, BOOKING, VENUE
MANAGEMENT, MUSIC FESTIVALS
AND LIVE MUSIC PRODUCTION
The live music sector has seen considerable revenue growth since the early 2000s until the arrival of COVID-19
when the live music industry came to a virtual halt. Pre-pandemic, decreases in physical music sales prompted
artists to tour more often and prompted the industry at large to reevaluate its traditional revenue sources. Today,
the majority of a given artist’s revenue can come from touring further highlighting the importance of the live
music economy currently shuttered by COVID-19.
In recent times, going on tour has become increasingly complex in terms of logistics partly due to an enhanced
concert experience necessitating entire teams to transport visual and audio equipment and for special effects.
64
38
39

65
Venues themselves are often costly to run due to the infrequent nature of performances. Even unrelated to the
pandemic, some venues seek sponsorship from private or public arts funding organizations to stay aoat. More
information on independent venues is included further in this study
Concert promoters have recently become a vital part of the touring industry growing from providing simply
promotion to owning multiple venues and even providing artists with “360” type deals under which they perform all
key business interests for their partners.
While the future remains largely uncertain due to the pandemic, many music industry professionals in the touring
sector are still hopeful for the future when it comes to the irreplaceable experience of live music.
WHO RUNS THE SHOW?
Events promoters and venue operators such as Live Nation and AEG account for many of the largest live music
tours to occur around the world each year. At the time of writing, BMG has just announced an expansion into the
live music business, the rst step being purchase of large-scale German promoter Undercover. While executives
acknowledge that this is a difcult time for live music, they don’t see the current situation altering their companies’
long-term plans. As Sally Williams, President of Nashville Music and Business Strategy at Live Nation says,
“It is very clear that we as humans are gatherers. It’s just innate.”
Large booking agencies Creative Artists Agency (CAA) and William Morris Endeavor (WME), as well as many smaller
outts, help coordinate between recording artists and venue managers.
Independently owned venues are essential to the music ecosystem playing host to rising talent in alternative genres.
“We grew to realize the need in Nashville for alternative spaces for all kinds of genres, so we
evolved into a collective – an all ages music space.”
Kathryn Edwards, Founder and Co-Owner, DRKMTTR
These same independent venues have also been hit hard by the economic crisis resulting from the pandemic. The
National Independent Venue Association is a group that materialized as a result of this crisis whose mission is to
“preserve and nurture the ecosystem of independent venues and promoters throughout the United States.” This
organization has over 2,000 charter members in all fty states. In October 2020, NIVA proposed the Save Our Stages
Act to congress to help save independent venues across the U.S. This act will authorize 10 billion dollars in grant
money for independent venues, producers and promoters. This bill has bipartisan support and at the time of writing
has passed the house but is stalled in the senate.
In Nashville, a similar group called the Music Venue Alliance (MVAN) is dedicated to “retaining and nurturing the
fragile yet complex eco-system of every individual aspect of our famous music scene here in Nashville, Tenn. The
MVAN membership is used as a case study on the economic impact of independent venues in this study.
40
41

66
MVAN membership includes: EXIT/IN, Mercy Lounge, The 5 Spot, Rudy’s Jazz Room, The End, DRKMTTR,
Springwater Supper Club, The High Watt, The East Room, The Cannery Ballroom, The Bluebird Café,
The Listening Room, Station Inn, 3rd and Lindsley and The Basement. The National Independent Venue
Association, also formed since the onset of COVID-19, has a less strict qualication for being considered a
“venue.” Nashville region NIVA membership includes all MVAN membership as well as: Apogee Promotions,
Bucanas, City Winery, Dee’s Country Cocktail Lounge, Glen Campbell Museum and Rhinestone Stage, Music
City Roots, Nashville Jazz Workshop, Nashville Symphony Association and Schermerhorn Symphony Center,
Nashville Underground, Play Dance Bar, Pucketts of Leipers Fork, Ray Stevens Cabaray Showroom, Real
Events, Ryman Auditorium, Tennessee Performing Arts Organization, The Blue Room at Third Man Records,
The Cowan, The Franklin Theatre, The Golden Door, The Nashville Palace and Third Coast Comedy Club. Find
these locations mapped here. (link to live music location mapping)
135.71
142.71
133.24
109.66
143.58
86.74
110.57
64.03
113.39
75.38
Average
Ticket Price
Artists
14,494
16,373
16,189
24,434
14,290
48,894
11,952
16,571
12,246
15,235
Average
Tickets
Pollstar lists the highest grossing tours from 2019
608,766
573,040
566,611
635,272
471,569
733,414
525,882
894,820
465,329
685,575
Total
Tickets
1,966988
2,336,484
2,156,994
2,679,447
2,051,767
4,241,278
1,321,576
1,388,555
1,388,555
1,148,452
Average
Gross
42
35
35
26
33
15
44
54
38
45
Cities
56
39
38
26
35
18
44
88
38
47
Shows
Elton John
Pink
Justin Timberlake
Metallica
Fleetwood Mac
Ed Sheeran
KISS
Trans-Siberian Orchestra
Bob Seger & The Silver Bullet Band
Travis Scott
Prior to the pandemic, according to World Economic Forum and Pricewaterhouse Coopers (PWC), live music
accounted for over 50% of global Music Industry revenue making it the highest revenue source for the industry
and equating to approximately $25.6 billion.
COVID-19 put the live in-person music industry on hold leading many in the industry to seek other
employment and many artists to get creative with drive-in concerts or livestreaming on platforms like YouTube,
Meerkat, Stageit and Periscope.
42
43

67
According to Goldman Sachs’ “’Music in the Air’ 2020” report, live music is estimated to see a 75% plunge in
revenue due to the pandemic. Chris Cobb, owner of famed Nashville independent live music venue Exit/In, said
in a focus group of live music professionals facilitated by the research team that in the six months Exit/In had been
closed (March-September), they were down 96% in revenue in comparison to 2019.
Marrying these numbers, again, that is a 75% plunge in revenue for an industry subsector accounting for, pre-
pandemic, 50% of music industry revenue.
Out of the artists from the Survey to the Music Industry who had performed at least one show between March
and April of 2019, 50.4% had not performed since March of 2020. Over half of respondents from the Consumer
Survey, if given $50 to spend on their favorite musical artist, would most likely purchase a concert ticket to see
them live. Most consumers surveyed attended live music performances a few times a year before COVID-19. The
second most popular choice was every month. Not surprisingly, 86.4% report not attending a single in-person live
music performance since March of 2020.
Music Consumers Survey respondents indicate that 65.4% would be somewhat or extremely uncomfortable
“attending a live show tonight” (the survey was in the eld between August and September 2020). When asked
to rank the music industry’s dependence on live performance between one and ten, 93% of all consumers gave a
seven or above; 66% with a nine or ten.
When asked, “When do you think live music will go back to the way it was before the pandemic?” most consumers
(45.5%) think nine to eighteen months. Two to three years was the second most popular response; three to nine
months was the third.
While all those working in live music have been hit by COVID-19, there is also a particularly vulnerable pool of
workers that perform a good portion of the labor that support concerts. These include people in sound, lighting,
transportation, rigging, merchandise sales and more. A lot of these people are freelancers or work gig to gig
which leaves many of them with fewer employment protections. In the Survey to the Music Industry, many of
these professionals express deep levels of frustration and discuss the necessity for higher pay and the potential of
leaving the music industry.
Dave Shirley, an audio engineer who has worked in Nashville for 30 years, describes how the pandemic has
affected him.
“When March started, I was full time staff on salary with benets and I had been with the
company for 6 years. 2019 was a record year and 2020 looked like it was on track to be more
of the same. Mid-March events just started dropping out. Just cancelling left and right. March
26th, the majority of our staff nationwide were furloughed for 90 days. That furlough became
permanent. Ended up going on unemployment for the rst time in my career. On June 9th,
we were then notied that the Nashville location was permanently closed. Houston as well
and our production here was being moved to other cities. Now, I’m a freelancer. Since I
stopped working in March. I’ve done one event the rst week of August. I’ve been working
day labor anywhere I can nd for cash . . . nothing like what we earn as techs on live events.
Losing a full time gig that had salary and benets, of course I lost my health insurance as well.
So it’s been, it’s been an experience.”
44

“We’ve been lucky,” he says, “Our company did not exist before the pandemic. Stage
Presence offers a new source of revenue for performing artists.”
68
SUCCESS METRICS AND OUTLOOK
2021 live booking projections are low for music creators from the Survey to the Music Industry.
One unique area of opportunity tied to livestreaming is companies providing virtual concert experiences to
paying groups. Stage Presence, for example, connects independent artists with paid virtual gigs for corporate
clients. Founder Mischa Steiner was originally a booking agent.
In terms of music festivals, John McBroom of FloydFest in Floyd, Virginia, described having to shut down all
things related to festival production in 2020 like most other live music festivals across the nation. However,
McBroom did say “I am very hopeful that we will be able to have a festival sometime at the end of July next
year.” Presently, McBroom’s biggest worry for FloydFest is hearing that he has already sold out his festival for
next year because he is honoring tickets purchased for the 2020 event prior to the onset of COVID-19. Those
rollover tickets would mean that the festival would be at the designated capacity to comply with the health and
safety measures in place. This would then lead to “literally changing everything about fee structure, artist
structure, everything….” It is still hard to tell at the time of this publication what the next year holds for live
music festivals. Other larger festivals like Bonnaroo in Manchester, Tenn. have even pushed their 2021 dates
back to later in the year.
A win for independent venues in Nashville occurred the rst week of September 2020 when Nashville’s Metro
Council approved $2 million in CARES Act funding to go toward music venues. Without this aid, all but one
independent Nashville music venue would have had to permanently close in the three months following,
according to a report from the Tennessee Lookout. This gure was produced by an internal study of the
Music Venue Alliance of Nashville, an integral driver for allocating this funding. At the time of writing, grant
applications are open, but no funds have been distributed.
So much in the live music industry is still in ux under COVID-19 pandemic restrictions. Booking agents and tour
promoters are looking at rescheduling tour dates for the end of 2021 and beyond.
Higher
Are your number of bookings for live performances / concerts for 2021 higher, lower or about
the same as usual?
Lower
The same as usual
86.9%
9.2%
4%
45
46
47

69
SONGS ON DEMAND
DRKMTTR: All Ages Music Space and Community Resource
DRKMTTR, a DIY venue in Nashville, exemplies the ethos of an independent venue, and provides an
interesting case study on how a venue can act as a community resource. DRKMTTR labels itself as an artist
collective; an all ages music space. The goal is not to make a prot but to build a community, a mission that
distinguishes them.
The journey started in a basement in 2015. The initial idea was to have a place to host fun shows, and it
evolved, through recognition of a need for alternative spaces, into a collectively run registered business.
DRKMTTR itself has been an exercise in evolution, as the venue has closed and reopened multiple times
before nding its current home on Dickerson Pike in East Nashville. Getting up-to-code, diversifying income
streams and nding ways to serve the community are only three ways that this artist collective has been
uid since its founding in 2015. They put on their last 2020 live-audience show in early March, but have
since participated in Music City Bandwidth, a series of online concerts sponsored by Jack Daniel’s and the
Nashville Convention and Visitor’s Bureau with proceeds going to the participating venues. DRKMTTR
hosted local bands Teddy and The Rough Riders featuring Emily Nenni and Twen in mid-October. They also
used Twitch Stream to share the “Spirit of DRKMTTR,” a show to raise funds and highlight local artists.
As a DIY Venue, DRKMTTR adopts a different business model than larger venues. Artists do not have to
prove their marketability to gain entry and book a show. Instead, DRKMTTR promotes diverse artists so they
can sustain themselves and keep making music. This allows different genres to thrive in the Nashville music
scene. For example, the venue has hosted successful EDM nights and hosted an impressive roster of punk,
hardcore and metal bands. While they cater to all genres, they have been integral to the punk, hardcore and
metal scene.
During the pandemic, DRKMTTR has pivoted nding creative ways to reach out to the community because
they have shut down their space. When they moved into their spot on Dickerson, the plan was to host a
community kitchen. Due to structural limitations, this was not an option. However, the venue has since
started to host the Nashville Free Store. Inspired by a similar operation in Birmingham, Ala., this is a place
for people to participate in mutual aid. According to their website, they “share resources freely and no
one will be asked questions or turned away. We hope to become a reliable, long-term resource that our
community can depend on. ” The store takes donations Fridays and is open Saturdays. A community fridge
open all-hours can be found in front of the venue housed by a structure built by Dryden Architecture and
Design as part of the Civic Design Center’s Parking Day, a day focused on tactical urbanism.
Additionally, they produce DRKMTTR Radio, a podcast that highlights local artists and informs listeners
on how they can become more involved in bettering their community. The venue also offers their space
for good causes and political candidates to safely interact with constituents. Before March, the collective
was using the space for game nights, comedy shows and other community programming and they plan on
continuing to explore this when it is safe to gather again.
48

70
SONGS ON DEMAND
DRKMTTR: All Ages Music Space and Community Resource
Because DRKMTTR does not seek to make a prot, their venue constantly struggles with funding.
“I feel like a lot of the community that usually focuses around DIY are people who are trying
to build something because they don’t feel that they are being represented in the things that
do get funding. And that’s when we hit a wall. We have all of these artists who want to be
represented, but unfortunately they don’t have the capital. So we’re all just a bunch of really
well-meaning people who don’t have the resources to be the best that we could be.”
Kathryn Edwards, Founder and Co-Owner, DRKMTTR
The venue brings in funds through Patreon membership among other revenue streams. This model allows
them to offer specialized content to different tiers of subscribers in return for monthly payments. Funding
has been a consistent difculty for the venue even before COVID-19. They are also members of the Music
Venue Alliance of Nashville, a group that has formed since the pandemic began and offers the strength
of collectivism among independent venues in the city. This group has pushed for funding from Metro
Nashville CARES funds and while the funds have been granted none have been distributed yet. More
information here.
DRKMTTR looks forward to continuing to evolve and be the best resource for artists and the community
that they can be. The research team, in its quest to quantify everything, was both impressed and humbled
by a parting thought from founder Kathryn Edwards.
“Dark matter makes up most of the universe. We can’t actually quantify it. But, we know it’s
there. This is similar to underground music—how it actually is the building block of the music
industry, because you don’t get a big act unless they start somewhere rst. Yeah, we make up
most of the industry, but you can’t exactly measure how much is going on at any time.”
Kathryn Edwards, Founder and Co-Owner, DRKMTTR

71
MERCHANDISE
With the advent of the digital age, music merchandising has been booming in the last ve years. More
artists are starting to depend on merchandise as a major source of their revenue. According to the Licensing
Industry Merchandiser’s Association, in 2016, sales of music merchandise hit $3.1 billion, a 10% increase from
the year before. In 2019 alone, licensed merchandise for artists accounted for 90% of items sold beating
physical album sales for most artists.
Artists now promote their merchandise directly through social media platforms such as Instagram, TikTok,
YouTube and Facebook. Many are using their celebrity to sell a variety of licensed items. For example, many
artists have partnered with designers and high-end clothing brands to open up pop up stores where they sell
limited releases of their merchandise.
Some are calling the last ve years the “gold rush” of music merchandising. Consumers are now depending
on these products to represent, support and connect with their favorite artists. Licensed merchandise is
typically developed and distributed by artists themselves or through licensing deals with small to large
companies. For example, Universal Music Group (UMG) acquired Bravado (a music merchandising company)
in 2007. Now Bravado directly interacts with UMG’s artists to produce, design and manufacture all of their
merchandise. Many smaller companies have design teams and partner with artists to build bands into brands.
Given the upheaval of live music events, arguably the most direct form of artist revenue is no longer available.
Music merchandising relies on the touring industry and many companies have lost revenue. But in the last
few years, merchandising companies have pivoted to e-commerce platforms to generate income especially
through the internet and social media.
WHO RUNS THE SHOW?
The music merchandising industry is run by small companies which oversee the sales, manufacturing,
marketing and design of licensed products for artists. Often independent artists will partner with e-commerce
platforms to sell their merchandise or set up online stores themselves. In the last 10 years, larger companies
such as Warner and Universal have acquired smaller merchandising companies absorbing them into their
touring wings. Notable companies include Bravado, Disney and BANDMERCH. Smaller companies in
Nashville include Manhead Merch, Crown Merchandising and Futureshirts. Notable e-commerce platforms
that sell music merchandise include Bandcamp, Shopify and Dizzyjam.
With respondents of all ages and music preferences, this report’s Consumer Survey provides insight towards
what exactly consumer preferences might be.
49
50
51
52
53

CURRENT STATUS BY THE NUMBERS
The Survey to the Music Industry indicated a signicant dependence on merchandise sales for revenue. When
ranking the most lucrative sources of revenue in the next ve years, 12.2% of respondents ranked “selling
online merchandise” rst.
According to the Consumer Survey, 68.2% of music consumers bought music related merchandise in 2020.
Consumers bought primarily online comprising some 45.1% of total purchases. However, “at a concert venue”
was the second most common place of purchase accounting for 28.8% of total purchases. Considering the
loss of live events, both merchandise producers and consumers have lost just under a third of their market.
Consumers’ most highly sought-after product was t-shirts accounting for 35.7% of purchases. At a close
second, CD or Vinyl comprised 32.5% of purchases.
When ranking preference among other music related products (streaming subscriptions, concert tickets,
exclusive content and more), physical merchandise placed highly. Though concert tickets were most frequently
ranked rst, consumers placed “their latest album on vinyl” second and “a band t-shirt, poster or other
merchandise” third.
When ranking “which of the following actions pays artists the most money” consumers most frequently ranked
“buying a t-shirt at their concert” second and “buying their album at my local record shop” third. Considering
the sudden disappearance of live events, consumers now believe the most lucrative means of supporting
artists is through their physical merchandise.
45.1%
28.8%
15.5%
9.7%
0.9%
Where did you purchase merchandise?
Online
At a Concert Venue
Brick and Mortar Stores
Retail Stores / Gift Shops
Other
72

73
SUCCESS METRICS AND OUTLOOK
During the pandemic, many merchandising companies have had to pivot and look for new revenue streams
because of the cancellation of live events. Manhead Merch, for example, reportedly lost 70% of its revenue
when COVID-19 began. Merchandising companies have started to invest in new technologies that support live
streaming and virtual concerts.
Jesse Blinn at Futureshirts (a wholesale retailer in Nashville) notes,
“In our e-commerce space we want to be incentivized to sell the merch for you and build
relationships. We want to help build [a] brand because it helps build our brand. Recently, we
partnered with the company, Single Music, to live stream [concerts] within your Web store.
People can do these live streams [elsewhere] but this technology builds more interaction with
the products our clients are selling.”
Brands are nding new and creative ways to engage consumers online. For example, Laura Hutess from
FlyteVu (an entertainment marketing agency in Nashville) mentions, “We’re leveraging a lot of different
types of technologies. There’s an opportunity to build innovative technologies with developers to create
different and unique experiences especially virtual live events and virtual concerts.”
“One of the services we provide is shooting and creating content campaigns, so we were
able to shift a lot of our clients to that area to grow that business. We also developed a suite
of digital and virtual offerings including virtual concerts and events, virtual galas, virtual dates
and even a virtual baby shower.”
“We also assisted Kelsea Ballerini in launching her album. On the album drop date, we
dropped albums via drones to her fans’ houses along with customized packages including
a handwritten note from Kelsea. The challenge is to create innovative ideas that create
meaningful experiences for fans, in both the virtual world and IRL. It just takes some creativity
and optimism.”
Laura Hutess – Co-Founder, FlyteVu
Many merchandising companies are pivoting from music entirely during the pandemic and turning to other
revenue streams like advertising, marketing services and digital content creation on social media. The
success of these new technologies and the ability for merchandising companies to pivot online will determine
their future success in the music industry.
54

MUSIC EDUCATION
Music educators often represent one of a young person’s rst interactions with the music industry.
According to research conducted by The Gallup Organization in 2003, around 18% of respondents had
taken private lessons.
Schools with music programs have an estimated 90.2% graduation rate compared to a graduation rate
of 72.9% for schools without music programs. Additionally, schools with music programs have a 93.9%
attendance rate compared to an attendance rate of 84.9% for schools without music programs.
Unfortunately, arts and music programs are often the rst programs to be cut in schools. This trend has
continued in recent years with proposed cuts to arts and music funding at the federal level that would
impact the entire country.
Many music programs do not have the infrastructure to support virtual learning platforms making
them particularly vulnerable to the circumstances around COVID-19. A surge of new technologies now
exists to help educators and learners, but there are disparities in access to affordable computers that
disproportionally affect families with lower incomes. According to the Pew Research Center, 36% of lower
income parents reported that their children do not have access to a computer at home.
WHO RUNS THE SHOW?
Academic institutions that specialize in Music and Music Business tend to thrive in cultural epicenters
where music business operations have taken root—the primary examples being the nine music cities
outlined in the Music Industry Workforce Assessment: NYC, Los Angeles, Denver, Chicago, Atlanta New
Orleans, Nashville and Memphis. Notable institutions are mentioned below.
Self-enrichment programs and resources for musicians exist outside of academic institutions to increase
skills and prociency. Online music education platforms have made it easier for musicians to learn a new
instrument, record music and get useful feedback. Some examples of popular online music education apps
are Yousician, Uberchord, School of Rock, Fenderplay and Piano. YouTube has also made music education
more accessible because everyone can access instructional videos for any instrument through their
platform. Notable YouTube channels for music instruction include JustinGuitar, Drumeo and The Recording
Revolution.
Curb College of Entertainment & Music Business at Belmont University in Nashville, TN
Berklee College of Music in Boston, MA
The Clive Davis Institute of Recorded Music at NYU in New York, NY
Full Sail University in Winter Park, FL
The Los Angeles Recording School, in the LA Film School, Los Angeles, California
74
55
56
57
58

75
CURRENT STATUS BY THE NUMBERS
Although professionals in the music industry do not need formal training, the Survey to the Music Industry reveals
that many have received a high level of education. Just under half (47.3%) hold a bachelor’s degree with an
additional 14.8% retaining a Graduate or Professional Degree. Of the respondents who identied as students
when taking the survey, 77.4% were currently enrolled in a music related degree program. This provides insight
towards the current condition of music business education.
Many respondents were highly educated, but their academic accolades came at some expense. Most
respondents (33.2%) had to pay between $30,001 - $99,999 for their degree. 21.8% of respondents had to pay
more than $100,000 for their education. Roughly 46% of respondents paid less than $30,000 for their degree.
Considering the national average for tuition at a private college is $35,087 as of 2020, music industry professionals
seem to fall within the normal range of spending when it comes to higher education.
Respondents clearly prioritized their education, and the majority did not question the practicality of their
degrees. When asked to scale the value of their degree or certication as it pertains to their current work in the
industry, only 26% of respondents considered their degrees to have low value or relevance (providing a rating
between 0 – 3), with 27.4% indicating a moderate value (a rating between 4 – 6), and 46.6% considering their
degrees to have a high value (a ranking between 7 – 10) or relevance to their work in the music industry. The
reasons for these generally negative dispositions could be varied, but one could be the relative cost to get a
degree. Forty-eight percent of music industry professionals surveyed reported their annual income in 2019 was
less than $55,000 while most professionals surveyed paid more than $30,000 in tuition for the degree.
SUCCESS METRICS AND OUTLOOK
The success of music education programs during COVID-19 quarantines will rely on their ability to adapt to
virtual learning platforms. Streaming services and online platforms like YouTube have made musical instruction
more accessible and cheaper for many. Music tutoring services, music composition software and digital audio
workstations will all help music instruction become more collaborative and help students adapt to the digital age.
Music education will remain an essential component of the music industry of tomorrow. Prospective students
must be aware of the unique nature of higher education and professional development in the music industry.
Careers are predominantly developed through relationships and hands-on experiences as opposed to academic
merit. Portia Sabin, President of the Music Business Association, sheds some light on the role of postsecondary
education in the music industry.
“In the future, employers treat people a little bit differently when they have a college
degree because nishing a college degree at least implies that you have the ability to nish
something. I just think it’s not critical to go to college for music business to have a successful
career.” The Music Business Association hosts many educational webinars throughout the
year—all virtual in 2020 due to COVID-19. MBA relocated their conference to Nashville in
2015 “to be close to the heart of the music business and a hotbed of new musical talent. ”
59
60

76
Others argue, however, this does not diminish the value of a Music Business education. Doug Howard, Dean of
the Curb College of Entertainment & Music Business at Belmont University, provided commentary on the unique
education required for success in the equally unique workforce of the music industry.
“This is a wonderful, exciting, but extremely complex industry. It’s an international industry
and the only thing that is constant is change. Navigating a career, managing a career or
helping an artist can be greatly enhanced by a music business education. You personally do
not have to experience success or failure to get the reward and lesson shared by industry
veterans in the classroom. I can tell you how well it served me in my career and how I was
able to rise through the ranks. I might not have all the answers, but I was taught to identify
the key issues to problems and ask the right questions.”
Among all else, there was one unifying sentiment from the interviews. Relationships are essential and college is
an excellent environment for developing them.
“So much of your career depends on the people that you meet—put yourself in a position
where you can meet people. It just creates opportunities for that serendipity to happen.”
Portia Sabin, President of Music Business Association
This was echoed by Heather McBee, VP of Operation, Nashville Entrepreneur Center.
“Although I started my career in radio and live music, it was the internship at BNA Records
while I attended Belmont University that really kicked things off. That internship grew into my
dream job in the RCA, BMG and Sony family of labels. The internship gave me the invaluable
real-world experiences and connection I needed to be successful.”

77
SYNCHRONIZATION LICENSING
Have you ever looked up a song that you heard on TV? Two-hundred thousand people did using Shazam
to nd Jenny of Oldstones by Florence + The Machine after it was featured on Game of Thrones.
Synchronization (often referred to as sync) is the process in which musical work is “synchronized” with
a visual component. Visual components include TV shows, commercials, video games, movies or other
audiovisual work. A synchronization license is the legal agreement between whoever owns the copyright on
a piece of music and whoever wants to use it. Synchronization often provides the most direct link between
the music industry and other forms of entertainment including television, lm, video games, sports and
social media.
WHO RUNS THE SHOW?
Film, television and commercial production houses interface with rightsholders to secure synchronization
rights for the use of music set to video. Licensors are often intermediaries between the two whether as part
of a publishing company or separate agency. Music supervisors, either part of the production team or as
part of an independent agency, use criteria given by lm and television producers to select songs.
YouTube and TikTok now provide digital ecosystems of audiovisual use.
CURRENT STATUS BY THE NUMBERS
RIAA reports between 2018 and 2019 synchronization royalties fell 3.2%. Collective synchronization fees
between 2019 and 2020 are not yet available, but will inevitably show a marked decline due to the loss of
new television and lms created during COVID-19.
Music listeners are more interested in legacy catalogs during COVID-19, presumably in part because
new music is not releasing at its regular pace, but also because fans may long for a time of perceived
ease. Music is a source of comfort and nostalgia which is utilized by advertisers. This plays out by giving
rightsholders who are strong on catalog hits leverage. Regarding the direction of advertisement moods
seen during the pandemic, Jason Rezvan, Vice President of Advertising, Spirit Music Group, notes the
following trends.
“At least for a while there at the beginning there was just a lot of uncertainty. You
saw a lot of the same stuff being licensed: emotional, sentimental, piano builds, [to
communicate] togetherness community, love—like familial love messaging—that was
kind of the rst phase.
Obviously with no new commercials being produced for a little bit, brands were bringing
back old ads from 10 years ago or just renewing ones that they currently have.”
Josh Collum – Co-Founder & Partner, Sorted Noise;
Co-Founder, The Other Nashville Society (TONS)
63
61
62

78
“Music in TV, lm and ads is considered part of the post-production process. So, when
COVID hit there were a few months of productions that were in the can. Synch didn’t
really slow down until the summer once the production shutdowns caught up. It’s been
slow since, but is beginning to pick back up. Creatively, we very quickly began seeing
COVID-related briefs especially in ads. Themes of ‘togetherness’ and a need for songs
that were hopeful, but not too happy. I think we’ll see a lot of this for the holiday season.
Themes of family and appreciating one another more. Logistically, a lot has moved to
virtual. We run writing camps every 6 weeks or so and have been all virtual since March.
At rst, it was difcult. You lose something when creators aren’t in the same room with
each other. But we’ve adapted and it’s felt more normal. After we’re past the pandemic,
it’s something that we’ll continue to utilize, because it allows us to bring in people from
other cities around the world into our camps.”
Nan Wilson, of Manage Ad Music, brings the following perspective.
“I think we’re starting to see that publishers are kind of niche—like I am a sync placer,
that is my specialty. I’m very good at it. I’ll admin your royalties if you need it, but this is
my bread and butter. Or like a writer can license to a synch person to do it for them.”
SUCCESS METRICS AND OUTLOOK
New tech adaptations include streaming video on demand and interactive sync. Since theaters have shut
down and more movies are released directly, many video services have observed signicant increases since
March. Disney+ saw a $4.5 million jump in April alone and Netix added 15.8 million subscribers in the rst
quarter of 2020 (they expected 7.2 million). However, this “new” opportunity also comes alongside a decline
in lming meaning it may not be sustainable.
Interactive sync refers to new ways to integrate music into platforms like video games which allow consumers
to directly inuence what happens on-screen. One notable example is Travis Scott’s performance on the
video game Fortnite. Approximately 30 million players viewed it live and the subsequent YouTube video has
exceeded 100 million views at the time of this writing. Importantly, the event happened during COVID-19
lockdown. The built-in viewership of a game like Fortnite, and the fact that much of the work involved in game
development can be done remotely, leads to a conclusion that this type of sync might help to supplement
losses from a decline in lm, television and commercial placements.
64

80
SECTOR AND CLUSTER ANALYSIS
The music industry does not neatly t into the existing structure of standard economic or industrial
classications. Music plays a unique role in our economy. It touches many other industries directly and
indirectly from recording studios, the performing arts to marketing and communication industries as well as
nancial services. It also has internal relationships that are unique and a product that is consumed in wide-
ranging ways that do not follow a typical supply chain. Consider that music is integrated into multiple aspects
of one’s life from radio, streaming, television, lm, commercials, to coffee shops and grocery stores. For this
reason, it is important to better understand the industry level relationships and linkages. These linkages are
referred to as industry clusters.
Industry clusters are groups of related businesses that function together creating a competitive hub that
share common markets, occupational skills and technologies within a region. Typically, these clusters form
their own functional boundaries and do not strictly observe geographic boundaries like city, county or state
lines. Clusters are important to the economy because they provide businesses access to specialized suppliers,
skilled workers, proximity to competitors and a shared base of industry knowledge. In other words, clusters
create a localized competitive advantage over similar industries that operate in more isolated locations.
The ability of economic stakeholders and policy makers to capitalize and invest in the strengthening of
regional industry clusters allows for the development of high-value industries with more innovative and
efciently produced goods and services. Moreover, this type of specialized private sector grouping
allows for the inow of capital or money from outside of the region for some industries. This external
capital further increases a region’s economic wellbeing. Those sectors that do allow for the ow of
money into the economy from outside the region are called traded clusters. Other industries are called
local clusters and normally only serve a limited geographic area, for example, a hospital.
Using the Harvard University U.S. Cluster Mapping as a framework, researchers for this study updated the
employment and wage data and adjusted the sectors to be more representative of the music industry. This
process allowed for the creation of a more robust music cluster inclusive of industries pertaining to musical
groups and artists, radio networks and music related technologies. This revised cluster mapping was then
used to calculate the interconnectedness of the value chain resulting in a music cluster with strong linkages
to performing arts industries, hospitality and leisure industries, communications, audio and video production,
motion pictures, marketing, nancial services and business services.
The music industry is a strong traded cluster with global reach that imports and exports product, talent and
services throughout the Nashville region from the rest of the world. The graphic on the following page shows
the industries or clusters most closely aligned or linked with the music cluster in the Nashville region.
THE IMPACT OF THE
MUSIC INDUSTRY

MUSIC
16.3K JOBS
MARKETING
FINANCIAL
SERVICES
HOSPITALITY
PERFORMING
ARTS
AUDIO &
VIDEO
PRODUCTION
COMMUNI-
CATIONS
PROFESSIONAL
BUSINESS
SERVICES
Based on data from the Bureau of Labor Statistics and sources such as EMSI, the Music Industry cluster excluding
its linkages in the Nashville MSA represents 16,298 jobs (2019) with average annual earnings of $81,521 or $66,358
(when averaging without artist/performer wages). This jobs and wage information accounts for those businesses
that are directly linked with music-related sector codes but does not include all sectors indirectly inuenced by the
music industry. These sector codes are part of the North American Industry Classication System (NAICS) used in
the U.S., Canada and Mexico to classify businesses by industry. The music industry crosses over into many different
industries not clearly dened as part of the music sector.
The 2013 Music Industry Study created by the Nashville Area Chamber of Commerce’s Research Center
incorporated employment data that included both Music and Entertainment Industries. When the 2013 study
was conducted, technological tools limited the ability to splice occupational and industry data with the level of
precision available to researchers today. This updated study incorporates multiple methods of evaluation allowing
for historical comparison that include using data culled in the same manner as the 2013 study which will be referred
to as the Music and Entertainment Industry, as well as more nely tuned 2012 and 2019 datasets which will be
referred to simply as the Music Industry. In order to compare results to the 2013 Music Industry Study, this updated
report culled from these aligned industries the direct employment involved in the music and entertainment
industry in the Nashville region. The 2019 regional Music and Entertainment Industry direct employment came to
41,153. In terms of the more nely tuned employment data, 2012 direct Music Industry employment equated to
17,008 direct music industry jobs and increased to 21,878 direct music industry jobs by 2019.
2012
27,095
17,008
Direct
Employment
Category
$1,678,070,236
$1,124,803,911
Direct Labor Income
$2,964,880,249
$2,134,218,695
Direct GDP
Music and Entertainment
Music
2019
41,153
21,878
$3,619,031,221
$1,618,928,267
$5,798,352,109
$3,199,613,641
Music and Entertainment
Music
81
Direct GDP - 2012 vs 2019

Music Publishers
Record Production and Distribution
Other Sound Recording Industries
Musical Intrument Manufacturing
Sound Recording Studios
Musical Groups and Artists
Software; Other Prerecorded
Radio Networks
Radio Stations
Total
39.70
24.75
7.58
7.45
6.18
6.18
3.32
2.69
1.34
6.11
5.09
4.70
1.87
1.72
4.09
2.85
1.59
1.71
0.77
2.16
1.82
3.89
1.25
1.72
1.70
1.38
0.57
1.76
0.87
1.37
1.22
0.79
1.64
1.30
2.42
1.30
2.25
0.45
0.75
1.13
0.51
1.38
0.76
0.83
0.81
0.95
2.08
0.57
0.61
0.84
0.10
0.19
0.68
0.12
1.01
1.00
2.44
1.43
1.06
1.00
1.14
1.62
1.43
0.08
1.70
0.94
1.18
0.59
1.11
1.00
1.20
0.88
1.03
0.41
0.93
1.10
2.48
0.14
1.27
1.07
1.50
1.03
0.18
0.03
1.03
1.83
0.03
1.13
0.62
1.09
Nashville
Los
Angeles
New
York
Austin Chicago Denver Miami Memphis
New
Orleans
Industry Description
Location Quotient Table (2019)
With a location quotient (LQ) of 6.1 for the music industry, the Nashville MSA has an employment concentration
triple that of the Los Angeles area (LQ 2.2) and nearly ve times that of New York City’s MSA (LQ 1.4). To further
illustrate this point, long term job specialization growth (2012 – 2019) in the music industry is highest in the
Nashville MSA with the Los Angeles area coming in second followed by New York.
This contrast becomes even more dramatic over the ten-year period beginning in 2009. In the following graphic
we see that music industry jobs concentration increased by approximately 30% coming far ahead again of Los
Angeles, New York, New Orleans and Seattle.
Location Quotient Chart (2019 LQ & 10 Year LQ Growth)
82

83
Regional comparison of music industry job growth also highlights the growing importance of the Nashville
region to the music industry. Looking at the top ten MSAs in the U.S. for music industry jobs and job growth,
over the ten-year period from 2009 to 2019, the Nashville MSA ranks third in the U.S. in terms of total jobs,
but ranks rst for net job growth and overall rate of growth rate. Consider that Nashville in 2009 ranked
fourth among these MSAs, yet has over the last ten years seen a 31% increase in music industry jobs.
Industry Breakdown by MSA (2019)
Even in terms of net job growth, the Nashville MSA had ve times the net job growth of Los Angeles and
200 times the job growth of New York.
Nashville Los
Angeles
New
York
Austin Chicago Denver Miami Memphis New
Orleans
Seattle
1,717
Total
18,074
Total
19,812
Total
8,779
Total
5,417
Total
2,185
Total
3,873
Total
977
Total
883
Total
2,941
Total
MSA
Musical Groups and Artists
Music Publishers
Record Production and Distribution
Musical Instrument Manufacturing
Radio Stations
Sound Recording Studios
Radio Networks
Other Sound Recording Industries
Software and Other Prerecorded Compact Disc, Tape, Record Reproducing

84
Net Job Growth by MSA (2009 - 2019)
Record Production and Distribution
Musical Groups and Artists
Music Publishers
Radio Stations
Other Sound Recording Industries
Radio Networks
Software and Other Prerecorded Reproducing
Sound Recording Studios
Musical Instrument Manufacturing
Total
652
589
489
145
126
66
49
8
(41)
2,082
357
1,389
552
(939)
(15)
(146)
(913)
(211)
336
411
367
(367)
(201)
(146)
(167)
956
(312)
(196)
75
10
20
142
(220)
(160)
5
(5)
38
20
60
(103)
112
(296)
(14)
(579)
(13)
(320)
(85)
(13)
(230)
(1,438)
(26)
56
---
(110)
(2)
18
(145)
14
1
(193)
(3)
(225)
(16)
(219)
53
(130)
42
(19)
5
(511)
(11)
49
(7)
101
(15)
(214)
---
(12)
(47)
(67)
19
159
26
(27)
---
(166)
---
27
---
18
Nashville
Los
Angeles
New
York
Austin Chicago Denver Miami Memphis
New
Orleans
Industry Description
(12)
55
5
12
46
(96)
(49)
(71)
69
(41)
Seattle
Nashville Los
Angeles
Austin
Chicago
New
York Denver Miami Memphis
New
Orleans
Seattle
31%
2%
0%
-6%
-21%
-8%
-12%
-6%
2%
-1%
Rate of Job Growth by MSA (2009 - 2019)
Nashville Los
Angeles
New
York
Austin
Chicago Denver Miami Memphis
New
Orleans
2,082
411
10
-103
1,438
-193
-511
-67
18
Seattle
-41

85
Employment growth shows that the Nashville MSA is the top region in the country for the rate of music industry
employment growth. In addition to the concentration of music industry professionals, this growth is being driven
by the business climate in Tennessee and the cost of living that is signicantly lower than Los Angeles, New
York, Chicago and Seattle. However, it should be noted that the cost of living in the central core counties of the
Nashville MSA have risen in terms of housing, transportation and consumer goods. These increases are pushing
the music industry workers to the outer counties of the Nashville MSA. This dispersion, if not addressed, could
impact the cluster synergies and specializations that the region has developed in the past ten years.
98.5 145.9 237.4 99.3 120 110.8 114.4 80.4 104.5
Nashville
Los
Angeles
New
York
Austin Chicago Denver Miami Memphis
New
Orleans
156.7
Seattle
*The average for all participating places equals 100. Each participant’s index is read as a percentage of the average for all places.
Currently, the growth trajectory is projected to continue to outpace the rest of the nation over the next ten
years. Comparison of music industry job growth also highlights the growing importance of the Nashville region
to the music industry. Whether looking at one year or ten year employment growth, the Nashville MSA is the top
region in the country for the rate of music industry employment growth and that trajectory will only continue to
outpace the rest of the nation over the next ten years. In the graph below, the rate of growth that has ramped
up for the Nashville MSA since 2016 appears to be tempered in 2020 and attens for the next ten years. This
is the impact of Covid-19 and the use of a compound annual growth rate to project the employment data. It
is expected that Covid-19 will suppress this industry’s growth for a period of three years before resuming an
upward path again.
Cost of Living Index
65

86
Projected Job Growth Rate by MSA (2009 – 2019 – 2029)
Given this growth it is not surprising the Nashville region’s brand revolves around its relationship to music. Music is one
of the region’s top industry clusters. Music is quickly evolving with Nashville expanding from the center of bohemian
creativity to a rapid technological business center, attracting and developing its own unique creative core and creative
professionals. Artistic commercial success has coupled with an ever-broadening eld of genres—producing their
own authentic output, technological leadership and business infrastructure—to create a region where the music and
entertainment industry has become a keystone of the economic landscape. The world continues to see Nashville as the
center of music creativity and has begun to recognize the region’s role in conducting music industry commerce as well.
Nashville is not only where the world comes to hear music, it is also where music comes to do business.
Nashville
Los Angeles
New York
Austin
Chicago
Denver
Miami
Memphis
New Orleans
Seattle
100%
80%
60%
40%
20%
0%
-20%
-40%
-60%
-80%
Nashville
Los Angeles
New York
Austin
Chicago
Denver
Miami
Memphis
New Orleans
Seattle
6,697
19,401
18,064
1,820
6,855
2,378
4,383
1,045
865
2,982
8,779
19,812
18,074
1,717
5,417
2,185
3,873
977
883
2,941
2,082
411
10
-103
-1,438
-193
-510
-68
18
-41
31%
2%
0%
-6%
-21%
-8%
-12%
-7%
2%
-1%
$97,037
$119,263
$110,197
$71,997
$84,645
$71,740
$79,938
$49,545
$44,053
$65,328
752
1,609
1,256
143
447
120
429
35
69
151
2009
Jobs
2019
Jobs
% Change
2019
Average
Earnings
2019
Payrolled
Business
Locations
Region Change
2001 2003 2005 2007 2009 2011 2013 2015 2017 2019 2021 2023 2025 2027 2029

ECONOMIC IMPACT AND
CONTRIBUTION ANALYSIS
Working with the understanding of businesses and linkages from various music industry aligned clusters, the
Research Center combined and reviewed data sets derived from federal, state and private sector resources
to determine the total direct employment in the region and U.S. for the music industry and the music and
entertainment industry (respectively). The regional and national employment gures are used to calculate the
economic impact of the music industry through input-output modeling using the IMPLAN economic impact
software. IMPLAN is an economic impact modeling software that can take direct inputs of a given sector and
calculate the total economic impact of that sector on the entire economy in terms of direct effect (direct trade
ows within the industry or industries involved), indirect effect (capturing the impact of the supply chain or value
chain) and the induced effect (the impact of income and wages on spending). Employment was used as the
baseline input variable to calculate the economic contribution and impact analysis for this report.
Recall that the 2013 Music Industry Study incorporated employment and economic data that included both
Music and Entertainment Industries. Data tools at the time limited the ability to pull out a purely music industry
dataset. In 2020, data tools allow researchers to rene the data so that a purely music industry data set could
be delineated. This updated study includes both an assessment of the economic impact of the Music and
Entertainment Industry in 2019, for comparison with the impact as measured in 2013’s study as well as an
updated evaluation of the data examining the economic impact of the Music Industry exclusively.
REGIONAL MUSIC AND ENTERTAINMENT ECONOMIC IMPACT ANALYSIS – 2013 VS 2020
The economic impact analysis for the Nashville MSA determined the Music and Entertainment Industry is
responsible for 80,757 jobs within the Nashville area offering employee compensation of $6.3 billion and adding
$9.9 billion to GDP (Gross Domestic Product). All told, analysis shows that the Music and Entertainment Industry
had a total economic impact of $15.6 billion to the Nashville MSA. The tables following compare the results of
the 2013 economic impact analysis with the 2020 results.
NOTE: While the study dates state 2013 and 2020 respectively, these numbers represent 2012 and 2019 data.
1 - Direct
2 - Indirect
3 - Induced
Total
41,153
17,255
22,348
80,757
$3,619,031,221
$1,176,226,077
$1,482,221,985
$6,277,479,282
$5,798,352,109
$1,702,993,502
$2,390,415,276
$9,891,760,886
$ 8,666,157,315
$ 3,065,744,426
$ 3,878,786,759
$15,610,688,499
1 - Direct
2 - Indirect
3 - Induced
Total
27,095
11,316
18,110
56,520
Employment
Type Impact
$1,678,070,236
$648,311,537
$913,017,746
$3,239,399,520
Labor Income
$2,964,880,249
$977,877,525
$1,547,655,826
$5,490,413,600
Value Added
$5,747,450,788
$1,513,393,947
$2,391,973,025
$9,652,817,760
Output
2020
2013
Respectively, these numbers represent 2012 and 2019 data values.
Music and Entertainment Industry Economic Impact, Regional
87

Since the 2013 Music Industry Study conducted by the Nashville Area Chamber of Commerce, the Music and
Entertainment Industry in the Nashville MSA has signicantly increased its economic effect. Since 2013, the
effect on total jobs increased 43% (24,000) from 56,520 to 80,757. The impact on labor income has gone up
by 94% ($3 billion) from $3.2 billion to $6.3 billion. The contribution to GDP by the Music and Entertainment
Industry went up by 80% ($4.4 billion) from $5.5 billion to $9.9 billion and the overall economic impact of the
Music and Entertainment Industry grew by 62% ($6.0 billion) going from $9.7 billion to $15.6 billion.
REGIONAL MUSIC AND ENTERTAINMENT ECONOMIC IMPACT ANALYSIS – 2013 VS 2020
For the Music Industry Report 2020 update, researchers used a stafng pattern matrix that determines music-
related employment from all related industry sectors. This was further rened to calculate net music-related jobs
by industry. Assessing the 2012 and 2019 datasets for jobs that are purely music industry related reveals that
in 2013, the Music Industry included approximately 17,000 total direct jobs that were responsible for another
17,000 jobs through their value chain. By 2020, direct employment grew from 17,000 to nearly 22,000 (a net
increase of 29% or 4,870 jobs). Total employment from the music industry accounted for 34,206 jobs in 2013,
growing by 9,742 jobs (an increase of 28%) in 2020. In 2013, the Music Industry directly contributed $2.1 billion
to regional GDP with another $1.5 billion added through indirect and induced effect for a total of $3.6 billion.
This grew by $1.7 billion to $5.3 billion (an increase of 47%) in 2020. Labor income increased by $872 million
increasing from $2 billion in 2013 to $2.9 billion (43%) in 2020. Overall economic impact of the Music Industry in
the Nashville MSA in 2020 is $8.6 billion which represents an increase of $2.6 billion (43% increase) since 2013
when the economic impact was $6.1 billion.
NOTE: While the study dates state 2013 and 2020 respectively, these numbers represent 2012 and 2019 data.
1 - Direct
2 - Indirect
3 - Induced
Total
21,878
10,336
11,735
43,948
$1,618,928,267
$618,297,135
$653,351,180
$2,890,576,582
$3,199,613,641
$997,357,889
$1,084,013,965
$5,280,985,496
$5,018,186,861
$1,773,683,204
$1,848,075,502
$8,639,945,567
1 - Direct
2 - Indirect
3 - Induced
Total
17,008
8,050
9,149
34,206
Employment
Type Impact
$1,124,803,911
$440,562,035
$453,628,945
$2,018,994,891
Labor Income
$2,134,218,695
$722,116,710
$744,810,291
$3,601,145,697
Value Added
$3,470,329,912
$1,302,725,584
$1,277,102,742
$6,050,158,238
Output
2020
2013
Music Industry Economic Impact, Regional
88

U.S. MUSIC INDUSTRY ECONOMIC IMPACT ANALYSIS – 2013 VS 2020
For this portion of the study, researchers again were able to use a stafng pattern matrix that determines
music-related employment from all related industry sectors further rened to calculate net music-related jobs by
industry for the entire United States. The nely tuned 2012 and 2019 datasets which are purely Music Industry-
related represent the 2013 total direct jobs of approximately 1.2 million that were responsible for another 1.4
million jobs through their value chain for total music-related employment of 2.6 million. By 2020, direct Music
Industry employment grew nationally to 1.3 million—a net increase of 10.4% or 124,000 jobs. Total employment
from the Music Industry in the United States accounted for 2.8 million jobs in 2020, an increase of 137,000 jobs
or 5.2%. In 2013, the Music Industry directly contributed $120 billion to U.S. GDP with another $124 billion
added through indirect and induced effect for a total of $245 billion. By 2020, direct Music Industry GDP grew
by $18 billion to $139 billion—an increase of 15.3%. Overall, music-related GDP was $278 billion in 2020, an
increase of $33 billion (13.6%). Direct labor income increased by $15.8 billion increasing from $73 billion in 2013
to $88 billion (43%) in 2020. Overall, national Music Industry labor income increased $25 billion (17%) from
$149 billion in 2013 to $175 billion in 2020. The overall economic impact of the Music Industry in the United
States in 2020 is $514 billion which represents an increase of $43 billion (9.2%) since 2013 when the
economic impact was $471 billion.
Music Industry Economic Impact, United States
1 - Direct
2 - Indirect
3 - Induced
Total
1,317,858
744,542
707,646
2,770,046
$88,521,039,359
$46,603,402,636
$39,399,976,293
$174,524,418,288
$138,795,206,869
$74,065,133,894
$65,373,681,654
$278,234,022,417
$265,132,048,545
$137,452,111,059
$111,452,143,903
$514,036,303,507
1 - Direct
2 - Indirect
3 - Induced
Total
1,193,864
760,405
678,851
2,633,120
Employment
Type Impact
$72,734,642,791
$42,845,166,299
$33,660,960,314
$149,240,769,403
Labor Income
$120,346,812,923
$69,361,232,400
$55,274,598,152
$244,982,643,475
Value Added
$245,617,257,298
$130,244,185,069
$94,779,115,567
$470,640,557,933
Output
2020
2013
NOTE: While the study dates state 2013 and 2020 respectively, these numbers represent 2012 and 2019 data.
89

90
LARGE MUSICAL
EVENTS IN TENNESSEE
Meta-analysis of the economic impacts of large-scale live musical events was conducted to quantify their
net value to the regional economic landscape as well as assess the consequence of their absence in 2020.
Analysis of each event’s economic impacts conducted by independent research not associated with this study
highlighted signicant variance in methodologies utilized to calculate total impact. Researchers of this study
determined that these variances were substantial enough to prevent a direct comparison of impacts for each of
these events. However, the collected data provides compelling insights.
In addition to performing groups, both suburban and metropolitan communities are highly invested in live
musical events. These large gatherings are a catalyst for economic activity with impacts branching far beyond
the event itself. In addition to the performance, live events boost commerce within their immediate vicinity.
Food, lodging, entertainment, shopping, transportation and many other industries experience an inux
in activity from live musical events. However, these events require large congregations of people in highly
concentrated areas. Due to the constraints created by the COVID-19 pandemic, this is no longer a possibility.
Annually, Tennessee hosts more than 20 large scale music festivals and countless musical concerts. Festivals are
an epicenter of economic activity for musicians and consumers alike. These events draw hundreds of musical
acts and thousands of audience members creating spikes in commerce through the duration of the event. These
spikes in economic activity can be categorized into direct impact (the initial round of spending from attendees)
and indirect impact (business to business transactions within the local economy).
Location
Genre
Number of Musical Acts
Number of attendees
Event Length
Direct economic impact
Indirect Impact
Total Impact
2020 Projected Growth (CAGR)
2020 Projected Impact
Nashville
Country
300+
200,000+
4 days
N/A
N/A
$65M (2019)
2.99%
$66.9
CMA
Music
Festival
Festival
Manchester
Rock
100+
80,000+
4 days
$36M (2013)
$15M (2013)
$51M (2013)
2.50%
$57.40
Bonnaroo
Music and
Arts Festival
Nashville
Americana
250+
48,000+
6 Days
$8M (2016)
$7M (2016)
$15 (2016)
N/A
N/A
Americana
Music
Festival
Franklin
All
75+
33,000+
2 Days
N/A
N/A
$3 M (2019)
75.71%
$5.27
Pilgrimage Music
and Cultural
Festival
Knoxville
Alternative
40+
16,000+
4 Days
N/A
N/A
$2.1M (2017)
1.56%
$2.23
Big Ears
Music
Festival
Chattanooga
Blues, Rock, R&B
100+
350,000+
9 Days
N/A
N/A
$29M(2017)
5.79%
$31.31
Riverbend
Music
Festival
Memphis
All
67
107,153+
3 Days
N/A
N/A
$76M (2019)
24.89%
$94.88
Beale Street
Music
Festival
66 66,67 69
70,71
70,71 72,73 74 75

91
Findings suggest that indirect impacts from live musical events can amount to upwards of 42% of direct
impacts. In 2016, Americana Music Festival generated a direct economic impact of $8 million, and an indirect
impact of $7 million for the greater Nashville community. This indicates the capacity of live musical events to
generate indirect and induced impacts equivalent to 87.5% of their direct contributions.
The absence of large-scale live musical events will undoubtedly inuence the economy of Middle Tennessee as
well as the rest of the country. Music festivals in and around Davidson county had annual growth rates of ranging
roughly from 2.5% - 2.9% before the pandemic. CMA Fest, Bonnaroo and Pilgrimage festival alone were
projected to generate a $130 million economic impact for Middle Tennessee in 2020. These are just three of
the more than twenty music festivals in the state of Tennessee each year. The implications of these ndings are
twofold. Not only is the live music industry suffering devastating losses, but its impact is also deeply affecting its
host economies.
Within the music industry, this impact will also have a forward reaching impact. This report’s Survey to the Music
Industry provides the perspective of industry workers on the condition of live musical events. Nearly 87% of
respondents anticipate booking a lower number of live performances in 2021. When asked if average number
of bookings for live performances and concerts for 2021 were higher, lower or about the same as usual, 4% of
respondents indicate higher, 86.9% of respondents indicate lower and 9.2% indicate the same as usual.
Of respondents to the Survey to Consumers of Music, 65.3% are uncomfortable with attending a live event.
This is likely to continue to be the case in the coming year as 45.6% of respondents do not plan on returning to
live concerts until there is a vaccine for COVID-19.
12.6%
14.9%
7.1%
22.5%
42.9%
How comfortable would you be going to a live show tonight?
Extremely comfortable
Somewhat comfortable
Neither comfortable nor uncomfortable
Somewhat uncomfortable
Extremely uncomfortable
6.9%
12.1%
16.0%
15.3%
3.0%
45.8%
1.1%
How soon would you feel comfortable attending a live concert?
Within a few weeks
Within a few months
In about 6 months
In about a year
In about 2 more years
When there is a vaccine for COVID-19
Never

92
Projections and survey data indicate the coming year will be lled with uncertainty for the live music industry.
However, it is important to keep in mind that live music does not exist in isolation, but as a foundational
component of the Nashville economy and cities all around the country. Accordingly, advocacy for live musical
events isn’t simply advocacy for the arts. Rather, it is support for our entire economic community.
INDEPENDENT VENUES
Venues are where people gather to listen to and experience music together. Unfortunately, during a pandemic
this type of gathering is not possible. In order to create a support network for the independently owned music
venues in Nashville, Chris Cobb founded MVAN, the Music Venue Alliance. This alliance has a membership
of fteen venues classied as spaces that derive the majority of their revenue specically through ticket sales
and other revenue associated with events. Members include The Basement, 3rd and Lindsley, Station Inn, The
Listening Room, The Bluebird Café, The Cannery Ballroom, The East Room, the High Watt, DRKMTTR, The End,
Rudy’s Jazz Room, The 5 Spot, Mercy Lounge, Springwater Supper Club & Lounge and Exit/In. Using Music
Venue Alliance membership as a case study, it is possible to examine the economic impact of independent
venues locally.
Nashville’s independent music venues that comprise MVAN membership have on average been in business
for nearly 30 years. The youngest of these businesses is three years old. They were by all accounts protable
enterprises having weathered recessions and the years fairly successfully; some even gaining international
recognition. Then the global pandemic, COVID-19, hit the United States, forcing mandated shutdowns
throughout the country.
Based on aggregated estimations of data reported by the independent music venues that make up the Music
Venue Alliance of Nashville, the researchers were able to determine some baseline revenue, expenditure and
employment data for 2019 and 2020 year-to-date. This baseline data was then utilized to create an economic
impact model. Data is meant to be emotionless, however the story told by this data is a heartbreaking
rendition of the struggle COVID-19 has created on Main Street.
2O2O YTD
-72% Revenue
-73.5% Employment
Revenue - $8.9M
FTE Jobs - 74
2O19
Revenue - $31.8M
FTE Jobs - 279

93
Reduced overhead by an average of 54.8%
Laid-off an average 89.5% of their employees
100% received PPP LOANS and TN Small Business Grants
Received an average of 12.1% rent relief
Experiencing an average of 90% revenue loss since March 15th
Independent music venues have exhausted nearly all their options operating frugally and responsibly
throughout the pandemic.
PPP loans and TN Small Business Grants were insufcient for most independent music venues covering an
average of only 14.6 weeks of expenses. Furthermore, a signicant percentage of PPP funds are loans which will
have to be paid back. Additionally, many independent music venues turned to crowdfunding at rst, but passed
almost all of these donations though to their employees. Note these crowdfunding efforts covered on average
approximately 1.6 weeks of expenses.
ECONOMIC IMPACT ANALYSIS
OF INDEPENDENT MUSIC VENUES
Overall, independent music venues in Metro Nashville lost 72% of their overall revenue and 73.5% of their
employment. In 2019 independent music venues had a total economic impact of $49.6 million in Davidson
County. Because of COVID-19, the total economic effect to date is a loss of $35.7 million dollars, this
represents a loss of $22.6 million in revenue to these independent music businesses. The impact this had
regional employment is a net loss of 275 full time equivalent jobs which equates to $17.1 million in lost wages
and a loss of $24.8 million to Davidson County’s Gross Domestic Product. In the words of Chris Cobb, this
scenario created by COVID-19 is, “Extinction Level!” Cobb also shares,
“My fear is for this foundation level. These small venues across the country that build
the foundation level of the live industry—a lot of places are going to go under and
they won’t come back.”

94
1 - Direct
2 - Indirect
3 - Induced
Total
74
11
16
102
$4,778,987
$878,929
$1,164,453
$6,822,368
$6,589,022
$1,472,797
$1,790,924
$9,852,744
$8,829,253
$2,257,887
$2,833,003
$13,920,143
1 - Direct
2 - Indirect
3 - Induced
Total
279
42
56
377
Employment
Type Impact
$16,689,824
$3,209,802
$4,042,515
$23,942,142
Labor Income
$23,036,243
$5,411,504
$6,217,820
$34,665,567
Value Added
$31,430,744
$8,353,173
$9,835,737
$49,619,654
Output
2020
2019
The loss of the ability of these independent music venues to conduct business also impacts tax revenues
collected by federal, state and local governments. In 2019, the economic activity generated by these 16
businesses represented $5.8 million in tax payments. In 2020, the expected net loss in taxes that result from
the economic impact to these 16 independent music venues represents a loss of $4.2 million dollars in tax
revenue. 2020’s losses in taxes are as shown below.
1 - Direct
2 - Indirect
3 - Induced
Total
$130,462
$35,213
$56,534
$222,209
$176,289
$49,055
$72,638
$297,981
$757,690
$152,734
$197,369
$1,107,792
$1,064,440
$237,002
$326,541
$1,627,982
1 - Direct
2 - Indirect
3 - Induced
Total
$506,210
$132,933
$196,311
$835,454
Local Taxes
Type Impact
$669,664
$184,338
$252,226
$1,106,227
State Taxes
$2,658,866
$560,249
$685,199
$3,904,314
Federal Taxes
$3,834,740
$877,520
$1,133,736
$5,845,995
Total
2020
2019
State of TN
-$800K
Metro
Nashville
-$600K
Federal
Government
-2.8 Million
Economic Impact Analysis - Independent Music Venues
Net Loss In Taxes

Springwater
Exit/In
The End
Station Inn
Rudy’s Jazz Room
The Basement
3rd and Lindsley
The Listening Room Cafe
Cannery
Ballroom
DRKMTTR
The East Room
Mercy Lounge
The 5 Spot
The Bluebird Cafe
The High Watt
Music Venue Alliance Nashville Map of Venues

96
DIVERSITY AND INCLUSION
Having established the formidable economic impact that the music business and the entertainment cluster have
on the Nashville region and the United States, it is pertinent to ask, who benets? Black and African American
artists have played huge roles in the inception of music in the U.S. and the branding of Nashville as Music
City, USA. However, when music is commercialized and business structure is built around music, much of this
representation fades. This means not only a loss of economic and social capital to individuals of color who work
in the music business, but also a cultural loss and a loss to the music industry economy. When talent is omitted,
neglected or not included, Nashville’s music industry doesn’t reach its full potential and the music industry’s
impact on the economy is diminished.
According to Economic Modeling Specialists, Inc. (EMSI), only 9% of music industry professionals in the
United States are Black or African American. This compares to 8% in the Nashville region. In the United States,
approximately 13% of the population is Black or African American. This compares to approximately 16% in the
Nashville region. This is a huge decit.
Kadeem Phillips, Executive Director of Creatives Day, a Nashville group that primarily works with young Black
music creators, describes the organization’s new partnership with Middle Tennessee State University,
“One of our newest partnerships with MTSU and the recording industry program is really breaking a wall
down because we are able to take artists who are Nashville natives inside of their program. We’re able to
put them inside of our program and connect them to resources they had no access to before. We have this
melting pot of creators right under our noses and these kids were basically left out to the cold. So, one of the
biggest things is making sure that…artists have a voice. It’s also making sure that people have the resources
to break the nancial gap. There’s a big nancial gap between Black and white people in the music industry,
especially in Nashville. Just being able to get opportunities and being able to do what you want to do and
actually grow your career and actually make money off of that and that in return builds residual income for
your family. That’s what we’re all trying to do, so we’re creating that opportunity and passing it on.”
In the Spring of 2020, calls for representation in the music industry intensied. As the U.S. was experiencing
social upheaval after the killing of George Floyd, a Black man, at the hands of a Minneapolis policeman, the
#BlackoutTuesday movement was born. Although this became a social media campaign with a life of its own
intended to show solidarity with the Black Lives Matter movement, it started in the music industry. The original
initiative was #TheShowMustBePaused and it was created by music executives Brianna Agyemang and Jamila
Thomas. Thomas is a senior marketing director at Atlantic Records and Agyemang is a senior artist campaign
manager at Platoon. The movement was meant to intentionally disrupt the work week so everyone could
participate in an “honest, reective and productive conversation about what actions we need to collectively take
to support the Black community.” Although this is clearly not the beginning of the discussion, this is the event
that the research team uses to frame examination of the state of the Nashville music industry when it comes to
diversity and inclusion.
76

97
In Nashville today, there are numerous advocates and leaders who are championing efforts to promote
diversity and inclusion in the music industry. After the events of #BlackoutTuesday, the research team
conducted a focus group to examine the impacts of this event and ongoing diversity and inclusion efforts in
the music industry specically in Nashville.
Thalia ‘Muziqueen’ Ewing, founder of Nashville is Not Just Country Music states,
Ms. Ewing went on to discuss how this enabled her to create internship programs and connect the company
with the proper community resources. Because she was one of the only Black professionals in the ofce, Ms.
Ewing felt that if she did not step up in this moment, it would pass by.
Four common themes from the focused conversation:
Hiring and Job Creation: Diversity has to be a commitment at all levels, especially in
management, in order for the music industry to improve. It has to be built into the
infrastructure of the music industry for it to last.
“Resources need to be carved out so there are diverse people at every level. There are
talented, gifted people out there who are capable of doing a myriad of things. Education
is important, experience is important. But I challenge you…if you don’t “nd” the person
you are looking for with the education or experience; have you considered the one with
the most possibility? Commit to the person who can either answer “what’s possible” or
is willing to nd the answers to that question. Then connect, equip, teach, and empower
them to do the work.”
Gina Miller, Senior Vice President and
General Manager of Entertainment One
“I need to know – what are we going to do? What is the purpose? From that
moment [#BlackoutTuesday] on, it gave me the key that I needed to open the door
to be vocal about how I was already feeling as an employee coming into that ofce
every day and not seeing the diversity that needed to be there.”

98
Intentionality: #BlackoutTuesday was the key to opening the door to conversations
about diversity in many spaces, but representation is still an issue. Nashville has an
opportunity to intentionally be a truly diverse city.
“Nashville has to decide who they are as a brand, who they want to be and put the
money behind it”
Dionne Lucas, Director of Retail Marketing and Sales at
the National Museum of African American Music
“Nashville has to nd their identity and what they want to represent. You can’t call
yourself a Music City to the world but only cater to particular genres and not give
opportunities to people of color.”
Lee Evans “The Write Hook”
aka MUG$ Amillion
Ownership: Ownership of record labels, of space like the National Museum of African
American Music, and of space for Black creatives, is crucial for an equitable industry.
“I feel that we lack ownership in Nashville and Middle Tennessee. That’s the biggest
problem, we don’t have a safe space for us, by us and that’s what we need to create
the income that we need to be pushed through our community. How do we get this
community center for the arts? Where are we going to house this renaissance that’s going
to happen in Nashville?”
Kadeem Phillips, Executive Director, Creatives’ Day;
Founder & CEO of Power Entertainment
Sustainable Opportunities: Creating sustainable and repeatable business opportunities and
infrastructure for creators is necessary for representation and inclusivity to endure.
“As entrepreneurs in the entertainment space, being African-American, the business
and opportunities have to be sustainable. Sometimes you can get into situations [where
you are working with someone] and there’s this one-off opportunity just because you
have a relationship. But how many other people after you, or next to you, or behind you,
can also have that opportunity? One of our goals is to build out opportunities that are
sustainable for a broader group and not just siloed out of relationships.”
Eric Holt, Assistant Professor, Belmont University;
Co-Founder, The Lovenoise Group/Syzygy Management

99
Beyond these four themes, nd more conversation outtakes below.
Dionne Lucas with the National Museum of African American Music discussed the importance of
investing in diversity. She asserts that businesses should value possibility and opportunity. The
National Museum of African American Music is doing just that.
“People are coming to us for a Black experience, so they want to work with Black
vendors. I’ve had clients that wanted to plan events with Black caterers, Black
bartenders and Black entertainers. They want all the money from the event to go to
minority operations. Therefore, everything the museum does is focused on inclusion. For
instance, you’d be hard pressed to nd more than two Black vendors in any store that’s
a gift shop or attraction store in Nashville. I’m working with a lot of diverse vendors so
that [the museum] can give them a chance in our store. What I nd is that giving people
a chance costs a lot of money and this makes it hard for people to gain entry. Vendors
who don’t have experience with larger accounts require a lot of training and coaching.
The leadership team at the museum decided that the cost to get [diverse vendors] in is
the cost we will pay. Because once I allow a vendor to sell their stuff in my store, then
it’s easy for them to call the Civil Rights Museum in Atlanta. It’s easy for them to call
the Country Music Hall of Fame. We decided we will be the ones to help catapult these
vendors into other organizations.”
Thalia “Muziqueen” Ewing has fostered a growing community coined “Nashville Is Not Just Country
Music,” because Nashville is so much more than just one genre. Ms. Ewing noted that there is a diverse
music scene in Nashville, but the music industry outside of Nashville is not paying attention to the
diversity of genres and this ultimately hurts Nashville’s bottom line.
Negative perceptions and unconscious biases often result in the creation of roadblocks and barriers to
Black artists. Musical artist Chuck iNDigo posed the question.
“Why do we have to feel validated by white people to feel legitimate? My music is for all
people, but why is it that only one group can validate its worth?” This is why he set out to
create his own label, Third Eye.
Overall, there is a lot of momentum around diversity and inclusion in this moment. This is an opportunity
for Nashville to grow and continue to make a commitment to diversity as a “Music City.” That means
creating space for conversations about race and diversity that are followed by action, so more voices
are included and empowered as a result. Music is best when everyone has a seat at the table, and this
momentum presents an opportunity for everyone in the industry to join the effort to make that a reality.


The music industry is lled with the sounds of more genres than it is possible to name. A lot of music is a
conglomeration of inuences that cross multiple genres or is nearly impossible to classify. However, there are
more distinct lines when looking at commerce, business practices, consumers, and industry standards. The
Nashville region is well-known for country music; however, other burgeoning music scenes are equally important
to the cultural and economic landscape. The indie and alternative scene is vibrant amongst Nashville’s many
colleges’ student bodies. The Folk and Americana scene brings musicians, bookers, managers and other industry
professionals to town with the yearly AMERICANAFEST. Hip-hop and rap are blossoming, as Thalia Ewing of
Nashville is Not Just Country Music states,
“What’s great about Nashville hip-hop is that it has more of an underground feel instead of a commercial feel.”
A Thrillist article also praises the Nashville hip hop scene: “In some cities, the music feels heavily packaged,
almost like a product. But here, it’s authentic and creative, and there’s a lot of variety.”
These and more genres are growing in Music City and changing the industry day by day.
Many point out that failure to foster diverse music scenes equates to an abdication of economic opportunity. Lack
of local radio play of Nashville music when it comes to diverse genres is one example of this.
EVALUATION OF
TRENDS BY GENRE
IN THE NASHVILLE REGION
“There’s music of all kinds in Nashville and it’s always been that way to some extent,
but it’s become even more so the last twenty years or so. The thing that we wanted
to bring to Nashville was that we wanted to have that variety. It’s Music City, USA,
but how many records are recorded in this town that never get played on a Nashville
radio station?”
Randy Fox, Co-Founder and DJ, WXNA
101
77

102
38%
8%
16%
35%
9%
28%
21%
22%
8%
35%
20%
9%
46%
39%
43%
A favorite genre to
experience live
50%
13%
21%
42%
11%
40%
34%
23%
9%
48%
25%
12%
51%
42%
58%
A favorite genre
to listen to
26%
15%
12%
55%
5%
32%
15%
19%
5%
43%
8%
3%
35%
44%
39%
The primary genre for
music creators
Alternative / Indie
Christian & Gospel
Classical
Country
EDM/Electronic
Folk / Americana
Hip-Hop & Rap
Jazz
Latin
Pop
Punk / Emo / Hardcore & Metal
Reggae
Rock
Singer / Songwriter
Soul, R&B & Blues
The segments below provide high-level looks at the different genres of music that make up the Nashville
ecosystem. Data from the Consumers Survey provides information about how people listen to the various genres
and how they have participated in the music scene since COVID-19 hit. Approximately 50% of respondents to
this survey live in the Nashville region. Data from the Survey to the Music Industry provides information about how
creators are making, recording and sharing music since March, how the pandemic has affected them and their
work, as well as if they have more than one job, if they consider themselves independent and if they are part of a
union. Over 50% of respondents to this survey live in the Nashville region.
Notable names, in terms of creators, business entities and events, come from Chartmetric, Spotify playlists,
secondary research of local Nashville publications such as the East Nashvillian and the Nashville Scene
(particularly the “Best of Nashville 2020” edition), as well as invaluable input from The Other Nashville Society
(TONS), a membership association and community of non-country music industry professionals and artists.
Chartmetric, when available for a specic genre, provides information about top artists per genre streamed in
Nashville, not necessarily local artists. Artists from Spotify playlists offer a snapshot of which artists are being
promoted on curated playlists on a streaming service consistently listed as the number one way that consumers
listen to each genre. Finally, a combination of input and secondary research intends to create a picture of
each genre in terms of rising or established Nashville artists, genre-specic events that serve to cultivate the
local scene, large employers who may be genre-specic or inuential gures in business. Due to the sampling

103
methodology, artists vary greatly in terms of established audience size, representing an interesting range
per genre. Information provided per artist includes monthly Spotify listeners, top Spotify streamed city
and Instagram followers as of November 6, 2020. These are very high-level snapshots. The research team
acknowledges that each of these segments could be expanded and that there is plenty of overlap between
many of these genres.
ALTERNATIVE/INDIE
FANS SURVEYED IN THE MUSIC CONSUMERS SURVEY
50% of people list this genre as one of their favorites to listen to
38% of people list this genre as one of their favorites to experience live
The top way people who listen to the Alternative/Indie genre consume music is via Spotify, at 72%
of the category
76% of Alternative/Indie fans have bought music related merch in the past year
Alternative/Indie fans have attended four livestream concerts on average since March
24% of Alternative/Indie fans paid for livestreams or virtual performances
24% of Alternative/Indie fans participated in crowd funding or donated to any other sources of
supplementary income for artists during COVID-19
MUSIC CREATORS SURVEYED IN THE SURVEY TO THE MUSIC INDUSTRY
26% of music creators indicated that this was one of their primary music genres
17% of Alternative/Indie music creators report they are making more music since the onset of
COVID and 67% report they are making less
Alternative/Indie music creators list the top three results of COVID as follows:
Loss of scheduled gigs, studio work, or residency: 80%
Loss of Revenue, employment, or benets: 74%
Cancelled or postponed their tour: 39%
23% of Alternative/Indie music creators have participated in a livestream concert for
compensation and 40% for no compensation since March
62% of Alternative/Indie music creators have recorded music in a studio within the last six months
42% of Alternative/Indie music creators have released music in the last six months
18% of Alternative/Indie recording artists/vocalists are signed to a record label
27% of Alternative/Indie recording artists or vocalists are signed to a music publisher
84% of Alternative/Indie music creators consider themselves to be an independent artist or songwriter
52% of Alternative/Indie music creators have more than one job
16% of Alternative/Indie music creators do not have health insurance
27% of Alternative/Indie music creators are part of a union

104
Indie and alternative music spans many levels of engagement. Some bands/artists t into the small venue
DIY scene while others are selling out amphitheaters. Live music and merch sales are huge for these artists.
51.8% of surveyed music consumers said if given $50 to spend on their favorite musician, they would buy
a ticket to see them live above other things. Not having live shows to sell merch has been a hard hit to the
music industry and of those music professionals interviewed who are working in indie/alternative, 87.8% say
the number of live shows they’re booking for 2021 is lower than normal. In the past decade, the term “indie”
has shifted from meaning independent to being a genre. It is often used as a selling point differentiating
these artists from those under the big three record labels.
GENRE CULTURE
Most alternative/indie solo artists and bands write their own songs without any other outside writers. The
splits are typically amongst the band members and any publishers if they are signed.
Fortunately, none of the songwriters we interviewed for this study were dropped from their publishing deals
due to COVID-19. In fact, writer and artist DEZA just signed to Prescription Songs in September of 2020 and
other industry professionals have stated they are still actively seeking new artists and clients.
WRITING CULTURE
“The only reason I can afford to be a songwriter full-time right now is because of my publishing
deal. I am so thankful for that. Publishing deals offer you the very valuable opportunity to fully
focus your energy on your writing and not on a part-time job, you know?
I don’t know that it’s completely necessary. You can absolutely do a lot of groundwork by
yourself. And there’s no reason to rush into a deal that doesn’t feel right for you!!
But on the other hand, I’m really feeling the luxury of having people on my team! In the past,
doing it all on my own could get really exhausting really quickly. You have to be careful to not
burn your energy out. Work hard and lay the groundwork, and make sure you’re pulling in a
team that’s good for you.”
DEZA, Songwriter at Prescription Songs
(Per Chartmetrics Top Alternative Songs Nashville Chart October 29th, 2020 by local airplay):
PANIC! AT THE DISCO
AJR
LEWIS CAPALDI
ASHE
NOTABLE NAMES 2020

105
LIZA ANNE
407,910 monthly Spotify listeners
Top Spotify Streamed City: Chicago
18K Instagram followers
ARLIE
513,628 monthly Spotify listeners
Top Spotify Streamed City: Chicago
10K Instagram followers
BETCHA
335,281 monthly Spotify listeners
Top Spotify Streamed City: Chicago
7K Instagram followers
COIN
4,311,160 monthly Spotify listeners
Top Spotify Streamed City: Chicago
113K Instagram followers
COUNTRY WESTERNS
2,988 monthly Spotify listeners
Top Spotify Streamed City: Stockholm
1K Instagram followers
NOTABLE NASHVILLE NAMES
BECCA MANCARI
223,394 monthly Spotify listeners
Top Spotify Streamed City: London
13K Instagram followers
BRISTON MARONEY
1,789,458 monthly Spotify listeners
Top Spotify Streamed City: Chicago
35K Instagram followers
MOON TAXI
1,255,423 monthly Spotify listeners
Top Spotify Streamed City: Atlanta
40.5K Instagram followers
SOCCER MOMMY
1,099,646 monthly Spotify listeners
Top Spotify Streamed City: Chicago
95K Instagram followers
“One thing me and the artists I work with say to each other is we have to function like no one
is going to help us. With that I think the same kind of concept comes into play when we think
of things environmentally. I can’t be waiting for touring to come back in order to think of ways
to monetize my client’s business.”
Maddy Sundquist – Manager, MADKAT MGMT
“The live industry has completely gone away. We had a lot of fairly big tours coming up just like
everyone else. We luckily had just nished a big European headliner which ended at the end of
January. But the rest of our tours canceled which in turn hurts our artists revenue. It’s forced a
lot of transitions with streaming now having to be a primary focus which has resulted in release
strategies being more squished. If you’re relying purely on the digital to drive momentum and
revenue you have to release more often or spend more money on marketing which is hard when
a lot of your revenue is now gone.”
Sam Saideman– Co-Founder/CEO of Innovo Management, LLC.
CHRISTIAN AND GOSPEL
FANS SURVEYED IN THE MUSIC CONSUMERS SURVEY
13% of people list this genre as one of their favorites to listen to
8% of people list this genre as one of their favorites to experience live
The top way that people who listen to the Christian & Gospel genre consume music is via Spotify,
at 54% of the category
60% of Christian & Gospel fans have bought music related merch in the past year
Christian & Gospel fans have attended three livestream concerts on average since March
23% of Christian & Gospel fans paid for livestreams or virtual performances
39% of Christian & Gospel fans participated in crowd funding or donated to any other sources of
supplementary income for artists during COVID-19
MUSIC CREATORS SURVEYED IN THE SURVEY TO THE MUSIC INDUSTRY
15% of music creators indicated that this was one of their primary music genres
9% of Christian & Gospel music creators report they are making more music since the onset of
COVID, and 80% report they are making less
Christian & Gospel music creators list the top three results of COVID as follows:
Loss of scheduled gigs, studio work, or residency: 86%
Loss of Revenue, employment, or benets: 83%
Purchased new gear, audio equipment, and/or musical instruments: 34%
21% of Christian & Gospel music creators have participated in a livestream concert for
compensation, and 29% for no compensation since March
64% of Christian & Gospel music creators have recorded music in a studio within the last six months
31% of Christian & Gospel music creators have released music in the last six months
9% of Christian & Gospel recording artists/vocalists are signed to a record label
24% of Christian & Gospel recording artists or vocalists are signed to a music publisher
70% of Christian & Gospel music creators consider themselves to be an independent artist or songwriter
53% of Christian & Gospel music creators have more than one job
16% of Christian & Gospel music creators do not have health insurance
55% of Christian & Gospel music creators are part of a union
106

With the temporary closing of many churches and congregations, music professionals in the Christian
industry lost several show dates and tours. Within the Christian genre, the atmosphere of a group of people
typically in worship adds to the listening experience, which has also been put on pause. Nashville is home to
Christian labels and publishing companies such as Curb Word Records, Essential Records (Franklin, Tenn.),
Provident Label Group, and Capital Christian Music Group, in addition to the Gospel Music Association.
GENRE CULTURE
“Particularly in Christian music, we’ve always struggled with ‘how do we cover all of our costs.’
There has been this mentality among Christian music consumers that because it’s Christian,
because it’s ministry, that it should be cheap or free, right? The truth is, it costs me the same
as anybody else to go out and do a show. The bigger show I do, the more expense I have
in doing those shows. There’s a real issue with many folks not being willing to pay the same
amount for a ticket to a Christian show as they would for their favorite mainstream act. They
want and deserve the best live experience that anyone can deliver on every level and we want
to give it to them. I am hopeful we will see a shift and folks will understand and feel the real
value of a high-quality live experience and the ability to be able to get out and be together [to]
experience live music. That live show is reason that we do this.”
Mike Jay, Everything But the Show Podcast
(From Spotify’s Top Christian Playlist):
I AM THEY
NEEDTOBREATHE
WE THE KINGDOM
TASHA LAYTON
COCHREN & CO.
NOTABLE NAMES 2020
107

THE BELONGING CO.
624,337 monthly Spotify listeners
Top Spotify Streamed City: Dallas
82K Instagram followers
LOCAL SOUND
274,296 monthly Spotify listeners
Top Spotify Streamed City: Dallas
12K Instagram followers
NOTABLE NASHVILLE NAMES
LONG HALLOW WAVE
10,949 monthly Spotify listeners
Top Spotify Streamed City: Los Angeles
7K Instagram followers
NASHVILLE LIFE MUSIC
61,148 monthly Spotify listeners
Top Spotify Streamed City: Atlanta
6K Instagram followers
“Most artists in our industry see little to no money from record royalties. Eighty to ninety
percent of their revenue is dependent on live events and being able to play shows. It’s a
crucial piece to the whole entertainment industry. Whether it’s one person on stage or twenty
people, that live event represents and supports hundreds of people. I mean, there are so
many families that are represented there and that’s their livelihood. We could easily have in
some of the bigger tour situations 20, 30, 70 people on the road. And a lot of those people
are supporting families back home.”
Mike Jay, Everything But The Show
The Gospel Music Association works “to expose, promote and celebrate the Gospel through music
[and to] propel the Christian and Gospel music industry through education, advocacy, research and
preservation.” They allow membership at various levels which offer perks such as access to GMA
healthcare resources and voting capabilities in the DOVE awards, the yearly music awards show for
those in Gospel and Christian music.
“In the Christian market, getting cuts is entirely dependent—save for a couple of artists—it’s
entirely dependent on getting our writers in the room with other artists. They’re just not going
to accept totally outside songs. So, from that standpoint, publishing got very busy because all
the artists were home. They weren’t on the road and they had a lot more time to write. They
knew they needed to be putting out more music to keep fan engagement up. So, it created a
lot of opportunities to get our staff writers with other artists. So, in that sense it’s been a kind
of ramp up for what we’re doing in publishing. We’ve signed a couple of people since.”
Trevor Mathiesen, Senior Director of Publishing & A&R, CURB|Word Entertainment
Find Christian music on radio stations like 94.1 FM The Fish. Find business activity in Christian music at
various music publishers and labels like Capitol Christian Music Group in Brentwood, Tenn. employing
approximately 50.
108
78

109
CLASSICAL
FANS SURVEYED IN THE MUSIC CONSUMERS SURVEY
21% of people list this genre as one of their favorites to listen to
16% of people list this genre as one of their favorites to experience live
The top way that people who listen to the Classical genre consume music is via Spotify, at 52% of
the category, with CD’s and Radio as a close second and third
66% of Classical fans have bought music related merch in the past year
Classical fans have attended four livestream concerts on average since March
22% of Classical fans paid for livestreams or virtual performances
51% of Classical fans participated in crowd funding or donated to any other sources of
supplementary income for artists during COVID-19
MUSIC CREATORS SURVEYED IN THE SURVEY TO THE MUSIC INDUSTRY
12% of music creators indicated that this was one of their primary music genres
4% of Classical music creators report they are making more music since the onset of COVID and
88% report they are making less
Classical music creators list the top three results of COVID as follows:
Loss of scheduled gigs, studio work, or residency: 88%
Loss of Revenue, employment or benets: 83%
Purchased new gear, audio equipment or musical instruments: 83%
17% of Classical music creators have participated in a livestream concert for compensation and
33% for no compensation since March
53% of Classical music creators have recorded music in a studio within the last six months
19% of Classical music creators have released music in the last six months
18% of Classical music creators are signed to a record label
12% of Classical music creators are signed to a music publisher
18% of Classical music creators consider themselves to be an independent artist or songwriter
56% of Classical music creators have more than one job
7% of Classical music creators do not have health insurance
54% of Classical music creators are part of a union

110
While classical music can be performed by a soloist or with accompaniment, frequently classical musicians perform in
large ensembles like orchestras, symphonies, choirs, and bands. Beyond the struggle of not being able to host all these
musicians in the same room because of social distancing, vocalists and other woodwind and brass instrumentalists that
use their mouth as part of their instrument are unable to wear masks while performing, creating potential hazards for their
peers and for audiences, or expensive solutions in terms of barriers on stage that will not negatively impact acoustics or
ensemble playing. Opera and choral music have faced this struggle – of infecting each other onstage or audience, as data
has proven the high risk of transmission through singing—as well as the fear of COVID, a respiratory infection, directly
affecting their voice or their ability to play their instrument over the longterm, even post-infection and -recovery.
Elizabeth Racheva, who works for Washington Performing Arts said, “Most orchestras have canceled their seasons and
tours, or gone virtual.” Their organization has pivoted by offering online content across an array of genres, including
classical, for their patrons—Home Delivery Plus. As much as their patrons love hearing artists from their living room, they
have missed the production and acoustical values of a live performance, so WPA is creating content with this in mind. She
also believes classical may take longer to come back because of the median age of the audience.
GENRE CULTURE
“We have a lot of young people interested in classical—that said, the majority of our classical
audience is an older audience, 50+. And they’re the most at-risk group! Many people canvassed in
our audience survey said they aren’t comfortable coming back until there is a vaccine.”
Elizabeth Racheva, Chief Advancement Ofcer, Washington Performing Arts
(Based on Spotify playlist Classical
New Releases playlist):
JESS GILLM
ANDREA BOCELLI
LAMBERT
LUDWIG VAN BEETHOVEN
PHORIA
NOTABLE NAMES 2020
ALIAS CHAMBER ENSEMBLE
147 monthly Spotify listeners
Top Spotify Streamed City: Nashville
300 Instagram followers
THE NASHVILLE SYMPHONY ORCHESTRA
38,780 monthly Spotify listeners
Top Spotify Streamed City: Sao Paolo
23K Instagram followers
CRISTINA SPINEI
3,278 monthly Spotify listeners
Top Spotify Streamed City: Sydney
2K Instagram followers
NOTABLE NASHVILLE NAMES
Find classical music on radio stations like 91.1 FM WXNP Nashville Classical Radio. Find classical music being brought to
the masses by groups like Mozart in Nashville and their Nashville Concerto Orchestra.
Alan Valentine, President and CEO of the Nashville Symphony shares how deeply COVID-19 has impacted the symphony:

111
“Symphony orchestras operate with very high xed costs… Salaries, wages and benets represent
approximately 50% (or about $14 million annually) of our total operating budget, while earned revenues from
ticket sales and other program activities make up approximately 67% (or $16 million annually) of our operating
revenues. All of our earned revenues have dropped to $0, making it impossible to maintain our payroll, let
alone cover concert production costs.
Like all not-for-prot organizations, we struggle each year just to balance our budget – there is no “prot”
margin simply to be reduced when revenues dry up. Instead, what gets affected is our ability to deliver on our
mission. Last season, we lost $8.6 million in revenue between March 12 and July 31, the end of our scal year,
resulting in a $5 million operating loss for the year. This scal year, we will lose $16 million in revenue, but we
expect to balance our budget because we have furloughed all but 20 of our workforce of 156 full-time and
300 part-time employees. We are entirely dependent on contributed revenue—largely in the form of generous
donations from our community—to fund our drastically reduced operations.
Without the ability to utilize the full capacity of our concert hall, it is extremely challenging for us to deliver
any type of sustainable concert activity. Socially distanced audiences would limit our hall’s capacity to 500
seats, which does not allow us to generate enough revenue to cover our payroll and production costs, even
with reduced salaries. Producing virtual content does not work either, as it would yield only a tiny fraction of
the revenue required to sustain the orchestra.
We have successfully navigated many challenges—the 2008 Great Recession and the 2010 Nashville Flood
among them—but this crisis is different, because it prevents us from doing the very thing we have been
chartered to do, and the future is lled with uncertainty. The pandemic has created an existential crisis for the
performing arts in America, and its impact will be felt for years.”
“Nashville is Music City, and that applies to the classical genre as well. Our community is home to a number
of classical ensembles, soloists and composers – and what many people may not realize is that a number of
remarkable classical artists have been living and working in Nashville for decades. We have one of world’s
great orchestras here in Nashville, performing and recording in one of the great concert halls of the world.
It is a treasure that has taken decades and generous, sustained community support to build. This GRAMMY-
winning orchestra is a proud part of the larger musical community that is Music City, and it does its part
to contribute to that brand through its extraordinary focus on the creation, performance, promotion and
preservation of a uniquely American repertoire. Keeping the orchestra and our entire vibrant and innovative
classical music community in Nashville healthy through this challenging time will require the kind of
extraordinary resilience, creativity and community support that we have demonstrated time and again when
faced with seemingly insurmountable challenges.”
While this paints a dire picture, Valentine goes on to share hope for the future in explaining what he
would have the world know about classical music in Nashville.
Alan Valentine, President and CEO of the Nashville Symphony

112
COUNTRY
FANS SURVEYED IN THE MUSIC CONSUMERS SURVEY
42% of people list this genre as one of their favorites to listen to
35% of people list this genre as one of their favorites to experience live
The top way that people who listen to the Country genre consume music is via Spotify, at 52% of
the category, with Radio and CD’s as a close second and third
68% of Country fans have bought music related merch in the past year
Country fans have attended four livestream concerts on average since March
28% of Country fans paid for livestreams or virtual performances
48% of Country fans participated in crowd funding or donated to any other sources of
supplementary income for artists during COVID-19
MUSIC CREATORS SURVEYED IN THE SURVEY TO THE MUSIC INDUSTRY
55% of music creators indicated that this was one of their primary music genres
4% of Country music creators report they are making more music since the onset of COVID and
88% report they are making less
Country music creators list the top three results of COVID as follows:
Loss of scheduled gigs, studio work, or residency: 90%
Loss of Revenue, employment, or benets: 84%
Cancelled or postponed their tour: 44%
30% of Country music creators have participated in a livestream concert for compensation, and
40% for no compensation since March
61% of Country music creators have recorded music in a studio within the last six months
27% of Country music creators have released music in the last six months
14% of Country music creators are signed to a record label
22% of Country music creators are signed to a music publisher
84% of Country music creators consider themselves to be an independent artist or songwriter
48% of Country music creators have more than one job
18% of Country music creators do not have health insurance
43% of Country music creators are part of a union

113
Nashville is the home of country music. Music Row is lled with publishing companies ying huge banners
congratulating their writers and artists for chart topping songs. These country artists and labels have had to
cancel music festivals and tours, lay off band members, lighting and sound technicians and move the writing
room to Zoom.
Regarding Nashville’s powerhouse genre, it’s important to consider diversity. Regarding gender diversity,
female songwriters in country music are relatively underrepresented. A study at USC Annenberg found
that “Overall, 12% of all writers were women across 200 songs. Just over one tenth of the songwriters
were women in 2014, 11%, and 13% in 2018. These ndings are consistent with the percentage of female
writers (14%) across the top 500 songs on the Hot 100 Billboard Popular Year End Charts from 2014 and
2018.” More inclusion of female writers in country music is a hope for the future and is being advanced by
organizations like Be a Highway Woman, Song Suffragettes, and WOMAN Nashville.
GENRE CULTURE
Country songwriting sessions typically start on an acoustic guitar in a room of two or three. After writing and
recording an acoustic demo, the song is further demoed by a producer and a band or studio musicians in
studio. From there it’s turned over to the publisher who pitches the song.
COUNTRY WRITING CULTURE
(Based on Chartmetrics Nashville Country Charts based on radio airplay October 29, 2020):
SAM HUNT
LUKE COMBS
GABBY BARRETT
JAMESON RODGES
MATT STELL
NOTABLE NAMES 2020
79

GABBY BARRETT:
4,141,980 monthly Spotify listeners
Top Spotify Streamed City: Chicago
645K Instagram followers
CAM
1,343,045 monthly Spotify listeners
Top Spotify Streamed City: Chicago
263K Instagram followers
SAM HUNT
6,640,920 monthly Spotify listeners
Top Spotify Streamed City: Chicago
2.4M Instagram followers
MAREN MORRIS
14,210,641 monthly Spotify listeners
Top Spotify Streamed City: Chicago
1.5M Instagram followers
WAYLON PAYNE
78,452 monthly Spotify listeners
Top Spotify Streamed City: Dallas
6K Instagram followers
NOTABLE NASHVILLE NAMES
MARGO PRICE
225,290 monthly Spotify listeners
Top Spotify Streamed City: Chicago
156K Instagram followers
CARRIE UNDERWOOD
5,655,121 monthly Spotify listeners
Top Spotify Streamed City: Chicago
9.9M Instagram followers
KEITH URBAN
8,021,396 monthly Spotify listeners
Top Spotify Streamed City: Sydney
2.5M Instagram followers
HAILEY WHITTERS
149,908 monthly Spotify listeners
Top Spotify Streamed City: Dallas
25K Instagram followers
JAIME WYATT
38,231 monthly Spotify listeners
Top Spotify Streamed City: Dallas
21K Instagram followers
114
“Our royalties will be affected by this. Because restaurants aren’t open and haven’t been open
as much, and hotels. Those licenses they pay to BMI, ASCAP and SESAC—some of that money
goes toward our royalties, so we won’t have that. There will be a dip I think we will notice. On
the ipside of that, I think people are consuming more music. I sat in on an NMPA (National
Music Publishers Association) meeting and a guy at Nielsen said the most increased genre for
streaming was Country.”
Jenn Schott, Songwriter

A huge number of powerhouse associations, businesses, radio stations, and names are associated with
country music in Nashville. Notably, WSM Radio 650 AM broadcasts Grand Ole Opry Radio. The Country
Music Association is headquartered in Nashville, with CMA Fest being one of the largest annual events
regularly hosted in the city (nd more information here). RCA Nashville is a studio that has played host to the
likes of Willie Nelson and Waylon Jennings. Country Music Television has their headquarters in downtown
Nashville. It is easy to nd country musicians playing in famed locations on Broadway like Robert’s Western
World, and it’s just as easy to nd them playing at regular events such as Honky-Tonk Tuesday Nights at the
American Legion Post 82. As Nashville is the “country music capital,” this list goes on.
115
“For most musicians that regularly perform on Nashville’s famed Broadway, it seems their main
source of income is performing on Broadway or touring. As Broadway musician SJ McDonald
sees it, “A lot of musicians got into real estate over the past year to make ends meet. Before
the pandemic, playing on Broadway was my sole source of income. Having that wipe out
overnight is a crazy thing, and to make ends meet while I stay away from the bars, I’ve started
babysitting on the side.
COVID has stopped all of my gigs on Broadway for the foreseeable future. Personally, since
people are traveling from all over the U.S. to come to Nashville and the bars on Broadway, I
haven’t felt comfortable enough to go back yet. Many are in the same boat as me, but some
are starting to play downtown again, because the bars are taking the right precautions and
doing everything right. The issue is, the people that come from out of town may or may not
follow the right guidelines to keep everyone [crowd, bar staff, and musicians] safe. I know
quite a few people who have moved out of Nashville, possibly for good, over this pandemic. It
breaks my heart.”
SJ McDonald, Broadway Musician/Artist/Songwriter
EDM/ELECTRONIC
FANS SURVEYED IN THE MUSIC CONSUMERS SURVEY
11% of people list this genre as one of their favorites to listen to
9% of people list this genre as one of their favorites to experience live
The top way that people who listen to the EDM/Electronic genre consume music is via Spotify, at
75% of the category
82% of EDM/Electronic fans have bought music related merch in the past year
EDM/Electronic fans have attended ve livestream concerts on average since March
16% of EDM/Electronic fans paid for livestreams or virtual performances
50% of EDM/Electronic fans participated in crowd funding or donated to any other sources of
supplementary income for artists during COVID-19
MUSIC CREATORS SURVEYED IN THE SURVEY TO THE MUSIC INDUSTRY
5% of music creators indicated that this was one of their primary music genres
25% of EDM/Electronic music creators report they are making more music since the onset of
COVID and 50% report they are making less
EDM/Electronic music creators list the top three results of COVID as follows:
Loss of scheduled gigs, studio work, or residency: 86%
Loss of Revenue, employment, or benets: 83%
Purchased new gear, audio equipment, and/or musical instruments: 34%
13% of EDM/Electronic music creators have participated in a livestream concert for compensation,
and 40% for no compensation since March
75% of EDM/Electronic music creators have recorded music in a studio within the last six months
55% of EDM/Electronic music creators have released music in the last six months
38% of EDM/Electronic recording artists/vocalists are signed to a record label
35% of EDM/Electronic recording artists or vocalists are signed to a music publisher
88% of EDM/Electronic music creators consider themselves to be an independent artist or songwriter
39% of EDM/Electronic music creators have more than one job
20% of EDM/Electronic music creators do not have health insurance
14% of EDM/Electronic music creators are part of a union
116

EDM and Electronic fans and musicians live for raves and music festivals. While large shows were canceled,
online raves in virtual reality as well as DJ live streams have been a way for these musicians to pivot. Their
music already requires so much technology that their ability to shift gears might be easier than those in other
genres; however, live streaming equipment can be expensive. Other genres have had online concerts (Soccer
Mommy on Club Penguin and Travis Scott in Fortnite, e.g.), but Rave-a-thons and virtual raves seem to shine
most in the electronic genre.
GENRE CULTURE
(From the Spotify mint playlist):
MARSHMELLO
LUCKY DAYE
MARTIN GARRIXAJOR LAZER
IMANBEK
KYGO
ZEDD
SG LEWIS
DAVID GUETTA
NOTABLE NAMES 2020
FINDERZ KEEPERZ:
16,081 monthly Spotify listeners
Top Spotify Streamed City: Los Angeles
9K Instagram followers
PROTOHYPE
93,564 monthly Spotify listeners
Top Spotify Streamed City: Chicago
181K Instagram followers
WICK-IT THE INSTAGATOR
1,405 monthly Spotify listeners
Top Spotify Streamed City: Denver
8K Instagram followers
NOTABLE NASHVILLE NAMES
Find EDM musicians playing at the Cowan and other venues around town. Deep Tropics, a relatively new
music festival hosted in downtown Nashville, features a lineup heavy with EDM and House DJs. Dubaween
is an annual Halloween party, this year featured as a drive-in, thrown by local event group Sacred Hive.
Additionally, one can nd DJs spinning along the Buffalo River at the annual Sparkle City River Dance event.
“Two years ago, I started teaching professionally and mainly the reason was, I mean even
before COVID being a touring DJ is really hard. Staying relevant and being a popular artist and
all this stuff. And so as I get older, I was just looking for something to kind of supplement my
income and so I didn’t have to say yes to every single show. It’s a lot of politics. Do you have
the best agent? The best manager? Are you on the best team with the best supporting artists?
There’s only a few of those, you know, and the show’s gotta crush and promoters are out to
get the money so they’re only going to book the biggest guys.”
Max Pote – Producer, “Protohype;” Founder, Underdog Records
117
80

118
FOLK/AMERICANA
FANS SURVEYED IN THE MUSIC CONSUMERS SURVEY
40% of people list this genre as one of their favorites to listen to
28% of people list this genre as one of their favorites to experience live
The top way that people who listen to the Folk/American genre consume music is via Spotify, at
59% of the category
75% % of Folk/Americana fans have bought music related merch in the past year
Folk/Americana fans have attended eight livestream concerts on average since March
37% of Folk/Americana fans paid for livestreams or virtual performances
56% of Folk/Americana fans participated in crowd funding or donated to any other sources of
supplementary income for artists during COVID-19
MUSIC CREATORS SURVEYED IN THE SURVEY TO THE MUSIC INDUSTRY
32% of music creators indicated that this was one of their primary music genres
10% of Folk/Americana music creators report they are making more music since the onset of
COVID, and 79% report they are making less
Folk/Americana music creators list the top three results of COVID as follows:
Loss of scheduled gigs, studio work, or residency: 90%
Loss of Revenue, employment, or benets: 83%
Cancelled or postponed their tour: 52%
33% of Folk/Americana music creators have participated in a livestream concert for compensation,
and 46% for no compensation since March
68% of Folk/Americana music creators have recorded music in a studio within the last six months
32% of Folk/Americana music creators have released music in the last six months
16% of Folk/Americana music creators are signed to a record label
26% of Folk/Americana music creators are signed to a music publisher
85% of Folk/Americana music creators consider themselves to be an independent artist or songwriter
55% of Folk/Americana music creators have more than one job
12% of Folk/Americana music creators do not have health insurance
40% of Folk/Americana music creators are part of a union

Folk music relies heavily on touring and summits like AMERICANAFEST and Folk Alliance for getting artists
exposure and business. Huge festivals such as Grey Fox Bluegrass Festival went online this year or were
completely canceled. The genres within this category thrive in a culture lled with live performance; acoustic
instruments and a crowd nodding along to a jam session.
GENRE CULTURE
2020 (From the Spotify 2020 Americana Music Honors & Awards Playlist)
NATHANIEL RATELIFF
THE HIGHWOMEN
BRITTANY HOWARD
TYLER CHILDERS
JOHN PRINE
NOTABLE NAMES 2020
KYSHONA ARMSTRONG
3,808 monthly Spotify listeners
Top Spotify Streamed City: Atlanta
5K Instagram followers
RHIANNON GIDDENS
620,627 monthly Spotify listeners
Top Spotify Streamed City: Sydney
63K Instagram followers
LILLY HIATT
56,747 monthly Spotify listeners
Top Spotify Streamed City: Chicago
20K Instagram followers
ERIN RAE
83,311 monthly Spotify listeners
Top Spotify Streamed City: Chicago
15K Instagram followers
NOTABLE NASHVILLE NAMES
KATIE PRUITT
431,883 monthly Spotify listeners
Top Spotify Streamed City: Chicago
26K Instagram followers
MOLLY TUTTLE
474,897 monthly Spotify listeners
Top Spotify Streamed City: Chicago
56K Instagram followers
ADIA VICTORIA
107,805 monthly Spotify listeners
Top Spotify Streamed City: Chicago
15K Instagram followers
YOLA
870,834 monthly Spotify listeners
Top Spotify Streamed City: Sydney
60K Instagram followers
BILLY STRINGS
KATIE PRUITT
YOLA
BRANDI CARLILE
119
81

120
Well-known artist and local staple John Prine tragically passed away from COVID-19 complications in April of
2020. He could be described as an Americana artist, a country artis and a prominent singer-songwriter. John
Prine’s posthumous release “I Remember Everything” is his last.
Find artists such as Michael Franti & Spearhead, Lucinda Williams and Jason Isbell signed to local
management and promotion company Thirty Tigers. Folk, Americana and Indie Rock label Dualtone Records
is home to names like Amos Lee, The Lone Bellow and the Lumineers. Label New West Records is home to
names like Guy Clark, Steve Earle and The Secret Sisters. Finally, Rounder Records boasts names Bela Fleck,
Dawes and Sarah Jarosz.
The Americana Music Association, based out of Nashville, works tirelessly to promote the genre by “hosting
the annual Americana Music Festival & Conference (AMERICANAFEST), publish the weekly Americana
Airplay Chart, produce the annual Americana Music Honors and Awards show, participate in other industry
events and conferences, produce member newsletters and marketing materials, conduct research about our
industry and consumers, work to increase Americana’s prole at retail and serve as an advocate on behalf of
Americana’s interests. Find a discussion of the Festival and Conference’s economic impact in the previous
section on the economic impact of large events.
Scott Mulvahill, Folk/Americana artist, on starting a Patreon, an online membership platform that allows
creators to run a subscription service, to supplement his income and continue making music:
“I hope that means there is a relationship with fans that’s been built up and it’s strong enough
to where they’re like ‘oh we see the need,’ you know, ‘if Scott’s going to continue making
music we have to chip in and make it happen.’”
“I manage mostly artists in the Folk/ Americana space and they tend to not be particularly
technologically savvy or love social media. I don’t think any of my artists had live-streamed—
maybe one had done a livestream ever before this- and so I think the beauty of what’s coming
from it for these artists is that they’ve been kind of forced to embrace technology to connect
with fans. Some of my artists have developed new skills: they know how to lm themselves
and they know how to livestream which has been really great.
I think the exciting thing for me is when touring starts to come back hopefully the live stream
income and the Patreon and the things we’ve done to get creative about income will stay so
we will have created additional revenue streams during this time.”
Erin O. Anderson, Founder & CEO, Olivia Management
81

121
HIP-HOP AND RAP
FANS SURVEYED IN THE MUSIC CONSUMERS SURVEY
34% of people list this genre as one of their favorites to listen to
21% of people list this genre as one of their favorites to experience live
The top way that people who listen to the Hip-Hop and Rap genre consume music is via Spotify, at
74% of the category
66% Hip-Hop and Rap fans have bought music related merch in the past year
Hip-Hop and Rap fans have attended four livestream concerts on average since March
24% of Hip-Hop and Rap fans paid for livestreams or virtual performances
44% of Hip-Hop and Rap fans participated in crowd funding or donated to any other sources of
supplementary income for artists during COVID-19
MUSIC CREATORS SURVEYED IN THE SURVEY TO THE MUSIC INDUSTRY
15% of music creators indicated that this was one of their primary music genres
32% of Hip-Hop and Rap music creators report they are making more music since the onset of
COVID and 42% report they are making less
Hip-Hop and Rap music creators list the top three results of COVID as follows:
Loss of scheduled gigs, studio work, or residency: 68%
Loss of Revenue, employment, or benets: 58%
Purchased new gear, audio equipment, and/or musical instruments: 42%
25% of Hip-Hop and Rap music creators have participated in a livestream concert for
compensation and 29% for no compensation since March
70% of Hip-Hop and Rap music creators have recorded music in a studio within the last six months
61% of Hip-Hop and Rap music creators have released music in the last six months
24% of Hip-Hop and Rap music creators are signed to a record label
45% of Hip-Hop and Rap music creators are signed to a music publisher
77% of Hip-Hop and Rap music creators consider themselves to be an independent artist or
42% of Hip-Hop and Rap music creators have more than one job
15% of Hip-Hop and Rap music creators do not have health insurance
14% of Hip-Hop and Rap music creators are part of a union

122
Hip-Hop and Rap are genres on the rise in Nashville. Venues like DRKMTTR, The Beatlist’s Beat Battle events
and Brown Bag Fest are among the list of those fostering hip-hop and rap in the Nashville live music scene.
Find record producer and businessman, Jim Jonsin, championing work with names like Beyoncé, Usher and
Lil Wayne relocating to Nashville in 2017. Find local hip-hop artist Chuck iNDigo working as one of many
producers and artists running Third Eye & Co., an independent record label. The blog 2L’s On A Cloud serves
to list hip hop events, artists and otherwise related news in Nashville as well. COVID-19 has impacted the
hip-hop/rap community in several ways. Streaming is up, more and more songs are trending on TikTok, but
smaller venues are closing and large writing sessions are no longer safe.
GENRE CULTURE
Modern rap and hip-hop typically starts with a loop or a sample from another song or a sample library like
Splice. Writing sessions can consist of any number of co-writers from two to eight. There is an importance to
being in the room while writing a song, as Daisha McBride says:
HIP-HOP AND RAP SONGWRITING CULTURE
From Chartmetrics Nashville Top Hip Hop Songs by Local Airplay October 29, 2020:
JAWSH 685
JASON DERULO
DRAKE
LIL DURK
RODDY RICH
MUSTARD
JACK HARLOW
CARDI B.
MEGAN THEE STALLION
NOTABLE NAMES 2020
“At rst I tried recording with a big group, but it’s just not it. Zoom can be really laggy.
Especially if one person is playing something and it might echo and someone’s dog might be
barking and it’s just too much. Now I just work with my producer and one other person and
it’s a lot more manageable…. It’s not the same either. Writing music is so vibey and personal.
You’re bouncing off other people’s vibes. Sometimes over a screen it’s hard to get those same
vibes. So, rather than force it, I’m just good on not doing the big group writes for now.”

123
BRIAN BROWN
7,734 monthly Spotify listeners
Top Spotify Streamed City: Atlanta
5K Instagram followers
YOUNG BUCK
892,503 monthly Spotify listeners
Top Spotify Streamed City: Chicago
708K Instagram followers
TIM GENT
8,413 monthly Spotify listeners
Top Spotify Streamed City: Chicago
18K Instagram followers
CHUCK INDIGO
1,725 monthly Spotify listeners
Top Spotify Streamed City: Nashville
3K Instagram followers
NOTABLE NASHVILLE NAMES
LACKHONEY
28,166 monthly Spotify listeners
Top Spotify Streamed City: Los Angeles
2K Instagram followers
DAISHA MCBRIDE
25,619 monthly Spotify listeners
Top Spotify Streamed City: Chicago
31K Instagram followers
JELLY ROLL
1,462,291 monthly Spotify listeners
Top Spotify Streamed City: Chicago
511K Instagram followers
“I do music videos pretty frequently. Typically, in hip-hop videos there’s normally a lot of
people. A whole bunch of people getting hype somewhere. So, I think that element could be
a little different. Because friends in other genres—you can just put a guy in a eld somewhere,
it’s not as big of a group. I lmed a music video for one of my songs at the very beginning of
quarantine and it was denitely risky. Everyone had to get tested and we were super OCD
about it, but I don’t think I’ve seen a lot of hip-hop artists putting out visuals right now because
with the style of our genre and our visuals it’s hard when you can’t be around people.”
Daisha McBride, “The Rap Girl”
“I think for the rst time a lot of the other genres are now feeling what hip hop and rap has
for years which is limited resources. A lot of artists in the hip hop and rap genre are prevailing.
They’re starting to elevate their craft in various different ways, because we’re almost used to
this format of things as far as limited resources and having to create with a grassroots push.
Yes, we are affected in a lot of different ways. However, I think because, country genres and
rock genres were used to going into spaces like Broadway bars, The Ryman, Bridgestone
Arena, etc. and sell out shows, they are having to push in other ways without depending
solely on live events. Whereas, we have always had limited resources where we can barely get
booked for 500-1000 capacity spaces. So now the playing eld has evened out a bit and hip
hop and rap are and will continue to thrive. Pushing without huge marketing tools, growing an
organic fan base and getting creative with bookings and live events shows how creative the
hip hop has to be. So, it’s nothing new. Now the focus is getting more creative and pushing
digitally to continue to grow.”
D’Llisha Davis, Creator and Editor, 2L’s on a Cloud
JAZZ
FANS SURVEYED IN THE MUSIC CONSUMERS SURVEY
23% of people list this genre as one of their favorites to listen to
22% of people list this genre as one of their favorites to experience live
The top way that people who listen to the Jazz genre consume music is via Spotify, at 57% of the
category
76% of Jazz fans have bought music related merch in the past year
Jazz fans have attended ve livestream concerts on average since March
36% of Jazz fans paid for livestreams or virtual performances
48% of Jazz fans participated in crowd funding or donated to any other sources of supplementary
income for artists during COVID-19
MUSIC CREATORS SURVEYED IN THE SURVEY TO THE MUSIC INDUSTRY
19% of music creators indicated that this was one of their primary music genres
10% of Jazz music creators report they are making more music since the onset of COVID, and
78% report they are making less
Jazz music creators list the top three results of COVID as follows:
Loss of scheduled gigs, studio work, or residency: 92%
Loss of Revenue, employment, or benets: 83%
Purchased new gear, audio equipment and/or musical instruments: 40%
21% of Jazz music creators have participated in a livestream concert for compensation and 37%
for no compensation since March
65% of Jazz music creators have recorded music in a studio within the last six months
29% of Jazz music creators have released music in the last six months
23% of Jazz recording artists/vocalists are signed to a record label
35% of Jazz recording artists or vocalists are signed to a music publisher
78% of Jazz music creators consider themselves to be an independent artist or songwriter
44% of Jazz music creators have more than one job
11% of Jazz music creators do not have health insurance
56% of Jazz music creators are part of a union
124

Much like folk music, jazz is all about the jam session. Jazz is most often experienced in a live setting, be it the
house band at a resort or local coffee shop or be it your favorite ensemble playing at your local theatre. Jazz
musicians are often college educated or have formal music training leading to an in-depth knowledge of music
theory and an adept ability to improvise. 2020 has seen jazz seeping into mainstream pop and hip hop such as
Billie Eilish’s latest single “My Future” as well as in common “study playlists” and lo- playlists where jazz music
is put through a lo- lter and remixed, like in the notable playlist/YouTube stream “lo- hip hop radio - beats to
relax/study to” by Chilled Cow.
Nashville based Jazz Club Rudy’s had to shut down live performances opting for live streams instead. Their website
states, “Because of COVID-19 and city mandates restricting the use of our space such that we cannot currently
operate we must rely on public assistance and generosity to get through these times. We ask, if you have
the means, value what Rudy’s brings to your life and would like to support the continuation of what we do by
bringing live jazz to Nashville and nurturing the live creative process in an intimate setting, that you consider
donating what you can and feel comfortable with to our cause, no matter how small it may be.”
GENRE CULTURE
(From the Spotify mint playlist):
SNARKY PUPPY
JORJA SMITH
DERRICK HODGE
JOSH JOHNSON
NUBYA GARCIA
BLACK NILE
NOTABLE NAMES 2020
JEFF COFFIN
1,484 monthly Spotify listeners
Top Spotify Streamed City: Chicago
50K Instagram followers
KEITH CARLOCK
268 monthly Spotify listeners
Top Spotify Streamed City: Newcastle
181K Instagram followers
WENDY MOTEN
28,228 monthly Spotify listeners
Top Spotify Streamed City: Quezon City
14K Instagram followers
NASHVILLE JAZZ WORKSHOP
2K Instagram followers
VICTOR WOOTEN
141,743 monthly Spotify listeners
Top Spotify Streamed City: Santiago
21K Instagram followers
NOTABLE NASHVILLE NAMES
The Nashville Jazz Workshop provides jazz education and a workshop environment for professionals, as well
as performances to promote community appreciation of jazz. Like many other organizations, they have been
offering much of their programming online during the pandemic.
125
83, 84
85

126
LATIN
FANS SURVEYED IN THE MUSIC CONSUMERS SURVEY
9% of people list this genre as one of their favorites to listen to
8% of people list this genre as one of their favorites to experience live
The top way that people who listen to the Latin genre consume music is via Spotify, at 72% of the
category
67% Latin fans have bought music related merch in the past year
Latin fans have attended four livestream concerts on average since March
35% of Latin fans paid for livestreams or virtual performances
51% of Latin fans participated in crowd funding or donated to any other sources of supplementary
income for artists during COVID-19
MUSIC CREATORS SURVEYED IN THE SURVEY TO THE MUSIC INDUSTRY
5% of music creators indicated that this was one of their primary music genres
24% of Latin music creators report they are making more music since the onset of COVID and
68% report they are making less
Latin music creators list the top three results of COVID as follows:
Loss of scheduled gigs, studio work, or residency: 79%
Loss of Revenue, employment, or benets: 64%
Purchased new gear, audio equipment, and/or musical instruments: 40%
18% of Latin music creators have participated in a livestream concert for compensation and 24%
for no compensation since March
70% of Latin music creators have recorded music in a studio within the last six months
73% of Latin music creators have released music in the last six months
38% of Latin music creators are signed to a record label
22% of Latin music creators are signed to a music publisher
37% of Latin music creators consider themselves to be an independent artist or songwriter
42% of Latin music creators have more than one job
16% of Latin music creators do not have health insurance
52% of Latin music creators are part of a union

127
Miami is the biggest hub for Latin Music in the United States. However, there is a small and growing Latin
music scene in the Nashville community. According to Latin artist and songwriter Alejandro Sierra, “COVID
has shut down most live performances. Latin American music thrives with live shows, because our culture
is colorful and dance oriented! Latin artists strive to play at parties and large social gatherings. Without
this, the music doesn’t connect the same way. Genres like Reggaeton and Salsa are meant to be played at
big celebrations and packed clubs.” Not to mention while some tness classes have moved online such
as Zumba and dance, the cancelation of tness classes and dance classes and the closing of dance clubs
that often play Latin music has removed more outlets for Latin music. The Latin Music Scene in Nashville is
growing with venues like Plaza Mariachi and Rudy’s Jazz Room, which has a Latin music night.
GENRE CULTURE
(Based on Spotify playlist Latin Hit Mix):
BAD BUNNY
JESSE & JOY
PALOMA MAMI
CAMILO
SOFIA REYES
J BALVIN
CARLOS VIVES
NOTABLE NAMES 2020
12 MANOS
2K Instagram followers
APRENDIZ
73K Instagram followers
IGNACIO AROCENA
28,918 monthly Spotify listeners
Top Spotify Streamed City: Santiago
6K Instagram followers
ALEJANDRO SIERRA
1,441 monthly Spotify listeners
Top Spotify Streamed City: Quito
1K Instagram followers
NOTABLE NASHVILLE NAMES
Speaking about Latin music, but elaborating on a dynamic sure to affect artists across genres:
“The smart artists who know how to handle their money are the ones who are going to survive.
The ones that don’t plan and budget their money, ask for advances and spend it, and don’t
collect any royalties…these are the ones who are going to suffer right now.”
Amelia Cueva, CEO of A&I Music Entertainment
Analog at the Hutton Hotel - Intimo
Brugada Bar and Lounge
Bucanas Night Club
Hard Rock Cafe-Monthly Latin Night
Ibiza Night Club
NASHVILLE VENUES OR EVENTS
La Rumba Discotque
Plaza Mariachi
Rudy’s Jazz Room Latin Night
Salsa
86

128
MUSICAL THEATRE
One area the report did not want to overlook but did not formally survey is the musical theatre genre.
The musical theatre community and theatre in general have had to stop live performance opting for
Zoom musicals and repeatedly watching the Disney Plus recorded version of Hamilton to get their
theatre x in quarantine.
GENRE CULTURE
Speaking to the struggles theatre musicians and performers are experiencing:
“A huge thing is not being able to take dance classes, so you’re losing muscle tone, unless you
live in an apartment or house big enough to dance in. The theatre union (Actor’s Equity) makes
it so hard to join, so there are countless people out there without any kind of protection or
benets. And even the Equity folks are still not getting a lot of help. Theatre will denitely be
the last industry to come back; so many people are leaving the business or moving away for a
long time….It’s easier for orchestras to create virtual solutions but the whole point of theatre
is to see it live. Also, TV/Film can use camera angles to make people seem closer together, but
not in theatre.”
Gabriella Green – Actor, Musician, Assistant Producer,
Johnny Mercer Foundation Songwriters Project
LIN MANUEL MIRANDA
IDINA MENZEL
LESLIE ODOM JR.
BARETT WILBERT WEED
NOTABLE NAMES 2020
NASHVILLE REPERTORY THEATRE
2K Instagram followers
TENNESSEE PERFORMING ARTS CENTER
23K Instagram followers
NOTABLE NASHVILLE NAMES:
POP
FANS SURVEYED IN THE MUSIC CONSUMERS SURVEY
48% of people list this genre as one of their favorites to listen to
35% of people list this genre as one of their favorites to experience live
The top way that people who listen to the Pop genre consume music is via Spotify, at 57% of the
category
67% of Pop fans have bought music related merch in the past year
Pop fans have attended three livestream concerts on average since March
22% of Pop fans paid for livestreams or virtual performances
42% of Pop fans participated in crowd funding or donated to any other sources of supplementary
income for artists during COVID-19
MUSIC CREATORS SURVEYED IN THE SURVEY TO THE MUSIC INDUSTRY
43% of music creators indicated that this was one of their primary music genres
15% of Pop music creators report they are making more music since the onset of COVID and 69%
report they are making less
Pop music creators list the top three results of COVID as follows:
Loss of scheduled gigs, studio work, or residency: 80%
Loss of Revenue, employment, or benets: 78%
Cancelled or postponed my tour: 37%
21% of Pop music creators have participated in a livestream concert for compensation and 36%
for no compensation since March
64% of Pop music creators have recorded music in a studio within the last six months
40% of Pop music creators have released music in the last six months
16% of Pop recording artists/vocalists are signed to a record label
27% of Pop recording artists or vocalists are signed to a music publisher
78% of Pop music creators consider themselves to be an independent artist or songwriter
45% of Pop music creators have more than one job
13% of Pop music creators do not have health insurance
37% of Pop music creators are part of a union
129

Pop music made up 20.1% of total music album consumption in the United States in 2018, by genre. Pop music’s
home is typically considered Los Angeles; however, Nashville is growing its pop music scene through organizations
like TONS and Alta Dena, as well as Doctor Luke’s publishing company Prescription Songs, which established a
Nashville ofce in 2017.
Because many pop writing sessions involve writing to a produced track in a digital audio workstation, the use of
Zoom calls and other video conferencing in which audio sharing is possible has become the norm for quarantine
co-writing. Some writers nd the ability to control the same computer helpful to the writing process. Others
struggle with technical difculties. 32.6% of music creators say the transition to remote work has decreased their
working prociency on a day-to-day basis; 35.1% say it increased or maintained their efciency.
GENRE CULTURE
Pop writing sessions can take many forms but often they involve a “producer-writer” and a top liner or two who
write lyrics over the track the producer is creating. Some writers are involved with every aspect of the song whereas
some stick to a specic role (lyrics, melody, production, etc.) Typically, a demo with a scratch vocal is the end
product of a pop session.
POP WRITING CULTURE
(From Chartmetrics Nashville Top Pop Songs by Local Airplay October 29, 2020)
HARRY STYLES
DABABY
JP SAXE
NOTABLE NAMES 2020
JULIA MICHAELS
SURF MESA
EMILEE
NIGHTLY
1,250,495 monthly Spotify listeners
Top Spotify Streamed City: Chicago
30K Instagram followers
RYAN FINE
11,915 monthly Spotify listeners
Top Spotify Streamed City: Sydney
181K Instagram followers
TRISTEN GASPADAREK
41,998 monthly Spotify listeners
Top Spotify Streamed City: Chicago
6K Instagram followers
NOTABLE NASHVILLE NAMES
R.LUM.R
184,940 monthly Spotify listeners
Top Spotify Streamed City: Los Angeles
22K Instagram followers
LENNON STELLA
11,517,234 monthly Spotify listeners
Top Spotify Streamed City: Sydney
925K Instagram followers
130
87

Find the pop scene being enriched by Claude Kelly, a producer who has worked with the likes of Michael
Jackson, Ariana Grande and Bruno Mars. Alongside Chuck Harmony (together Louis York), Kelly started the
“Weirdo Workshop” record label and artist collective in 2015.
The scene also boasts writer Amy Wadge, who has worked with names like Ed Sheeran, Camila Cabello and
Alicia Keys. Additionally, Dan Wilson contributes to this ecosystem and has collaborated with artists such as
Adele, Niall Horan, Halsey and P!nk.
Notable Nashville companies that are integral to fostering the pop scene include Atlantic Records and
Prescription Songs.
“Our writers across the board in both Nashville and LA are either taking this time to reset,
working solo or working remotely. About 20-25% are those working remotely and have either
grown to adapt to our current state or have really thrived in this environment. But some people
just haven’t been able to get into a groove, which is ok. Some people don’t like working by
themselves and some people thrive off of collaboration, which is obviously what my job is day
in and day out, so I have just been trying to encourage all the writers to do whatever is best for
them mentally. I will say, what has been really fruitful on our end, is this time has introduced us
to so many different people around the world, and because the entire world is going through
this, we have had more calls internationally than we ever have. Everyone is just trying their best
to be as productive as possible. We’ve gotten to actually meet more people face to face (on
camera) which I think has reminded all of us that pandemic or not, we can work together quite a
bit virtually. It has opened a door for us that has really been there the whole time and now we can
take full advantage of it – I think that’s something we will be able to carry on post-pandemic.”
Katie Fagan – Head of A&R, Prescription Songs;
Co-Founder, The Other Nashville Society
“It’s way harder to meet people which makes each interaction more precious. I think it’s also really
opened us up to global writes! I’m not sure I’ve met a single writer who prefers Zoom, but the
fact that we’ve proven it to ourselves opens a lot of doors for the global community of pop to
interact in a different way.”
Deza, Pop Writer and Artist
131

132
PUNK, EMO, HARDCORE AND METAL
FANS SURVEYED IN THE MUSIC CONSUMERS SURVEY
25% of people list Punk, Emo & Hardcore as one of their favorites to listen to and 11% list Metal
20% of people list Punk, Emo & Hardcore as one of their favorites to experience live and 7% list Metal
The top way that people who listen to the Punk, Emo & Hardcore & Metal genre consume music is
via Spotify, at 68%
77% of Punk, Emo, Hardcore & Metal fans have bought music related merch in the past year
15% of Punk, Emo, Hardcore & Metal fans paid for livestreams or virtual performances
MUSIC CREATORS SURVEYED IN THE SURVEY TO THE MUSIC INDUSTRY
8% of music creators indicated that this was one of their primary music genres
14% of Punk, Emo & Hardcore & Metal music creators report they are making more music since
the onset of COVID and 42% report they are making less
Punk, Emo & Hardcore & Metal music creators list the top three results of COVID as follows:
Loss of scheduled gigs, studio work, or residency: 79%
Loss of Revenue, employment, or benets: 71%
Had to sell gear, equipment, or personal belongings: 56%
6% of Punk, Emo, Hardcore & Metal music creators have participated in a livestream concert for
compensation, and 26% for no compensation since March
35% of Punk, Emo, Hardcore & Metal music creators have recorded music in a studio within the
27% of Punk, Emo, Hardcore & Metal music creators have released music in the last six months
25% of Punk, Emo, Hardcore & Metal recording artists/vocalists are signed to a record label
29% of Punk, Emo, Hardcore & Metal recording artists or vocalists are signed to a music publisher
83% of Punk, Emo, Hardcore & Metal music creators consider themselves to be an independent artist
or songwriter
36% of Punk, Emo, Hardcore & Metal music creators have more than one job
36% of Punk, Emo, Hardcore & Metal music creators do not have health insurance
9% of Punk, Emo, Hardcore & Metal music creators are part of a union
Punk, Emo & Hardcore & Metal fans have attended three livestream concerts on average since March
55% of Punk, Emo, Hardcore & Metal fans participated in crowd funding or donated to any other
sources of supplementary income for artists during COVID-19

133
Although these are all sub-genres of rock, the world of each is distinct. Punk and hardcore shows take place
everywhere from suburban basements and independent venues to huge stages. This genre tends to “infuse
local talent with touring acts”, according to Talent Agent Ben Mench-Thurlow with APA. These shows are
more likely to be all-ages than many others. While not as high prole as some other genres, the underground
current is strong.
GENRE CULTURE
(From Spotify’s Pop Punk’s Not Dead
playlist and New Metal Tracks Playlist):
MAYDAY PARADE
TIGERS JAW
NECKDEEP
BRING ME THE HORIZON
NOTABLE NAMES 2020
BAYSIDE
422,343 monthly Spotify listeners,
Top Spotify Streamed City: Chicago,
50K Instagram followers
BULLY
96,918 monthly Spotify listeners,
Top Spotify Streamed City: Chicago,
39K Instagram followers
DASHBOARD CONFESSIONAL
1,323,432 monthly Spotify listeners,
Top Spotify Streamed City: Chicago,
106K Instagram followers
NEW FOUND GLORY
1,367,732 monthly Spotify listeners,
Top Spotify Streamed City: Chicago,
180K Instagram followers
SAVES THE DAY
211,191 monthly Spotify listeners,
Top Spotify Streamed City: Los Angeles,
33K Instagram followers
SHELL OF A SHELL
1,476 monthly Spotify listeners,
Top Spotify Streamed City: Chicago,
1K Instagram followers
NOTABLE NASHVILLE NAMES:

Find local and touring punk bands playing shows at DRKMTTR in East Nashville, Rocketown downtown and
Betty’s Grill in The Nations.
“The punk, hardcore and metal is ridiculously impressive in my opinion. There’s a lot of good
quality here. There may not be of quantity at all times, but the quality is always high and we
keep seeing it.”
Kathryn Edwards, Founder and Co-Owner, DRKMTTR
Local organization Nashville is the Reason, calls themselves “a group of friends in the music industry who
bring together fans of punk, emo and indie music for monthly parties, concerts and other events all over
Nashville.” They have been unable to host in person events since March. While they and other venues,
bands and organizations within the genre have pivoted to some online shows, they are advocating strongly
for change as they stated on Facebook September of 2020, “Congress must pass the updated HEROES
Act which includes giving America’s independent venues a ghting chance to survive. Doing so will help
#SaveOurStages, put millions back to work and uplift our communities!”
134
88, 89

135
ROCK
FANS SURVEYED IN THE MUSIC CONSUMERS SURVEY
51% of people list this genre as one of their favorites to listen to
46% of people list this genre as one of their favorites to experience live
The top way that people who listen to the Rock genre consume music is via Spotify, at 57% of the
category
74% of Rock fans have bought music related merch in the past year
Rock fans have attended four livestream concerts on average since March
27% of Rock fans paid for livestreams or virtual performances
50% of Rock fans participated in crowd funding or donated to any other sources of supplementary
income for artists during COVID-19
MUSIC CREATORS SURVEYED IN THE SURVEY TO THE MUSIC INDUSTRY
35% of music creators indicated that this was one of their primary music genres
8% of Rock music creators report they are making more music since the onset of COVID and 78%
report they are making less
Rock music creators list the top three results of COVID as follows:
Loss of scheduled gigs, studio work, or residency: 89%
Loss of Revenue, employment, or benets: 84%
Cancelled or postponed their tour: 45%
28% of Rock music creators have participated in a livestream concert for compensation and 37%
for no compensation since March
60% of Rock music creators have recorded music in a studio within the last six months
34% of Rock music creators have released music in the last six months
20% of Rock recording artists/vocalists are signed to a record label
23% of Rock recording artists or vocalists are signed to a music publisher
86% of Rock music creators consider themselves to be an independent artist or songwriter
58% of Rock music creators have more than one job
18% of Rock music creators do not have health insurance
32% of Rock music creators are part of a union

136
The Rock world of the music economy encompasses several sub-genres, from 80’s hair bands to emo bands
from the 2000s. These acts start in tiny clubs and work up to stadium shows with huge crowds.
In interviewing local Nashville artist Joni Lemons, lead singer of Lemon Drop, she spoke about missing live
shows and the “show that’s also a party” scene unique to many local rock bands. She also mentioned that
recording a full band is more of a challenge, saying:
GENRE CULTURE
(From Spotify playlist Rock This):
BRING ME THE HORIZON
YOU ME AT SIX
MACHINE GUN KELLY
YUNG BLUD
DEFTONES
OLIVER TREE
THE STRUTS
AC/DC
NOTABLE NAMES 2020
“There’s denitely pop music and EDM music that can be recorded in someone’s bedroom
easily, whereas [rock] music - most of the time you want a full drum set and you want like the
big guitar sounds and you want gang vocals and I wouldn’t feel comfortable gathering six
people around the microphone and screaming right now.”

137
KINGS OF LEON
10,382,016 monthly Spotify listeners
Top Spotify Streamed City: Mexico City
612K Instagram followers
THE BLACK KEYS
6,263,951 monthly Spotify listeners
Top Spotify Streamed City: Chicago
468K Instagram followers
THE BLAM BLAMS
1,127 monthly Spotify listeners
Top Spotify Streamed City: Los Angeles
2K Instagram followers
CAGE THE ELEPHANT
8,336,712 monthly Spotify listeners
Top Spotify Streamed City: Chicago
519K Instagram followers
BEN FOLDS
579,534 monthly Spotify listeners
Top Spotify Streamed City: Chicago
74K Instagram followers
NOTABLE NASHVILLE NAMES:
THE FOXIES
80,851 monthly Spotify listeners
Top Spotify Streamed City: Los Angeles
6,530 Instagram followers
THE KILLS
681,298 monthly Spotify listeners
Top Spotify Streamed City: Mexico City
110K Instagram followers
PARAMORE
9,993,165 monthly Spotify listeners
Top Spotify Streamed City: Chicago
2M Instagram followers
JACK WHITE
1,265,270 monthly Spotify listeners
Top Spotify Streamed City: Chicago
348K Instagram followers
Notable Nashville companies that are integral to fostering the rock scene include Jack White’s Third Man
Records, JEFF the Brotherhood’s Innity Cat Recordings, as well The Black Keys’ Dan Auerbach’s as Easy
Eye Sound Studio.
Independent label and event company Cold Lunch Recordings is in year ve of Spewfest, an event that
spans East Nashville venues and has expanded to include hip-hop acts but was born as a psych, punk,
and garage rock event and remains important to the rock scene. There is plenty of overlap with the Punk,
Emo, Hardcore & Metal genre.
GENRE CULTURE
“The spirit of rock in Nashville is in the house shows and DIY Scene.”
Joni Lemons, Artist, Lemon Drop
SINGER/SONGWRITER
FANS SURVEYED IN THE MUSIC CONSUMERS SURVEY
42% of people list this genre as one of their favorites to listen to
39% of people list this genre as one of their favorites to experience live
The top way that people who listen to the Singer/Songwriter genre consume music is via Spotify,
at 57% of the category
76% of Singer/Songwriter fans have bought music related merch in the past year
Singer/Songwriter fans have attended eight livestream concerts on average since March
35% of Singer/Songwriter fans paid for livestreams or virtual performances
54% of Singer/Songwriter fans participated in crowd funding or donated to any other sources of
supplementary income for artists during COVID-19
MUSIC CREATORS SURVEYED IN THE SURVEY TO THE MUSIC INDUSTRY
44% of music creators indicated that this was one of their primary music genres
14% of Singer/Songwriter music creators report they are making more music since the onset of
COVID and 71% report they are making less
Singer/Songwriter music creators list the top three results of COVID as follows:
Loss of scheduled gigs, studio work, or residency: 83%
Loss of Revenue, employment, or benets: 80%
Cancelled or postponed their tour: 44%
29% of Singer/Songwriter music creators have participated in a livestream concert for
compensation and 45% for no compensation since March
59% of Singer/Songwriter music creators have recorded music in a studio within the last six months
33% of Singer/Songwriter music creators have released music in the last six months
18% of Singer/Songwriter recording artists/vocalists are signed to a record label
27% of Singer/Songwriter recording artists or vocalists are signed to a music publisher
89% of Singer/Songwriter music creators consider themselves to be an independent artist or songwriter
52% of Singer/Songwriter music creators have more than one job
15% of Singer/Songwriter music creators do not have health insurance
32% of Singer/Songwriter music creators are part of a union
138

Singer/Songwriters can often be found playing the local coffee shop, bar or backyard show. In Nashville in
particular, these writers perform regularly at “writers’ rounds” in which typically three to four songwriters sit side by
side or in a round on stage and play songs one at a time. These writers improvise over each other’s songs, network
to meet new co-writers and play in hopes that perhaps a publisher, manager or artist might like their work. Some
writers are also artists while some write exclusively for others.
GENRE CULTURE
(Based on Spotify Playlist Chill Singer-Songwriter):
JOY OLADOKUN
BRE KENNEDY
BEN KESSLER
NOTABLE NAMES 2020
LIZZY MCALPINE
NOAH GUNDERSON
DODIE
VANESSA CARLTON
3,902,444 monthly Spotify listeners
Top Spotify Streamed City: Quezon City
63K Instagram followers
RAY FULCHER
244,594 monthly Spotify listeners
Top Spotify Streamed City: Atlanta
38K Instagram followers
RUSTON KELLY
1,114,529 monthly Spotify listeners
Top Spotify Streamed City: Chicago
62K Instagram followers
RANDY MONTANA
7,679 monthly Spotify listeners
Top Spotify Streamed City: Dallas
7K Instagram followers
NOTABLE NASHVILLE NAMES
JOY OLADOKUN
868,471 monthly Spotify listeners
Top Spotify Streamed City: Chicago
15K Instagram followers
TAYLOR RED
18,441 monthly Spotify listeners
Top Spotify Streamed City: Phoenix
140K Instagram followers
TAYLOR SWIFT
37,409,252 monthly Spotify listeners
Top Spotify Streamed City: Chicago
140M Instagram followers
KATE VOGEL
94,244 monthly Spotify listeners
Top Spotify Streamed City: London
5K Instagram followers
Find writer’s rounds and songwriter’s nights hosted at hotel bar The Commodore Grille, the famed Bluebird
Café, and The Listening Room café. As a hub for music publishing, the Nashville region is similarly a hub for
songwriting and a destination for songwriters.
139

140
SOUL, R&B AND BLUES
FANS SURVEYED IN THE MUSIC CONSUMERS SURVEY
58% of people list this genre as one of their favorites to listen to
43% of people list this genre as one of their favorites to experience live
The top way that people who listen to the Soul, R&B and Blues genre consume music is via Spotify,
at 59% of the category
67% of Soul, R&B and Blues fans have bought music related merch in the past year
Soul, R&B and Blues fans have attended ve livestream concerts on average since March
36% of Soul, R&B and Blues fans paid for livestreams or virtual performances
43% of Soul, R&B and Blues fans participated in crowd funding or donated to any other sources of
supplementary income for artists during COVID-19
MUSIC CREATORS SURVEYED IN THE SURVEY TO THE MUSIC INDUSTRY
39% of music creators indicated that this was one of their primary music genres
16% of Soul, R&B and Blues music creators report they are making more music since the onset of
COVID and 69% report they are making less
Soul, R&B and Blues music creators list the top three results of COVID as follows:
Loss of scheduled gigs, studio work, or residency: 84%
Loss of Revenue, employment, or benets: 76%
Cancelled or postponed my tour: 38%
25% of Soul, R&B and Blues music creators have participated in a livestream concert for
compensation and 34% for no compensation since March
69% of Soul, R&B and Blues music creators have recorded music in a studio within the last six months
44% of Soul, R&B and Blues music creators have released music in the last six months
16% of Soul, R&B and Blues recording artists/vocalists are signed to a record label
30% of Soul, R&B and Blues recording artists or vocalists are signed to a music publisher
82% of Soul, R&B and Blues music creators consider themselves to be an independent artist or songwriter
50% of Soul, R&B and Blues music creators have more than one job
13% of Soul, R&B and Blues music creators do not have health insurance
30% of Soul, R&B and Blues music creators are part of a union

141
R&B, Soul and Blues music relies heavily on live music and touring as a revenue stream. For recordings or
performances, large band ensembles and gospel choirs are unable to be in a space together or face new
challenges with social distancing requirements.
GENRE CULTURE
(From Chartmetrics Nashville Top Pop Songs by Local Airplay October 29, 2020)
CHRIS BROWN
YOUNG THUG
CHLOE X HALLE
NOTABLE NAMES 2020
THE WEEKND
BLACKBEAR
DOJA CAT
JASON ESKRIDGE
3,122 monthly Spotify listeners
Top Spotify Streamed City: Nashville
9K Instagram followers
BREN JOY
318,121 monthly Spotify listeners
Top Spotify Streamed City: Los Angeles
10K Instagram followers
DAN PENN
46,694 monthly Spotify listeners
Top Spotify Streamed City: Stockholm
NOTABLE NASHVILLE NAMES
SHANNON SANDERS
22,172 monthly Spotify listeners
Top Spotify Streamed City: Atlanta
5K Instagram followers
EMONI WILKINS
1,233 monthly Spotify listeners
Top Spotify Streamed City: Nashville
13K Instagram followers
MIKE HICKS
7K Instagram followers
KHALID
DISCLOSURE
Find Jason Eskridge hosting Sunday Night Soul at The 5 Spot. The Jefferson St. United Merchants Partnership
hosted the 20th year of the Jefferson Street Jazz & Blues Festival online in 2020. As per their homepage at
nashvillejazzandbluesfest.com, “Founded in 1994, the Jefferson St. Jazz & Blues Festival is at the heart and
soul of the African American community in Nashville.” The Nashville Blues & Roots Alliance, bluesandroots.org,
provides a “platform for live music, community involvement, providing all musicians a platform to showcase
and perform their music.”
“I make a majority of my income from touring and residencies and lost a majority of that at the
beginning of the pandemic. I could only stay upset momentarily and started seeing all the ways
that I could do online performances and apply for grants. I was lucky enough to get a couple
of music grants that really helped me stay aoat. From there was able to start my own online
performance space that I was able to charge tickets for. While that’s all happening, I’m focusing
more on the songwriting aspect of my career which can be done virtually.”
Anonymous Artist

142
ALL GENRES
Across all of these genres, there are numbers from both the Consumers Survey and the Survey to the Music Industry
that remain fairly consistent, and there are also numbers that vary.
When it comes to music consumers/listeners, listeners of all genres reported that Spotify was the primary way
that they listen to music. For all genres, this was over 50% of listeners. Over 60% of all consumers reported that
they have bought music-related merchandise in the past year. Standouts include EDM/Electronic, and Punk, Emo,
Hardcore & Metal with over 75% of listeners purchasing music merch.
For all genres, the average number of livestream concerts attended since March ranges between three and eight.
Christian & Gospel, Pop, and Punk, Emo, Hardcore & Metal consumers all report three on average, while Singer/
Songwriter and Folk/Americana consumers report eight on average. Folk/Americana listeners represent the highest
share who have paid for a livestream concert, at 37%. Punk, Emo, Hardcore & Metal represents the lowest share
who have paid for a livestream concert, at 15%.
Twenty-four percent of Alternative/Indie listeners and 39% of Christian and Gospel listeners have participated
in crowd funding or donated to other sources since March, all other groups report over 40% with Folk/Americana
representing the highest share of listeners donating at 56% and Punk, Emo, Hardcore & Metal at 55%.
When it comes to music creators, hip-hop and rap creators have been the most prolic during the pandemic.
Thirty-two percent say they are making more music than before March; the next highest rate comes from EDM/
Electronic music creators at 25%. Classical music creators report that 88% are making less music since March,
followed by Country Musicians at 81%.
Creators across all genres report that the top way that COVID-19 has affected them is by “loss of scheduled gigs,
studio work or residency,” followed again for all genres by “loss of revenue, employment, or benets.” The third
listed result of COVID-19 varies across genres. Pop, Soul, R&B, and Blues, Alternative/Indie, Country, Singer/
Songwriter, Rock, and Folk/Americana music creators all report “cancelled or postponed tour” as the third most
prominent effect, all between 37-52%. Christian and Gospel, Jazz, Latin, Hip-Hop and Rap, EDM/Electronic, and
Classical music creators all report “purchased new gear, audio equipment, or musical instruments” as the third most
prominent effect, all between 34-83%. Finally, Punk, Emo, Hardcore and Metal music creators list “had to sell gear,
equipment or personal belongings” as the third most prominent effect of the pandemic, at 56% of all creators.
Punk, Emo, Hardcore and Metal musicians represent the lowest share that have played a livestream concert
for compensation since March: 6%. Folk/Americana musicians represent the highest share that have played a
livestream concert for compensation: 33%.
Latin, Punk, Emo, Hardcore and Metal, Christian and Gospel, Hip-Hop and Rap, Classical, Soul, R&B, and Blues,
Pop, Jazz, and Rock musicians report that under 40% have played a livestream concert for no compensation since
March. EDM/Electronic, Alternative/Indie, Country, Singer/Songwriter, and Folk/Americana musicians all report that
40% or more have played a livestream concert for no compensation since March.

Except for Punk, Emo, Hardcore and Metal music creators at 35%, 50% or more of all music creators across
genres have recorded in a studio in the past six months.
Except for Classical music creators at 19%, and EDM/Electronic and Hip-Hop and Rap at over 50%, 25 – 50%
of creators across genres have released music in the past six months.
Only 9% of Christian and Gospel music creators surveyed are signed to a label, compared to 38% of EDM/
Electronic music creators. All other genres fall between 15 – 25%.
Only 12% of Classical music creators are signed to a publisher, compared to 45% of Hip-Hop and Rap music
creators. All other genres fall between 20 – 40%.
Only 18% of Classical music creators surveyed consider themselves to be an independent artist/songwriter,
compared to over 80% for the following genres: Soul, R&B, and Blues, Punk, Emo, Hardcore and Metal, Country,
Alternative/Indie, Folk/Americana, Rock, Latin, EDM/Electronic, and Singer/Songwriter.
Over 36% of music creators of all genres have more than one job.
Only 7% of Classical music creators have no health insurance, compared to 36% of Punk, Emo, Hardcore and
Metal music creators. All other genres fall between 10 – 20%.
Finally, only 9% of Punk, Emo, Hardcore and Metal music creators are in a union compared to 56% of Jazz music
creators. Find Hip-Hop and Rap, EDM/Electronic, Alternative/Indie, Soul, R&B, and Blues, Singer/Songwriter,
Rock, and Pop between 14 – 39%, and Folk/Americana, Country, Latin, Classical, and Christian and Gospel
music creators between 40 – 55%.
143

144
Many who contribute both directly and indirectly to the music industry fall outside of traditional, measurable
categories—notably, the foundation of a music industry itself, creators.
Music creators range from songwriters, lyricists, arrangers, conductors, bandleaders, performing artists, DJs,
producers, session musicians and sound recording engineers, among others. Many consider themselves
to be independent, unsigned by a music publisher/record label (85.3% from the Survey to the Music
Industry) or at least unassociated with any company or organization who might report their employment to a
government bureau.
The music industry workforce also include audio, lightning, production, instrument and other equipment
technicians; music educators and therapists; creative agents and managers; public relations specialists
and journalists; among others. Many of these occupations have lower rates of gig workers or independent
workers than music creators and it is easier to quantify employment using data from the Bureau of Labor
Statistics (BLS). However, much of this BLS occupational data includes professionals both within the music
industry as well as those with the same occupation/job title working outside of the music industry.
This 2020 Music Industry Workforce Assessment attempts to account for these self-employed, gig-based,
freelance and contract-based workers alongside hourly, salary or recoupment-based employees. This is done
by bringing in self-employment data for occupations that have high rates of this type of employment and by
providing survey data from these workers.
This workforce assessment also ensures that information specic to music industry professionals exists
both within and outside of the music industry. This is accomplished by combining our survey data of 2,011
members of the music industry with information from the BLS, which allows the reader to glean not only
information specic to individuals who may work in an area like music education, but also information
about growth patterns, wages and employment projections specic to a higher-level BLS occupational
categorization: preschool, primary, secondary and special education school teachers, for example.
Regarding BLS data, “the 2018 Standard Occupational Classication (SOC) system is a federal statistical
standard used by federal agencies to classify workers into occupational categories for the purpose of
collecting, calculating or disseminating data. All workers are classied into one of 867 detailed occupations
according to their occupational denition.”
The research team selects Standard Occupational Codes (SOCs) based on their match with data from
our survey based on the question,“In which capacity do you work in the music industry?” The selected
SOCs represent a range of situations: high percentage of music industry employment per occupation, high
employment numbers (even if the percentage of the total occupation in the industry was low), or hand-picked
by the research team because they are known to be integral occupations in the music business.
MUSIC INDUSTRY
WORKFORCE ASSESSMENT
90

145
The following list describes the music industry workforce categories developed to harmonize data from our
Survey to the Music Industry with related occupational groups from the BLS. Each group contains integral
occupations, but does not contain the entire realm of employment per given subsector of the music industry.
WORKFORCE CATEGORY #1
Studio / Performing Musicians, Recording Artists, Vocalists, Producers, DJs
SOC 27-2042: Musicians and Singers
WORKFORCE CATEGORY #2
Songwriters, Composers, Lyricists, Arrangers, Conductors, Bandleaders
SOC 27-2041: Music Directors and Composers
SOC 27-3043: Writers and Authors
WORKFORCE CATEGORY #3
Live Music, Non-Technical Occupations: Concert Promoter, Talent Buyer, Booking Agents, Tour
Manager, Music Festival Operations, Venue Manager, Venue Operations, Artist Hospitality
SOC 13-1011: Agents and Business Managers of Artists, Performers and Athletes
SOC 11-9198 Personal Service Managers, All Other, Entertainment and Recreation Managers
SOC 39-3099: Entertainment Attendants and Related Workers, All Other
SOC 13-1121: Meeting, Convention and Event Planners
Live Music, Technical Occupations: Sound Engineering Technicians, Studio Maintenance, Live Sound
Engineer, Instrument, Production, Audio, Equipment Technicians, Lighting and Production Design,
Rigging, Live Crew
SOC 27-4098: Lighting Technicians and Media and Communication Equipment Workers
SOC 27-4014: Sound Engineering Technicians
SOC 27-4011: Audio and Video Technicians
SOC 49-9096: Riggers
SOC 53-3033: Light Truck Drivers
WORKFORCE CATEGORY #4
AM/FM Radio, Internet Radio, Satellite Radio
SOC 27-3011: Broadcast Announcers and Radio Disc Jockeys
SOC 27-4012: Broadcast Technicians
SOC 49-2021: Radio, Cellular, and Tower Equipment Installers and Repairers
WORKFORCE CATEGORY #5
Music Education, Music Therapy
SOC 25-1121: Art, Drama, and Music Teachers, Postsecondary
SOC 25-2000: Preschool, Elementary, Middle, Secondary and Special Education Teachers
SOC 29-1125: Recreational Therapists
WORKFORCE CATEGORY #6

146
WORKFORCE CATEGORY #7
Public Relations, Journalism, Social Media, Creative Agency, Artist Manager, Business Manager
SOC 13-1011: Agents and Business Managers of Artists, Performers, and Athletes
SOC 11-9198 Personal Service Managers, All Other
SOC 11-2032: Public Relations Managers
SOC 27-3030: Public Relations Specialists
SOC 11-2021: Marketing Managers
SOC 13-1160: Market Research Analysts and Marketing Specialists
SOC 27-1024: Graphic Designers
SOC 27-3020: News Analysts, Reporters and Journalists
WORKFORCE CATEGORY #8
Financial Planning, Consulting, Accounting, Banking, Entertainment Law
SOC 23-1011: Lawyers
SOC 23-2010: Paralegals and Legal Assistants
SOC 43-6012: Legal Secretaries and Administrative Assistants
SOC 41-3030: Securities, Commodities, and Financial Services Sales Agents
SOC 13-2050: Financial Analysts and Advisors
SOC 11-3030: Financial Managers
SOC 13-2010: Accountants and Auditors
WORKFORCE CATEGORY #9
Music Publishing Creative Operations (Sync Pitching, Marketing, Talent Scouting, etc.), Sync Licensing, Music
Supervision, Advertising, Catalog Administration, Rights Management, Metadata Organization, Performance
or Mechanical Copyright Society Operations, Record Label Operations (A&R, Marketing, Radio Promotion,
Distribution, Human Resources, etc.)
27-2012: Producers and Directors
27-1011: Art Directors
41-3011: Advertising Sales Agents
11-2011: Advertising and Promotions Managers
11-1012: General and Operations Managers
11-1011: Chief Executives
WORKFORCE CATEGORY #10
Technology Development, Software Engineering, Digital Service Platform Operations, Research Analytics
15-1251: Computer Programmers
15-1245: Database Administrators and Architects
15-1257: Web Developers and Digital Interface Designers
15-1256: Software Developers and Software Quality Assurance Analysts and Testers
WORKFORCE CATEGORY #11
Brick & Mortar Music Retail Operations
41-2031: Retail Salespersons
41-1011: First-Line Supervisors of Retail Sales Workers
53-7065: Stockers and Order Fillers
53-7062: Laborers and Freight, Stock, and Material Movers, Hand
53-7199: First-Line Supervisors of Transportation and Material Moving Workers, Except Aircraft Cargo
Handling Supervisors
53-3032: Heavy and Tractor-Trailer Truck Drivers

147
This dual approach of BLS data alongside the Survey to the Music Industry data yields a uniquely comprehensive
framework of a music industry workforce.
Occupational SOC codes grant the ability to pinpoint areas of growth and projection city-over-city for both total
employment and self-employment including historical growth rates at ve and ten years as well as projected growth
at one, two and ve years. This report utilizes two projection scenarios from Chmura Economics: one that accounts
for immediate COVID-19 impacts and shows a steep dip in employment, but assumes a vaccine being wide-spread
by mid-2021 and another that provides a comparison by taking the most recent employment numbers from quarter
two 2020 and applying historic growth rates without consideration of COVID-19. In the projections accounting for
COVID-19, many occupations are positioned to start experiencing positive employment growth after one year and
many occupations reach or exceed current employment levels after two years.
BLS data also capture wage information (annual median wage, median hourly wage, annual entry level wage, annual
experienced wage, the difference between experienced vs. entry level wages) and demographics information
(retirement risk, racial diversity and gender diversity).
This report’s survey data adds dimension to this information by allowing for direct comparison to BLS data expanding
upon immediate COVID-19 effects per occupation and examining the living situation of individuals employed in each
of these categories.

148
WORKFORCE CATEGORY #1
STUDIO AND PERFORMING MUSICIANS,
RECORDING ARTISTS, VOCALISTS,
PRODUCERS AND DJS
Standard Occupational 27-2042: Musicians and Singers corresponds with this category of employment. This
work capacity exists both in and outside of live music.
Employment Growth and Projections, Total Employment and Self-Employment
The tables below illustrate a few things about each occupation: the trajectory in employment numbers up
to the second quarter of 2020 in selected peer regions, the ve- and ten- year historical employment growth
rate, current occupational employment, as well as the location quotient of each occupation per region.
Employment numbers, although presented as Q2 comparisons from Chmura Economics, represent four-
quarter rolling averages. The location quotient represents the concentration of an industry’s specialization
in a region as compared to the United States average. So, an LQ over 1 indicates that there is a high
concentration of Musicians and Singers in a respective region. The unemployment rate is determined by
occupation for Q2 2020.
Atlanta
Austin
Chicago
Denver
Los Angeles
Memphis
Nashville
New Orleans
New York
USA
3,874
1,334
6,081
1,538
11,111
1,162
3,078
907
16,303
194,219
3,863
1,471
5,988
1,589
11,507
1,102
3,094
963
15,896
188,312
3,669
1,383
5,138
1,531
10,596
1,017
2,937
907
14,036
170,848
-5.0
-6.0
-14.2
-3.7
-7.9
-7.7
-5.1
-5.8
-11.7
-9.3
-5.3
3.6
-15.5
-0.5
-4.6
-12.5
-4.6
0.0
-13.9
-12.0
1.15
1.11
0.99
0.87
1.48
1.39
2.53
1.42
1.33
1.00
7.4%
7.7%
9.4%
8.1%
12.3%
6.9%
7.6%
11.1%
10.5%
8.9%
2010
Employment
2015
Employment
2020
Employment
5 Year
Historical
Growth
Rate (%)
Region
SOC 27-2042, Musicians and Singers, Total Employment
10 Year
Historical
Growth
Rate (%) LQ
Unemployment
Rate

The historical growth rates are, notably, negative. Still, the Nashville region’s location quotient for musicians
and singers far exceeds that of any other comparative region. Unemployment shows Los Angeles and New
Orleans with the highest rates both hovering around 12% and Nashville and Memphis with the lowest rates
around 7%.
However, total employment does not tell the whole story when it comes to musicians and singers. Many are
self-employed and while this category is included in total employment, it is important, especially for this
occupation, to break it out. Data available on self-employed individuals is limited to employment numbers
and location quotients. Note that this only captures individuals for whom this is indicated to be their primary
job, a limitation which means there are many musicians who would not be captured here.
Atlanta
Austin
Chicago
Denver
Los Angeles
Memphis
Nashville
New Orleans
New York
USA
1,914
698
2,580
760
6,001
409
1,040
392
7,959
85,172
1,877
795
2,460
809
6,342
368
1,119
444
7,718
80,855
1,565
707
2,096
733
5,842
290
1,015
391
6,959
68,412
-16.6
-11.0
-14.8
-9.3
-7.9
-21.3
-9.3
-11.9
-9.8
-15.4
-18.2
1.3
-18.7
-3.6
-2.6
-29.2
-2.4
-0.3
-12.6
-19.7
1.04
1.37
1.08
1.10
1.77
0.99
2.13
1.26
1.54
1.00
2010
Employment
2015
Employment
2020
Employment
5 Year
Historical
Growth
Rate (%)
Region
SOC 27-2042, Musicians and Singers, Self-Employment
10 Year
Historical
Growth
Rate (%) LQ
The Nashville MSA has the highest LQ for both total employment (2.53) and self-employment (2.13).
No other MSA hits two in either category.
While the Nashville region is strong in concentration of musicians and singers, growth in these occupations
has not been strong. The Survey to the Music Industry points to difculties with Nashville’s rising cost of
living and the necessity for musicians and singers to hold more than one job, 60% of musicians surveyed do.
Furthermore, 71% report this is because of the cost of living and 11% report working other jobs to receive
healthcare benets. The location quotient has diminished from 2.56 to 2.53 since the Nashville Chamber’s
research in 2013.
149

150
Occupational Projection Scenarios
The baseline forecasts for employment growth are developed by Chmura Economics per historical trends
and expected growth in the labor force. Right now, this means the “baseline” forecast represents a scenario
where typical growth patterns as impacted by COVID-19 take place starting from a four-quarter rolling
average ending in second quarter 2020. This scenario uses past patterns; because a dip in employment is
seen in second quarter 2020, there is an overall decline. This model does not account for a deeper dip or any
other scenario, however, it simply applies past patterns to the current state of affairs. This is referred to as
the “baseline scenario” throughout the remainder of the report. The “recovery scenario” forecast models a
deeper dip in employment numbers due to COVID-19, the “near-term impacts of COVID” and incorporates
an assumption that there will be a vaccine widely distributed in mid-2021. The Chmura model predicts
that employment could return to pre-pandemic levels in late 2021 or early 2022. This is referred to as the
“recovery scenario” throughout the remainder of the report.
In the tables below, the “base” columns are baseline forecasts applying past patterns to employment
numbers as of second quarter 2020 (as calculated using a four-quarter rolling average). The “recovery”
columns use a recovery scenario forecast that models an immediate dip in employment due to COVID and
operates on the assumption of a widely-spread vaccine by mid-2021.
Atlanta
Austin
Chicago
Denver
Los Angeles
Memphis
Nashville
New Orleans
New York
USA
3,669
1,383
5,138
1,531
10,596
1,017
2,937
907
14,036
170,848
3,696
1,405
5,105
1,543
10,542
1,014
2,964
906
13,966
170,820
1,565
707
2,096
733
5,842
290
1,015
391
6,959
68,412
3,473
1,301
4,751
1,426
9,638
969
2,694
842
12,809
159,830
3,819
1,475
5,231
1,607
10,879
1,032
3,119
934
14,398
175,660
2020
2021
Base
2021
Recovery
2022
Base
Region
2022
Recovery
2025
Base
2025
Recovery
1 Year %
Growth
Base
1 Year %
Growth
Recovery
2 Year %
Growth
Base
2 Year %
Growth
Recovery
5 Year %
Growth
Base
5 Year %
Growth
Recovery
3,805
1,499
4,974
1,592
10,331
1,004
3,073
903
13,688
170,706
3,943
1,567
5,191
1,667
10,870
1,032
3,252
942
14,382
177,496
0.7
1.6
-0.6
0.8
-0.5
-0.3
0.9
-0.1
-0.5
0.0
-5.3
-5.9
-7.5
-6.9
-9.0
-4.7
-8.3
-7.2
-8.7
-6.4
1.5
3.3
-1.3
1.6
-1.0
-0.5
1.8
-0.2
-1.0
0.0
4.1
6.7
1.8
5.0
2.7
1.5
6.2
3.0
2.6
2.8
-3.7
8.4
-3.2
4.0
-2.5
-1.2
4.6
-0.5
-2.5
-0.1
7.5
13.3
1.0
8.9
2.6
1.5
10.7
3.9
2.5
3.9
SOC 27-2042, Musicians and Singers, Total Employment
In the recovery scenario, there is positive employment growth across geographies by the
second year. In the baseline scenario, many regions are still losing musicians and singers by the
fth year. Nashville and Austin are projected to see the most growth at the two- and ve-year
marks in the recovery scenario. However, Nashville also experiences one of the sharpest losses
in employment in the rst year (at -8.3%, second only to New York at -8.7%).

151
Atlanta
Austin
Chicago
Denver
Los Angeles
Memphis
Nashville
New Orleans
New York
USA
1,565
707
2,096
733
5,842
290
1,015
391
6,959
68,412
1,570
716
2,074
736
5,794
287
1,021
389
6,906
68,108
1,395
641
1,849
657
5,206
256
916
345
6,189
61,015
1,574
725
2,052
740
5,747
285
1,028
386
6,854
67,806
1,645
756
2,142
772
5,978
299
1,071
405
7,139
70,680
2020
2021
Base
2021
Recovery
2022
Base
Region
2022
Recovery
2025
Base
2025
Recovery
1 Year %
Growth
Base
1 Year %
Growth
Recovery
2 Year %
Growth
Base
2 Year %
Growth
Recovery
5 Year %
Growth
Base
5 Year %
Growth
Recovery
1,587
753
1,986
749
5,606
279
1,047
380
6,699
66,908
1,690
799
2,114
797
5,935
297
1,111
405
7,105
71,020
0.3
1.3
-1.1
0.4
-0.8
-0.8
0.6
-0.6
-0.8
-0.4
-10.9
-9.3
-11.8
-10.4
-10.9
-11.7
-9.8
-11.8
-11.1
-10.8
0.5
2.6
-2.1
0.9
-1.6
-1.5
1.3
-1.2
-1.5
-0.9
5.1
6.9
2.2
5.3
2.3
3.1
5.5
3.6
2.6
3.3
1.4
6.5
-5.2
2.2
-4.0
-3.8
3.2
-2.9
-3.7
-2.2
8.0
13.0
0.9
8.7
1.6
2.4
9.5
3.6
2.1
3.8
SOC 27-2042, Musicians and Singers, Self-Employment
In the pandemic dip and recovery scenario, all regions experience one-year growth of at least -9%. Some
regions move to positive growth rates by year two in this scenario: Atlanta, Austin, Denver and Nashville.
These same regions continue to experience positive growth rates at year ve. Nashville is second only to
Austin when it comes to growth.

Wages
Wage data is available for total employment only. The table below shows annual median wage, entry level
wage and experienced wages. These categories are created using percentile wages from Chmura Economics
where median wage is equivalent to the 50th percentile of wages and entry level and experienced wages are
calculated using lower and higher percentiles, respectively.
Atlanta
Austin
Chicago
Denver
Los Angeles
Memphis
Nashville
New Orleans
New York
$124,800
$50,200
$79,100
$46,000
$92,800
$57,700
$85,300
$69,300
$84,000
Annual
Experienced
Wage
Region
SOC 27-2042, Musicians and Singers, Total Employment
$87,100
$32,000
$57,900
$15,900
$64,000
$31,200
$61,900
$49,800
$51,500
Difference Between
Experienced and
Entry Level Wages
$72,200
$31,800
$45,500
$39,800
$51,100
$38,900
$53,000
$40,400
$52,900
Annual
Median Wage
$37,700
$18,200
$21,200
$30,100
$28,800
$26,500
$23,400
$19,500
$32,500
Annual Entry
Level Wage
$46.93
$20.66
$29.59
$25.83
$33.23
$25.29
$34.43
$26.27
$34.37
Median
Hourly Wage
While Nashville falls in the middle of the median wage scale, there is a notably large gap between entry
level and experienced wages. Second only to the $87,000 gap in Atlanta, entry level musicians and singers in
Nashville make approximately $62,000 less than “experienced,” or high percentile earners in the region.
152

Demographics
Economic Modeling Specialists Inc. provides comparative metrics for retirement risk, racial diversity and
gender diversity. Retirement risk counts employees 55 or older. The following table shows what percent the
composition of the total workforce is compared to the national average for an area of the same size.
Atlanta
Austin
Chicago
Denver
Los Angeles
Memphis
Nashville
New Orleans
New York
Racial Diversity
Region
SOC 27-2042, Musicians and Singers, Total Employment
Gender Diversity
Employment Type
Retirement Risk
Total
Self-Employed
Total
Self-Employed
Total
Self-Employed
Total
Self-Employed
Total
Self-Employed
Total
Self-Employed
Total
Self-Employed
Total
Self-Employed
Total
Self-Employed
86%
79%
84%
92%
105%
105%
90%
95%
85%
93%
101%
85%
77%
80%
88%
76%
93%
99%
Percent of National Average for Equivalent Area
150%
155%
132%
137%
99%
100%
72%
83%
150%
128%
95%
96%
79%
105%
149%
140%
117%
99%
87%
90%
89%
101%
111%
121%
89%
94%
85%
100%
101%
76%
71%
71%
89%
69%
95%
113%
In every region except for Los Angeles, New Orleans and New York, self-employed musicians are more
racially diverse. In every region except for Memphis and New Orleans, self-employed musicians also tend to
have more professionals over the age of 55.
In the Nashville region, self-employed musicians and singers are more racially diverse than
the combination of self-employed and otherwise employed workers. However, the groups are
equal when it comes to gender diversity.
153

154
Primary Data
Below are numbers and ndings from the Survey to the Music Industry from members of the music industry
who held jobs in the following categories: Studio/Performing Musicians, Recording Artists, Vocalists,
Producers and DJs.
Although musicians and singers do not necessarily need formal training, many survey respondents within the
artist categories are highly educated. About 90% indicate they have some college and a bachelor’s or post-
graduate degree. Workers in this category are relatively young, the majority (67%) between the ages of 25
and 44.
Level of Education
Less than High School
High School Diploma or Equivalent
Some College or Associate’s Degree
1.9%
8.9%
33.1%
Bachelor’s Degree
40.6%
Graduate or Professional Degree
15.5%
In terms of work status, 66% of musicians and recording artists are self-employed, freelance or gig workers.
With 66% of these self-employed musicians indicating that they work in this capacity full-time. 53% of
musicians indicate having more than one job, but 67% report that this second job is also in the music industry.
Is at least one of your other job(s)
in the music industry?
Yes
No
67%
33%
Because so many musicians are gig workers, the
cancellation of live performances and less opportunities
to perform have led to high rates of unemployment. This
is reected in survey responses with 79% of musicians
indicating they have experienced unemployment since
March and 96% of musicians citing COVID-19 as the
reason. Additionally, about 87% report they are working
less because of the pandemic.
Have you been unemployed
due to COVID-19?
Yes
No
96.1%
1.2%
Unsure
2.7%
However, due to funding avenues made available through
federal and private avenues, 51% of musicians who
experienced unemployment applied for and received
unemployment benets. 76% of musicians report receiving a
stimulus check under the CARES Act.
155
It is also important to note the value gap often associated with the work musicians produce
and what they end up being paid. The Value Gap, as dened by Music Canada, describes the
signicant disparity between the value of creative content that is accessed and enjoyed by
consumers and the revenues returned to the people and businesses who create it. This occurs
when the people who produce creative works are compensated inadequately – or not at all –
by the organizations and businesses that use their works commercially. Only 1.3% of Studio/
Performing Musicians, Recording Artists, Vocalists, Producers and DJs “completely agree”
songwriters are compensated fairly for their work, only 3.1% “completely agree” recording
artists are compensated fairly and only 2.3% “completely agree” backing musicians and
vocalists are compensated fairly. When you look at the overall numbers, these numbers remain
around the same low rates (1.8% completely agree for songwriters, 4.3% for recording artists
and 2.2% for backing musicians and vocalists). This shows that not only within musicians and
performers do they believe they are not compensated fairly for their work, but the majority of
the music industry agrees.
Because most musicians are self-employed, they are more vulnerable in terms of health and
wellness. Many indicated they receive health insurance through the marketplace or by other
means. Only 14% indicated they receive health insurance through an employer and 16% do not
have health insurance at all. Also, 70% indicate that the pandemic has negatively affected their
mental health.
Do you have health insurance?
Yes, through my employer.
Yes, through my spouse or partner’s employment.
Yes, through my parents’ insurance plan.
Yes, through the health insurance marketplace.
Yes, through Medicaid.
Yes, through other means.
No.
13.9%
15.0%
3.9%
26.9%
4.4%
20.0%
15.9%
91

Self-Employed, Gig-Based, Contract-Based and Freelance Musicians
To those who study workforce, it is a commonly known difculty to obtain data on self-employed workers
for whom their self-employment is not their primary job such as gig workers, contract-based and
freelance workers. In the Survey to the Music Industry, data can be obtained about those who indicate
that this is their closest category of employment status and identify as a recording artist, vocalist, studio
or performing musician. This is a sample size of approximately 460, with 315, or 68% of this group living
in the Nashville MSA. For simplicity, this group is referred to as self-employed musicians below.
While 67% of total musicians are between the ages of 25 – 44, 45% of self-employed musicians are in
that same age range, and 33% are over the age of 55. In comparison, 44% of musicians that are not self-
employed are between the ages of 25-44, and 33% are over the age of 55.
Levels of educational attainment do not deviate more than a couple percentage points from the group
of total musicians. However, non-self-employed musicians tend to have higher educational attainment
than self-employed musicians.
Less than High School
High School Diploma or Equivalent
Some College or Associate’s Degree
Bachelor’s Degree
Graduate or Professional Degree
Level of Education
1.5%
9.6%
34.8%
38.9%
15.2%
% of
Self-Employed
Musicians
3.3%
7.5%
29.2%
41.7%
18.3%
% of
Non-Self-Employed
Musicians
55% of self-employed musicians indicate that they hold more than one job (compared to 50%
who are not self-employed), with 64% of this sample having at least one other job in the music
industry (compared to 83% who are not self-employed).
73% of self-employed musicians say that they hold more than one job to support the cost of
living, and 13% indicate that it is to receive healthcare benets.
The sample size for non-self-employed musicians is not comparable to that of self-employed and so
comparative numbers are not provided.
Eighty-ve percent of self-employed musicians indicate they have experienced unemployment since
March compared to 52% of non-self-employed musicians. Ninety-seven percent of self-employed
musicians compared to 89% of non-self-employed musicians report the reason as COVID-19.
156

Twenty-six percent of self-employed musicians report that their 2019 annual income was less than
$25,000, and 92% indicate that COVID-19 will decrease their annual income for 2020.
In comparison, 17.7% of musicians who are not self-employed report a 2019 annual income of less than
$25,000, and 87% indicate that COVID-19 will decrease their annual income for 2020.
Future Outlook for all Musicians
In terms of future outlook, the return of live music will play a large role in job opportunities for musicians.
However, almost 87% report that bookings for live performances in 2021 are much lower leaving many
musicians with less opportunities to perform and a lot of uncertainty as to when these opportunities
will return. Sixty percent of musicians project their annual income will be at or below $36,000 in 2020
– a $10,000 decrease from the average income of musicians reported in 2019. Resources on funding
opportunities still available to musicians and other music industry professionals are available in the
section entitled “Resources.”
See the Appendix for more relevant survey data.
157

158
Standard Occupational Code Matches:
27-2041: Music Directors and Composers
27-3043: Writers and Authors
While Writers and Authors are occupations that exist outside of the music industry to some degree, a large
percentage of occupational employment falls within the music industry. Nashville has the highest percentage
of occupational employment (approximately 30%) that is certainly in the music industry. Additionally, Music
Directors and Composers also align with this workforce category.
WORKFORCE CATEGORY #2
SONGWRITERS, COMPOSERS, LYRICISTS,
ARRANGERS, CONDUCTORS, BANDLEADERS
Employment Growth and Projections
The tables below illustrate the past decade of employment growth in the subset of music cities up to
second quarter 2020 (four quarter rolling average) as well as the location quotient of the occupation (the
regional concentration).
SOC 27-2041, Music Directors and Composers, Total Employment
Atlanta
Austin
Chicago
Denver
Los Angeles
Memphis
Nashville
New Orleans
New York
USA
932
459
1,389
387
2,184
300
557
232
3,998
55,972
992
503
1,395
402
2,139
311
585
245
3,895
57,280
1,045
533
1,316
415
1,946
318
620
250
3,639
57,760
5.4
6.0
-5.7
3.2
-9.0
2.3
5.9
2.1
-6.6
0.8
12.1
16.2
-5.3
7.2
-10.9
6.0
11.2
7.9
-9.0
3.2
0.97
1.27
0.75
0.70
0.81
1.29
1.58
1.16
1.02
1.00
7.6%
8.1%
9.9%
8.4%
12.6%
6.8%
7.9%
11.1%
11.0%
9.0%
2010
Employment
2015
Employment
2020
Employment
5 Year
Historical
Growth
Rate (%)
Region
10 Year
Historical
Growth
Rate (%) LQ
Unemployment
Rate
Nashville has the highest concentration of self-employed music directors and composers with a location
quotient of 1.88. Chicago, Denver, Los Angeles, New Orleans and New York all have concentrations less
than the national average.

159
SOC 27-3043, Writers and Authors, Total Employment
Atlanta
Austin
Chicago
Denver
Los Angeles
Memphis
Nashville
New Orleans
New York
USA
2,347
1,066
4,315
1,263
11,819
467
1,498
524
16,553
131,863
2,342
1,195
4,120
1,300
12,133
409
1,573
569
15,932
127,621
2,358
1,224
3,778
1,265
11,146
397
1,556
533
14,754
120,230
0.7
2.5
-8.3
-2.7
-8.1
-2.8
-1.0
-6.3
-7.4
-5.8
0.5
14.8
-12.5
0.2
-5.7
-14.9
3.8
1.8
-10.9
-8.8
1.05
1.40
1.03
1.02
2.22
0.77
1.91
1.19
1.99
1.00
4.5%
4.9%
5.6%
5.3%
8.2%
4.3%
4.8%
7.0%
6.6%
5.8%
2010
Employment
2015
Employment
2020
Employment
5 Year
Historical
Growth
Rate (%)
Region
10 Year
Historical
Growth
Rate (%) LQ
Unemployment
Rate
Los Angeles has the highest concentration of writers and authors with a location quotient of 2.2. All
regions except for Memphis exceed the national average.
SOC 27-3043, Writers and Authors, Total Employment
Atlanta
Austin
Chicago
Denver
Los Angeles
Memphis
Nashville
New Orleans
New York
USA
1,667
810
2,848
852
8,213
338
1,201
409
10,871
89,163
1,596
859
2,545
855
8,167
282
1,211
426
9,611
81,745
1,480
797
2,233
795
7,257
262
1,157
396
8,300
73,613
-7.3
-7.2
-12.3
-6.9
-11.1
-7.1
-4.4
-7.2
-13.6
-9.9
-11.2
-1.7
-21.6
-6.6
-11.6
-22.6
-3.7
-3.3
-23.6
-17.4
0.91
1.44
1.06
1.10
2.04
0.83
2.26
1.18
1.71
1.00
2010
Employment
2015
Employment
2020
Employment
5 Year
Historical
Growth
Rate (%)
Region
10 Year
Historical
Growth
Rate (%) LQ

160
Nashville has a location quotient of 2.26 for self-employed writers and authors. This can most likely
be attributed to the thriving songwriting community. All historical growth rates are negative; however,
Austin, Denver, Nashville and New Orleans have experienced less of a decline in employment growth
than other comparative regions.
Atlanta
Austin
Chicago
Denver
Los Angeles
Memphis
Nashville
New Orleans
New York
USA
1,045
533
1,316
415
1,946
318
620
250
3,639
57,760
1,053
543
1,309
419
1,938
317
627
250
3,625
57,805
1,031
529
1,275
407
1,845
313
597
244
3,497
56,619
1,061
553
1,301
422
1,931
317
633
250
3,611
57,850
1,072
561
1,318
428
1,982
319
650
253
3,677
58,467
2020
2021
Base
2021
Recovery
2022
Base
Region
2022
Recovery
2025
Base
2025
Recovery
1 Year %
Growth
Base
1 Year %
Growth
Recovery
2 Year %
Growth
Base
2 Year %
Growth
Recovery
5 Year %
Growth
Base
5 Year %
Growth
Recovery
1,084
585
1,279
434
1,909
315
654
250
3,569
57,985
1,099
595
1,300
442
1,969
317
674
254
3,651
58,762
0.7
1.9
-0.6
0.9
-0.4
-0.2
1.1
0.0
-0.4
0.1
-1.3
-0.8
-3.1
-1.9
-5.2
-1.6
-3.7
-2.4
-3.9
-2.0
1.5
3.8
-1.1
1.8
-0.8
-0.4
2.1
0.0
-0.8
0.2
2.6
5.3
0.2
3.1
1.8
0.3
4.8
1.2
1.0
1.2
3.8
9.8
-2.8
4.6
-1.9
-1.1
5.5
0.0
-1.9
0.4
5.2
11.6
-1.2
6.5
1.2
-0.3
8.7
1.6
0.3
1.7
SOC 27-2041, Music Directors and Composers, Total Employment
In the dip and recovery scenario, all regions are experiencing positive growth by the fth year except for Chicago
and Memphis. Most regions have exceeded their employment levels from 2020 by the fth year as well.
Atlanta
Austin
Chicago
Denver
Los Angeles
Memphis
Nashville
New Orleans
New York
USA
419
133
432
139
845
101
231
71
1,066
17,678
420
135
428
279
1,684
201
463
142
2,124
35,271
405
128
411
134
786
98
220
67
1,003
17,039
422
136
423
280
1,678
200
465
142
2,116
35,186
429
140
431
143
860
101
242
72
1,076
17,786
2020
2021
Base
2021
Recovery
2022
Base
Region
2022
Recovery
2025
Base
2025
Recovery
1 Year %
Growth
Base
1 Year %
Growth
Recovery
2 Year %
Growth
Base
2 Year %
Growth
Recovery
5 Year %
Growth
Base
5 Year %
Growth
Recovery
426
142
410
282
1,658
198
470
140
2,091
34,933
435
147
420
146
845
99
248
71
1,057
17,597
0.3
1.4
-1.0
100.4
99.2
99.3
100.7
99.4
99.2
99.5
-3.3
-3.8
-4.9
-3.6
-7.0
-3.0
-4.8
-5.6
-5.9
-3.6
0.6
2.7
-2.1
100.9
98.4
98.6
101.4
98.7
98.4
99.0
2.4
5.3
-0.2
2.9
1.8
0.0
4.8
1.4
0.9
0.6
1.5
6.9
-5.1
102.3
96.1
96.5
103.6
96.9
96.0
97.6
3.8
10.5
-2.8
5.0
0.0
-2.0
7.4
0.0
-0.8
-0.5
SOC 27-2041, Music Directors and Composers, Self-Employment

161
For self-employed music directors and composers, the baseline scenario equates to higher future employment
than the dip and recovery scenario.
Atlanta
Austin
Chicago
Denver
Los Angeles
Memphis
Nashville
New Orleans
New York
USA
2,358
1,224
3,778
1,265
11,146
397
1,556
533
14,754
120,230
2,374
1,246
3,757
1,276
11,107
395
1,571
532
14,693
120,263
2,203
1,177
3,579
1,210
10,338
375
1,471
498
13,941
114,017
2,390
1,268
3,735
1,288
11,069
393
1,586
531
14,632
120,295
2,445
1,290
3,806
1,311
11,394
401
1,624
544
14,966
122,677
2020
2021
Base
2021
Recovery
2022
Base
Region
2022
Recovery
2025
Base
2025
Recovery
1 Year %
Growth
Base
1 Year %
Growth
Recovery
2 Year %
Growth
Base
2 Year %
Growth
Recovery
5 Year %
Growth
Base
5 Year %
Growth
Recovery
2,439
1,337
3,672
1,322
10,953
388
1,633
527
14,450
120,394
2,514
1,371
3,768
1,357
11,380
399
1,688
545
14,886
123,689
0.7
1.8
-0.6
0.9
-0.3
-0.5
1.0
-0.2
-0.4
0.0
-6.6
-3.8
-5.3
-4.3
-7.2
-5.5
-5.5
-6.6
-5.5
-5.2
1.4
3.6
-1.1
1.8
-0.7
-1.0
1.9
-0.4
-0.8
0.1
3.7
5.4
0.7
3.6
2.2
1.0
4.4
2.1
1.4
2.0
3.4
9.2
-2.8
4.5
-1.7
-2.3
4.9
-1.1
-2.1
0.1
6.6
12.0
-0.3
7.3
2.1
0.5
8.5
2.3
0.9
2.9
SOC 27-3042, Writers and Authors, Total Employment
In the Nashville region, employment exceeds current employment for both scenarios (baseline and the dips and
recovery scenario) by year two. Growth rates remain in the single digits for most regions in the dip and recovery
scenario, except for Austin which is projected to see a 12% growth rate for writers and authors over ve years.
Atlanta
Austin
Chicago
Denver
Los Angeles
Memphis
Nashville
New Orleans
New York
USA
1,480
797
2,233
795
7,257
262
1,157
396
8,300
73,613
1,485
807
2,210
799
7,201
260
1,165
394
8,243
73,316
1,383
752
2,058
744
6,704
242
1,085
367
7,664
68,266
1,490
818
2,188
803
7,145
258
1,173
392
8,187
73,021
1,522
836
2,236
820
7,303
264
1,199
401
8,368
74,633
2020
2021
Base
2021
Recovery
2022
Base
Region
2022
Recovery
2025
Base
2025
Recovery
1 Year %
Growth
Base
1 Year %
Growth
Recovery
2 Year %
Growth
Base
2 Year %
Growth
Recovery
5 Year %
Growth
Base
5 Year %
Growth
Recovery
1,504
850
2,121
814
6,981
252
1,196
386
8,020
72,141
1,556
880
2,195
842
7,224
261
1,238
400
8,299
74,648
0.3
1.3
-1.0
0.5
-0.8
-0.8
0.7
-0.5
-0.7
-0.4
-6.6
-5.6
-7.8
-6.4
-7.6
-7.6
-6.2
-7.3
-7.7
-7.3
0.6
2.6
-2.0
0.9
-1.5
-1.5
1.4
-1.0
-1.4
-0.8
2.8
4.9
0.1
3.1
0.6
0.8
3.6
1.3
0.8
1.4
1.6
6.7
-5.0
2.4
-3.8
-3.7
3.4
-2.5
-3.4
-2.0
5.1
10.4
-1.7
5.9
-0.5
-0.4
7.0
1.0
0.0
1.4
SOC 27-3042, Writers and Authors, Self Employment
The patterns for self-employed writers and authors largely mirror those seen for total employment.

162
Wages
The table below shows annual median wage, entry level wage and experienced wages. These categories
are created using percentile wages from Chmura Economics where median wage is equivalent to the
50th percentile of wages and entry level and experienced wages are calculated using lower and higher
percentiles, respectively.
Atlanta
Austin
Chicago
Denver
Los Angeles
Memphis
Nashville
New Orleans
New York
USA
$88,500
$79,000
$64,600
$72,700
$106,700
$65,800
$59,500
$71,600
$109,600
$83,400
Annual
Experienced
Wage
Region
27-2041, Music Directors and Composers
$60,200
$31,700
$42,100
$46,000
$74,500
$44,900
$40,200
$48,800
$75,600
$56,300
Difference Between
Experienced and
Entry Level Wages
$50,100
$64,800
$42,400
$57,400
$59,600
$40,800
$41,600
$44,400
$64,600
$51,700
Annual
Median Wage
$28,300
$47,300
$22,500
$26,700
$32,200
$20,900
$19,300
$22,800
$34,000
$27,100
Annual Entry
Level Wage
$24.09
$31.14
$20.41
$27.59
$28.66
$19.61
$19.99
$21.34
$31.06
$24.84
Median
Hourly Wage
Wages in the Nashville MSA are lower for this occupation than in all other regions when it comes to
entry level and experienced wages.
Atlanta
Austin
Chicago
Denver
Los Angeles
Memphis
Nashville
New Orleans
New York
USA
$79,200
$72,100
$83,100
$74,800
$120,100
$59,700
$72,900
$61,000
$109,900
$91,800
Annual
Experienced
Wage
Region
27-2041, Music Directors and Composers
$37,900
$32,900
$47,300
$44,400
$70,800
$37,200
$30,400
$36,400
$63,200
$53,800
Difference Between
Experienced and
Entry Level Wages
$59,500
$60,300
$60,300
$54,000
$76,700
$46,500
$63,300
$38,500
$74,200
$63,200
Annual
Median Wage
$41,300
$39,200
$35,800
$30,400
$49,300
$22,500
$42,500
$24,600
$46,700
$38,000
Annual Entry
Level Wage
$28.62
$28.97
$28.99
$25.97
$36.86
$22.35
$30.42
$18.49
$35.69
$30.38
Median
Hourly Wage

163
Writers and authors fare relatively well in the Nashville region at current wage rates compared to other
regions. Los Angeles has the highest annual median wage at $76,700.
Demographics
The following table aggregates these two occupations and provides comparative diversity rates between
music cities. The gure represents the percent the composition of the total workforce compared to the
national average for an area of the same size.
Atlanta
Austin
Chicago
Denver
Los Angeles
Memphis
Nashville
New Orleans
New York
Racial Diversity
Region
SOC 27-2041 Music Directors and Composers
and SOC 27-3043, Writers and Authors
Gender Diversity Retirement Risk
Percent of National Average for Equivalent Area
84%
90%
100%
97%
91%
105%
100%
93%
90%
144%
126%
91%
61%
138%
99%
89%
139%
121%
100%
101%
110%
101%
99%
91%
84%
90%
105%
The Nashville MSA meets the national average when it comes to workers over 55 years of age. The
MSA is the lowest of all music cities when it comes to gender diversity and is the second lowest in
regard to racial diversity.

164
Primary Data
Below are numbers and ndings from the Survey to the Music Industry from songwriters, composers,
lyricists, arrangers, conductors or bandleaders, job titles most closely associated with the 27-2041 and
27-3043 occupational groups.
In terms of work status in the industry, it is interesting to note that many songwriters, composers, lyricists,
arrangers, conductors or bandleaders are self-employed or freelancers. This dynamic leaves many of
these workers more vulnerable to unemployment.
In fact, 84% indicate they are seeing less work since the onset of COVID-19 and 71% have experienced
unemployment since March. Fortunately, 45% of those who experienced unemployment since March
were able to apply for and receive unemployment benets.
Songwriting is a difcult industry to break into – especially in Nashville where the talent is top-notch
and plentiful. Fifty-seven percent of songwriters, composers, lyricists, arrangers, conductors and
bandleaders indicate they hold a second job with main reasons for holding a second job being to
support their cost of living or to pursue another job in a creative eld.
What is your current work status in the music industry?
Do you have more than one job?
Hourly, Salary, or Recoupment-Based Employee
Self-Employed / Gig-Based / Contract-Based / Freelance
8.1%
63.3%
Company Owner
Retired
14.9%
0.0%
Student
Unemployed
2.7%
10.9%
Yes
No
55.3%
44.7%
Why do you work more than one job?
To receive healthcare benets
To support my cost of living
10.4%
57.1%
Other
My other job is in a creative eld
10.8%
21.7%

165
Those who hold more than one job split that time almost evenly between their primary music industry
job and their secondary job. When given the chance to further explain their reasons for holding a second
job, one person described their second job as “another passion of mine” while a few others pointed to
entrepreneurship across many creative endeavors as their reason for holding a second job.
Mean Hours Spent Per Week on Primary Music Industry Job: 29.5
Mean Hours Spent Per Week on a Secondary Job: 24.5
Similar to the rest of the Music Industry, COVID-19 has taken a toll on those in songwriting related elds.
Not just in terms of income and employment, though a little over 43% indicate that their annual income
for 2020 will be under $25,000 (compared to only 26% in 2019), but also in terms of mental health, with
68% indicating that COVID-19 has negatively impacted their mental health. If you or someone you know
needs help there are various resources available specically for workers in the Music Industry. See the
Resources section for details.
What is your projected
annual income for 2020?
$12,761 - $25,000
$25,001 - $36,000
$36,001 - $45,000
$45,001 - $55,000
$55,001 - $70,000
$70,001 - $100,000
$100,001 - $200,000
More than $200,001
Prefer Not To Say
$0 - $12,760
20.00%
12.35%
7.41%
3.95%
6.67%
6.67%
4.69%
2.72%
12.10%
23.46%
What was your annual
income for 2019?
$12,761 - $25,000
$25,001 - $36,000
$36,001 - $45,000
$45,001 - $55,000
$55,001 - $70,000
$70,001 - $100,000
$100,001 - $200,000
More than $200,001
Prefer Not To Say
$0 - $12,760
14.14%
14.64%
8.44%
6.45%
12.16%
10.17%
10.17%
2.73%
9.68%
11.41%

WORKFORCE CATEGORY #3
LIVE MUSIC, NON-TECHNICAL OCCUPATIONS:
CONCERT PROMOTERS, TALENT BUYERS,
BOOKING AGENTS, TOUR MANAGERS, VENUE
MANAGERS, MUSIC FESTIVAL OPERATIONS
Standard Occupational Code Matches:
13-1011: Agents and Business Managers of Artists, Performers, and Athletes,
11-9198 Personal Service Managers, All Other, Entertainment and Recreation Managers,
39-3099: Entertainment Attendants and Related Workers, All Other, and
13-1121: Meeting, Convention, and Event Planners
Employment Growth and Projections, Total Employment and Self-Employment
The tables below illustrate the trajectory of employment growth these occupations were on
in all selected peer regions until second quarter 2020 along with the location quotient of the
occupation’s concentration.
SOC 13-1010, Agents and Business Managers of
Artists, Performers and Athletes, Total Employment
Atlanta
Austin
Chicago
Denver
Los Angeles
Memphis
Nashville
New Orleans
New York
USA
473
166
576
121
4,689
134
606
93
3,867
22,594
464
184
430
127
5,354
69
668
73
3,713
21,652
330
173
360
107
6,906
44
696
63
3,168
19,791
-28.8
-5.8
-16.1
-15.7
29.0
-36.0
4.3
-13.8
-14.7
-8.6
-30.1
4.6
-37.4
-12.0
47.3
-67.1
15.0
-31.8
-18.1
-12.4
0.90
1.20
0.60
0.52
8.35
0.52
5.18
0.85
2.60
1.00
4.2%
4.6%
4.9%
4.9%
7.9%
3.8%
4.5%
6.0%
6.2%
6.2%
2010
Employment
2015
Employment
2020
Employment
5 Year
Historical
Growth
Rate (%)
Region
10 Year
Historical
Growth
Rate (%) LQ
Unemployment
Rate
When it comes to live music, the most closely associated SOC codes span Business and Financial
Operations (13), Management Occupations (11), and Personal Care and Service Occupations (39).
Utilizing stafng pattern data, it can be determined that these occupations are representative
of music industry employment, although as a group this employment crosses over into other
entertainment industries. Especially considering venue employment and the lack of exact industry
match here, the functionality by occupation is hard to pin down.
166

The Los Angeles MSA has the highest location quotient at 8.35 followed by the Nashville MSA with 5.18.
This may be capturing other entertainment industry employment. For example, the location quotient in
Los Angeles could be capturing the high concentration of individuals who work in lm and television in
similar jobs that are also held by people who work in music.
SOC 11-9198, Personal Service and Entertainment
and Recreation Managers, Total Employment
Atlanta
Austin
Chicago
Denver
Los Angeles
Memphis
Nashville
New Orleans
New York
USA
16,500
5,219
34,397
8,698
41,711
3,831
6,594
6,485
51,798
845,964
19,082
6,497
38,626
10,170
48,015
4,156
7,783
6,754
57,578
938,336
22,312
7,941
41,709
11,715
54,095
4,727
9,562
7,086
63,399
1,045,614
16.9
22.2
8.0
15.2
12.7
13.7
22.9
4.9
10.1
11.4
35.2
52.2
21.3
34.7
29.7
23.4
45.0
9.3
22.4
23.6
1.15
1.04
1.31
1.09
1.24
1.06
1.35
1.81
0.98
1.00
1.8%
1.9%
2.3%
2.0%
3.0%
1.9%
1.8%
2.8%
2.6%
2.2%
2010
Employment
2015
Employment
2020
Employment
5 Year
Historical
Growth
Rate (%)
Region
10 Year
Historical
Growth
Rate (%) LQ
Unemployment
Rate
All of the considered regions have location quotients above one except for New York. Growth has
been positive for personal service managers over the last ve- and ten-year periods.
SOC 39-3099, Entertainment Attendants and
Related Workers, All Other, Total Employment
Atlanta
Austin
Chicago
Denver
Los Angeles
Memphis
Nashville
New Orleans
New York
USA
951
213
1,138
381
1,672
198
230
622
2,287
40,710
584
150
674
236
1,073
103
156
354
1,424
25,021
105
27
105
37
306
25
31
79
271
4,655
-82.0
-82.2
-84.4
-84.3
-71.5
-75.7
-79.8
-77.8
-81.0
-81.4
-88.9
-87.5
-90.8
-90.2
-81.7
-87.4
-86.3
-87.4
-88.2
-88.6
1.22
0.79
0.74
0.77
1.57
1.25
0.99
4.52
0.94
1.00
13.9%
12.2%
17.3%
12.2%
19.7%
13.0%
11.7%
15.9%
16.6%
14.9%
2010
Employment
2015
Employment
2020
Employment
5 Year
Historical
Growth
Rate (%)
Region
10 Year
Historical
Growth
Rate (%) LQ
Unemployment
Rate
167

Unemployment rates are much higher for this low-wage, low-barrier-to-entry occupation than for many
of the others listed here. This is likely because of the in-person nature of many of the job functions
associated with this occupation, combined with the low level of training needed.
SOC 13-1121, Meeting, Convention, and Event Planners, Total Employment
Atlanta
Austin
Chicago
Denver
Los Angeles
Memphis
Nashville
New Orleans
New York
USA
1,185
507
2,505
887
3,454
307
378
132
5,235
71,698
1,721
762
3,488
1,369
5,158
398
584
197
7,905
102,335
2,434
1,111
4,355
1,932
6,833
539
863
248
10,233
132,325
41.4
45.8
24.8
41.1
32.5
35.5
47.6
25.9
29.5
29.3
105.4
118.9
73.8
117.7
97.8
75.5
128.0
87.7
95.5
84.6
0.99
1.15
1.08
1.42
1.24
0.95
0.96
0.50
1.25
1.00
3.9%
4.3%
4.6%
4.6%
6.8%
3.3%
4.1%
5.6%
5.7%
4.8%
2010
Employment
2015
Employment
2020
Employment
5 Year
Historical
Growth
Rate (%)
Region
10 Year
Historical
Growth
Rate (%) LQ
Unemployment
Rate
Meeting, Convention, and Event planners are unique in that the growth rates are positive for both
historical time periods across all geographies. New York has the highest location quotient at 1.25, while
New Orleans has the lowest at 0.50.
168

Occupational Projection Scenarios
In the tables below, the “base” columns are baseline forecasts applying past patterns to employment
numbers as of second quarter 2020 (as calculated using a four-quarter rolling average). The “recovery”
columns use a recovery scenario forecast that models an immediate dip in employment due to COVID and
operates on the assumption of a widely spread vaccine by mid-2021.
Atlanta
Austin
Chicago
Denver
Los Angeles
Memphis
Nashville
New Orleans
New York
USA
330
173
360
107
6,906
44
696
63
3,168
19,791
334
177
360
109
6,982
44
709
63
3,187
19,973
285
152
309
94
5,914
38
603
54
2,710
17,063
338
182
360
110
7,060
44
722
63
3,207
20,156
354
190
377
115
7,387
46
758
66
3,358
21,077
2020
2021
Base
2021
Recovery
2022
Base
Region
2022
Recovery
2025
Base
2025
Recovery
1 Year %
Growth
Base
1 Year %
Growth
Recovery
2 Year %
Growth
Base
2 Year %
Growth
Recovery
5 Year %
Growth
Base
5 Year %
Growth
Recovery
375
210
386
123
7,827
46
820
68
3,502
22,178
2,514
1,371
3,768
1,357
11,380
399
1,688
545
14,886
123,689
1.2
2.5
0.0
1.4
1.1
-0.3
1.9
0.2
0.6
0.9
-13.6
-12.1
-14.2
-12.1
-14.4
-13.6
-13.4
-14.3
-14.5
-13.8
2.5
5.1
0.1
2.9
2.2
-0.6
3.8
0.5
1.2
1.8
7.3
9.8
4.7
7.5
7.0
4.5
8.9
4.8
6.0
6.5
6.2
13.3
0.3
7.4
5.7
-1.5
9.7
1.2
3.1
4.7
13.6
21.4
7.2
15.0
13.3
4.5
17.8
7.9
10.5
12.1
SOC 13-1011, Agents and Business Managers of
Artists, Performers, and Athletes, Total Employment
Atlanta
Austin
Chicago
Denver
Los Angeles
Memphis
Nashville
New Orleans
New York
USA
22312
7941
41709
11715
54095
4727
9562
7086
63399
1,045,614
22610
8124
41732
11888
54271
4737
9734
7112
63511
1,052,192
22064
7928
40812
11616
52905
4638
9493
6943
61992
1,029,111
22912
8311
41755
12064
54448
4746
9910
7139
63624
1,058,812
22963
8321
41929
12091
54702
4771
9967
7183
63768
1,062,261
2020
2021
Base
2021
Recovery
2022
Base
Region
2022
Recovery
2025
Base
2025
Recovery
1 Year %
Growth
Base
1 Year %
Growth
Recovery
2 Year %
Growth
Base
2 Year %
Growth
Recovery
5 Year %
Growth
Base
5 Year %
Growth
Recovery
23842
8900
41824
12607
54981
4775
10456
7219
63962
1,078,922
23893
8906
42000
12633
55246
4802
10517
7266
64101
1,082,479
1.3
2.3
0.1
1.5
0.3
0.2
1.8
0.4
0.2
0.6
-1.1
-0.2
-2.2
-0.8
-2.2
-1.9
-0.7
-2.0
-2.2
-1.6
2.7
4.7
0.1
3.0
0.7
0.4
3.6
0.7
0.4
1.3
2.9
4.8
0.5
3.2
1.1
0.9
4.2
1.4
0.6
1.6
6.9
12.1
0.3
7.6
1.6
1.0
9.3
1.9
0.9
3.2
7.1
12.2
0.7
7.8
2.1
1.6
10.0
2.5
1.1
3.5
SOC 11-9198, Personal Service Managers, All Other; Entertainment and
Recreation Managers, Except Gambling; Managers, All Other, Total Employment
This occupation only sees negative growth across the board for the one-year period in the dip and recovery
scenario. In both scenarios there is mostly positive growth, in the Nashville region there is 17.8% projected
employment growth in the ve-year dip and recovery scenario.
169

Atlanta
Austin
Chicago
Denver
Los Angeles
Memphis
Nashville
New Orleans
New York
USA
105
27
105
37
306
25
31
79
271
4,655
106
28
104
37
306
25
32
79
271
4,674
98
26
100
35
269
24
29
73
250
4,410
108
28
104
38
306
25
32
79
272
4,693
115
30
110
40
334
26
34
85
288
4,990
2020
2021
Base
2021
Recovery
2022
Base
Region
2022
Recovery
2025
Base
2025
Recovery
1 Year %
Growth
Base
1 Year %
Growth
Recovery
2 Year %
Growth
Base
2 Year %
Growth
Recovery
5 Year %
Growth
Base
5 Year %
Growth
Recovery
112
30
102
39
306
25
34
79
273
4,751
120
32
110
42
336
27
37
86
291
5,096
1.3
2.2
-0.5
1.1
0.0
-0.2
1.7
0.1
0.2
0.4
-6.7
-3.7
-4.8
-5.4
-12.1
-4.0
-6.5
-7.6
-7.7
-5.3
2.7
4.4
-1.0
2.2
0.1
-0.4
3.4
0.2
0.3
0.8
9.5
11.1
4.8
8.1
9.2
4.0
9.7
7.6
6.3
7.2
6.9
11.4
-2.5
5.6
0.2
-0.9
8.7
0.4
0.8
2.1
14.3
18.5
4.8
13.5
9.8
8.0
19.4
8.9
7.4
9.5
SOC 39-3099, Entertainment Attendants and Related Workers, All Other, Total Employment
Atlanta
Austin
Chicago
Denver
Los Angeles
Memphis
Nashville
New Orleans
New York
USA
2,434
1,111
4,355
1,932
6,833
539
863
248
10,233
132,325
2,468
1,137
4,357
1961
6,862
540
878
249
10,253
133,268
2,389
1,105
4,242
1,898
6,585
525
846
238
9,902
129,134
2,503
1,164
4,359
1,991
6,892
541
893
251
10,274
134,217
2,560
1,186
4,463
2,038
7,086
556
918
259
10,509
137,471
2020
2021
Base
2021
Recovery
2022
Base
Region
2022
Recovery
2025
Base
2025
Recovery
1 Year %
Growth
Base
1 Year %
Growth
Recovery
2 Year %
Growth
Base
2 Year %
Growth
Recovery
5 Year %
Growth
Base
5 Year %
Growth
Recovery
2,609
1,248
4,364
2,083
6,981
543
941
255
10,335
137,107
2,678
1,275
4,481
2,140
7,211
560
970
264
10,611
140,925
1.4
2.4
0.0
1.5
0.4
0.1
1.7
0.5
0.2
0.7
-1.8
-0.5
-2.6
-1.8
-3.6
-2.6
-2.0
-4.0
-3.2
-2.4
2.8
4.8
0.1
3.0
0.9
0.3
3.5
1.1
0.4
1.4
5.2
6.8
2.5
5.5
3.7
3.2
6.4
4.4
2.7
3.9
7.2
12.3
0.2
7.8
2.2
0.7
9.0
2.7
1.0
3.6
10.0
14.8
2.9
10.8
5.5
3.9
12.4
6.5
3.7
6.5
SOC 13-1121, Meeting, Convention, and Event Planners, Total Employment
This occupation returns to positive growth levels and in most cases exceeds current employment by the two-year mark.
170

Wages
The table below shows annual median wage, entry level wage and experienced wages. These categories
are created using percentile wages from Chmura Economics where median wage is equivalent to the
50th percentile of wages and entry level and experienced wages are calculated using lower and higher
percentiles, respectively.
Atlanta
Austin
Chicago
Denver
Los Angeles
Memphis
Nashville
New Orleans
New York
USA
$61,100
$67,500
$125,100
$136,100
$139,100
$104,200
$105,000
$44,200
$126,900
$125,100
Annual
Experienced
Wage
Region
27-2041, Music Directors and Composers
$25,800
$26,300
$84,000
$89,300
$88,500
$71,500
$70,200
$25,900
$85,100
$83,700
Difference Between
Experienced and
Entry Level Wages
$49,400
$54,700
$74,300
$81,600
$89,200
$61,400
$63,900
$25,900
$77,000
$73,700
Annual
Median Wage
$35,300
$41,200
$41,100
$46,800
$50,600
$32,700
$34,800
$18,300
$41,800
$41,400
Annual Entry
Level Wage
$23.76
$26.30
$35.70
$39.21
$42.90
$29.50
$30.70
$12.43
$37.03
$35.45
Median
Hourly Wage
This occupation has a broad range of pay between entry and experienced employment levels, particularly in
the Nashville MSA. Although the entry level wage is relatively low for the area at approximately $30,000, the
median $60,000 and experienced level wages indicate upward mobility within the occupation.
Atlanta
Austin
Chicago
Denver
Los Angeles
Memphis
Nashville
New Orleans
New York
USA
$97,700
$89,100
$159,100
$105,300
$119,000
$101,700
$109,600
$85,300
$157,200
$118,900
Annual
Experienced
Wage
Region
SOC 11-9198, Personal Service and Entertainment and Recreation Managers
$61,700
$46,900
$100,400
$54,600
$55,600
$62,800
$69,300
$46,600
$88,000
$71,000
Difference Between
Experienced and
Entry Level Wages
$62,300
$67,400
$101,900
$84,900
$91,600
$65,600
$71,300
$62,500
$103,500
$76,400
Annual
Median Wage
$36,000
$42,200
$58,700
$50,700
$63,400
$38,900
$40,300
$38,700
$69,200
$47,900
Annual Entry
Level Wage
$29.95
$32.42
$49.01
$40.82
$44.06
$31.52
$34.30
$30.06
$49.77
$36.71
Median
Hourly Wage
171

Atlanta
Austin
Chicago
Denver
Los Angeles
Memphis
Nashville
New Orleans
New York
USA
$25,200
$28,200
$25,200
$26,700
$31,100
$22,600
$26,100
$25,000
$34,500
$28,400
Annual
Experienced
Wage
Region
SOC 39-3099, Entertainment Attendants and Related Workers, All Other, Total Employment
$8,400
$10,700
$1,200
$1,800
$5,300
$3,400
$9,000
$8,100
$9,600
$9,900
Difference Between
Experienced and
Entry Level Wages
$20,800
$22,400
$24,000
$25,900
$27,600
$19,400
$21,100
$20,300
$30,700
$23,300
Annual
Median Wage
$16,800
$17,500
$24,000
$24,900
$25,800
$19,200
$17,100
$16,900
$24,900
$18,500
Annual Entry
Level Wage
$10.00
$10.79
$11.52
$12.43
$13.27
$9.32
$10.13
$9.76
$14.74
$11.19
Median
Hourly Wage
Entertainment attendants have relatively low salaries and minimal opportunity for wage increase.
Atlanta
Austin
Chicago
Denver
Los Angeles
Memphis
Nashville
New Orleans
New York
USA
$64,700
$58,300
$64,000
$68,900
$71,800
$56,900
$66,100
$50,100
$88,200
$66,500
Annual
Experienced
Wage
Region
SOC 13-1121, Meeting, Convention, and Event Planners
$33,200
$25,500
$33,100
$30,700
$34,800
$38,300
$31,100
$21,400
$46,900
$34,900
Difference Between
Experienced and
Entry Level Wages
$50,200
$47,600
$50,200
$56,200
$55,600
$38,300
$53,300
$39,900
$65,500
$50,600
Annual
Median Wage
$31,500
$32,800
$30,900
$38,200
$37,000
$18,600
$35,000
$28,700
$41,300
$31,600
Annual Entry
Level Wage
$24.13
$22.87
$24.16
$27.00
$26.72
$18.43
$25.62
$19.18
$31.49
$24.33
Median
Hourly Wage
172

Demographics
The following table aggregates these four occupations that make up Workforce Category #3: Non-Technical
Live Music and provides comparative diversity rates between music cities. The gure represents the percent
the composition of the total workforce is compared to the national average for an area of the same size.
Atlanta
Austin
Chicago
Denver
Los Angeles
Memphis
Nashville
New Orleans
New York
Racial Diversity
Region
Workforce Category 3: Non-Technical Live Music
Gender Diversity Retirement Risk
Percent of National Average for Equivalent Area
93%
84%
98%
93%
99%
100%
91%
107%
96%
124%
113%
99%
72%
165%
98%
61%
105%
119%
104%
100%
102%
109%
95%
105%
98%
97%
105%
Nashville has the least racial diversity of all peer music cities for this occupational category. Los Angeles has
the highest at 165% of the national average.
Primary Data
Below are numbers and ndings from the Survey to the Music Industry from people that indicated they
are a Concert Promoter, Talent Buyer, Booking Agent, Tour Manager, Venue Manager or in Music Festival
Operations, Venue Operations, or Artist Hospitality
Overall, workers in these elds are predominantly self-employed, gig-based, contract-based, or freelancers.
An interesting note is that while 29.5% of those surveyed indicated that they were between the ages of 25
and 34, 35.4% have spent 21 years or more in their eld. This shows that there is a promising amount of
young talent in workforce categories that have found longevity in their occupational eld.
Are you seeing more, less, or the same amount of work since the onset of COVID-19?
More
2%
Less
96%
The same amount
2%
173

In terms of work status, 96% are seeing less work since the onset of COVID-19. This is likely due to the fact
that all of these jobs are related to live music and live productions which have come to almost a complete
stop. Unfortunately, 43% have also indicated that they have not been able to make the transition to remote
work and 68% have experienced unemployment since March — almost everyone cited COVID-19 as the
reason. However, out of those survey respondents who applied, 79% received unemployment benets.
Forty-six percent of respondents have another job, mostly to support their costs of living. Seventy percent
of respondents indicate their second job is in the music industry.
In terms of future outlook and viability, most people in this eld get their health insurance through their
employer, making the combination of unemployment and COVID-19 particularly treacherous. In addition,
COVID-19 has negatively impacted the mental health of 74% of respondents, well above the 66% survey
average. COVID-19 will also decrease annual income for many. 93% of respondents said their take-home
pay for 2020 would be less than 2019 as a direct result of circumstances around the pandemic. When asked:
“Does your current work in the music industry provide enough income for a comfortable standard of
living?” most respondents said “No” (52%). Before COVID-19, this was the opposite. Live music non-
technical occupations are clearly suffering under the lack of live music due to COVID-19 restrictions. Very few
have been able to remain aoat.
Before COVID-19, did your current work alone provide enough income for a
comfortable standard of living?
Yes
53.7%
No
11.4%
More often yes than no
27.6%
More often no than yes
6.5%
Not relevant as I do not have the same job/role
0.8%
174

Standard Occupational Code Matches:
27-4098: Lighting Technicians and Media and Communication Equipment Workers,
27-4014: Sound Engineering Technicians,
27-4011: Audio and Video Technicians,
49-9096: Riggers,
53-3033: Light Truck Drivers
These occupations represent much of the technical and operations work involved in the world of live music.
In the survey, the research team failed to include an option for professionals to identify themselves as
transportation workers. Respondents had an option for free response when it came to identifying the capacity
in which they work in the music industry, and transportation and trucking was one of the top responses.
WORKFORCE CATEGORY #4
LIVE MUSIC, TECHNICAL AND
OPERATIONS OCCUPATIONS
Employment Growth and Projections, Total Employment
The tables below illustrate the trajectory of employment growth that these occupations were on in all
selected peer regions up until second quarter 2020, the ve- and ten-year growth rates, occupational
unemployment along with the location quotient of the occupation’s concentration. In general,
the technical and operations occupations involved in live music consistently have relatively high
unemployment rates compared to other workforce categories.
SOC 27-4098, Lighting Technicians and Media and Communication
Equipment Workers, All Other
Atlanta
Austin
Chicago
Denver
Los Angeles
Memphis
Nashville
New Orleans
New York
USA
338
95
237
267
4,169
52
128
119
1,915
19,656
498
127
244
305
5,283
50
153
175
2,327
22,016
774
141
245
317
5,705
50
186
173
2,742
23,083
55.6
11.3
0.5
3.7
8.0
-0.9
21.2
-1.5
17.9
4.8
128.8
48.3
3.6
18.4
36.8
-4.5
45.1
44.5
43.2
17.4
1.80
0.84
0.35
1.33
5.91
0.51
1.19
2.00
1.93
1.00
6.2%
5.0%
7.0%
5.5%
9.6%
4.2%
5.7%
7.9%
8.0%
7.3%
2010
Employment
2015
Employment
2020
Employment
5 Year
Historical
Growth
Rate (%)
Region
10 Year
Historical
Growth
Rate (%) LQ
Unemployment
Rate
Los Angeles has the highest location quotient for lighting technicians and media and communication workers
by far, very likely due to the concentration of lm activity. The only regions with location quotients below the
national average are Chicago and Memphis.
175

176
SOC 27-4014, Sound Engineering Technicians, Total Employment
Atlanta
Austin
Chicago
Denver
Los Angeles
Memphis
Nashville
New Orleans
New York
USA
330
172
401
143
4,437
38
415
66
2,248
18,822
334
142
350
128
3,762
31
380
89
2,130
17,090
382
122
301
117
2,911
26
405
65
1,822
14,424
14.6
-13.8
-14.0
-8.5
-22.6
-16.6
6.4
-26.5
-14.5
-15.6
15.8
-28.9
-24.9
-17.8
-34.4
-31.3
-2.6
-1.1
-19.0
-23.4
1.42
1.16
0.69
0.79
4.83
0.42
4.13
1.21
2.05
1.00
6.9%
5.8%
8.1%
6.3%
11.1%
5.1%
6.6%
8.6%
9.2%
8.1%
2010
Employment
2015
Employment
2020
Employment
5 Year
Historical
Growth
Rate (%)
Region
10 Year
Historical
Growth
Rate (%) LQ
Unemployment
Rate
Nashville has the second highest LQ for sound engineering technicians as well as Audio and Video Technicians
(below) behind L.A. for both.
SOC 27-4011, Audio and Video Technicians, Total Employment
Atlanta
Austin
Chicago
Denver
Los Angeles
Memphis
Nashville
New Orleans
New York
USA
1,057
365
1,753
464
6,178
239
521
214
4,996
59,437
1,357
504
2,121
624
7,681
253
665
307
6,443
73,023
1,941
664
2,448
767
8,437
290
861
332
7,666
83,910
43.0
31.6
15.4
22.9
9.8
14.3
29.4
7.9
19.0
14.9
83.6
81.8
39.6
65.2
36.5
21.3
65.1
55.3
53.4
41.2
1.24
1.09
0.96
0.89
2.41
0.81
1.51
1.06
1.48
1.00
7.9%
6.7%
9.2%
7.2%
11.9%
5.9%
7.3%
9.9%
10.3%
8.7%
2010
Employment
2015
Employment
2020
Employment
5 Year
Historical
Growth
Rate (%)
Region
10 Year
Historical
Growth
Rate (%) LQ
Unemployment
Rate

177
SOC 49-9096, Riggers, Total Employment
Atlanta
Austin
Chicago
Denver
Los Angeles
Memphis
Nashville
New Orleans
New York
USA
134
61
252
71
670
52
81
624
390
14,280
191
107
344
113
949
68
124
633
567
20,364
304
152
426
145
1,121
86
168
650
742
23,650
59.7
41.7
23.7
28.8
18.1
26.4
35.3
2.8
30.8
16.1
126.8
146.4
69.2
105.1
67.3
65.5
109.2
4.3
90.1
65.6
0.69
0.88
0.59
0.60
1.13
0.86
1.05
7.36
0.51
1.00
7.5%
5.9%
10.4%
6.4%
10.7%
10.9%
6.3%
10.2%
9.2%
8.2%
2010
Employment
2015
Employment
2020
Employment
5 Year
Historical
Growth
Rate (%)
Region
10 Year
Historical
Growth
Rate (%) LQ
Unemployment
Rate
New Orleans has an extremely high location quotient for riggers at 7.36. Most other regions, including
Nashville, are very close to or less than one.
SOC 53-3033, Light Truck Drivers, Total Employment
Atlanta
Austin
Chicago
Denver
Los Angeles
Memphis
Nashville
New Orleans
New York
USA
17,772
3,738
33,580
8,382
37,932
10,424
5,129
3,693
52,251
877,438
18,983
4,348
34,547
9,165
39,561
10,288
6,007
3,834
53,289
915,100
21,833
6,055
40,211
10,905
44,460
11,093
7,198
3,983
56,566
1,001,059
15.0
39.3
16.4
19.0
12.4
7.8
19.8
3.9
6.2
9.4
22.8
62.0
19.7
30.1
17.2
6.4
40.3
7.9
8.3
14.1
1.17
0.83
1.32
1.06
1.06
2.59
1.06
1.06
0.92
1.00
4.8%
4.3%
6.2%
4.4%
6.9%
5.7%
4.6%
6.9%
6.3%
5.4%
2010
Employment
2015
Employment
2020
Employment
5 Year
Historical
Growth
Rate (%)
Region
10 Year
Historical
Growth
Rate (%) LQ
Unemployment
Rate
In the tables below, the “base” columns are baseline forecasts applying past patterns to employment numbers
as of second quarter 2020 (as calculated using a four-quarter rolling average). The “recovery” columns use a
recovery scenario forecast that models an immediate dip in employment due to COVID and operates on the
assumption of a widespread vaccine by mid-2021.

178
Occupational Projection Scenarios
In the recovery scenario, by 2025 the Nashville region will have only approximately 40 more lighting
technicians than it has today. However, growth is positive almost across the board for both the baseline
scenario and the dip and recovery scenario at two and ve years.
Atlanta
Austin
Chicago
Denver
Los Angeles
Memphis
Nashville
New Orleans
New York
USA
774
141
245
317
5,705
50
186
173
2,742
23,083
784
144
245
321
5,732
50
190
174
2,744
23,201
719
132
230
304
4,890
48
166
154
2,471
21,307
795
147
244
324
5,759
50
194
176
2,747
23,319
849
156
257
338
6,354
52
211
190
2,958
24,768
2020
2021
Base
2021
Recovery
2022
Base
Region
2022
Recovery
2025
Base
2025
Recovery
1 Year %
Growth
Base
1 Year %
Growth
Recovery
2 Year %
Growth
Base
2 Year %
Growth
Recovery
5 Year %
Growth
Base
5 Year %
Growth
Recovery
827
157
243
335
5,842
50
206
180
2,754
23,678
886
167
256
351
6,470
52
225
196
2,977
25,240
1.3
2.2
-0.2
1.1
0.5
-0.1
2.0
0.8
0.1
0.5
-7.1
-6.4
-6.1
-4.1
-14.3
-4.0
-10.8
-11.0
-9.9
-7.7
2.7
4.4
-0.4
2.3
1.0
-0.2
4.1
1.7
0.2
1.0
9.7
10.6
4.9
6.6
11.4
4.0
13.4
9.8
7.9
7.3
6.8
11.3
-0.9
5.7
2.4
-0.4
10.7
4.2
0.4
2.6
14.5
18.4
4.5
10.7
13.4
4.0
21.0
13.3
8.6
9.3
SOC 27-4098, Lighting Technicians and Media and Communication
Equipment Workers, All Other, Total Employment
Atlanta
Austin
Chicago
Denver
Los Angeles
Memphis
Nashville
New Orleans
New York
USA
382
122
301
117
2,911
26
405
65
1,822
14,424
386
124
299
118
2,897
26
405
65
1,808
14,440
342
113
274
109
2,476
24
356
58
1,588
13,039
390
126
297
120
2,882
26
405
66
1,795
14,456
420
135
316
127
3,164
27
439
71
1,940
15,422
2020
2021
Base
2021
Recovery
2022
Base
Region
2022
Recovery
2025
Base
2025
Recovery
1 Year %
Growth
Base
1 Year %
Growth
Recovery
2 Year %
Growth
Base
2 Year %
Growth
Recovery
5 Year %
Growth
Base
5 Year %
Growth
Recovery
403
133
291
124
2,840
26
405
67
1,754
14,504
435
143
310
132
3,129
27
439
73
1904
15,529
1.1
1.8
-0.7
1.2
-0.5
0.0
0.0
0.6
-0.8
0.1
-10.5
-7.4
-9.0
-6.8
-14.9
-7.7
-12.1
-10.8
-12.8
-9.6
2.2
3.6
-1.3
2.5
-1.0
0.0
0.0
1.1
-1.5
0.2
9.9
10.7
5.0
8.5
8.7
3.8
8.4
9.2
6.5
6.9
5.5
9.4
-3.3
6.3
-2.4
0.0
0.0
2.9
-3.7
0.6
13.9
17.2
3.0
12.8
7.5
3.8
8.4
12.3
4.5
7.7
SOC 27-4014, Sound Engineering Technicians, Total Employment

179
Similar to lighting technicians and communications workers, sound engineering technicians see a slight
rise in employment in the Nashville region in the recovery scenario over the next ve years. Again, this
growth is minimal, but recovery appears to begin at the two-year point in the recovery scenario.
Atlanta
Austin
Chicago
Denver
Los Angeles
Memphis
Nashville
New Orleans
New York
USA
1,941
664
2,448
767
8,437
290
861
332
7,666
83,910
1,974
682
2,456
781
8,490
292
877
335
7,702
84,787
1,829
641
2,328
737
7,505
278
796
307
7,029
79,468
2,009
700
2,464
795
8,544
293
893
339
7,738
85,672
2,105
726
2,550
824
9,179
303
944
356
8,144
89,141
2020
2021
Base
2021
Recovery
2022
Base
Region
2022
Recovery
2025
Base
2025
Recovery
1 Year %
Growth
Base
1 Year %
Growth
Recovery
2 Year %
Growth
Base
2 Year %
Growth
Recovery
5 Year %
Growth
Base
5 Year %
Growth
Recovery
2,114
758
2,489
840
8,706
298
943
349
7,846
88,386
2,228
791
2,591
876
9,415
310
1,003
370
8,321
92,557
1.7
2.7
0.3
1.8
0.6
0.5
1.8
1.0
0.5
1.0
-5.8
-3.5
-4.9
-3.9
-11.0
-4.1
-7.5
-7.5
-8.3
-5.3
3.5
5.4
0.7
3.7
1.3
1.1
3.7
2.0
0.9
2.1
8.4
9.3
4.2
7.4
8.8
4.5
9.6
7.2
6.2
6.2
8.9
14.2
1.7
9.5
3.2
2.7
9.5
5.1
2.4
5.3
14.8
19.1
5.8
14.2
11.6
6.9
16.5
11.4
8.5
10.3
SOC 27-4011, Audio and Video Technicians, Total Employment
Nashville’s ve-year growth in the recovery scenario hits 16.5%, second only to Austin at 19.1%. The
employment gains are larger here than in the previous two technical occupations with more than one
hundred new jobs in the ve-year recovery scenario.
Atlanta
Austin
Chicago
Denver
Los Angeles
Memphis
Nashville
New Orleans
New York
USA
304
152
426
145
1,121
86
168
650
742
23,650
308
156
426
147
1,123
86
170
650
743
23,795
292
150
413
143
1,006
84
160
622
685
23,161
312
159
426
150
1,125
86
173
651
743
23,941
323
164
437
154
1,202
88
180
672
775
24,575
2020
2021
Base
2021
Recovery
2022
Base
Region
2022
Recovery
2025
Base
2025
Recovery
1 Year %
Growth
Base
1 Year %
Growth
Recovery
2 Year %
Growth
Base
2 Year %
Growth
Recovery
5 Year %
Growth
Base
5 Year %
Growth
Recovery
325
171
427
157
1,131
87
180
652
746
24,385
337
176
439
162
1,214
89
188
675
782
25,045
1.4
2.4
0.0
1.7
0.2
0.1
1.4
0.1
0.1
0.6
-3.9
-1.3
-3.1
-1.4
-10.3
-2.3
-4.8
-4.3
-7.7
-2.1
2.7
4.8
0.1
3.4
0.3
0.3
2.9
0.1
0.2
1.2
6.3
7.9
2.6
6.2
7.2
2.3
7.1
3.4
4.4
3.9
6.9
12.3
0.2
8.6
0.9
0.7
7.4
0.3
0.5
3.1
10.9
15.8
3.1
11.7
8.3
3.5
11.9
3.8
5.4
5.9
SOC 49-9096, Riggers, Total Employment

180
Showing similar patterns, employment for riggers begins to recover at the two-year mark, but even at
the ve-year mark, employment does not exceed current employment by much.
Atlanta
Austin
Chicago
Denver
Los Angeles
Memphis
Nashville
New Orleans
New York
USA
21,833
6,055
40,211
10,905
44,460
11,093
7,198
3,983
56,566
1,001,059
22,077
6,188
40,135
11,082
44,526
11,138
7,309
3,986
56,563
1,005262
21,592
6,026
39,319
10,833
43,417
10,835
7,138
3,894
55,172
983,881
22,324
6,323
40,060
11,262
44,593
11,183
7,421
3,990
56,560
1,009,483
22,247
6,264
40,020
11,192
44,443
10,969
7,382
3,982
56,220
1,006,271
2020
2021
Base
2021
Recovery
2022
Base
Region
2022
Recovery
2025
Base
2025
Recovery
1 Year %
Growth
Base
1 Year %
Growth
Recovery
2 Year %
Growth
Base
2 Year %
Growth
Recovery
5 Year %
Growth
Base
5 Year %
Growth
Recovery
23,080
6,748
39,834
11,819
44,793
11,319
7,769
4,000
56,551
1,022,252
23,003
6,686
39,793
11,745
44,644
11,102
7,728
3,993
56,202
1,018,927
1.1
2.2
-0.2
1.6
0.1
0.4
1.5
0.1
0.0
0.4
-1.1
-0.5
-2.2
-0.7
-2.3
-2.3
-0.8
-2.2
-2.5
-1.7
2.2
4.4
-0.4
3.3
0.3
0.8
3.1
0.2
0.0
0.8
1.9
3.5
-0.5
2.6
0.0
-1.1
2.6
0.0
-0.6
0.5
5.7
11.5
-0.9
8.4
0.7
2.0
7.9
0.4
0.0
2.1
5.4
10.4
-1.0
7.7
0.4
0.1
7.4
0.3
-0.6
1.8
SOC 53-3033, Light Truck Drivers, Total Employment
Wages
Atlanta
Austin
Chicago
Denver
Los Angeles
Memphis
Nashville
New Orleans
New York
USA
$93,300
$74,400
$104,200
$68,900
$98,800
$64,400
$71,200
$84,900
$84,000
$92,900
Annual
Experienced
Wage
Region
SOC 27-4098, Lighting Technicians and Media and
Communication Equipment Workers, All Other
$45,800
$31,100
$63,200
$38,800
$57,900
$35,600
$29,900
$41,100
$50,500
$57,600
Difference Between
Experienced and
Entry Level Wages
$76,400
$62,200
$81,800
$48,300
$85,300
$53,500
$54,400
$61,800
$59,700
$73,500
Annual
Median Wage
$47,500
$43,300
$41,000
$30,100
$40,900
$28,800
$41,300
$43,800
$33,500
$35,300
Annual Entry
Level Wage
$36.73
$29.88
$39.33
$23.21
$40.99
$25.73
$26.17
$29.73
$28.69
$35.32
Median
Hourly Wage

181
The difference between experienced and entry level wages for this occupation shows room for mobility.
Atlanta
Austin
Chicago
Denver
Los Angeles
Memphis
Nashville
New Orleans
New York
USA
$80,700
$73,300
$79,000
$72,600
$106,800
$68,600
$88,500
$59,200
$99,600
$85,900
Annual
Experienced
Wage
Region
SOC 27-4014, Sound Engineering Technicians
$42,000
$44,300
$53,400
$40,700
$76,800
$46,300
$45,300
$25,700
$66,600
$56,400
Difference Between
Experienced and
Entry Level Wages
$62,300
$51,500
$55,200
$50,300
$60,900
$43,500
$61,400
$45,000
$63,200
$54,700
Annual
Median Wage
$38,700
$29,000
$25,600
$31,900
$30,000
$22,300
$43,200
$33,500
$33,000
$29,500
Annual Entry
Level Wage
$29.95
$24.78
$26.54
$24.20
$29.28
$20.93
$29.52
$21.65
$30.41
$26.32
Median
Hourly Wage
Similarly, the difference between experienced and entry level wages for this occupation also shows
room for mobility. Nashville sound engineering technicians are relatively well-paid, even considering
Nashville’s increasing cost-of-living.
Atlanta
Austin
Chicago
Denver
Los Angeles
Memphis
Nashville
New Orleans
New York
USA
$54,500
$45,000
$53,900
$59,200
$79,600
$49,500
$63,500
$45,900
$71,000
$62,300
Annual
Experienced
Wage
Region
SOC 27-4011, Audio and Video Technicians
$28,500
$17,500
$28,000
$26,800
$44,900
$26,900
$27,600
$21,600
$34,400
$33,200
Difference Between
Experienced and
Entry Level Wages
$41,600
$39,000
$40,000
$46,600
$53,000
$37,100
$51,200
$38,800
$55,300
$45,900
Annual
Median Wage
$26,000
$27,500
$25,900
$32,400
$34,700
$22,600
$35,900
$24,300
$36,600
$29,100
Annual Entry
Level Wage
$19.98
$18.74
$19.23
$22.40
$25.50
$17.85
$24.63
$18.66
$26.59
$22.07
Median
Hourly Wage

182
Atlanta
Austin
Chicago
Denver
Los Angeles
Memphis
Nashville
New Orleans
New York
USA
$50,100
$57,700
$90,200
$52,200
$69,400
$59,100
$46,100
$58,700
$97,100
$61,800
Annual
Experienced
Wage
Region
SOC 49-9096, Riggers
$16,900
$24,200
$36,100
$16,700
$35,500
$27,600
$19,800
$23,500
$53,900
$28,100
Difference Between
Experienced and
Entry Level Wages
$44,400
$48,400
$82,700
$45,700
$54,200
$48,300
$39,400
$50,800
$75,300
$50,900
Annual
Median Wage
$33,200
$33,500
$54,100
$35,500
$33,900
$31,500
$26,300
$35,200
$43,200
$33,700
Annual Entry
Level Wage
$21.35
$23.26
$39.75
$21.98
$26.03
$23.20
$18.96
$24.43
$36.18
$24.45
Median
Hourly Wage
Atlanta
Austin
Chicago
Denver
Los Angeles
Memphis
Nashville
New Orleans
New York
USA
$46,600
$53,900
$56,500
$46,300
$48,500
$45,800
$43,400
$45,900
$48,500
$46,200
Annual
Experienced
Wage
Region
SOC 53-3033, Light Truck Drivers
$24,300
$30,400
$30,100
$19,100
$20,200
$24,200
$22,300
$23,100
$21,700
$22,900
Difference Between
Experienced and
Entry Level Wages
$35,800
$41,800
$44,300
$37,500
$36,900
$35,600
$33,600
$35,100
$37,900
$34,700
Annual
Median Wage
$22,300
$23,500
$26,400
$27,200
$28,300
$21,600
$21,100
$22,800
$26,800
$23,300
Annual Entry
Level Wage
$17.21
$20.08
$21.31
$18.04
$17.73
$17.11
$16.16
$16.88
$18.23
$16.70
Median
Hourly Wage

183
Demographics
The following table aggregates these ve occupations and provides comparative diversity rates between
music cities. The gure represents the percent the composition of the total workforce is compared to the
national average for an area of the same size.
Atlanta
Austin
Chicago
Denver
Los Angeles
Memphis
Nashville
New Orleans
New York
Racial Diversity
Region
Workforce Category 4: Live Music, Technical and Operations
Gender Diversity Retirement Risk
Percent of National Average for Equivalent Area
87%
74%
105%
95%
87%
109%
87%
89%
97%
141%
132%
113 %
93%
146%
131%
71%
119%
131%
127%
105%
106%
96%
105%
146%
104%
94%
90%
Nashville has the lowest racial diversity and is in the middle in comparison to the other music cities on
the percentage of people at risk for retirement and diverse by gender.
Primary Data
Below are numbers and ndings from the Survey to the Music Industry from members of the music
industry that hold jobs in the following categories: Audio Engineering, Studio Maintenance, Live Sound
Mix Engineer; Audio Technician, Production Technician, Instrument Technician, Equipment Technician;
and Lightning and Production Design, Rigging, and other Live Crew.
First, we will look at work status in the industry. 50.8% of respondents indicate that they are self-
employed, gig-based, contract-based, or freelance workers. It is also notable that 44.3% of those in
these lighting, audio and live production occupations have been working in the industry for over 20
years. Unfortunately, because so many of these workers are freelancers or contract-based, with the
almost complete shutdown of live shows and performances, 88.1% have seen less work and 58% have
not been able to make the transition to remote work since the onset of COVID-19.

Since many have not been able to work because of cancelled gigs and shows, unemployment has been particularly
notable for occupations who work behind the scenes to make those shows happen.
About half have a second job—59% of these people have a second job to support their cost of living.
Have you experienced
unemployment since March?
Yes
76.0%
No
24.0%
Have you applied for/received
unemployment benefits?
Applied and received
54.9%
Applied but did not receive
11.1%
Did not apply
33.9%
Have you applied for/received
unemployment benefits?
Yes
96.3%
No
1.6%
Unsure
2.0%
With this high unemployment rate comes higher
rates of those without health insurance. Twenty-
two percent of respondents answered “No” to
having health insurance.
In terms of outlook and the viability of jobs
in lighting, audio, tech and live production in
response to questions asked about people’s
annual incomes in 2019 compared to 2020, the
percentage of people making 25,000 or less went
up by 25% from 2019. Additionally, around 93%
of respondents indicate that “Yes, COVID-19 will
decrease my annual income for 2020.” Twenty
percent also indicated that they have considered
relocating permanently away from the urban
city in which they currently live. This reveals the
difculty for workers in production and live music:
the majority have not been able to work remotely,
so the choice is either to wait it out until live
music comes back, potentially re-skill, or look to
leave the industry as a whole. Time will be the
only way to tell—38% said that they believe it
will take 1-2 years for their life to look more or
less like it did prior to COVID-19, thus it may be
2022 before we are able to see the true impact
on these sorts of occupations. Additionally, to
the same question, 32% said that they are “not
sure at this point” when things could be like they
did prior to COVID-19. This highlights how much
uncertainty there is within the industry, especially in occupations like lighting, audio, tech and live production where
a transition to remote work was not possible and also shows a great need to provide resources and funding to lift up
people in these occupations and their companies or venues.
With live music and events on hold, many in this eld have been forced to nd work outside the music industry.
Programs like the Tennessee Talent Exchange, an initiative of the Tennessee Department of Labor and Workforce
Development and powered by Jobs4TN, is designed to connect people displaced during the pandemic to jobs
in skills adjacent elds. For example, someone who worked in production for live shows, has skills needed in the
logistics eld. Connecting to a job in logistics to ll the gap allows workers to earn income, retain skills and gain
additional transferrable skills, in anticipation of a return to employment in the live music industry. People interested
in exploring such skills adjacent openings can do so on the Jobs4TN website.
184

WORKFORCE CATEGORY #5
RADIO
Standard Occupational Code Matches:
27-3011, Broadcast Announcers and Radio Disc Jockeys,
27-4012, Broadcast Technicians,
49-2021, Radio, Cellular, and Tower Equipment Installers and Repairers
Employment Growth and Projections, Total Employment and Self-Employment
The tables below illustrate the trajectory of employment growth that these occupations were on
in all selected peer regions up until second quarter 2020, along with the location quotient of the
occupation’s concentration.
SOC 27-4014, Sound Engineering Technicians, Total Employment
Atlanta
Austin
Chicago
Denver
Los Angeles
Memphis
Nashville
New Orleans
New York
USA
791
325
1,319
467
2,766
197
385
195
3,106
47,975
802
276
1,257
418
2,675
156
448
165
2,748
43,589
710
236
933
398
2,373
151
419
144
2,754
37,797
-11.5
-14.7
-25.8
-4.9
-11.3
-3.1
-6.5
-12.3
0.2
-13.3
-10.3
-27.6
-29.2
-14.8
-14.2
-23.3
9.0
-25.9
-11.3
-21.2
1.01
0.86
0.81
1.02
1.50
0.94
1.63
1.02
1.18
1.00
6.3%
6.2%
7.7%
6.6%
11.1%
5.3%
6.5%
9.0%
9.1%
7.5%
2010
Employment
2015
Employment
2020
Employment
5 Year
Historical
Growth
Rate (%)
Region
10 Year
Historical
Growth
Rate (%) LQ
Unemployment
Rate
While Nashville falls in the middle in terms of actual employment numbers, the city has the highest
location quotient of Broadcast announcers and Radio DJs comparatively. This may have something to
do with the fact that Nashville is the only MSA with a positive growth rate over the past 10 years and
has the second lowest unemployment rate of the group.
185

SOC 27-4012, Broadcast Technicians, Total Employment
Atlanta
Austin
Chicago
Denver
Los Angeles
Memphis
Nashville
New Orleans
New York
USA
919
230
943
480
2,716
92
194
108
4,035
36,018
1,246
199
913
482
2,805
85
202
108
3,926
34,373
1,147
182
744
426
2,745
76
188
97
3,927
30,887
-8.0
-8.8
-18.5
-11.6
-2.1
-10.7
-7.1
-10.8
0.0
-10.1
24.8
-20.9
-21.2
-11.3
1.1
-17.5
-3.0
-10.1
-2.7
-14.2
2.00
0.81
0.79
1.34
2.13
0.57
0.89
0.84
2.06
1.00
6.3%
5.3%
7.7%
5.8%
10.0%
4.5%
6.0%
8.1%
8.2%
6.9%
2010
Employment
2015
Employment
2020
Employment
5 Year
Historical
Growth
Rate (%)
Region
10 Year
Historical
Growth
Rate (%) LQ
Unemployment
Rate
In terms of Broadcast technicians, Nashville falls in the middle on all fronts: historical growth rate, LQ
and unemployment rate.
SOC 49-2021, Radio, Cellular, and Tower Equipment
Installers and Repairers, Total Employment
Atlanta
Austin
Chicago
Denver
Los Angeles
Memphis
Nashville
New Orleans
New York
USA
79
66
182
92
200
50
70
23
479
6,255
161
116
316
185
317
64
128
36
767
10,464
221
177
414
295
416
79
172
44
922
14,416
37.2
52.6
31.1
59.7
31.0
23.8
33.5
23.3
20.1
37.8
179.3
167.2
127.2
221.8
107.9
58.6
143.4
96.9
92.2
130.5
0.83
1.69
0.95
1.99
0.69
1.28
1.75
0.82
1.04
1.00
3.1%
2.5%
4.8%
2.6%
4.3%
3.1%
2.7%
3.8%
4.3%
3.3%
2010
Employment
2015
Employment
2020
Employment
5 Year
Historical
Growth
Rate (%)
Region
10 Year
Historical
Growth
Rate (%) LQ
Unemployment
Rate
For radio, cellular, and tower equipment installers and repairers it is notable that every MSA has seen
considerable positive employment growth over the past ve and 10 years. Nashville has the second highest
concentration of workers in this eld with an LQ of 1.75, and second lowest unemployment rate of 2.7%.
186

Occupational Projection Scenarios
In the tables below, the “base” columns are baseline forecasts applying past patterns to employment
numbers as of second quarter 2020 (as calculated using a four-quarter rolling average). The “recovery”
columns use a recovery scenario forecast that models an immediate dip in employment due to COVID
and operates on the assumption of a widely-spread vaccine by mid-2021.
Atlanta
Austin
Chicago
Denver
Los Angeles
Memphis
Nashville
New Orleans
New York
USA
710
236
933
398
2,373
151
419
144
2,754
37,797
712
239
921
398
2,352
149
420
143
2,720
37,486
691
230
893
388
2,256
145
406
138
2,631
36,460
714
242
909
398
2,330
147
421
142
2,687
37,177
738
249
939
411
2,412
152
435
147
2,773
38,406
2020
2021
Base
2021
Recovery
2022
Base
Region
2022
Recovery
2025
Base
2025
Recovery
1 Year %
Growth
Base
1 Year %
Growth
Recovery
2 Year %
Growth
Base
2 Year %
Growth
Recovery
5 Year %
Growth
Base
5 Year %
Growth
Recovery
719
250
874
397
2,267
142
424
139
2,590
36,267
746
259
906
411
2,358
147
440
145
2,683
37,568
0.3
1.2
-1.3
0.0
-0.9
-1.3
0.2
-0.7
-1.2
-0.8
-2.7
-2.5
-4.3
-2.5
-4.9
-4.0
-3.1
-4.2
-4.5
-3.5
0.5
2.4
-2.6
-0.1
-1.8
-2.5
0.5
-1.3
-2.4
-1.6
3.9
5.5
0.6
3.3
1.6
0.7
3.8
2.1
0.7
1.6
1.3
6.1
-6.3
-0.2
-4.4
-6.2
1.1
-3.3
-5.9
-4.0
5.1
9.7
-2.9
3.3
-0.6
-2.6
5.0
0.7
-2.6
-0.6
SOC 27-3011, Broadcast Announcers and Radio Disc Jockeys, Total Employment
In the dip and recovery scenario, all regions are experiencing positive growth in two years, but in ve
years only half are seeing positive growth, one of which is Nashville.
Atlanta
Austin
Chicago
Denver
Los Angeles
Memphis
Nashville
New Orleans
New York
USA
1,147
182
744
426
2,745
76
188
97
3,927
30,887
1,157
185
740
428
2,737
76
190
97
3,905
30,888
1,126
179
723
421
2,586
74
182
93
3,781
30,091
1,167
189
736
431
2,728
76
192
97
3,882
30,888
1,213
195
762
445
2,881
78
201
102
4,039
32,008
2020
2021
Base
2021
Recovery
2022
Base
Region
2022
Recovery
2025
Base
2025
Recovery
1 Year %
Growth
Base
1 Year %
Growth
Recovery
2 Year %
Growth
Base
2 Year %
Growth
Recovery
5 Year %
Growth
Base
5 Year %
Growth
Recovery
1,197
199
725
438
2,704
75
198
98
3,816
30,891
1,246
206
751
453
2,859
78
208
102
3,974
32,045
0.9
1.8
-0.5
0.6
-0.3
-0.3
1.1
0.2
-0.6
0
-1.8
-1.6
-2.8
-1.2
-5.8
-2.6
-3.2
-4.1
-3.7
-2.6
1.7
3.7
-1
1.1
-0.6
-0.6
2.1
0.3
-1.1
0
5.8
7.1
2.4
4.5
5
2.6
6.9
5.2
2.9
3.6
4.4
9.6
-2.5
2.8
-1.5
-1.5
5.4
0.8
-2.8
0
8.6
13.2
0.9
6.3
4.2
2.6
10.6
5.2
1.2
3.7
SOC 27-4012, Broadcast Technicians, Total Employment
187

188
For broadcast technicians in the dip and recovery scenario, all regions are projected to experience
positive growth by the second and the fth year with Nashville seeing the second highest projected
growth rate behind Austin.
Atlanta
Austin
Chicago
Denver
Los Angeles
Memphis
Nashville
New Orleans
New York
USA
221
177
414
295
416
79
172
44
922
14,416
223
181
413
299
415
79
175
44
916
14,486
223
181
412
299
415
79
174
44
915
14466
225
185
411
303
415
78
177
44
910
14556
228
187
417
306
420
79
179
44
923
14707
2020
2021
Base
2021
Recovery
2022
Base
Region
2022
Recovery
2025
Base
2025
Recovery
1 Year %
Growth
Base
1 Year %
Growth
Recovery
2 Year %
Growth
Base
2 Year %
Growth
Recovery
5 Year %
Growth
Base
5 Year %
Growth
Recovery
231
197
407
314
413
78
185
44
893
14768
234
199
413
318
419
78
187
44
906
14923
0.9
2.2
-0.3
1.3
-0.1
-0.4
1.5
-0.2
-0.6
0.5
0.9
2.3
-0.5
1.4
-0.2
0.0
1.2
0.0
-0.8
0.3
1.9
4.4
-0.7
2.6
-0.3
-0.8
3.0
-0.3
-1.3
1.0
3.2
5.6
0.7
3.7
1.0
0.0
4.1
0.0
0.1
2.0
4.7
11.3
-1.6
6.6
-0.7
-1.9
7.7
-0.8
-3.1
2.4
5.9
12.4
-0.2
7.8
0.7
-1.3
8.7
0.0
-1.7
3.5
SOC 49-2021, Radio, Cellular, and Tower Equipment Installers
and Repairers, Total Employment
In both the baseline and the dip and recovery scenarios, Nashville’s employment growth is high while four
regions are still experiencing a lag in recovery.
Wages
Atlanta
Austin
Chicago
Denver
Los Angeles
Memphis
Nashville
New Orleans
New York
USA
$65,200
$68,600
$83,400
$40,900
$107,400
$57,600
$77,500
$54,300
$122,400
$69,800
Annual
Experienced
Wage
Region
SOC 27-4098, Lighting Technicians and Media and
Communication Equipment Workers, All Other
$45,700
$47,400
$57,200
$15,700
$76,700
$40,000
$56,800
$28,500
$92,100
$48,700
Difference Between
Experienced and
Entry Level Wages
$31,300
$36,800
$45,800
$31,100
$53,400
$23,400
$31,300
$32,400
$58,100
$34,600
Annual
Median Wage
$19,500
$21,200
$26,200
$25,200
$30,700
$17,600
$20,700
$25,800
$30,300
$21,100
Annual Entry
Level Wage
$15.06
$17.69
$22.04
$14.94
$25.69
$11.25
$15.05
$15.57
$27.92
$16.65
Median
Hourly Wage

189
While Nashville falls in the middle across almost all wage categories for Broadcast announcers and Radio
DJs, there is a notable gap between entry level and experienced level wages with Nashville having the
third lowest annual entry level wage at $20,700.
Atlanta
Austin
Chicago
Denver
Los Angeles
Memphis
Nashville
New Orleans
New York
USA
$58,400
$52,600
$54,000
$69,500
$53,800
$45,800
$63,300
$53,900
$72,200
$57,900
Annual
Experienced
Wage
Region
SOC 27-4012, Broadcast Technicians
$33,600
$32,400
$30,400
$41,000
$25,900
$25,500
$30,200
$30,000
$36,300
$33,300
Difference Between
Experienced and
Entry Level Wages
$46,800
$35,800
$34,000
$54,100
$39,100
$32,400
$52,100
$39,000
$55,900
$40,600
Annual
Median Wage
$24,800
$20,200
$23,600
$28,500
$27,900
$20,300
$33,100
$23,900
$35,900
$24,600
Annual Entry
Level Wage
$22.48
$17.23
$16.36
$26.00
$18.81
$15.60
$25.05
$18.73
$26.89
$19.50
Median
Hourly Wage
In Nashville, Broadcast technicians make the third highest annual median wage behind New York and
Denver. However, if you consider the cost of living in each of those places, the wages in Nashville could
potentially go much further.
Atlanta
Austin
Chicago
Denver
Los Angeles
Memphis
Nashville
New Orleans
New York
USA
$70,200
$50,900
$61,900
$74,300
$73,000
$66,100
$99,800
$58,200
$74,300
$69,200
Annual
Experienced
Wage
Region
SOC 49-2021, Radio, Cellular, and Tower Equipment Installers and Repairers
$28,300
$23,300
$25,600
$44,500
$34,100
$33,400
$54,200
$18,500
$36,500
$34,200
Difference Between
Experienced and
Entry Level Wages
$59,200
$37,200
$49,700
$67,000
$61,000
$52,700
$86,800
$52,400
$58,700
$55,400
Annual
Median Wage
$41,900
$27,600
$36,300
$29,800
$38,900
$32,700
$45,600
$39,700
$37,800
$35,000
Annual Entry
Level Wage
$28.45
$17.87
$23.91
$32.21
$29.31
$25.36
$41.73
$25.18
$28.22
$26.63
Median
Hourly Wage

190
For wages for Radio, Cellular, and Tower Equipment Installers and Repairers, Nashville offers the
highest wages across all categories. While Nashville does have the largest difference between
experienced and entry level wages, the entry level annual wages are higher than all other MSAs. This
suggests the difference highlights the opportunity for wage growth rather than a disproportionate
distribution of wages across skill level.
Demographics
The following table aggregates these three occupations and provides comparative diversity rates
between music cities. The gure represents the percentage of the total workforce compared to the
national average for an area of the same size.
Atlanta
Austin
Chicago
Denver
Los Angeles
Memphis
Nashville
New Orleans
New York
Racial Diversity
Region
Workforce Category 5: Radio
Gender Diversity Retirement Risk
Percent of National Average for Equivalent Area
71%
120%
95%
86%
82%
98%
99%
112%
93%
151%
142%
118%
88%
155%
134%
79%
133%
113%
102%
107%
99%
78%
85%
102%
86%
100%
82%
The Nashville region has the third highest concentration of radio professionals over the age of 55 with
that percentage being just below the national average. Nashville is the least racially diverse when it
comes to radio professionals and is in the middle in terms of gender diversity.

191
Primary Data
Below are numbers and ndings from the Survey to the Music Industry from workers in AM/FM Radio, Internet
Radio and Satellite Radio.
First, we will look at work status. Thirty-eight percent indicate they are an Hourly, Salary or Recoupment-
Based Employee, 29.4% were self-employed, gig, contract or freelance workers and 20.6% were company
owners. While radio workers have a variety of means of employment, 100% of respondents have experienced
fewer work opportunities in response to COVID-19.
Many radio broadcast personnel reported struggling to nd any work at all. However, only 39.1% of
respondents claimed to have experienced unemployment since March which is well below the overall survey
average at 53.8%. This probably points to the ease with which radio personnel can continue to broadcast and
produce in a socially distant manner.
Eighty-nine percent of those who have
experienced unemployment since March said this
was due to COVID-19. However, 87.5% of people
in this category who applied for unemployment
funds were granted relief.
In terms of remote work, 31.8% have maintained
their work prociency, while 22.7% of respondents
in radio have claimed that their transition to remote
work increased their prociency. Only 27.3%
indicated that they have been unable to make the
transition to remote work, which is again below the
overall survey average (32.8%).
38.2%
29.4%
20.6%
0.00%
0.00%
11.8%
Work Status
Hourly, Salary, or Recoupment-Based Employee
Self-Employed / Gig-Based / Contract-Based / Freelance
Company Owner
Retired
Student
Unemployed
0.0%
100.0%
0.0%
Amount of work post COVID-19
More
Less
The same amount
88.9%
0.00%
11.1%
Was unemployment COVID related?
Yes
No
Unsure

192
Aside from the impact of COVID-19, 39.1% of workers in this category depend on multiple jobs to sustain
themselves, with 55.6% of these individuals citing cost of living as the primary reason.
On a grand scale, 95.8% of individuals in radio related professions projected that COVID-19 will decrease
their annual income for 2020. This drives reason for concern among the radio broadcasting community,
highlighting the fact that 80% of respondents indicate that they do not currently earn enough income to live
comfortably. While, radio workers may have faired better in terms of ability to transition to remote work, and
thus unemployment, the fact that so many cite not earning enough to live comfortably shows that they are still
greatly feeling negative economic repercussions from the pandemic.
22.7%
18.1%
31.8%
27.2%
How has COVID affected your work prociency?
Increased
Decreased
Maintained
Not relevant, as I have not been able to make the
transition to remote work during COVID-19.
192

193
Standard Occupational Code Matches:
SOC 25-1121: Art, Drama, and Music Teachers, Postsecondary,
SOC 25-2000: Preschool, Elementary, Middle, Secondary, and Special Education Teachers,
SOC 29-1125: Recreational Therapists.
WORKFORCE CATEGORY #6
MUSIC EDUCATION AND MUSIC THERAPY
These occupations represent musical education and therapy. However, to capture music teachers outside of
postsecondary education, all teachers must be considered due to classication limitations. For this reason,
aggregate totals of SOC 25-2000 are not considered, but growth trends, diversity, and projections are. The
LQ for SOC 25-2000: Preschool, Elementary, Middle, Secondary, and Special Education Teachers in the
Nashville MSA is 0.88.
Employment Growth and Projections, Total Employment
The tables below illustrate the trajectory of employment growth that these occupations were on in all selected
peer regions up until second quarter 2020, along with the location quotient of the occupation’s concentration.
SOC 25-1121, Art, Drama, and Music Teachers, Postsecondary, Total Employment
Atlanta
Austin
Chicago
Denver
Los Angeles
Memphis
Nashville
New Orleans
New York
USA
953
579
2,829
704
3,542
245
458
207
6,514
81,950
1,048
502
3,130
777
3,729
265
490
225
7,247
88,073
1,135
681
2,991
859
4,103
279
511
235
7,733
90,823
8.4
35.6
-4.4
10.6
10.0
5.3
4.4
4.2
6.7
3.1
19.2
17.5
5.7
22.1
15.8
13.6
11.6
13.5
18.7
10.8
0.67
1.03
1.08
0.92
1.08
0.72
0.83
0.69
1.38
1.00
6.7%
7.3%
8.2%
7.3%
10.8%
5.9%
6.6%
9.9%
8.9%
7.9%
2010
Employment
2015
Employment
2020
Employment
5 Year
Historical
Growth
Rate (%)
Region
10 Year
Historical
Growth
Rate (%) LQ
Unemployment
Rate
Over the past 10 years, every region has seen a positive growth rate of postsecondary art, drama and music
teachers with Chicago being the only city to see negative growth in the past ve years. While Nashville’s LQ
and historical growth rates falls in the middle amongst the other regions, it does have the second lowest
unemployment rate with only Memphis seeing fewer unemployed art, drama, and music teachers.

SOC 25-2000, Preschool, Elementary, Middle, Secondary,
and Special Education Teachers, Total Employment
Atlanta
Austin
Chicago
Denver
Los Angeles
Memphis
Nashville
New Orleans
New York
USA
77,917
25,862
134,021
32,649
132,396
18,625
21,472
15,445
272,741
4,069,749
74,519
28,294
133,491
36,614
128,519
16,970
22,506
15,483
272,174
3,996,065
79,056
28,891
131,664
39,627
132,255
18,096
24,309
15,479
280,526
4,046,272
6.1
2.1
-1.4
8.2
2.9
6.6
8.0
0.0
3.1
1.3
1.5
11.7
-1.8
21.4
-0.1
-2.8
13.2
0.2
2.9
-0.6
1.05
0.98
1.07
0.95
0.78
1.05
0.88
1.02
1.12
1.00
3.7%
3.7%
4.8%
3.9%
6.0%
3.5%
3.7%
5.3%
5.1%
4.4%
2010
Employment
2015
Employment
2020
Employment
5 Year
Historical
Growth
Rate (%)
Region
10 Year
Historical
Growth
Rate (%) LQ
Unemployment
Rate
SOC 29-1125, Recreational Therapists, Total Employment
Atlanta
Austin
Chicago
Denver
Los Angeles
Memphis
Nashville
New Orleans
New York
USA
289
119
555
141
522
75
245
88
1,401
21,133
271
119
521
152
560
75
109
87
1,270
20,154
266
119
476
155
570
76
105
80
1,196
19,125
-1.9
-0.7
-8.7
1.9
1.9
2.0
-3.7
-8.4
-5.8
-5.1
-7.8
-0.5
-14.2
10.0
9.3
0.7
-57.2
-9.4
-14.6
-9.5
0.75
0.85
0.82
0.79
0.71
0.93
0.81
1.12
1.01
1.00
1.0%
1.2%
1.3%
1.3%
1.9%
0.8%
1.1%
1.5%
1.6%
1.3%
2010
Employment
2015
Employment
2020
Employment
5 Year
Historical
Growth
Rate (%)
Region
10 Year
Historical
Growth
Rate (%) LQ
Unemployment
Rate
The Nashville region has lost a considerable number of recreational therapists over the past 10 years with a
57.2% reduction in workforce. However, the region’s LQ is still above that of Los Angeles, Atlanta and Denver.
194

195
Occupational Projection Scenarios
In the tables below, the “base” columns are baseline forecasts applying past patterns to employment
numbers as of second quarter 2020 (as calculated using a four-quarter rolling average). The “recovery”
columns use a recovery scenario forecast that models an immediate dip in employment due to COVID and
operates on the assumption of a widely-spread vaccine by mid-2021.
Atlanta
Austin
Chicago
Denver
Los Angeles
Memphis
Nashville
New Orleans
New York
USA
1,135
681
2,991
859
4,103
279
511
235
7,733
90,823
1,151
694
2,993
875
4,112
280
521
238
7,769
91,325
1,124
680
2,931
858
4,032
275
508
232
7,598
89,390
1,168
708
2,996
891
4,120
281
531
241
7,805
91,830
1,175
714
3,020
901
4,161
284
534
242
7,866
92,537
2020
2021
Base
2021
Recovery
2022
Base
Region
2022
Recovery
2025
Base
2025
Recovery
1 Year %
Growth
Base
1 Year %
Growth
Recovery
2 Year %
Growth
Base
2 Year %
Growth
Recovery
5 Year %
Growth
Base
5 Year %
Growth
Recovery
1,219
749
3,003
941
4,146
283
562
250
7,915
93,361
1,225
755
3,025
951
4,183
286
565
251
7,970
94,013
1.4
1.9
0.1
1.9
0.2
0.3
1.9
1.2
0.5
0.6
-1.0
-0.1
-2.0
-0.1
-1.7
-1.4
-0.6
-1.3
-1.7
-1.6
2.9
3.9
0.2
3.7
0.4
0.6
3.9
2.5
0.9
1.1
3.5
4.8
1.0
4.9
1.4
1.8
4.5
3.0
1.7
1.9
7.4
10.0
0.4
9.6
1.0
1.5
9.9
6.3
2.4
2.8
7.9
10.9
1.1
10.7
1.9
2.5
10.6
6.8
3.1
3.5
SOC 25-1121, Art, Drama, and Music Teachers, Postsecondary, Total Employment
In both the baseline and the dip and recovery scenarios for postsecondary Art, Drama and Music Teachers,
there is positive employment growth by year two for every region. This highlights the resiliency of adjacent
sectors of education which never fully stopped during the pandemic.
SOC 25-2000, Preschool, Elementary, Middle, Secondary,
and Special Education Teachers, Total Employment
Atlanta
Austin
Chicago
Denver
Los Angeles
Memphis
Nashville
New Orleans
New York
USA
79,056
28,891
131,664
39,627
132,255
18,096
24,309
15,479
280,526
4,046,272
79,738
29,482
131,077
40,117
132,332
18,126
24,671
15,590
280,271
4,058,677
78,420
28,998
128,903
39,462
130,152
17,837
24,279
15,341
275,552
3,994,963
80,427
30,085
130,492
40,614
132,409
18,156
25,039
15,701
280,017
4,071,119
81,782
30,574
132,680
41,251
134,461
18,443
25,432
15,926
284,513
4,138,555
2020
2021
Base
2021
Recovery
2022
Base
Region
2022
Recovery
2025
Base
2025
Recovery
1 Year %
Growth
Base
1 Year %
Growth
Recovery
2 Year %
Growth
Base
2 Year %
Growth
Recovery
5 Year %
Growth
Base
5 Year %
Growth
Recovery
82,528
31,969
128,753
42,141
132,640
18,247
26,174
16,038
279,254
4,108,676
83,972
32,506
130,993
42,820
134,749
18,543
26,597
16,270
283,872
4,178,645
0.9
2.0
-0.4
1.2
0.1
0.2
1.5
0.7
-0.1
0.3
-0.8
0.4
-2.1
-0.4
-1.6
-1.4
-0.1
-0.9
-1.8
-1.3
1.7
4.1
-0.9
2.5
0.1
0.3
3.0
1.4
-0.2
0.6
3.4
5.8
0.8
4.1
1.7
1.9
4.6
2.9
1.4
2.3
4.4
10.7
-2.2
6.3
0.3
0.8
7.7
3.6
-0.5
1.5
6.2
12.5
-0.5
8.1
1.9
2.5
9.4
5.1
1.2
3.3

196
In the dip and recovery scenario, all regions are experiencing positive growth by the second year and by the
fth year all regions are still except for Chicago. In the baseline scenario, every region is also experiencing
positive growth by the fth year except for New York and Chicago, but only by small margins.
SOC 29-1125, Recreational Therapists, Total Employment
Atlanta
Austin
Chicago
Denver
Los Angeles
Memphis
Nashville
New Orleans
New York
USA
266
119
476
155
570
76
105
80
1,196
19,125
270
122
478
158
575
76
107
81
1,205
19,267
265
120
469
155
561
75
105
80
1,179
18,897
274
125
479
162
581
77
108
82
1,214
19,411
272
125
477
160
575
77
108
81
1,203
19,291
2020
2021
Base
2021
Recovery
2022
Base
Region
2022
Recovery
2025
Base
2025
Recovery
1 Year %
Growth
Base
1 Year %
Growth
Recovery
2 Year %
Growth
Base
2 Year %
Growth
Recovery
5 Year %
Growth
Base
5 Year %
Growth
Recovery
287
135
484
173
598
78
114
84
1,242
19,847
285
134
482
171
591
78
113
83
1,229
19,710
1.5
2.6
0.3
2.2
1.0
0.6
1.6
1.0
0.8
0.7
-0.4
0.8
-1.5
0.0
-1.6
-1.3
0.0
0.0
-1.4
-1.2
3.0
5.2
0.7
4.4
1.9
1.3
3.3
2.0
1.5
1.5
2.3
5.0
0.2
3.2
0.9
1.3
2.9
1.3
0.6
0.9
7.8
13.5
1.7
11.3
4.9
3.2
8.5
5.2
3.8
3.8
7.1
12.6
1.3
10.3
3.7
2.6
7.6
3.8
2.8
3.1
In the second year and going forward, all regions are experiencing positive growth in both scenarios for
recreational therapists with all regions exceeding their employment levels from 2020 by the fth year.
Atlanta
Austin
Chicago
Denver
Los Angeles
Memphis
Nashville
New Orleans
New York
USA
$85,500
$95,500
$85,900
$75,200
$154,500
$69,300
$108,200
$70,100
$136,800
$104,700
Annual
Experienced
Wage
Region
SOC 25-1121, Art, Drama, and
Music Teachers, Postsecondary
$56,300
$43,800
$50,000
$39,900
$105,800
$34,900
$63,800
$29,500
$86,100
$64,500
Difference Between
Experienced and
Entry Level Wages
$61,900
$76,800
$59,600
$51,100
$105,200
$57,500
$63,400
$52,500
$91,600
$69,500
Annual
Median Wage
$29,200
$51,700
$35,900
$35,300
$48,700
$34,400
$44,400
$40,600
$50,700
$40,200
Annual Entry
Level Wage
$29.77
$36.91
$28.64
$24.56
$50.56
$27.64
$30.48
$25.22
$44.06
$33.43
Median
Hourly Wage

While the Nashville region falls in the middle in terms of median annual and hourly wages, it does have the
third highest annual experienced wage behind only that of New York and Los Angeles. It also falls within the
top four regions for annual entry level wages.
Atlanta
Austin
Chicago
Denver
Los Angeles
Memphis
Nashville
New Orleans
New York
USA
$67,600
$64,800
$79,400
$65,800
$93,900
$61,900
$60,200
$55,600
$98,200
$73,300
Annual
Experienced
Wage
Region
SOC 25-2000, Preschool, Elementary, Middle, Secondary,
and Special Education Teachers
$32,300
$27,600
$43,200
$27,600
$48,500
$24,000
$26,000
$15,700
$49,700
$37,000
Difference Between
Experienced and
Entry Level Wages
$56,600
$56,000
$62,100
$54,800
$80,600
$55,100
$51,200
$49,800
$79,400
$57,800
Annual
Median Wage
$35,300
$37,200
$36,200
$38,200
$45,400
$37,900
$34,200
$39,900
$48,500
$36,300
Annual Entry
Level Wage
$27.23
$26.95
$29.84
$26.36
$38.76
$26.50
$24.62
$23.92
$38.17
$27.77
Median
Hourly Wage
Nashville pays some of the lowest wages across the comparative regions for Preschool, Elementary, Middle,
Secondary, and Special Education Teachers. Nashville has one of the lowest differences between experienced
and entry level wages. This is an area where Nashville can strive to make changes in terms of how these
education professionals are compensated for their work.
Atlanta
Austin
Chicago
Denver
Los Angeles
Memphis
Nashville
New Orleans
New York
USA
$54,200
$55,600
$57,900
$52,300
$86,900
$57,400
$50,900
$51,600
$69,000
$60,200
Annual
Experienced
Wage
Region
SOC 25-2000, Preschool, Elementary, Middle, Secondary, and Special Education Teachers
$21,800
$20,100
$27,700
$19,600
$42,500
$21,100
$22,900
$18,200
$27,000
$27,200
Difference Between
Experienced and
Entry Level Wages
$44,800
$49,500
$44,900
$43,100
$73,100
$49,400
$41,900
$46,800
$58,500
$48,200
Annual
Median Wage
$32,400
$35,500
$30,200
$32,700
$44,400
$36,300
$28,000
$33,400
$42,000
$33,000
Annual Entry
Level Wage
$21.53
$23.78
$21.60
$20.74
$35.17
$23.76
$20.12
$22.52
$28.12
$23.18
Median
Hourly Wage
The picture in terms of wages for recreational therapists looks pretty similar to Preschool, Elementary, Middle,
Secondary and Special Education Teachers with wages being notably lower than the other music regions.
197

198
Demographics
The following table aggregates these three occupations and provides comparative diversity rates between
music cities. The gure represents the percent the composition of the total workforce is compared to the
national average for an area of the same size.
Atlanta
Austin
Chicago
Denver
Los Angeles
Memphis
Nashville
New Orleans
New York
Racial Diversity
Region
Workforce Category 6: Music Education and Music Therapy
Gender Diversity Retirement Risk
Percent of National Average for Equivalent Area
88%
83%
95%
86%
97%
104%
99%
98%
108%
133%
162%
96%
71%
173%
86%
65%
133%
114%
109%
101%
100%
100%
93%
105%
102%
100%
96%
Primary Data
Below are numbers and ndings from the Survey to the Music Industry from music educators or therapists.
In terms of work status, 55% of music educators and therapists are self-employed and 86% work a second job
to support their cost of living. Many indicate that they work as recording artists and studio musicians, which
are the highest overlapping jobs. Additionally, more than half (55%) of music educators and teachers have
been in the music industry for over 20 years.
About 97% of music educators and therapists who experienced unemployment since March report it was due
to COVID-19, and 86% report seeing less work because of the pandemic.
This could be due to music studio, school and university closures.

96.8%
1.6%
1.6%
Have you been unemployed due to COVID-19?
Yes
No
Unsure
The transition to remote work as a result of
COVID-19 has my
working prociency on a day-to-day basis.
Do you believe COVID-19 will affect your annual
income for 2020?
Yes, COVID-19 will increase
my annual income for 2020.
Yes, COVID-19 will decrease
my annual income for 2020.
No, COVID-19 will not affect
my annual income for 2020.
1.9%
85.7%
12.4%
199
Primary Data
Music education and therapy relies heavily on
in-person and group interactions. For example,
a band teacher requires multiple students
to be in a room to practice as an ensemble.
Twenty-one percent have found it hard to
adapt to remote work and 36% report that
their work prociency has decreased as a result
of COVID-19. However, 21% have reported
increased work prociency which could point to
the ease with which a private music instructor
could meet with a student or multiple students
via video call, for example.
In terms of future outlook, about 44% of
music educators do not believe their current
occupations will provide a comfortable
standard of living this year. Also, 86% reported
that COVID-19 will decrease their annual
income. Additionally, while unemployment
is high in this category, only 9% of music
educators lack health insurance. Most either
receive insurance through the marketplace
or their employer. However, 67% of music
educators have reported that COVID-19 has
negatively impacted their mental health.
All other relevant survey data has been included in the Appendix.
20.6%
36.1%
22.7%
20.6%
Increased
Decreased
Maintained
Not relevant, as I have not
been able to make the
transition to remote work
during COVID-19.

200
Standard Occupational Code Matches:
13-1011: Agents and Business Managers of Artists, Performers, and Athletes,
11-9198: Personal Service Managers, All Other,
11-2032: Public Relations Managers,
27-3030: Public Relations Specialists,
11-2021: Marketing Managers,
13-1160: Market Research Analysts and Marketing Specialists,
27-1024: Graphic Designers,
27-3020: News Analysts, Reporters, and Journalists
Artist and Business Managers correspond with SOC codes already addressed in Workforce Category
Three: Live Music, Non-Technical Occupations. These occupations are included here, in the demographic
breakdown.
Find tables for this workforce category in the Workforce Appendix. They are not included in this report
because of the prohibitive length and because the information available by SOC code applies to a large
amount of jobs that function outside of the music or entertainment sectors. While the occupation growth
patterns and wages still apply to those that function within the music industry, because there is such large
overlap with other industry sectors the research team felt the demographic and primary research data best
captured the landscape of these eight occupations as they relate to the music industry specically.
Demographics
Atlanta
Austin
Chicago
Denver
Los Angeles
Memphis
Nashville
New Orleans
New York
Racial Diversity
Region
Workforce Category 7: PR, Journalism, Social Media and Creative Agency
Gender Diversity Retirement Risk
Percent of National Average for Equivalent Area
91%
78%
92%
90%
99%
113%
96%
121%
85%
124%
126%
99%
70%
177%
96%
59%
97%
124%
105%
104%
103%
107%
97%
95%
98%
91%
106%
WORKFORCE CATEGORY #7
PUBLIC RELATIONS, JOURNALISM,
SOCIAL MEDIA, CREATIVE AGENCY,
ARTIST & BUSINESS MANAGERS

201
Jobs in PR, Journalism, Social Media and Creative Agencies in the Nashville region are far below the national
average when it comes to racial diversity, but rank very close to the national average in terms of retirement
risk and gender diversity.
Below are insights from the Survey to the Music Industry from people who identied their professional capacity
in the music industry as either Public Relations, Journalism, Social Media, Creative Agency, Artist Manager,
Business Manager or Personal Managers.
Workers represented in this segment are a relatively young demographic, with 46% of respondents in this
category being between the ages of 20-34. This occupational group is also highly educated with 73% of
respondents achieving a bachelor’s, graduate or professional degree. However, like many other music industry
workers, opportunities have taken a hit for individuals in this segment with 81% of respondents experiencing
less work since the onset of COVID-19
Primary Data
$12,761 - $25,000
$25,001 - $36,000
$36,001 - $45,000
$45,001 - $55,000
$55,001 - $70,000
$70,001 - $100,000
$100,001 - $200,000
More than $200,001
Prefer Not To Say
$0 - $12,760
11.5%
12.5%
7.3%
9.4%
12.5%
12.5%
4.2%
3.1%
10.4%
16.6%
2020 Projected Annual Income
Though individuals in this category have experienced
difculty, they have also displayed resilience. 57%
of respondents either increased or maintained their
work prociency remotely—but this gure only
applies to those who were able to maintain their
jobs. 34% of respondents in this category have
experienced unemployment since March 2020.
90% of unemployed respondents associate their
lost employment with the COVID-19 pandemic.
Fortunately, many of these individuals were able
to nd support. 74% of unemployed respondents
received unemployment benets after applying.
In terms of outlook, 17% anticipate making less
than $12,760 in 2020. This goes along with nearly
70% foreseeing a decrease in their 2020 income. In
comparison to pre-COVID employment, there was
a 35% increase in the number of respondents who
could not currently afford a comfortable standard
of living. Therefore, while many have been able to
make the transition to remote work, this shows that
the pandemic has still hit them in terms of things like
wages, standard of living and mental health (73%
indicate that COVID-19 has negatively impacted their
mental health).
Remote Prociency
Increased
19.8%
Maintained
37.2%
Decreased
27.9%
Not relevant,
as I have not
been able to
make the
transition
to remote
work during
COVID-19.
15.1%

202
Standard Occupational Code Matches:
23-1011: Lawyers,
23-2010: Paralegals and Legal Assistants,
43-6012: Legal Secretaries and Administrative Assistants,
41-3030: Securities, Commodities, and Financial Services Sales Agents,
13-2050: Financial Analysts and Advisors,
11-3030: Financial Managers,
13-2010: Accountants and Auditors
WORKFORCE CATEGORY #8
FINANCIAL PLANNING, CONSULTING,
BANKING, ACCOUNTING,
& ENTERTAINMENT LAW
Find tables for this workforce category in the Workforce Appendix. They are not included in this report
because of the prohibitive length and because the information available by SOC code applies to a large
amount of jobs that function outside of the music or entertainment sectors. While the occupation growth
patterns and wages still apply to those that function within the music industry, because there is such large
overlap with other industry sectors the research team felt the demographic and primary research data best
captured the landscape of these seven occupations as they relate to the music industry specically.
Demographics
Atlanta
Austin
Chicago
Denver
Los Angeles
Memphis
Nashville
New Orleans
New York
Racial Diversity
Region
Workforce Category 6: Music Education and Music Therapy
Gender Diversity Retirement Risk
Percent of National Average for Equivalent Area
88%
85%
94%
94%
99%
103%
88%
112%
88%
129%
125%
97%
68%
180%
91%
60%
77%
128%
106%
100%
94%
99%
97%
107%
102%
114%
84%

203
In terms of law and nance the Nashville region is lower than the national average in terms of retirement
risk which is good in terms of talent retention; however, the region is considerably lower than the national
average when it comes to racial diversity. The Nashville region is above average in terms of gender diversity.
Primary Data
Below are numbers and ndings from the Survey to the Music Industry from people that indicate they work in
nancial, accounting and law services related to the music industry.
In terms of work status, most indicate they are salary-based employees or company owners. Only 26% are
self-employed or work as freelancers. Out of the participants surveyed, about 50% have over 20 years of
experience in the music industry. Fortunately, only 20% of survey participants in this category indicate they
experienced unemployment since March and those who experienced unemployment list COVID-19 as the
reason. Although the pandemic has not negatively impacted employment as dramatically in this category,
63% are seeing less work because of the pandemic and about 55% are sure that the pandemic will negatively
affect their income.
Many jobs in this category are ofce-related
making it easier for these occupations
to transition to remote work during the
pandemic. Most (over 70%) nancial
planners, accountants and lawyers
maintained or increased their prociency
when transitioning to remote work.
Overall, the pandemic did not negatively
affect employment in this job category. All
other relevant survey information has been
included in the Appendix.
The transition to remote work as a result of
COVID-19 has my
working prociency on a day-to-day basis.
22
17
47.5
13.6
Increased
Decreased
Maintained
Not relevant, as I have not
been able to make the
transition to remote work
during COVID-19.
20%
80%
Have you been unemployed due to COVID-19?
Yes
No
204
WORKFORCE CATEGORY #9
MUSIC PUBLISHING CREATIVE OCCUPATIONS,
SYNC LICENSING, ADVERTISING,
CATALOG ADMINISTRATION,
RIGHTS MANAGEMENT,
METADATA ORGANIZATIONS,
PERFORMANCE OR MECHANICAL COPYRIGHT
SOCIETY OPERATIONS,
RECORD LABEL OPERATIONS
27-3043: Writers and Authors,
27-2040: Musicians and Singers,
27-3031: Public Relations Specialists, and
13-1161: Market Research Analysts and Marketing Specialists
Standard Occupational Code Matches:
27-2012: Producers and Directors,
27-1011: Art Directors,
41-3011: Advertising Sales Agents,
11-2011: Advertising and Promotions Managers,
11-1012: General and Operations Managers, and
11-1011: Chief Executives
This category spans a large number of occupations. Top-line occupations include the SOCs below,
but occupations included in the demographic metrics that have already been evaluated include:
Find tables for this workforce category in the Workforce Appendix. They are not included in this
report because of the prohibitive length and because the information available by SOC code
applies to a large amount of jobs that function outside of the music or entertainment sectors.
While the occupation growth patterns and wages still apply to those that function within the music
industry, because there is such large overlap with other industry sectors the research team felt the
demographic and primary research data best captured the landscape of these ten occupations
as they relate to the music industry specically. It is notable that music publishing operations are
a huge part of the Nashville music industry, and this decision is not reective of the opposite.
Instead, it is a decision based on how occupational data is made available.

205
Demographics
Atlanta
Austin
Chicago
Denver
Los Angeles
Memphis
Nashville
New Orleans
New York
Racial Diversity
Region
Workforce Category 9: Creative Agency
Gender Diversity Retirement Risk
Percent of National Average for Equivalent Area
91%
78%
98%
88%
96%
106%
101%
103%
--
127%
130%
102%
74%
181%
106%
61%
102%
--
104%
101%
101%
109%
100%
98%
95%
95%
--
Nashville is much lower than the national average when it comes to both racial and gender diversity in music
publishing and other creative occupations. It also ranks the lowest compared to all peer music cities.
Below are numbers and ndings from Survey to the Music Industry from people that indicate they work
in Music Publishing, Creative Operations, Sync Licensing, Advertising, Catalog Administration, Rights
Management, Metadata Organizations, Performance or Mechanical Copyright Society Operations, and Record
Label Operations.
It is notable that of the professionals in these jobs 21% have some college education, 56% have a bachelor’s
degree and 17% have a graduate or professional degree. These jobs have more workers with a formal
education than other areas of the music industry in which a formal education may not be necessary.
Twenty-seven percent of survey respondents are newcomers to these occupations, having zero to ve
years of experience. However, 34% are veterans with 21+ years of experience. This shows that while there is
a prevalence of seasoned workers there is still opportunity for those looking to break into elds like Music
Publishing, Creative Operations, Sync Licensing, Advertising, Catalog Administration, Rights Management,
Metadata Organizations, Performance or Mechanical Copyright Society Operations and Record Label
Operations.
Most have maintained their work prociency with almost the same amount increasing productivity (28%) as
decreasing (23%). Additionally, only 8% indicate not being able to make the transition to remote work, which
is well below the overall survey average of 33%. This is likely due to many of these jobs being more ofce-
related or having functions that could still be done remotely.
Primary Data

206
The transition to remote work as a result of COVID-19
has my working proficiency on a
day-to-day basis.
Increased
28%
Maintained
42%
Decreased
23%
Not relevant,
as I have not
been able to
make the
transition
to remote
work during
COVID-19.
8%
The ability to work remotely
has also inuenced people’s
work status, with only 28%
reporting having experienced
unemployment since March.
This is much lower than other
groups who have experienced
unemployment during this time.
Of those unemployed, 84% say
their unemployment was due to
COVID-19.
COVID-19 has negatively impacted mental health for
57.5% of respondents.
Yes, positively
10.1%
No
32.5%
Yes, negatively
57.5%
Most people in this eld do not have more than one job. When the few who had a second job were asked why text
responses include many entrepreneurs who have multiple businesses either funded by their day job or related to
their other means of work. 50% cite the need to support their costs of living. Most respondents seem to either
need a second job for monetary reasons or choose to pursue one as an entrepreneurial or creative endeavor.
$12,761 - $25,000
$25,001 - $36,000
$36,001 - $45,000
$45,001 - $55,000
$55,001 - $70,000
$70,001 - $100,000
$100,001 - $200,000
More than $200,001
Prefer Not To Say
$0 - $12,760
8.50%
9.68%
6.45%
8.80%
11.14%
12.02%
9.68%
4.69%
16.42%
12.61%
2020 Projected Annual Income
When asked: “Does your current
work in the music industry provide
enough income for a comfortable
standard of living?” the response
is almost tied yes to no: 37.5% no
versus 29.2% yes. Before COVID,
this was a different story: 43.8%
yes and 25% more often yes than
no. This shows that while these jobs
have faired well with the transition
to remote work, they have still taken
hits when it comes to pay like many
others have as well.

207
WORKFORCE CATEGORY #1O
TECHNOLOGY DEVELOPMENT, SOFTWARE
ENGINEERING, DIGITAL SERVICE PLATFORMS,
RESEARCH ANALYTICS
Standard Occupational Code Matches:
15-1251: Computer Programmers,
15-1245: Database Administrators and Architects,
15-1257: Web Developers and Digital Interface Designers,
15-1256: Software Developers and Software Quality Assurance Analysts and Testers
Find tables for this workforce category in the Workforce Appendix. They are not included in this report
because of the prohibitive length and because the information available by SOC code applies to a large
amount of jobs that function outside of the music or entertainment sectors. While the occupation growth
patterns and wages still apply to those that function within the music industry, because there is such large
overlap with other industry sectors the research team felt the demographic and primary research data best
captured the landscape of these four occupations as they relate to the music industry specically.
Demographics
Workforce Category 10: Tech, including “Computer Occupations, All Other”
Atlanta
Austin
Chicago
Denver
Los Angeles
Memphis
Nashville
New Orleans
New York
Racial Diversity
Region
Gender Diversity Retirement Risk
Percent of National Average for Equivalent Area
98%
73%
98%
101%
99%
112%
92%
124%
94%
118%
105%
106%
62%
152%
87%
63%
76%
128%
110%
94%
97%
99%
98%
120%
107%
116%
96%
In terms of tech and computer occupations, Nashville’s is much lower than the national average in racial
diversity but above average for gender diversity in the eld. Nashville’s retirement risk is slightly lower than
the national average, indicating slightly more talent retention in this job category.

208
Below are numbers and ndings from the Survey to the Music Industry from people who indicate they work
in Technology Development, Software Engineering, Digital Service Platform Operations (Research, Analytics,
Content, Design, Software, etc.) related to the music industry.
Survey demographics for this workforce category skew toward white men aged 35-44, which corresponds to
demographics in the broader information technology workforce.
Most have a degree of education beyond their high school diploma, with 25% holding a graduate or
professional degree. Additionally, there are many new entrants to this line of work with only 0-5 years of
experience. This is likely due to the music industry’s demand for qualied workers in this eld increasing as
new technology and software directed for the music industry emerges.
In terms of work status, 51% of people surveyed are hourly or salary-based employees. Given the nature of
digital technology, it follows that many people in these elds have maintained (47%) or increased (28%) their
working prociency through this time of remote work.
Only 25% have experienced unemployment since March due to COVID-19 compared to the overall survey
average of 53.8% average, and for those who applied, only half received unemployment benets.
COVID-19 has negatively impacted mental health for 54.1% of respondents well below the Survey to the
Music Industry average of 66.1%. This would imply a negative correlation between unemployment and
mental health. Because people in this eld have seen comparatively less unemployment since March, their
mental health has not declined.
An equal number of people in these elds said COVID-19 will not affect their annual incomes for 2020 as
those who said COVID-19 will decrease their annual income for 2020. Again, this implies that people in the
technology workforce are faring statistically better than others.
Primary Data
92

209
WORKFORCE CATEGORY #11
BRICK & MORTAR MUSIC RETAIL OPERATIONS
These top-line occupations exist both within and outside of the music industry. Aggregate employment
numbers are not provided. This segment also contains some occupations involved with merchandising
warehousing and distribution. SOC 53-3033: Light Truck Drivers, can be found in Workforce Category Four:
Live Music, Technical and Operations, so while it is not included in the top-line occupations it is included in
the Demographics group below.
Standard Occupational Code Matches:
41-2031: Retail Salespersons,
41-1011: First-Line Supervisors of Retail Sales Workers,
49-9063: Musical Instrument Repairers and Tuners,
53-7065: Stockers and Order Fillers,
53-7062: Laborers and Freight, Stock, and Material Movers, Hand,
53-7199: First-Line Supervisors of Transportation and Material Moving Workers, Except Aircraft
Cargo Handling Supervisors
53-3032: Heavy and Tractor-Trailer Truck Drivers
Find tables for this workforce category in the Workforce Appendix. They are not included in this report
because of the prohibitive length and because the information available by SOC code applies to a large
amount of jobs that function outside of the music or entertainment sectors. While the occupation growth
patterns and wages still apply to those that function within the music industry, because there is such large
overlap with other industry sectors the research team felt the demographic and primary research data best
captured the landscape of these seven occupations as they relate to the music industry specically.
Demographics
Atlanta
Austin
Chicago
Denver
Los Angeles
Memphis
Nashville
New Orleans
New York
Racial Diversity
Region
Workforce Category 9: Creative Agency
Gender Diversity Retirement Risk
Percent of National Average for Equivalent Area
87%
81%
97%
98%
90%
95%
92%
97%
96%
141%
135%
113%
89%
177%
142%
77%
123%
135%
104%
108%
97%
104%
97%
100%
98%
107%
104%

210
In terms of Brick & Mortar Music Retail Operations, Nashville is the least racially diverse, but close to the
national average for gender diversity. The retirement risk for retail and merchandise occupations is slightly
lower than the national average in the Nashville region.
Below are numbers and ndings from the Survey to the Music Industry from people who indicate they work in
Brick and Mortar Retail for Music Products (e.g. Vinyl, Sheet Music, Instruments, Gear, Merch).
Seventy percent of people surveyed are either company owners or hourly / salary-based employees. All music
retailers surveyed are seeing less work since the onset of COVID-19.
Thirty-four percent of music retailers surveyed are discovering they have been able to maintain their working
prociency since moving to remote work. This could capture people that either already had or have easily
transitioned to e-commerce to sell their merchandise. However, 40% have not been able to make the transition
which likely captures those in retail who were heavily involved with in-store business and management.
Primary Data
The transition to remote work as a result of COVID-19
has my working proficiency on a
day-to-day basis.
A third of people surveyed have more than
one job, mostly to support their costs of
living. Fifty-nine percent of respondents
were self-employed or worked for a
company with ve or less employees.
What size is your company or organization?
Sole proprietorship
1-5 employees
6-10 employees
11-15 employees
16-20 employees
20-50 employees
51-100 employees
100+ employees
20.7%
37.9%
10.3%
6.9%
0.0%
13.8%
3.5%
6.9%
5.7%
20.0%
34.3%
40.0%
Increased
Decreased
Maintained
Not relevant, as I have not
been able to make the
transition to remote work
during COVID-19.

211
Fifty percent have experienced unemployment since March. Out of those who applied, only slightly under
half received unemployment benets. Unemployment was due to COVID-19 for ALL survey respondents.
Eighty-ve percent of respondents in this eld received a Stimulus Check for $1,200 under the CARES Act
which could have been considerably helpful amidst the pandemic since the majority of respondents work for
microbusinesses or for themselves.
Seventy-one percent have not considered relocating from an urban center. Brick and mortar retailers seem
to be more hesitant to leave a certain geography over those in other workforce categories. This can be seen
especially when compared to the overall survey average which was 65.5%.
COVID-19 will decrease annual income for 76.3% of survey respondents. When asked: “Does your current
work in the music industry provide enough income for a comfortable standard of living?” all respondents
said “No” or “more often no than yes.” Before COVID-19, this was the opposite.
Before COVID-19, did your current work alone provide
enough income for a comfortable standard of living?
Yes
No
More often yes than no
More often no than yes
Not relevant as I do not have the same job/role
44.4%
0%
44.4%
0%
11.1%
211

212
REFLECTIONS FROM
THE MUSIC WORKFORCE
The music workforce has been hit hard by COVID-19. Income projections fall behind what the workforce was
making the previous year.
In the Survey to the Music Industry, 43% of the workforce reports they expect it will be at least one year
before they can live their lives more or less like they did before COVID-19.
However, without diminishing the seriousness of this situation and struggle, there are bits of positivity found
in the data.
In the COVID-19 projection scenario, 94% of all occupations meet or exceed 2020 employment numbers in
2022 at the national level.
This compares to 98% in the Atlanta, Austin, Denver and Nashville regions, 87% in the Chicago and New
York regions, 92% in the Los Angeles Region, 83% in the Memphis region, 91% in the New Orleans region.
$0-$12,760
$12,761 $25,000
$25,0001-$36,000
$36,001-$45,000
$45,001-$55,000
$55,001-$70,000
$70,001-$100,000
$100,001-$200,000
More than $200,0001
0 50 100 150 200 250 300
2019
2020
2019 Annual Income vs. 2020 Projected Annual Income

213
Michelle Cable, founder and owner of Panache Booking and Panache Management, nds this time to
be a good one to center herself and focus on the more important things in life. She says “I think a lot
of people who work in the music industry never get breaks as it’s a 24/7 rollercoaster, so hopefully
everyone will get to connect a little more with themselves and their families and come out of this
better. The silver lining for me is I get to spend so much more time with my son who’s now 17
months old. I think people will be more respectful and understanding about working moms and
their schedules too!”
Survey respondents, when asked about positive opportunities they’ve experienced as a result
of COVID-19, shared:
“New grist for the
songwriting mill!”
“Been able to do more strictly creative/for fun
projects that I normally would have declined.”
“More time for creating” “More time to practice.” “Renewed focus.”
WHEN IT COMES TO CREATIVITY
WHEN IT COMES TO FRIENDS, FAMILY AND SELF
“I have invested in the belief that ‘necessity is the mother of
invention!’ This time has encouraged me to stay in touch with my
friends and resources and to be a reliable resource for them.”
“Been able to do more strictly creative/for fun
projects that I normally would have declined.”
“I’ve been learning a lot online to better
myself if this continues into 2021.”
“I’m writing a memoir.”
“More family time, learned some new
recipes, learned more about myself.”
“I have enjoyed being home more and learning to garden.”
“Being home with my pregnant wife.”

214
WHEN IT COMES TO ECONOMIC OPPORTUNITY
“My company was born during COVID-19, as my prior job (outside
the music industry) was shut down for a long period of time.”
“Streaming constantly (over 150 shows since COVID-19), engaged
new people, upgraded my entire technical presence, learned many
new skills and platforms. Lemonade, baby.”
“I’ve started acquiring additional skillsets in the areas of studio
engineering, programming, and mixing which I hope will add some
other income streams for me in the future.”
“Made some progress in organizing my catalog…
always like mucking out the Augean stables…”
“The trade organization I run has benetted from the extra time music creators
have to focus on advocacy. Our membership has increased, and the community has
become tighter as we’ve circled the wagons to support one another.”
“Gone is the constant stress I used to feel to take as many gigs as possible and ll my
schedule to the brim, sacricing sleep and sanity. I’ve been gratefully able to transition
to teaching virtual violin lessons, which offers more exibility and freedom than I had
before. It only covers about half of the income that I used to make when I performed
regularly, but I am hopeful I can keep growing my student load. I’ve also been able to
home in on what types of gigs I miss the most and want to take in the future.”
“Converted all of my private lessons from in-person/in-studio to on-line/
virtual format done from my home. Exponentially lower travel expenses.”


216
THE FINALE
2O13 FOLLOW-UP
The 2013 Music Industry Study conducted by the Nashville Area Chamber of Commerce Research Center
included trends and recommendations. Updates and continued opportunities for growth are offered below as
follow-up to some of the more prescient recommendations.
The 2013 report challenged Nashville to move to a “next level” of global music operations that could realize a
doubling of the current $9.7 billion music industry impact by 2025.
Since the 2013 Music Industry Study conducted by the Nashville Area Chamber of
Commerce, the Music and Entertainment Industry in the Nashville MSA has signicantly
increased its economic effect. Since 2013, the effect on total jobs increased 43% (24,000)
from 56,520 to 80,757. The impact on labor income has gone up by 94% ($3 billion) from
$3.2 billion to $6.3 billion. The contribution to GDP by the Music and Entertainment
Industry went up by 80% ($4.4 billion) from $5.5 billion to $9.9 billion and the overall
economic impact of the Music and Entertainment Industry grew by 62% ($6.0 billion)
going from $9.7 billion to $15.6 billion. Therefore, making a doubling of the 2013 economic
impact very real by the year 2025, if not sooner.
The 2013 report noted that Nashville’s density of music industry activity was, at that time, two to 30 times greater
than the nation overall, up to 10 times greater than New York or Los Angeles and even greater compared to
other cities such as Atlanta, Austin and New Orleans.
The 2020 music density continues to growgrow, with LQ now ranging from 1.3 - 39.7.
With an overall LQ of 6.1 for the music industry, the Nashville MSA has an employment
concentration triple that of the Los Angeles area (LQ 2.2) and nearly ve times that of New
York City’s MSA (LQ 1.4). To further illustrate this point, long term job specialization growth
(2012 – 2019) in the music industry is highest in the Nashville MSA with the Los Angeles
area coming in second followed by New York.
2O13
UPDATE
2O19
2O13
UPDATE
2O19

217
Music Publishers
Record Production and Distribution
Other Sound Recording Industries
Musical Intrument Manufacturing
Sound Recording Studios
Musical Groups and Artists
Software; Other Prerecorded
Radio Networks
Radio Stations
Total
39.70
24.75
7.58
7.45
6.18
6.18
3.32
2.69
1.34
6.11
5.09
4.70
1.87
1.72
4.09
2.85
1.59
1.71
0.77
2.16
1.82
3.89
1.25
1.72
1.70
1.38
0.57
1.76
0.87
1.37
1.22
0.79
1.64
1.30
2.42
1.30
2.25
0.45
0.75
1.13
0.51
1.38
0.76
0.83
0.81
0.95
2.08
0.57
0.61
0.84
0.10
0.19
0.68
0.12
1.01
1.00
2.44
1.43
1.06
1.00
1.14
1.62
1.43
0.08
1.70
0.94
1.18
0.59
1.11
1.00
1.20
0.88
1.03
0.41
0.93
1.10
2.48
0.14
1.27
1.07
1.50
1.03
0.18
0.03
1.03
1.83
0.03
1.13
0.62
1.09
Nashville
Los
Angeles
New
York
Austin Chicago Denver Miami Memphis
New
Orleans
Industry Description
Location Quotient Table (2019)
The 2013 report noted core employment in the music industry in Nashville per 1,000 population and per 1,000
total employment exceeds all other U.S. cities by large margins and New York and Los Angeles by 2.5 to 4 times.
In the 2020 report we look at core employment and employment density in terms of
location quotient which is the ratio of an occupation’s share of employment in a given area
relative to that occupation’s share in the US as a whole. With a LQ of 6.1 for music industry
occupations, the Nashville MSA has an employment concentration triple that of the Los
Angeles area (LQ 2.2) and nearly ve times that of New York City’s MSA (LQ 1.4). To further
illustrate this point, long term job specialization growth (2012 – 2019) in the music industry
is highest in the Nashville MSA, with the Los Angeles area coming in second followed by
New York. What is remarkable about job growth in the Nashville Region is that even in
terms of net job growth over the last ten years, the Nashville MSA has had ve times the
job growth of Los Angeles and 200 times the job growth of New York.
2O13
UPDATE
2O19

218
On May 4, 2018 British Airways ofcially launched a nonstop ight from Nashville to London. Prior to
COVID-19 this ight was offered ve days a week. It was acknowledged at the time of the announcement
that this ight would greatly impact the already strong business connection between London and
Nashville. As then-Mayor of Nashville, Megan Barry noted, “With Nashville as the leading economic
engine in the state, this new service will be a difference maker as the city’s momentum continues on all
fronts – business development and tourism.”
Additionally, in 2016 the Nashville Meets London Festival was founded. The festival provides
opportunities to promote the globalization of Americana and Country music. The festival features
established and new talent from Nashville and is co-produced by Peter Conway Management and
Nashville-based agency, The AristoMedia Group. In 2018, Nashville Meets London established a
residency that takes place the last Wednesday of every month at the live music venue, PizzaExpress Live.
Each acoustic show features two rising country music artists, one from the UK and one from the US.
The 2013 report recognized lm as the sibling industry that sustains growth of the Nashville-based music industry
into an international cultural content center.
Since 2013, Tennessee and the Nashville region’s lm industry has seen considerable growth. Popular
shows like Nashville not only lm on location in the city, but also highlight and showcase Nashville and
the region to thousands of viewers for six seasons. In 2014, the Nashville Convention and Visitors Bureau
surveyed overnight visitors to Nashville and found that nearly one out of every ve tourists came to visit
because of the show. In a 2017 report from the Center for Economic Research in Tennessee (CERT),
it was revealed that Tennessee ranked seventh among all states in the nation for employment in lm
production. Employment in Tennessee’s lm industry grew 8% between 2010 and 2017.
One of the biggest supporters of lm in the state is the Tennessee Entertainment Commission. On the
Commission’s site are resources like lists of productions studios and production companies that can be
leveraged to highlight the breadth of talent and resources available in Tennessee. Additionally, they
highlight incentives as well as advantages to lming in Tennessee.
One nal notable aspect of the lm industry in Middle Tennessee is the Nashville Film Festival. The
festival celebrated its 50th anniversary this past year in 2019 making it one of the rst lm festivals to be
founded in the United States. The Film Festival also takes special consideration to highlight music in lm
because of Nashville’s recognition as Music City. “In addition to the many lms about music and the
Music Films in Music City awards, NashFilm presents showcases, workshops and other events where
these songwriters and artists come together with lm professionals from Hollywood and around the
world to promote collaboration.”
2O13
UPDATE
2O19
2O13
UPDATE
2O19
93
94
95
96
97

219
The 2013 report encouraged gaining international formal and informal recognition of Nashville as a cultural hearth
for roots, country, folk, gospel, jazz and other musical traditions; seeking global music heritage designations.
This recommendation has seen the greatest success since 2013. The opening of the National Museum
for African American Music (NMAAM) on Broadway in Nashville is an achievement in acknowledging
and celebrating the diversity of American music and the contributions of African American musicians.
NMAAM creates a physical space to not only promote, but also to help facilitate, the growth of African
American Music and its creators.
The Americana Music Festival that takes place in Nashville every fall has also seen tremendous growth
since its rst festival in 2000. Since then, the festival has grown into a multi-day event that contributes
millions of dollars to Nashville’s economy.
The Gospel Music Association continues to be housed in Nashville and works to promote gospel music
globally as well as manages the induction of new members to the Gospel Music Hall of Fame.
Finally, Nashville is also home to a variety of Music and Entertainment Associations. Associations that
are headquartered or have locations in Nashville include: American Association of Independent Music,
Americana Music Association, Academy of Country Music, Association of Independent Music Publishers,
Barbershop Harmony Society, Church Music Publishers Association, Country Music Association, Country
Radio Broadcasters, Gospel Music Association, Inspirational Country Music Association, International
Bluegrass Music Association, and Nashville Songwriters Association International, Women in Music.
There also exists advocacy groups and societies like The Other Nashville Society, that was created to be
a gathering point for creatives and music industry professionals in the city’s Pop, Rock, Singer/Songwriter,
Soul, Emo, Hip Hop, R&B, Jazz, Orchestral, Electronic, and Christian music scenes.
This recommendation has seen the greatest success since 2013. The opening of the National Museum
for African American Music (NMAAM) on Broadway in Nashville is an achievement in acknowledging
and celebrating the diversity of American music and the contributions of African American musicians.
NMAAM creates a physical space to not only promote, but also to help facilitate, the growth of African
American Music and its creators.
The Americana Music Festival that takes place in Nashville every fall has also seen tremendous growth
since its rst festival in 2000. Since then, the festival has grown into a multi-day event that contributes
millions of dollars to Nashville’s economy.
The Gospel Music Association continues to be housed in Nashville and works to promote gospel music
globally as well as manages the induction of new members to the Gospel Music Hall of Fame.
Finally, Nashville is also home to a variety of Music and Entertainment Associations. Associations that
are headquartered or have locations in Nashville include: American Association of Independent Music,
Americana Music Association, Academy of Country Music, Association of Independent Music Publishers,
Barbershop Harmony Society, Church Music Publishers Association, Country Music Association, Country
Radio Broadcasters, Gospel Music Association, Inspirational Country Music Association, International
Bluegrass Music Association, and Nashville Songwriters Association International, Women in Music.
There also exists advocacy groups and societies like The Other Nashville Society, that was created to be
a gathering point for creatives and music industry professionals in the city’s Pop, Rock, Singer/Songwriter,
Soul, Emo, Hip Hop, R&B, Jazz, Orchestral, Electronic
Nashville has a high concentration of universities and programs that offer state of the art music and
music-related degree options. As can be seen in the following chart, the Nashville region has 13
universities that award music related degrees. While Los Angeles has the actual highest number of
institutions, Nashville has the highest density of educational awards per one million people.
More can still be done to develop better collaboration between these institutions and leverage all that
they do to promote Nashville as a “global music education center.”
2O13
UPDATE
2O19
2O13
UPDATE
2O19
98
99
100

220
14
6
34
6
54
4
13
5
50
Music Cities
2.3
2.7
3.6
2.0
4.1
3.0
6.7
3.9
2.6
Number Universities
that Award Music
Related Degrees
Density of Educational Awards
per 1 Million Population
Atlanta
Austin
Chicago
Denver
Los Angeles
Memphis
Nashville
New Orleans
New York
The 2013 report recommended leveraging unparalleled depth of music industry knowledge and talent to foster an
entrepreneurial landscape that stimulates investment, technology innovation and support for globally attractive,
data-driven entertainment industry models.
The partnership between the Country Music Association and the Entrepreneur Center to create Project
Music embodies the spirit of this 2013 recommendation. Project Music is now in its 6th year. Project
music “brings music, technology and business leaders together to accelerate the development of
industry-changing startups.”
2O13
UPDATE
2O19
101

221
CONCLUSIONS
Writer, Hunter S Thompson said,
“Music has always been a matter of Energy to me, a question of Fuel. Sentimental people
call it Inspiration, but what they really mean is Fuel.”
No words have ever spoken more truth. This study shows that music is indeed the energy that ows through the
hearts and mind of creators and consumers and the fuel that powers the Nashville region’s economic landscape.
In the Nashville region, the music industry alone accounts for an economic impact of $8.6 billion having grown
43% since 2013. When coupled with the entertainment industry, the economic impact grows by a staggering
62% since 2013 to $15.6 billion. This growth is occurring in our region all while the economic impact of the music
industry in the United States has experienced only a 9% increase.
This study clearly highlights the Nashville region as a beacon drawing an ever-increasing pool of music industry
businesses, creative talent and skilled industry workforce. We have the highest concentration of music industry
related workers, a trend that our comparatively low cost of living will allow to keep growing. In many ways the
center of music gravity is shifting to the Nashville region. Thus, a resounding rhythm of this study is that Nashville
is not only where the world comes to hear music, it is where music comes to do business.
With this growth comes many opportunities to develop strategies to tackle the challenges that exist systemically
in the music industry or have arisen due to COVID-19 which highlighted areas of considerable pre-existing
weakness. The uncertainty about a COVID-19 recovery timeline is one of the most difcult parts about planning
for the future. According to the Survey to the Music Industry, most industry professionals, 37%, think that it will
be one to two years before they can live their lives more or less like they did before the onset of COVID-19.
Approximately 27% are completely unsure when life will return to “normal.”
The adage “necessity is the mother of invention” proves accurate as it applies to the music industry’s
technological response to the COVID-19 pandemic. Newer forms of communication help maintain business
operations; newer entertainment media help sell advertisements; and newer catalog management tools help
intellectual property holders control their metadata.

222
To industry leaders, artists, policy makers and music supporters alike this research requires that signicant
attention be given to the following:
Toward these solutions, the research calls for CMO Administrators to play a key role in managing a CMO’s
metadata to increase royalty payments from users to copyright owners. With a growing number of independent
creators nding mainstream success, copyright administrators offer a means for independent songwriters and
artists to build up the value of their intellectual property which not only positions them well for a future publisher
and/or label partnership but offers them a way to support themselves over the life of their career.
The research also indicates that community is essential to creatives. Because the nature of artist collectivism
is without geographic boundaries, in an increasingly freelance era, the music industry needs to also
operate outside regional boundaries using technology to create community or institutions that allow artists,
entrepreneurs and music industry stakeholders to navigate technological shifts, political landscapes, legalities
and market forces. Such communities and institutions could then utilize their collective inuence to guide policy
makers and advocacy.
The Nashville region and the State of Tennessee lawmakers must consider currency of legislation and economic
incentives that promote the growth of the music industry. At the federal level legislation should continue to
attempt to place guidelines around licensing structures and royalty payouts in the age of digital streaming that
supports the efforts of workforce in the music publishing, songwriting and recorded music communities.
As technologies surrounding royalty accounting improve with time and as awareness increases around the merits
of database uniformity and metadata accuracy, efforts undertaken by all parties—The Mechanical Licensing
Collective, music publishers, independent songwriters, copyright administrators, record labels and interactive
digital service platforms and policy makers—will continue to smooth over previously contentious relationships in
the industry and provide a fairer model for revenue allocation.
The Nashville region’s music ecosystem will continue to be enriched as more genres of music ourish and
country continues to call Nashville home. The research indicates a rich history and a bright future for music and
music business in Nashville as long as we seize upon the opportunities to keep the music playing.
The value gap or disparity between the value of creative content and the revenues returned
to the creators has been referenced, discussed and reinforced by original data throughout
this report. If a music industry is to continue to exist, capital must return to those directly
responsible for it: creators.
Live music is an irreplaceable experience that is expected to return, but while the music is
not playing live, the impact and extent of the impact on music industry workforce has been
devastating. Independent live venues that have been part of the Nashville landscape for
decades are now facing closure.
Like many other industries gender and racial disparities must be addressed for Nashville’s
music industry to reach its full potential.
Much like the Nashville Entrepreneur Center’s Project Music program, entrepreneurs need
to be supported and allowed to collaborate in a manner that mitigates their risks and drives
innovation within the industry.

223
FINAL THOUGHTS FROM
THE MUSIC INDUSTRY
The authors of the Music Industry Report 2020 thought it best to end with a few insightful responses from the
nal question to our Survey to the Music Industry.
“Performers will have to gure out creative ways to have online shows due to
COVID and we’ll have to gure out how to effectively monetize it.”
“Streaming. I think we’ll see more digital expansion into the VR/AR space.”
“[I think we’ll see] the growth of more self-made entrepreneur artists.”
“Don’t be afraid of change. Get your metadata together.”
“The music industry has a potentially bright future ahead with the widespread adoption of
streaming. However, it also has severe data quality issues and needs to seriously invest in
technology and talent to remain relevant in the age of Spotify, Apple, Google, Amazon, etc.”
“Live music will continue to dominate.”
“With the ability to go direct-
to-fan, the artist is no longer
beholden to old structures
that exploit them.”
“Music needs to be more
independent, more revolutionary.”
“I think we are at the brink of another large pivot and those who are positioned
properly when we emerge from all this will be primed to win. There will absolutely
be winners and losers in the new game and some will exit unhappy. However, in the
end, I genuinely believe this is a business about relationships and character. Those
who take the time to build that, to value others, to speak to how they can provide
value, will continue to see the results they are looking for.”
“Good music will eventually nd its way to its audience. Money can help,
but it isn’t essential. I’m hoping for a balance of focus, between musical
substance and business management...going forward.”
“Hopefully some forward-thinking rock bands.”
What’s next?
Do you have any ideas in mind about the direction of the music industry moving forward?


225225
RESOURCES
FUNDING/GRANTS
There are many resources out there that provide different avenues for funding, relief, connections to mental
health counseling and support and more. Two notable sites are the CARES Act Toolkit, created by Sound
Diplomacy and MusicCovidRelief.com.
The CARES Act Toolkit has four parts that are focused specically on music: explaining CARES Act funding, a
step-by-step guide for application, evidence and data of the economic impact of music in your community, and a
case studies database of existing CARES program frameworks.
The site MusicCovidRelief.com outlines what the federal CARES Act, the Paycheck Protection Program and the
Health Care Enhancement Act legislation means, how to receive unemployment, how to receive small business
benets, an extensive list on where to nd relief grants, and additional resources by organizational listing.
Crew Nation, powered by Music Forward Foundation, a 501c3 organization, extends a helping hand to the
touring and venue crews who depend on shows the make a living. Live Nation has committed $10 million to
Crew Nation – contributing an initial $5 million to the fund, then matching the next $5 million given by artists,
fans and employees dollar for dollar. Donate, buy merch to support, or apply for relief on their website.

MUSIC HEALTH ALLIANCE’S MISSION IS TO HEAL THE MUSIC BY PROVIDING
ACCESS TO HEALTHCARE THROUGH SERVICES THAT PROTECT, DIRECT &
CONNECT MUSIC PROFESSIONALS WITH MEDICAL AND FINANCIAL SOLUTIONS.
$52,000,000.00
HEALTHCARE COST
REDUCTIONS
MUSIC HEALTH ALLIANCE
HEALS THE MUSIC
$27,135,265.41
MEDICAL BILL
REDUCTIONS
$24,716,278.60
INSURANCE
PREMIUM SAVINGS
561
FAMILIES
SAVED FROM
BANKRUPTCY
BANKRUPTCY
18
MUSIC MAKERS
ASSISTED WITH
HEART, LIVER,
KIDNEY & LUNG
TRANSPLANTS
$
89% OF $$
GOES DIRECTLY TO
PROGRAMS & SERVICES
$1 DONATION =
$30 IN LIFE SAVING
HEALTHCARE
13,000 CLIENTS
IN 43 STATES
ACROSS THE US
RESULTS FROM JAN 2013 THROUGH MAY 2020
FREE
MISSION!
-FREE -
MHA SERVICES
ARE AVAILABE AT
NO COST
$148,456.00
COVID-19 RELIEF
INCLUDING
FOOD, MEDICINE &
HEALTHCARE ACCESS
HOW

ACKNOWLEDGEMENTS
Mark Abramowitz – Senior Creative Director, Kobalt Music; Co-Founder, The Other Nashville Society
Kris Ahrend – CEO, The Mechanical Licensing Collective (The MLC)
Chris Allen – U.S. Publishing and A&R, ONErpm
Tatum Allsep – Founder and CEO, Music Health Alliance
Erin O. Anderson – Founder & CEO, Olivia Management
Dapo Ayo-Adeusi – Head of Music Operations, Chocolate City / Warner Music; Managing Partner, Kwota Note Entertainment
David Baile – CEO, International Society for the Performing Arts
Jesse Blinn – Business Development, Futureshirts
Caroline Bowman – Co-Founder & Co-Owner, Cold Lunch Recordings
Collin Brannon – Co-Founder, Space Cadet Media and Management
Richard James Burgess – President and CEO, American Association of Independent Music
Michelle Cable – Founder and Owner, Panache Booking and Panache Management
Julia Cannon – Indie Folk Singer-Songwriter and Music Producer
Victor Chatman – Founder, Jazz on the Cumberland; President & CEO, Victor Chatman Productions & Studios
Chris Cobb – Owner, Exit/In; Co-Founder and President, Music Venue Alliance (MVAN)
Josh Collum – Co-Founder & Partner, Sorted Noise; Co-Founder, The Other Nashville Society (TONS)
Dave Cool – Business Development, Bandzoogle
Amelia Cueva – CEO, A&I Music Entertainment
Jeff Cvetkovski – Vice President of Operations, Exploration Group
Joe D’Ambrosio – Owner, Joe D’Ambrosio Management
Wes Davenport – Culture Marketing, Universal Music Group; Founder, No Country for New Nashville
D’Llisha Davis – Creator and Editor, 2L’s on a Cloud
David Davis – Pop, Soul Artist
Luc DiGiuseppe – Studio Musician/Session Guitarist/Bassist
John Dotson – Music Row Neighborhood Association; Broker, PARKS Realty
Nick Drake/Chuck iNDigo – Hip Hop/Neo Soul Artist; Co-founder and CEO, Third Eye LLC
Kathryn Edwards – Founder and Co-Owner, DRKMTTR
Lee Evans – “The Write Hook” aka MUG$ Amillion
Thalia “Muziqueen” Ewing –Founder, Nashville is Not Just Country Music
Katie Fagan – Head of A&R, Prescription Songs; Co-Founder, The Other Nashville Society
Emily Falvey – Songwriter, Smack Songs
JJ Farrell – Marketing & Partnerships, Music Business Association
Miles Feinberg – President, Music Rights Group
Randy Fox – Co-Founder and DJ, WXNA
Randy Goodman – Chairman & CEO, Sony Music Nashville
Gabriella Green – Actor, Musician, Assistant Producer, Johnny Mercer Foundation Songwriters Project
Joshua “Sweetbaby” Halper – Guitarist and Songwriter; DJ, Hot Fudge Tuesday, WXNA
Kay Hanley – Co-Executive Director of Songwriters of North America
227

228
Todd Hedrick – Owner, Vinyl Tap
Bill Herbert – Director, Metro Nashville Department of Codes and Building Safety
Bart Herbison – Executive Director, Nashville Songwriters Association International
Jed Hilly – Executive Director, Americana Music Association
Eric Holt, J.D. – Assistant Professor, Belmont University; Co-Founder, The Lovenoise Group/Syzygy Management
Doug Howard – Dean, Curb College, Belmont University
Lisa Hresko – Senior Director of Member Services and International Relations, American Association of Independent Music
Cherie Hu – Founder, Water & Music LLC
Laura Hutfless – Co-Founder, FlyteVu
Laurie Jakobsen – Founder & CEO, Jaybird Communications
Mike Jay – Host, Everything BUT the Show Podcast
JesseLee Jones – Musician, Brazilbilly; Owner, Roberts Western World
Joel T. Jordan – Founder & President, Synchtank
Eric Kilby – Host, Everything BUT the Show Podcast
Chris Knight – Co GM, Artist Management, Roc Nation
Gary Kraen – VP Programming & Operations, Lightning 100; Producer, Live on the Green Music Festival
Emily Lamb – Assistant Director, Metro Nashville Department of Codes and Building Safety
Roger LeBlanc – Founder and Talent Buyer, Madison Entertainment
Joni Lemons – Artist, Lemon Drop
Tyson Leslie – Rock Artist
Ken Levitan – Founder and Co-President, Vector MGMT
Michelle Lewis – Co-Executive Director, Songwriters of North America
Natalie Logan – Head of Public Relations, FlyteVu
Dionne Lucas – Director of Retail Marketing and Sales, National Museum of African American Music
Nick Maiale – Director of Events, Marketing & Partnerships, Music Business Association
Joe Major – Entertainment Facilitator and Radio Personality
Jodi Marr – Songwriter
Jacquelyn Marushka – Founder & CEO Marushka Media
Trevor Mathiesen – Senior Director of Publishing & A&R, CURB|Word Entertainment
Lizzy McAvoy – Songwriter and Producer
Heather McBee – VP, Operations, Nashville Entrepreneur Center
Daisha McBride – Musician, “The Rap Girl”
John McBroom – CEO, Across the Way Productions, FloydFest
Henry McCall – Co-Founder, Space Cadet Media and Management
SJ McDonald – Country Musician and Songwriter
Erica Meeks – Director of PR, Events & Sponsorships, Music Canada
Ben Mench-Thurlow – Talent Agent, APA Agency
Rene Merideth – Co-Founder & COO, Exploration Group
Miranda Mulholland – Musician and Label Owner, Roaring Girl Records
Scott Mulvahill – Singer/Songwriter and Upright Bassist
Vickie Nauman – CrossBorderWorks Consulting & Advising

229
Todd Olhauser – Owner, Mercy Lounge & Cannery Ballroom
Corinne Oplinger – Co-Founder, Stage Presence
Sylvia Parol – Sales Lead, Stage Presence (at time of focus group participation)
Shelly Peiken – Author, Songwriter
Gowa Peshewa – Production Manager
Kadeem Phillips – Executive Director, Creatives’ Day; Founder & CEO, Power Entertainment
Livia Piomelli – Director of A&R, Publishing; Big Noise Music Group
Dave Pomeroy – President, Nashville Musicians Association, AFM Local 257
Jeanette Porcello – Artist Manager, A&R Consultant, Atlantic Records
Max Pote – Producer, “Protohype;” Founder, Underdog Records
Elizabeth Racheva – Chief Advancement Ofcer, Washington Performing Arts
Erin Rae – Indie Folk Singer-Songwriter
Tyler Reina – Punk Alternative Artist
Alayna Renae – Jazz Musician; Founder, Nashville Musicians for Change
Jason Rezvan – Vice President, Advertising, Spirit Music Group
Nicky Rheaume – Artist Management, Good Harbor Music
Jake Wesley Rogers – Pop Artist
Portia Sabin – President, Music Business Association
Sam Saideman – Co-Founder/CEO of Innovo Management, LLC
Jenn Schott – Songwriter
Olivia Scibelli – Co-Owner, DRKMTTR
David Shirley – Production and State Manager, Audio Engineer
Alejandro Sierra – Latin/Pop Artist
Stuart Singleton – Co-Founder, Cake Records
Mischa Steiner – Founder, Stage Presence
Dez Stephens – Founder & CEO, Radiant Coaches Academy
Ellisa Sun – Musician, Representative with Nashville Musicians for Change
Chris Sunday – Artist Management, Bellman Music MGMT
Maddy Sundquist – Manager, MADKAT MGMT
Daniel Susla – Head of Music Publisher Relations, Content Partnerships, Soundcloud
Sharon Tapper – Owner/Founder, Pivot Music Group
Jessica Vaughn – Senior Director, Sync & Creative, Heavy Hitters Music Group
Lea Walker – Senior Marketing Coordinator, Innovo Management, LLC.
Bethany Warner – Artist and Songwriter, DEZA
Dwight Wiles – President, Wiles + Taylor & Co. P.C.
Sally Williams – President of Nashville Music and Business Strategy, Live Nation
Nan Wilson – Manager, Oracle
Stephen Wilson Jr. – Singer/Songwriter
Catharine Wood – Owner, Producer & Engineer, Planetwood Studios, LLC
Special thank you to Rachel Moore-Beard with Lead.Think.Do. for providing training on how to conduct focus groups.
230
WE ARE EXCITED TO THANK OUR BRONZE LEVEL SPONSORS
SPECIAL THANKS FOR PROMOTING OUR SURVEYS ON THE AIR
WE ARE EXCITED TO THANK OUR SILVER LEVEL SPONSOR
WE ARE EXCITED TO THANK OUR GOLD LEVEL SPONSOR
231
Exploration
Exploration is a copyright administrator and technology company whose mission is to help clients identify,
organize, and distribute the data required to thoroughly protect and monetize their intellectual property.
Exploration represents publishing, label and TV/lm clients at YouTube, The Harry Fox Agency, Music Reports, Inc.,
CMRRA, the performing rights organizations (ASCAP, BMI, SESAC), and SoundExchange, among others.
Nashville Area Chamber of Commerce Research Center
The Nashville Area Chamber of Commerce is Middle Tennessee’s denitive business membership organization.
The Nashville Chamber of Commerce Research Center offers expertise in data and analytics to shape
marketable information and creates innovative evaluation tools for mapping strategic direction. Combined with
entrepreneurial and global consulting experience, the Research Center deciphers empirical stories that guide both
the public and private sectors to informed action.
Both groups encourage the sharing of this document.
232
GLOSSARY
A&R – The department of a record label or music publisher responsible for discovering new talent and then facilitating new talent’s
relationship with the company.
Blanket License – A type of license issued by performing rights organizations (PROs) to licensees (restaurants, bars, clubs, etc.)
who wish to use the entire music catalog of a PRO.
Booking Agent – A person who arranges live performances for musicians.
Catalog – A collection of works by a songwriter, artist, music publisher, or record label.
Collective Management Organization – Licenses copyrights to users of music; monitors uses to enforce the license; collects
and distributes royalties to its members.
Composition – A musical composition is the copyrightable collection of elements that make up a song, including lyrics, melodies,
harmonies, and rhythms.
Copyright – Grants protection under the law for original works of authorship xed in a tangible form of expression.
Copyright Representative – A companies or organization that specializes in the management and administration of copyrights.
Common examples are music publishers and record labels.
Crew – A crew is a group of people besides those on stage hired by the artist or record label to work on a concert tour and travel
with the artist from venue to venue.
Demo – Sample recording of music.
Direct Economic Impact – The initial round of spending from consumers to businesses
Direct Effects – Changes in economic activity during rst round of spending.
Direct Employment – Refers to employment directly related to the music industry.
Entry-level Wages – As dened by Chmura Economics, a mean of the lower third of all wages.
Experienced Wages – As dened by Chmura Economics, a mean of the upper two-thirds of all wages.
Harry Fox Agency – A mechanical licensing administrator; issues mechanical licenses for reproductions of musical compositions
embodied in sound recordings in the United States.
233
Indirect Effects - Changes in sales, income or employment within the region linked industries supplying goods and services to
the music industry.
Indirect Economic Impact - Business to business transactions within a local economy
Indirect Employment - Employment generated in the businesses that supply goods and services to the music industry.
Industry – A distinct group of productive or prot-making enterprises i.e. the music industry
Input-Output Model -- This is a quantitative economic model that represents the interdependencies between different sectors
of a national economy or different regional economies.
Impact Analysis -- Net new economic activity generated by the nonprot sector, which includes the impact of dollars from
outside the study region on the regional economy.
IMPLAN -- An input-output modeling system. IMPLAN includes procedures for generating multipliers and estimating impacts by
applying nal demand changes to the model.
Licensee – A licensee is the recipient of rights under an agreement.
Licensor – A licensor is the grantor of rights under an agreement.
Location Quotient (LQ) -- These are ratios that allow an area’s distribution of employment by industry, ownership, and size class
to be compared to a reference area’s distribution. The U.S. is used as the reference area for all LQs within the les
Master – Refers to a sound recording xed in tangible form.
Mechanical Licensing Collective – Established by the Music Modernization Act 2018 to receive notices and reports from digital
music providers, collect and distribute royalties, and identify musical works and their owners for mechanical royalty payment.
Mechanical Royalty – Paid to the owner or administrator of the composition each time a musical composition is reproduced,
whether digitally or physically.
Merchandise – Physical products related to musical artists and their brands.
Music Supervisor – Works with motion picture or television producers and directors to recommend what music should go into
the soundtrack for the movie or program.
Music Reports, Inc. – A licensing clearinghouse which administers blanket licenses and royalties for various digital service
providers, web-based platforms, apps, and other users of music.
234
Nashville MSA – The Nashville Metropolitan Statistical Area, as dened by the United States Ofce of Management and Budget,
including Cannon, Cheatham, Davidson, Dickson, Macon, Maury, Robertson, Rutherford, Smith, Sumner, Trousdale, Williamson, and
Wilson counties.
North American Industry Classification System (NAICS) Code -- The standard used by Federal statistical agencies in
classifying business establishments for the purpose of collecting, analyzing, and publishing statistical data related to the U.S.
business economy.
Occupation – A job or profession.
Performing Rights Organization – An association that licenses the public performance of nondramatic musical works on
behalf of copyright owners.
Producer – In charge of the recording process in the recording studio.
Promoter – Work alongside publicists and other marketing professionals in order to create promotional opportunities for an artist
or project.
Manager – Brings together and coordinates the people and projects necessary to meet the goals of an artist or band.
Music Publisher – Exploits the composition copyright on behalf of songwriters.
Recording Artist – Performs music for recordings; creates sound recording copyrights.
Record Label – Exploit the sound recording or master on behalf of the recording artist.
Recoupment – Allows the record label to apply artist royalties against an advance to the music creator until the royalties equal or
“recoup” the advance; recoupment can also occur in publishing agreements in which a songwriter receives a recoupable advance.
REMI PI+ -- A structural economic forecasting and policy analysis modeling software that integrates computable general
equilibrium, econometric and economic geography methodologies.
Songwriter – Writes songs; creates composition copyrights.
SoundExchange – Collects and distributes digital performance royalties from the use of sound recordings on behalf of more than
155,000 recording artists and master rights owners (typically the record label) and administers direct agreements on behalf of rights
owners and licensees.
Standard Occupational Classification (SOC) Code -- United States government system of of classifying occupations and is
used by the federal government to collect occupational data, enabling comparison of occupations across data sets.
Synchronization Licensing – the process by which production companies of audiovisual works clear the rights for outside music
to be used in their productions.
Recoupment – Allows the record label to apply artist royalties against the advance until the royalties equal or “recoup” the
advance; Recoupment can also occur in publishing agreements in which a songwriter receives a recoupable advance.
Technicians – Operate and maintain a variety of electronic equipment used in audio production or broadcasting, including
recording devices, speakers, dubbing equipment, ampliers, lightning, and sound mixing boards.
Total Economic Impact – The sum of Direct and Indirect Economic Impacts
Tour Manager – Responsible for ensuring that an artist’s tour runs according to plan.
“Use” (Music) – A use is a transaction that exploits one or more of the creator’s exclusive rights. The creator or the copyright
administrator authorizes this use through a license.
Venue – Where live performances occur.
Vinyl Record – An analog sound storage medium in the form of a at disc.
235

236
ENDNOTES
IFPI. (2019). Industry Data. Global Music Report: The Industry in 2019.
https://www.ifpi.org/our-industry/industry-data/
Bennin, K., Chow, W., DePonte, J., Garside, K., Kane, S., Kleiner, A., Lieberman, M.,…Stokes, P. (2017). Perspectives from the
Global Entertainment and Media Outlook 2017-2021. PricewaterhouseCoopers.
https://www.pwc.com/gx/en/entertainment-media/pdf/outlook-2017-curtain-up.pdf
Christman, Ed. (2020, October 28). Global Music Publishing Collections Grew Last Year, But a Big Pandemic Drop Is Coming for
2020 and 2021. Billboard.
Licensing International. (2019, June 4). Global Sales of Licensed Products and Services Reach US $280.3 Billion, Fifth Straight
Year of Growth for the Licensing Industry.
https://licensinginternational.org/news/global-sales-of-licensed-products-and-services-reach-us-280-3-billion-fth-
straight-year-of-growth-for-the-licensing-industry/
IBISWorld. (2020). Industry at a Glance. The Retail Market for Musical Instruments Industry in the US - Market Research Report.
https://www.ibisworld.com/united-states/market-research-reports/the-retail-market-for-musical-instruments-industry/
Mulligan, M. (2019, March 13). 2018 Global Label Market Share: Stream Engine.
Meeker, M. Bond Capital. Internet Trends 2019.
Nonesuch Records. (2020, June 10). National Independent Venue Association Reports 90% of Independent Venues Could
Close Permanently Due to COVID-19. Retrieved October 29, 2020.
Brownstein, C. (2009, November 18). What Does “Indie” Mean To You? Even More Survey Answers!! Retrieved November 04,
2020, from https://www.npr.org/sections/monitormix/2009/11/what_does_indie_mean_to_you_ev_1.html
Hermann, A. (2019, May 22). The 20 Hottest Songwriters in Pop Music Right Now. Retrieved November 04, 2020,
from https://www.laweekly.com/the-20-hottest-songwriters-in-pop-music-right-now/
Mid-Year Report U.S. 2020 (Rep.). (n.d.). Nielsen Music / MRC Data.
Wood, M. (2020, July 09). How the music business is faring amid the COVID-19 pandemic. Retrieved November 04, 2020,
from https://www.latimes.com/entertainment-arts/music/story/2020-07-09/music-business-streaming-covid-
pandemic-nielsen-midyear-report
TikTok ‘has given new artists a chance’. (2020, September 11). Retrieved November 04, 2020,
from https://www.bbc.com/news/newsbeat-54059334
WPLN News: Nashville Public Radio. Nashville To Allow More Home-Based Business, Shifting Away from A Long-Standing
Prohibition. (2020, July 08). Retrieved October 29, 2020.
Corneld, Daniel B.. Beyond the Beat . Princeton University Press. Kindle Edition.
https://www.facebook.com/nashvillemusiciansforchange/
What is a Studio Musician?: Recording Connection. (2019, June 10). Retrieved October 29, 2020,
from https://www.recordingconnection.com/reference-library/recording-education/what-is-a-studio-musician/
Recording Musicians Wage Scale-AFM. (2020, February 3). Retrieved October 10, 2020,
from https://www.afm.org/wp-content/uploads/2020/02/MPTV-Film-Summary_WITH__-Vacation-Pay-_May-05-2019-
May-02-2020.pdf
Atout, O. (2020, July 15). The Talented Musicians Of Songlorious Will Create Personalized Songs From Scratch That Capture
Your Story. Retrieved October 31, 2020,
from https://www.einpresswire.com/article/521726270/the-talented-musicians-of-songlorious-will-create-
personalized-songs-from-scratch-that-capture-your-story
Patreon - Ofcial Website. (n.d.). Retrieved October 29, 2020,
from https://www.patreon.com/?utm_source=mi_google
1.
2.
3.
4.
5.
6.
7.
8.
9.
10.
11.
12.
13.
14.
15.
16.
17.
18.
19.
20.

237
21.
22.
23.
24.
25.
26.
27.
28.
29.
30.
31.
32.
33.
34.
35.
36.
37.
38.
39.
40.
41.
42.
43.
44.
45.
46.
47.
48.
Yohn, D. (2020, July 06). The Pandemic Is Rewriting the Rules of Retail. Retrieved October 29, 2020.
Form 10-K: GUITAR CENTER HOLDINGS, INC. (n.d.). Retrieved from United States Securities and Exchange Commission.
Retrieved October 29, 2020.
The Future of Music Retail: Gibson Brands, Inc. (Rep.). (n.d.). Pipeline Project 7.0.
Rudy’s Music. (n.d.). Retrieved October 29, 2020.
RIAA. YEAR-END 2019 RIAA MUSIC REVENUES REPORT.
Rogerson, Ben. (2020, May 06). Musical instrument sales and software downloads surge during coronavirus lockdown. Retrieved
November 9, 2020.
U.S. Recorded Music Revenues by Format & U.S. Recorded Music Sales Volumes by Format. (n.d.).
Wunderlich, J. (2020, September 25). What is On-Demand Music Streaming?
RIAA. YEAR-END 2019 RIAA MUSIC REVENUES REPORT.
Spotify’s new artist tool could boost streams (but with a lower royalty rate). (2020, November 2). Retrieved November 09, 2020,
from https://musically.com/2020/11/02/spotify-artist-tool-boost-streams-discounted-royalty-rate/
Carman, A. (2019, March 05). Spotify’s grand plan for podcasts is taking shape.
Watson, A. (2020, June 04). U.S. consumers who listen to audio podcasts 2020. Retrieved November 09, 2020,
from https://www.statista.com/statistics/188955/percentage-of-us-adults-who-listen-to-audio-podcasts-since-2006/
Rahman, A. (2020, April 22). Facebook Invests $5.7 Billion in JioSaavn Parent Company.
Pastukhov, D. (2019, March 17). Music Market Focus: Sizing Up the US Music Industry. Retrieved July 17, 2020, from Soundcharts
Blog.
Nielsen. (2017). 2017 Comparable Metrics Report. The Nielsen Company.
Nielsen. (2020). The Neilsen Total Audience Report. The Neilsen Company.
Moss, M. (2019, June 7). One More Scoop Of Vanilla: A New Proposal Looks To Loosen Radio Ownership Rules. Retrieved
November 9, 2020, from https://www.npr.org/2019/06/07/730323196/one-more-scoop-of-vanilla-a-new-proposal-looks-to-
loosen-radio-ownership-rules.
Citi GPS: Global Perspectives & Solutions. (2018). Putting the Band Back Together: Remastering the World of Music. Citigroup.
Radio King. (2018). The lowdown: what does the future hold for radio? Radio King Blog.
National Independent Venue Association. (n.d.).
About. Music Venue Alliance of Nashville. (n.d.).
Pollstar. (2019). Top Worldwide Tours. Mid-Year Top 100.
https://www.pollstar.com/Chart/2019/07/2019MidYearTop100WorldwideTours_747.pdf
Perspectives from the Global Entertainment and Media Outlook 2017–2021. (2017). Retrieved November 09, 2020,
from https://www.pwc.com/gx/en/entertainment-media/pdf/outlook-2017-curtain-up.pdf
Goldman Sachs. Music in the Air 2020: The Show Must Go On.
Bonnaroo. (2020, September 28). 2021 NEW DATES: Refunds & Rollover Options.
Jeong, M. (2020, September 02). Nashville council approves $2M in CARES Act funding for struggling music venues. Retrieved
October 29, 2020.
Nate Rau, T. (2020, August 26). Nashville live music industry on the brink of calamity; asks government for help.
https://www.nashvillefreestore.com/

238
49.
50.
51.
52.
53.
54.
55.
56.
57.
58.
59.
60.
61.
62.
63.
64.
65.
66.
67.
68.
69.
70.
71.
72.
73.
Global Music Merch Biz Grew to $3.1 Billion in 2016: Study. (n.d.). Retrieved October 29, 2020.
2019 Music Merch Industry Trends AtVenu. (n.d.) Retrieved October 29, 2020.
Browne, D. (2018, June 25). Inside Music’s New Merch Boom. Retrieved October 29, 2020.
DeLeon, W., & Director, J. (2017, August 17). How Bravado Turns Bands Into Brands.
Sugo Music Group. (2020, August 31). Top Independent Music Distribution Companies.
Millman, E. (2020, April 28). How Do You Sell Concert Tees Without Concerts? Merch Companies Are Up Against a Wall.
Retrieved October 29, 2020.
NAMM. (2003). Gallup Organization Reveals Findings of “American Attitudes Toward Making Music” Survey. The Gallup
Organization. https://www.namm.org/news/press-releases/gallup-organization-reveals-ndings-american-atti
How Children Benet from Music Education in Schools. (2018, June 19). Retrieved October 29, 2020.
Naylor, B. (2017, March 16). Trump’s Budget Plan Cuts Funding For Arts, Humanities And Public Media. Retrieved October 29,
2020.
Vogels, E., Perrin, A., Rainie, L., & Anderson, M. (2020, May 31). 53% of Americans Say the Internet Has Been Essential During
the COVID-19 Outbreak. Retrieved November 05, 2020.
See the Average College Tuition in 2020-2021. (n.d.). Retrieved October 29, 2020.
MusicBiz.org. (2019). Music Business Association Annual Conference 2020. Retrieved November 9, 2020.
Ucaya. (n.d.). Market Intelligence for the Music Industry. Retrieved October 29, 2020.
RIAA. YEAR-END 2019 RIAA MUSIC REVENUES REPORT.
Steele, A. (2020, April 25). Classic Rock Gives Comfort to Music Fans During Coronavirus Lockdown.
BBC News. Netix gets 16 million new sign-ups thanks to lockdown. Business.
C2ER, Cost of Living Index, 2019 Annual Averages
CMA Fest Generates Record-Breaking $65 Million in Direct Visitor Spending. (2020, February 28). Retrieved November 09,
2020, from https://www.visitmusiccity.com/media/press-release/2019/cma-fest-generates-record-breaking-65-million-in-direct-
visitor-spending
Rau, N. (2019, June 18). After sellout, Bonnaroo navigates tenuous relationship with Coffee County. Retrieved November 09,
2020, from https://www.tennessean.com/story/entertainment/music/bonnaroo/2019/06/17/bonnaroo-future-in-manchester-
coffee-county-tenn/1419129001/
Keuper, C. (2013, May 21). Bonnaroo: The Festival’s Economic Impact. Retrieved November 09, 2020,
from https://www.wuot.org/post/bonnaroo-festivals-economic-impact
Rau, N. (2017, May 03). Americana Fest brought $8M in economic impact in 2016. Retrieved November 09, 2020, from https://
www.tennessean.com/story/money/2017/05/02/americana-fest-brought-8m-economic-impact-2016/101212640/
West, E. (2017, October 11). Pilgrimage Festival generates $553,700 in revenue for Tennessee. Retrieved November 09, 2020,
from https://www.tennessean.com/story/news/local/williamson/2017/10/11/pilgrimage-festival-economic-generates-
553-700-revenue-tennessee/752607001/
West, E. (2019, November 22). Pilgrimage Festival reveals economic impact for 2019. Retrieved November 09, 2020,
from https://www.tennessean.com/story/news/local/williamson/2019/11/21/pilgrimage-festival-2019-economic-
impact-franklin-tn/4259612002/
Wilusz, R. (2020, August 14). 2 weekends of Big Ears in 2021? Better question: Can a festival even happen?
Retrieved November 09, 2020, from https://www.knoxnews.com/story/news/2020/08/14/big-ears-festival-plans-2-
weekends-2021-but-what-covid-19/3335238001/
Don’t Knock Knoxville. (n.d.). Retrieved November 09, 2020,
from https://bittersoutherner.com/dont-knock-knoxville-big-ears-festival

239
74.
75.
76.
77.
78.
79.
80.
81.
82.
83.
84.
85.
86.
87.
88.
89.
90.
91.
92.
93.
94.
95.
96.
97.
98.
99.
100.
101.
Courter, B. (2017, April 22). Study: Riverbend pumps $29.6 million into economy [photos].
Retrieved November 09, 2020, from https://www.timesfreepress.com/news/local/story/2017/apr/22/study-riverbend-
pumps-296-millieconomy/424176/
MEMPHIS IN MAY ANNOUNCES 2019 RECORD-SETTING ECONOMIC IMPACT AND FINANCIAL RESULTS. (2019).
Retrieved November 09, 2020, from https://www.memphisinmay.org/engage/blog/memphis-in-may-announces-
2019-record-setting-economic-impact-and-nancial-results-/\
Heilweil, R. (2020, June 02). Why people are posting black squares on Instagram.
Williams, A. (2019, June 6). Nashville’s Rising Hip-Hop Scene Is Music City’s Best-Kept Secret. Thrillist.
https://www.thrillist.com/entertainment/nashville/nashvilles-hip-hop-scene-underground-music
GMA - Gospel Music Association. (2020). Retrieved October 29, 2020, from https://www.gospelmusic.org/gma-mission/
Smith, S. L. (2019, April 4). NO COUNTRY FOR FEMALE ARTISTS: ARTIST & SONGWRITER GENDER ON POPULAR
COUNTRY CHARTS FROM 2014 TO 2018. Retrieved November 4, 2020,
from http://assets.uscannenberg.org/docs/no-country-for-female-artists-research-brief_2019-04-04.pdf
Bhattacharya, T. (2020, March 24). How to Rave at Home, Away From the Crowds.
Retrieved October 29, 2020, from https://www.ozy.com/good-sht/the-future-of-concerts-is-not-going-to-the-concert-
at-all/288846/
What is Americana Music? (2016, March 22).
About Us. (2019, April 12). Retrieved November 09, 2020, from https://americanamusic.org/about
Jazz Musician: Job Description and Education Requirements. (2019, October 4).
Caraan, S. (2020, March 23). No One Wants to Claim Lo Hip-Hop. So Why Is It Still so Popular? Retrieved November 02, 2020,
from https://hypebeast.com/2020/3/lo-hip-hop-popularity-criticism-youtube-livestream
Rudy’s Jazz Room. (2020). Retrieved October 29, 2020.
Ramirez, A. (2020, April 9). How Latin Musicians Are Building New Scenes in Nashville.
Watson, A. (2020, September 24). Music album consumption in the U.S. by genre 2018.
Nashville Is The Reason. (2020, August 4). Retrieved October 30, 2020,
from https://www.facebook.com/nashvilleisthereason
Nashville Is The Reason. (2020, August 4). Retrieved October 30, 2020,
from https://www.facebook.com/nashvilleisthereason/posts/4693114310728593
Other Useful Links. (n.d.). Retrieved October 29, 2020,
from https://www.bls.gov/soc/
Music Canada . (2017). The Value Gap: It’s Origins, Impacts and a Made-in-Canada Approach. Retrieved November 2020,
from https://musiccanada.com/wp-content/uploads/2017/10/The-Value-Gap-Its-Origins-Impacts-and-a-Made-in-
Canada-Approach.pdf
CAPGEMINI. (2018). Diversity in the Information Technology Workforce. Diversity Best Practices.
Buie, J., & McGee, J. (2017, August 8). Nashville Flight to London Launches in May with High Expectations. The Tennesseean.
Retrieved Ocotber 2020.
Nashville Meets London. (2020, November 5). About. Retrieved from Nashville Meets London.
Center for Economic Research in Tennessee. (2017, January 6). The Highlight Reel: Tennessee’s Film Industry Packs Economic
Punch. Retrieved October 2020, from Tennessee Department of Economic and Community Development.
Tennessee Entertainment Commission . (2020). Retrieved October 2020, from Tennessee Entertainment Commission.
Nashville Film Festival. (2020). Mission & History. Retrieved October 2020, from Nashville Film Festival.
Americana Music Association. (n.d.). About AmericanaFest. Retrieved 2020, from The Americana Music Association.
Gospel Music Association . (2020). Retrieved October 2020, from The Gospel Music Association.
The Other Nashville Society. (2017). Who We Are. Retrieved November 2020, from The Other Nashville Society .
Nashville Entrepreneur Center. (2020). Nashville Entrepreneur Center: Project Music . Retrieved October 2020, from Nasvhille
Entrepreneur Center.

240
OTHER WORKS CITED
Audra, B. (2020). Bridging the Gap. The East Nashvillian.
Best, C., Braile, K., Falvey, E., Ross, S., Rotunno, R., and Schreiber, D. “A ‘Chance’ of Success: The Inuence of Subcultural Capital
on the Commercial Success of Chance The Rapper.” Journal of the Music and Entertainment Industry Educators Association 17, no.
1 (2017): 31-58. https://doi.org/10.25101/17.2.
Burnett, M. (2020). Country Music Hall of Fame set to reopen in September. The Nashville Business Journal.
Corneld, D. B. (2018). Beyond the beat: Musicians building community in Nashville. Princeton, NJ: Princeton University Press.
Chicago Loop Alliance., (2019). Arts in the Loop Economic Impact Study. Retrieved November 09, 2020, from https://loopchicago.
com/assets/f4fdbc1e00/Arts-in-the-Loop-Study.pdf
Florida, R., & Seman, M. (2020). Lost Art: Measuring COVID-19’s devastating impact on America’s creative economy. Retrieved
November 09, 2020, from https://www.brookings.edu/wp-content/uploads/2020/08/20200810_Brookingsmetro_Covid19-and-
creative-economy_Final.pdf
Fox, R. (2020). Alternative Grooves. The East Nashvillian.
Hight, J. (2020, November 05). Hip-Hop In Nashville Is Making Its Own Way. Retrieved November 06, 2020, from https://www.npr.
org/2020/11/05/928328328/hip-hop-in-nashville-is-making-its-own-way?utm_medium=social
Hight, J. (2017, March 24). Just Off Music Row, Nashville’s R&B Scene Thrives. Retrieved October 30, 2020, from https://www.npr.
org/sections/therecord/2017/03/24/521276599/just-off-music-row-nashvilles-r-b-scene-thrives
Leimkuehler, M., Watts, C., & Paulson, D. (2019, December 22). Nashville artists to watch in 2020: Ingrid Andress, Devon Gilllian,
Kalie Shorr and more. Retrieved October 30, 2020, from https://www.tennessean.com/story/entertainment/2019/12/22/nashville-
artists-watch-2020-ingrid-andress-devon-gilllian-kalie-shorr/2642652001/
Newman, M. (2020, September 29). Nashville Songwriter Awards Name 2020 Songwriter-Artist of the Year: Exclusive. Retrieved
October 31, 2020, from https://www.billboard.com/articles/columns/country/9456399/luke-combs-nashville-songwriter-awards-
2020-songwriter-artist-of-the-year-exclusive
Ramirez, A. (2020, April 9). How Latin Musicians Are Building New Scenes in Nashville. Retrieved October 29, 2020, from https://
www.nashvillescene.com/music/cover-story/article/21127159/how-latin-musicians-are-building-new-scenes-in-nashville
Rau, N. (2020). Financial Oversight Committee Dedicates $2 Million. The Tennessee Lookout.
Rau, N. (2020). Nashville Live Music Industry on the Brink of Calamity Asks Government for Help.
SLN StaffWriter. (2019, December 19). 20 New Country Artists to Watch in 2020. Retrieved November 06, 2020, from https://www.
soundslikenashville.com/news/20-country-artists-to-watch-2020/
Snyder, E. (2020). Nashville’s Music Venues are in Trouble According to the National Independent Venue Association. The Nashville
Business Journal.
Trageser, S. (2020). Americana Online. The Nashville Scene.
Trageser, S. (2020). Sound Check. The Nashville Scene.
Various, .. (2020). Arts, Music & Culture. The Nashville Scene, Best of 2020, 110-131.
Victoria, A. (2020). South Gotta Change. The Nashville Scene.
Wynn, R. (2020). “Love & Positivity”... Always. The East Nashvillian.
All Employment Numbers from ReferenceUSA, Accessed in 2020.
APPENDICES
CLICK HERE TO ACCESS THE APPENDICES

2O2O
