
S T R I C T L Y P R I V A T E A N D C O N F I D E N T I A L

We have a consistent set of strategic priorities
Growing and deepening relationships by
engaging customers
1
with products and
services they love and expanding our distribution
Delivering financial performance that is
consistently best-in-class
Leveraging data and technology to drive speed
to market and deliver customer value
⚫
Grow our customer base through new-to-bank relationships in Consumer Bank and Card
⚫
Engage customers with improved experiences across human and digital channels
⚫
Deepen relationships with a focus on Business Banking, Wealth Management, and Commerce
⚫
Operate resilient businesses with best-in-class returns
⚫
Scale core businesses and invest for long-term growth
Protecting our customers and the firm through a
strong risk and controls environment
Cultivating talent to build high-performing,
diverse teams where culture is a competitive
advantage
⚫
Optimize channels, products, and platforms to deliver customer and business value
⚫
Modernize applications, infrastructure, and data to future-proof the business
⚫
Drive disciplined risk, controls, and governance processes
⚫
Leverage our risk platforms as responsible growth engines
⚫
Create a culture where our people come to work with heart, curiosity, and courage
⚫
Be known as a company that serves customers, communities, and each other in a first-
class way
Strategy
Enablers
Outcome
1
5
2
3
4
1
“Customer” includes both consumers and small businesses and reflects unique individuals and business entities that have financial ownership or decision-making power with respect to accounts
2

We have delivered against our commitments
Added net ~3mm customers to the CCB franchise
Continued to scale distribution by opening 114 branches, while adding 240+ Business Relationship Managers and 300+ Advisors
Launched Personal Advisors and Wealth Plan for Chase clients and advisors
Launched Ink Business Premier, Pay in 4 on debit to select customers, and ChaseTravel.com for cardholders
Targeted and delivered ~$8B in volume through Travel platform – on track for ~$15B by 2025
Migrated nearly 30% of data to the public cloud – on track for 50% by end of 2023
Delivered $500mm+ in value from AI/ML programs
Continued to operate in a strong risk and controls environment
Attracted top talent and reduced attrition
Generated ~$40B in net interest income vs. ~$38B guidance from last year
Incurred ~$31B in adjusted expense
1
vs. ~$32B guidance from last year
Delivered 29% ROE on net income of $14.9B
Extended #1 position in retail deposit share
2
by 60bps
Extended #1 position in card by outstandings
3
by 74bps
Strategy
Enablers
Outcome
✓
✓
✓
✓
✓
✓
✓
✓
✓
✓
✓
✓
✓
✓
STRATEGIC PRIORITIES AND COMMITMENTS
For footnoted information, refer to slide 73
3
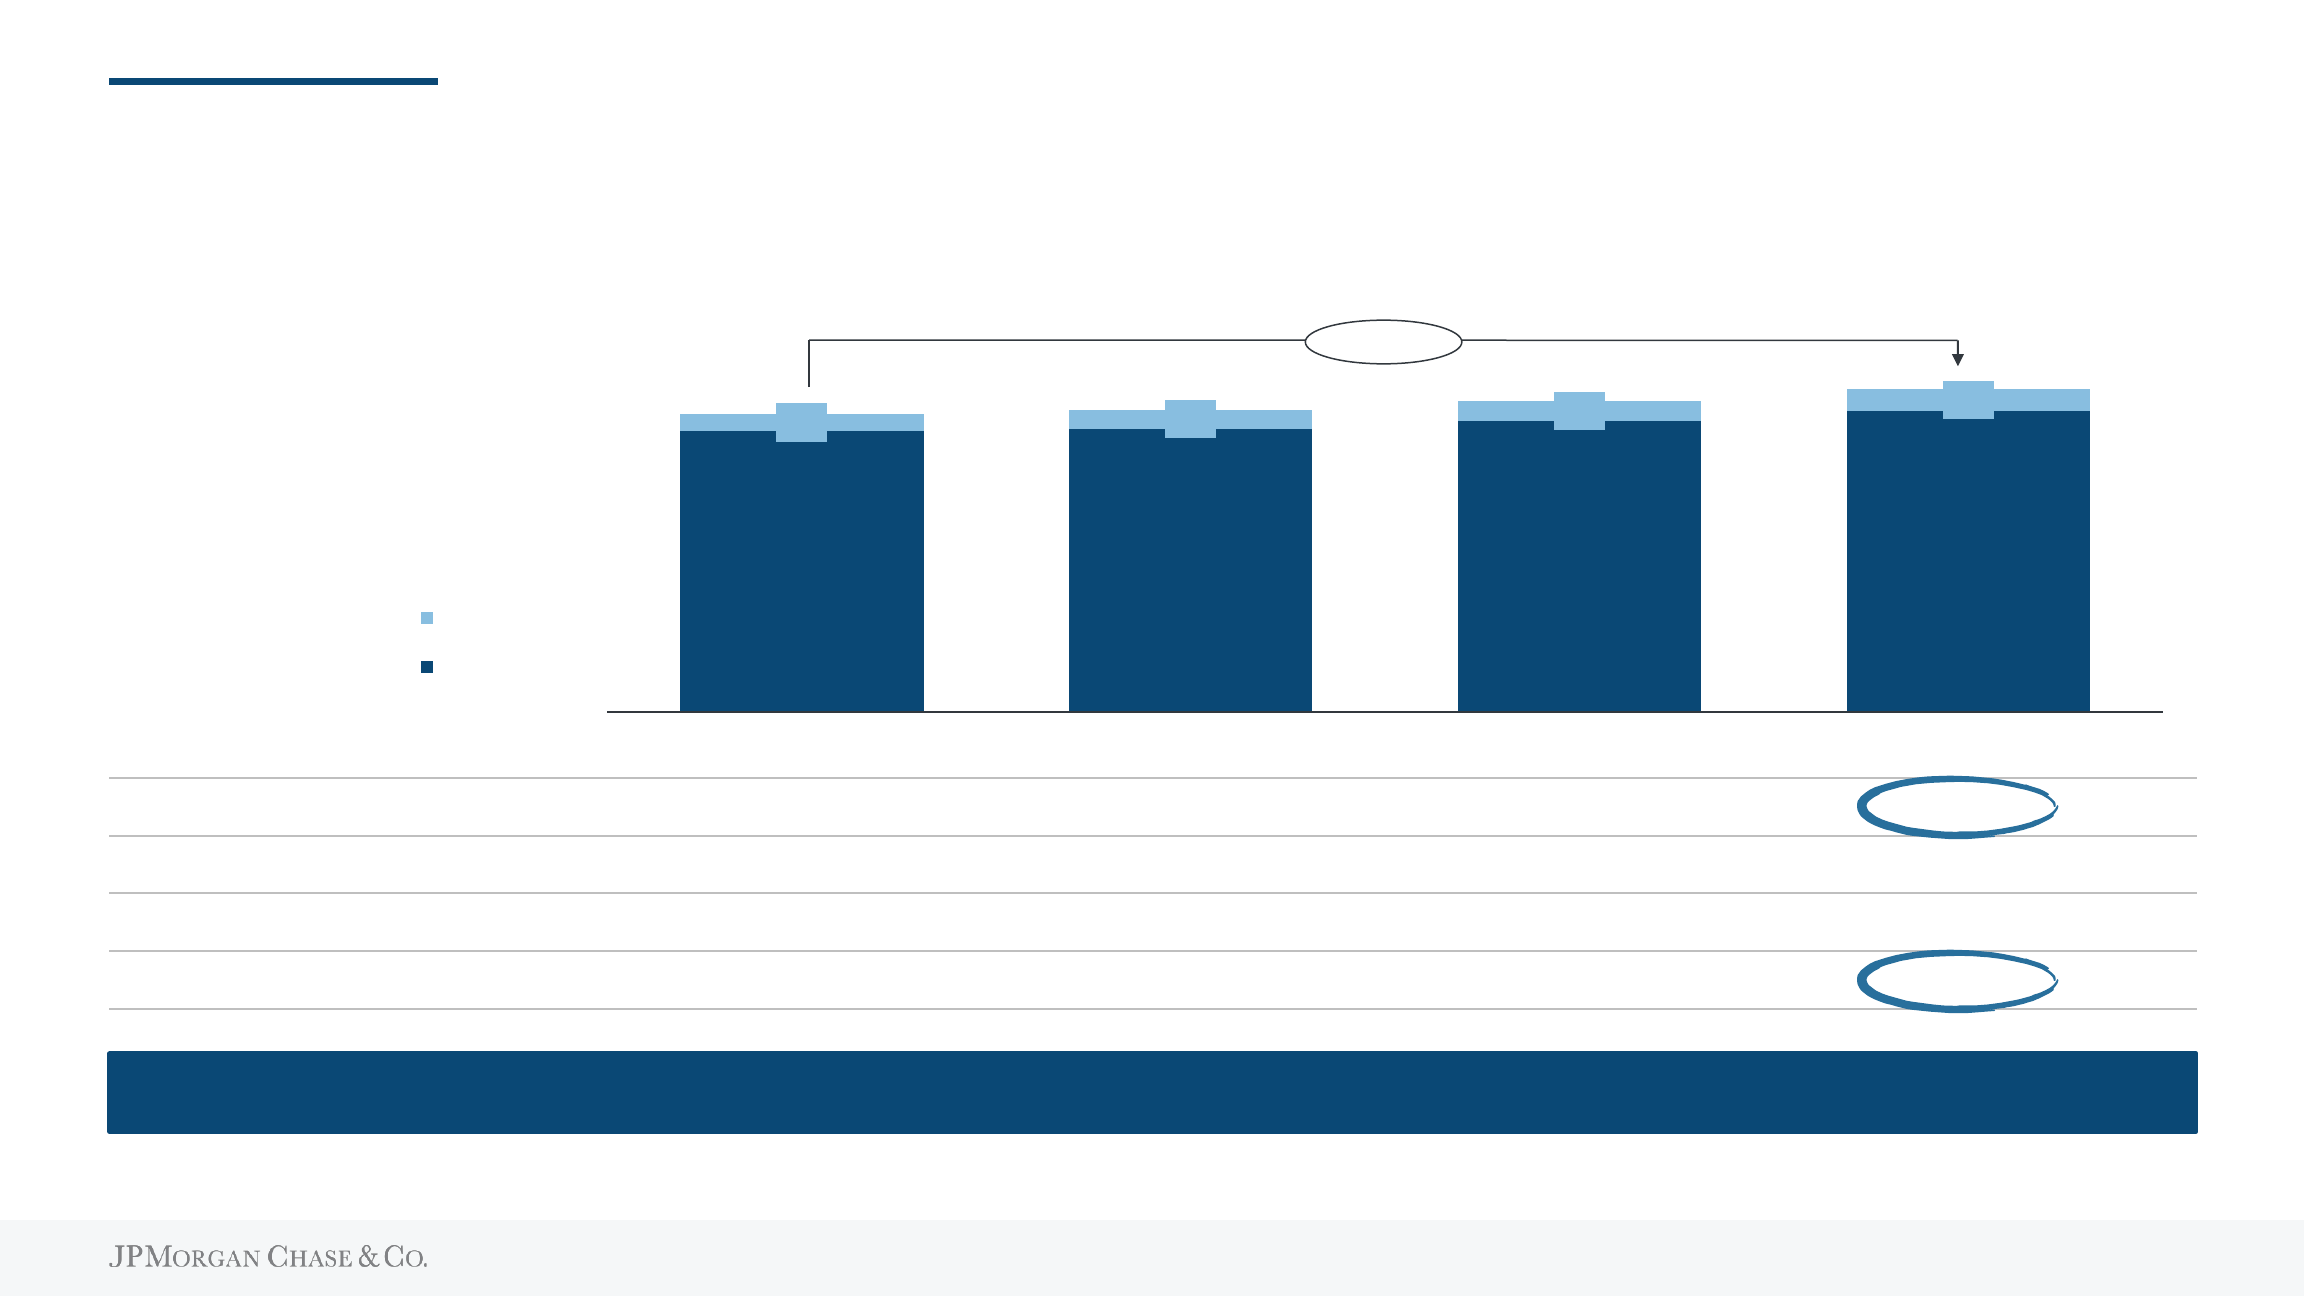
73.6
74.3
76.3
79.0
4.6
4.9
5.3
5.7
2019 2020 2021 2022
Small businesses
Consumers
We continue to drive significant customer growth – the catalyst for the franchise
Retail deposit share
2
9.1% (#3) 9.6% (#3) 10.3% (#1) 10.9% (#1)
Business Banking primary bank share
3
9.4% (#1) 9.5% (#1) 9.2% (#1) 9.3% (#1)
Card sales share
4
22.4% (#1) 22.3% (#1) 22.4% (#1) 22.4% (#1)
Card O/S share
4
16.6% (#1) 16.6% (#1) 16.5% (#1) 17.3% (#1)
CCB customers (mm)
Since 2019, we have grown our overall customer base by 8% and multi-LOB relationships
5
by ~20%
8%
1
For footnoted information, refer to slide 74
4

We strive to make it easy to do business with us by engaging customers across channels
In 2022, we achieved record high satisfaction across channels
5
active digital
customers
3
63mm+
digital logins
4
>15B
mobile logins per
user per month
>20
unique visitors to
branches per day
~900k
U.S. population
within a 10-min.
drive to a branch
60%
customers met
with a banker
>20mm
#1 Digital banking platform
1
1
st
Retail bank in all lower 48 states
2
Enabling customers to manage their full financial lives through
our digital banking, lending, and investing capabilities
Our branch network is a local storefront for customers who
want to engage with our bankers and advisors
Increasing branch
density
For footnoted information, refer to slide 75
5

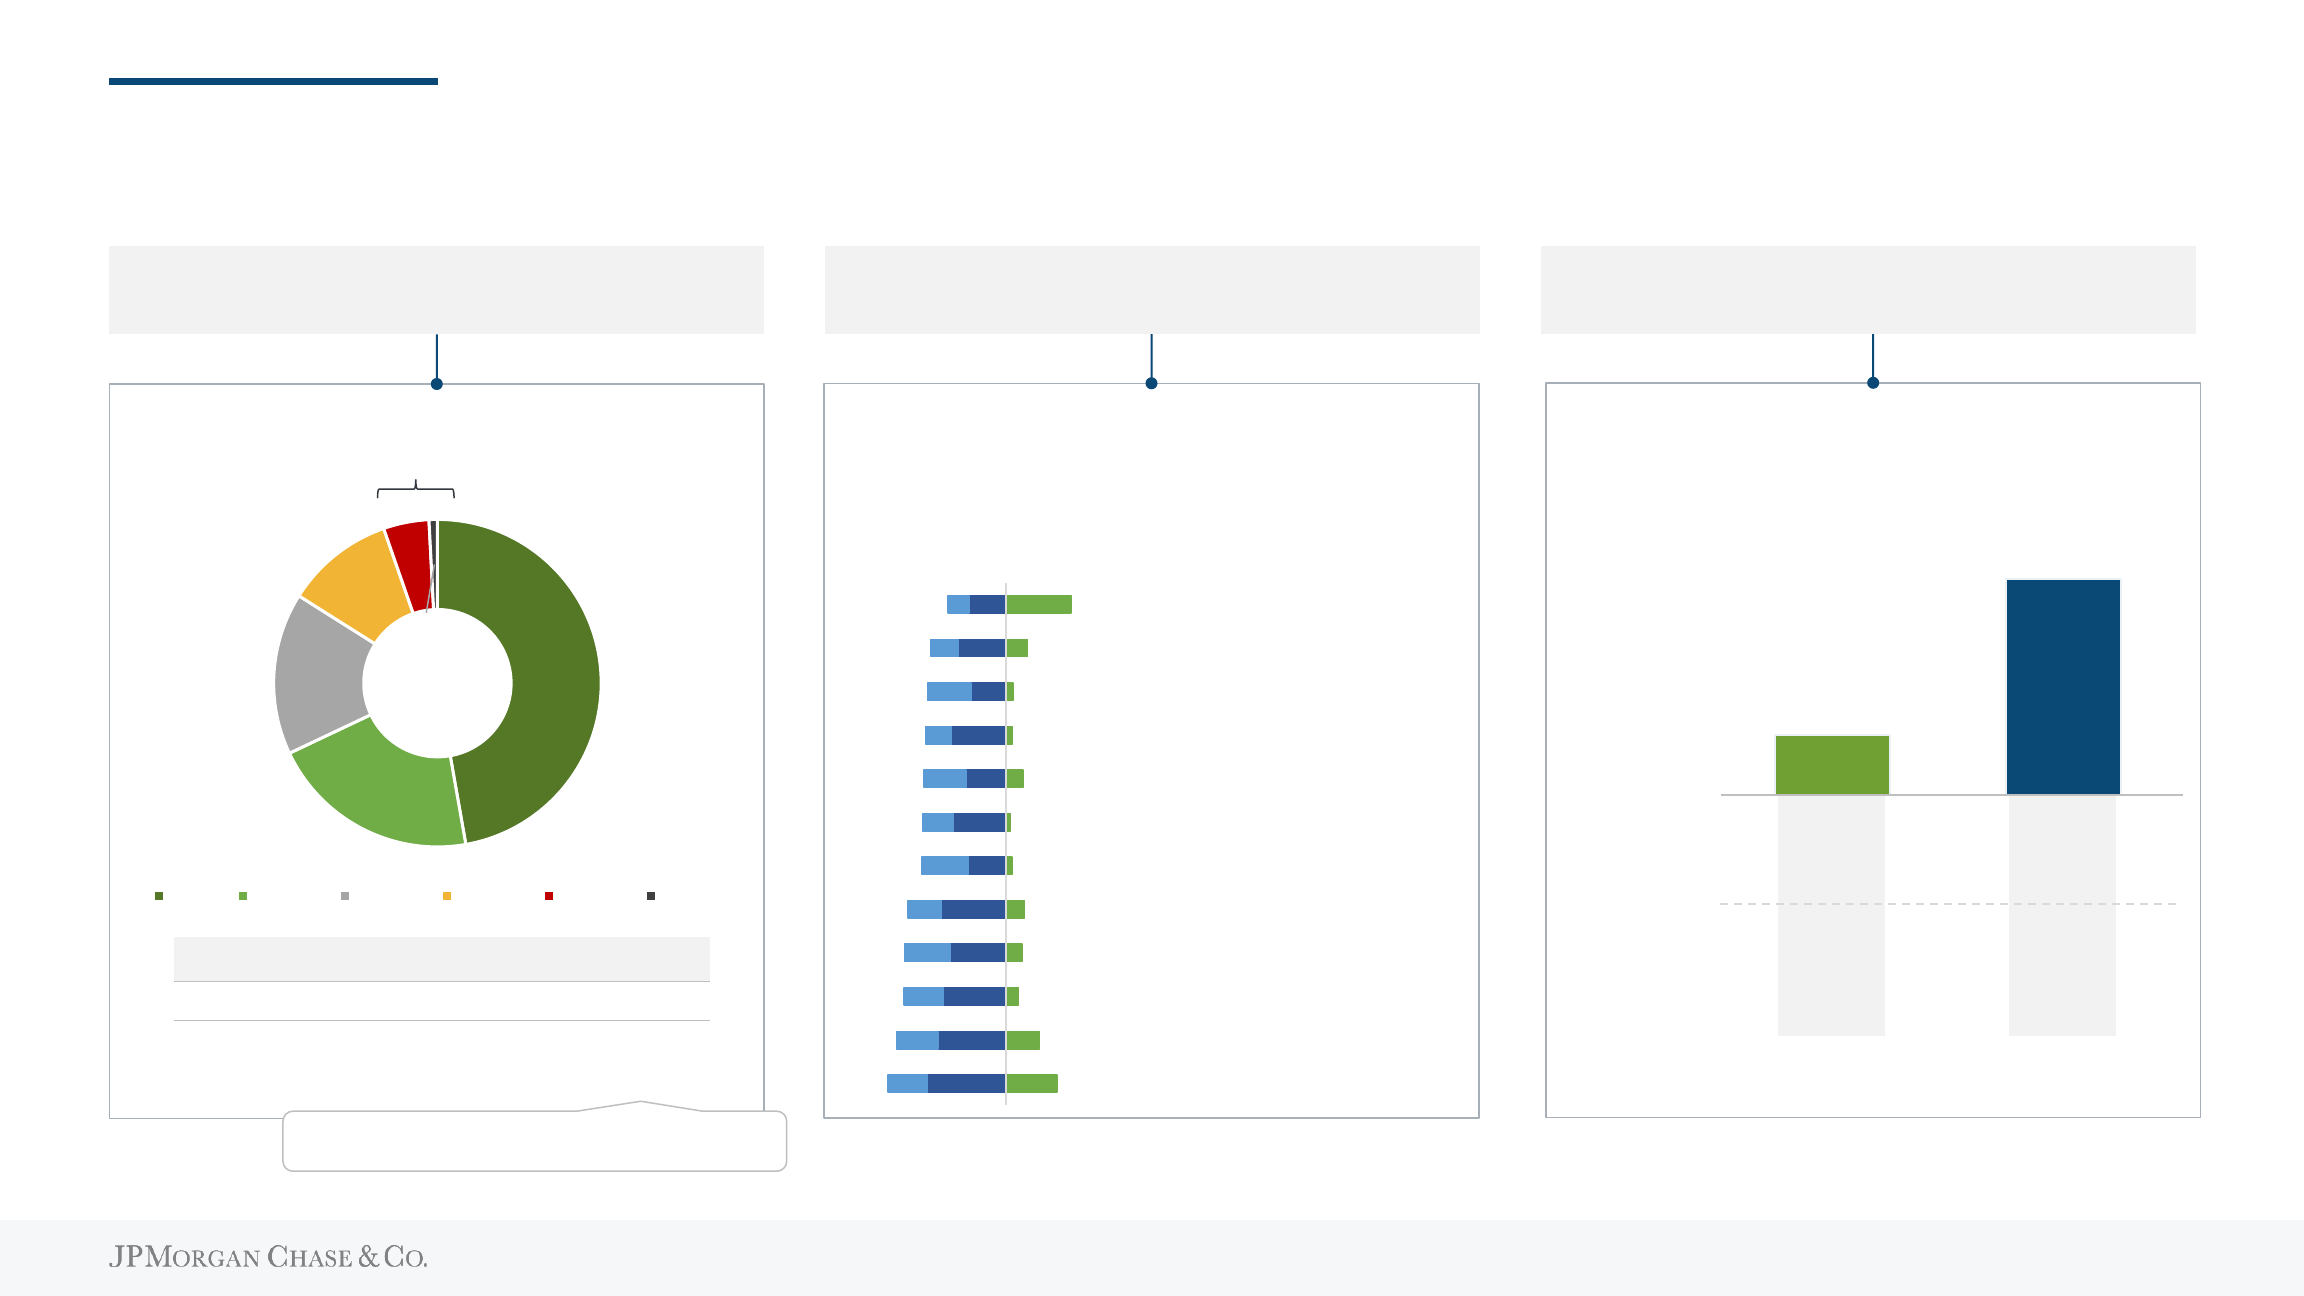
We are investing across our lines of business to serve more of our client needs
CONNECTED COMMERCE
Customers (mm)
1.6
2.2
2.3
2019 2021 2022
45%
Relationships
2
(mm)
2.9
3.5
3.8
2019 2021 2022
>75%
of Business Banking clients
also have a Consumer
Banking relationship
>85%
of first-time investors come
from banker referrals
3
BUSINESS BANKING
Clients
5
(mm)
WEALTH MANAGEMENT
1
Enabled by recent
acquisitions
>$3
~$4
~$8
2019 2021 2022
Chase Travel sales volume ($B)
4
>2x 30%
For footnoted information, refer to slide 76
6

We generate tremendous franchise value from operating our businesses within CCB and the broader firm
World-class capabilities across the firm
100%
of J.P. Morgan Wealth Management investments
through Asset & Wealth Management
Solutions throughout customers’ lifecycles
>15%
of new Middle Market relationships came
from Business Banking last year
Unmatched omnichannel distribution
Scale of our franchise
Leading financial services brand
#1
in prospect consideration
across peer institutions
1
$7B+
in investments to drive sustained growth
while delivering industry leading returns
CCB JPM
Customer Value Employee Value Enterprise Value
~50%
of Commercial & Private Banking clients
visit our branch network
5
Branch network as a storefront for JPMC
#
1
#
1
#
1
Consumer Banking
Business Banking
Card
Wealth
Merchant
Mortgage
#
1
#
1
#
2
For Chase clients
3
In the industry
2
75%+
of mortgage originations
4
, Business Banking clients,
and wealth relationships from existing customers
For footnoted information, refer to slide 77
7

2019 2021 2022
Average deposits ($B)
$698 $1,055 $1,163
Average loans ($B)
$478 $434 $439
Average Card outstandings ($B) $156 $140 $163
Revenue ($B)
2
$55.0 $49.9 $54.8
Deposit margin
3
2.48% 1.27% 1.71%
Expense ($B)
2
$28.1 $29.0 $31.2
ROE
31.0% 41.0% 29.0%
$21.7
$18.1
$20.9
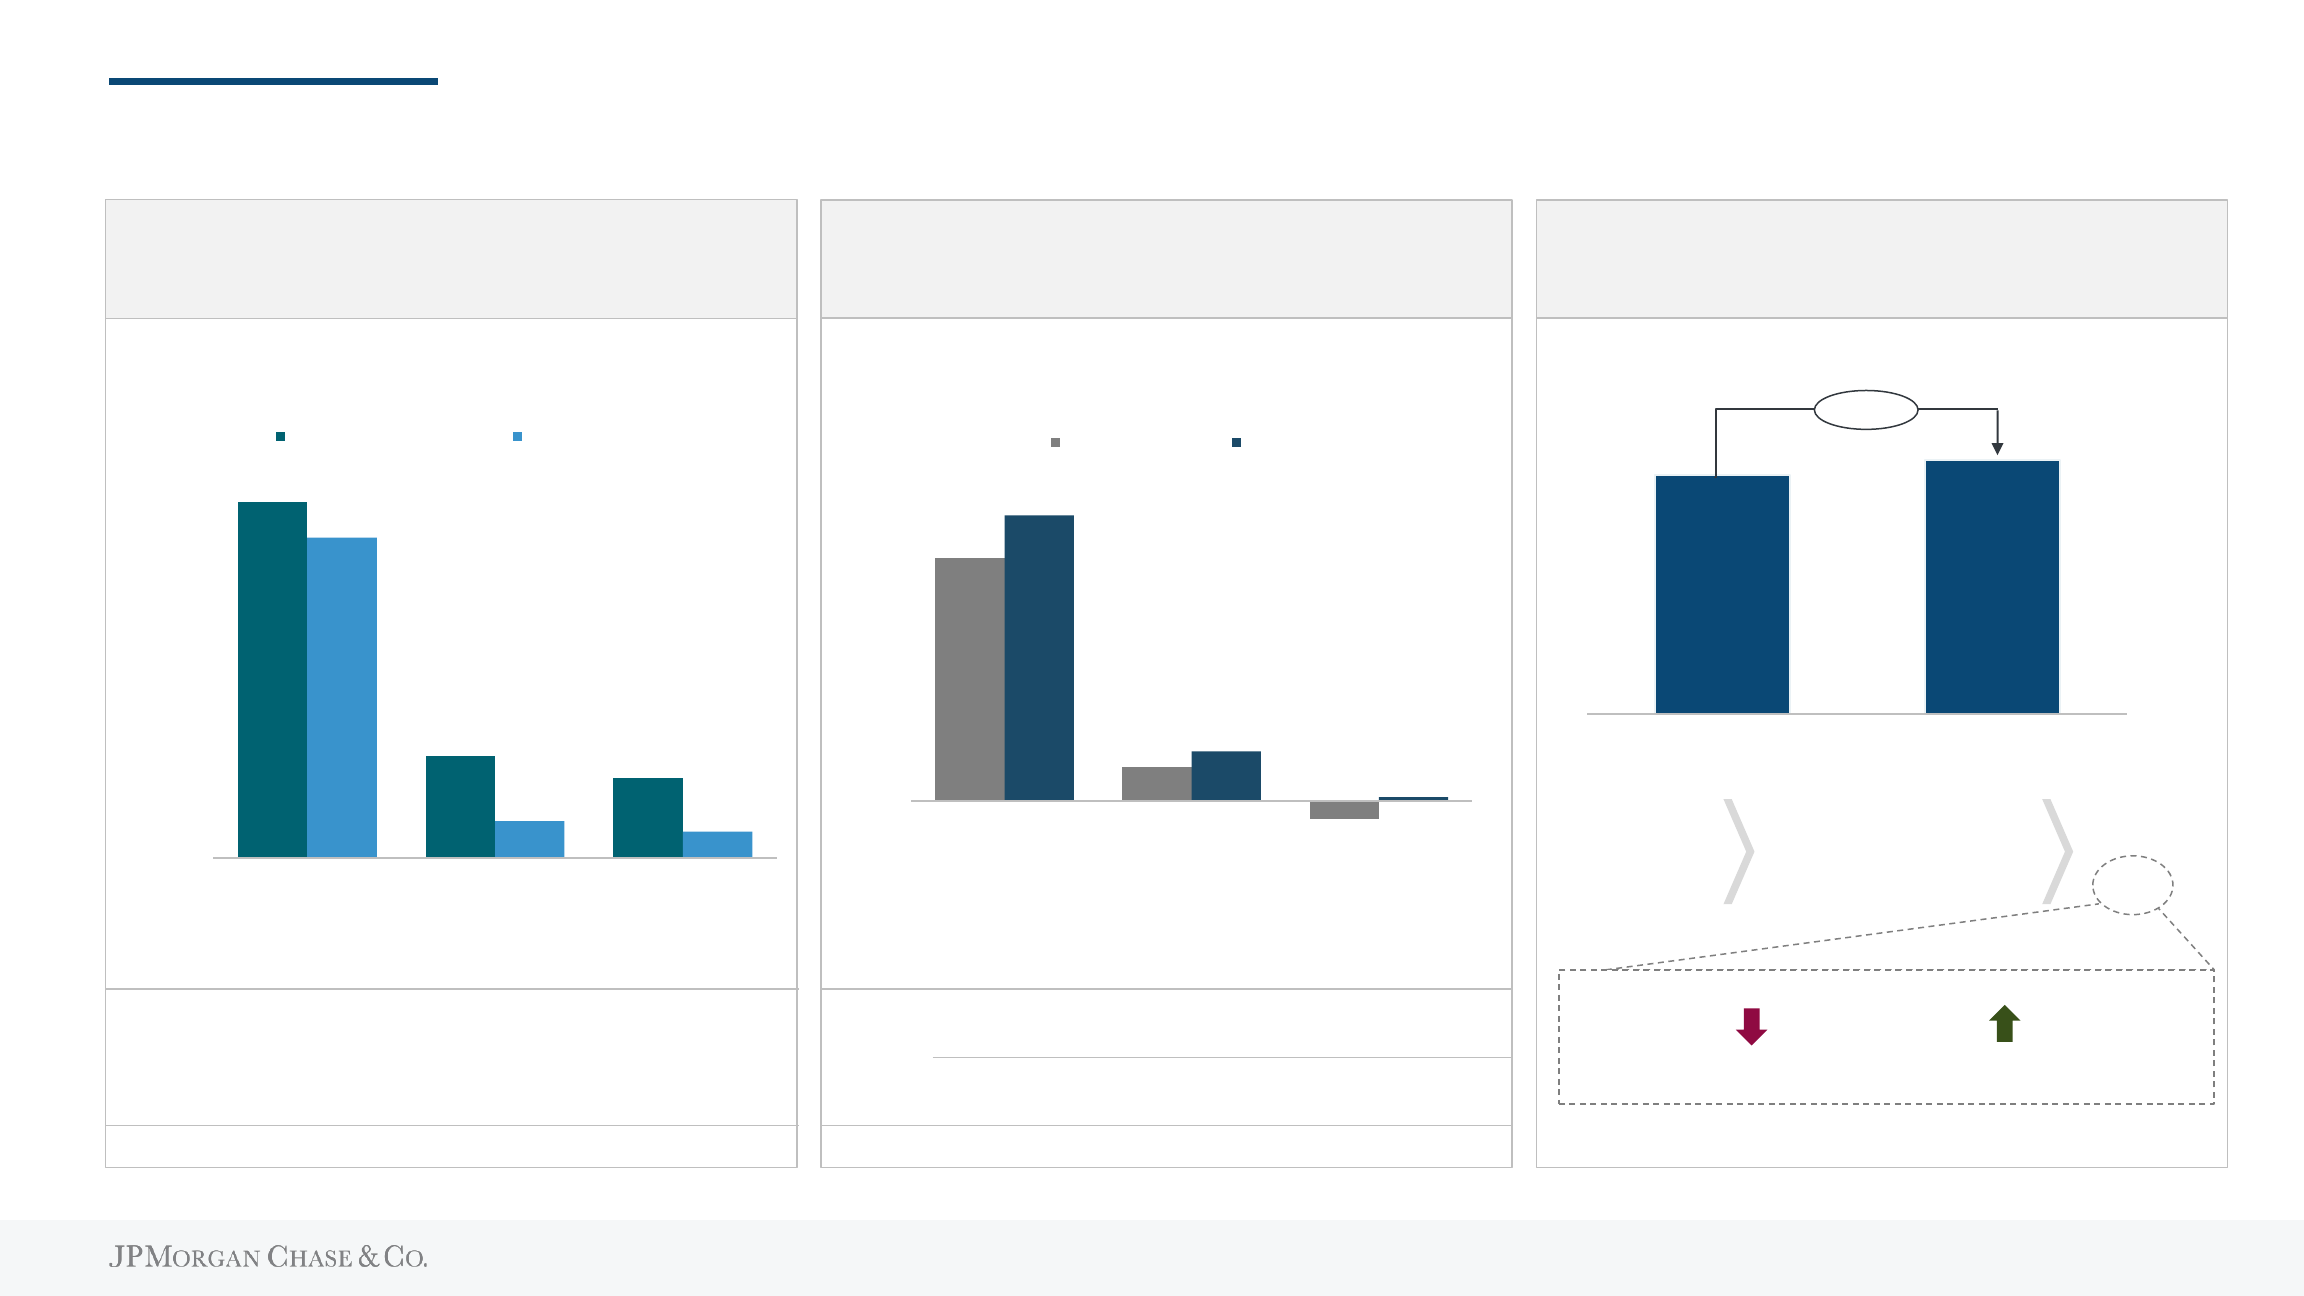
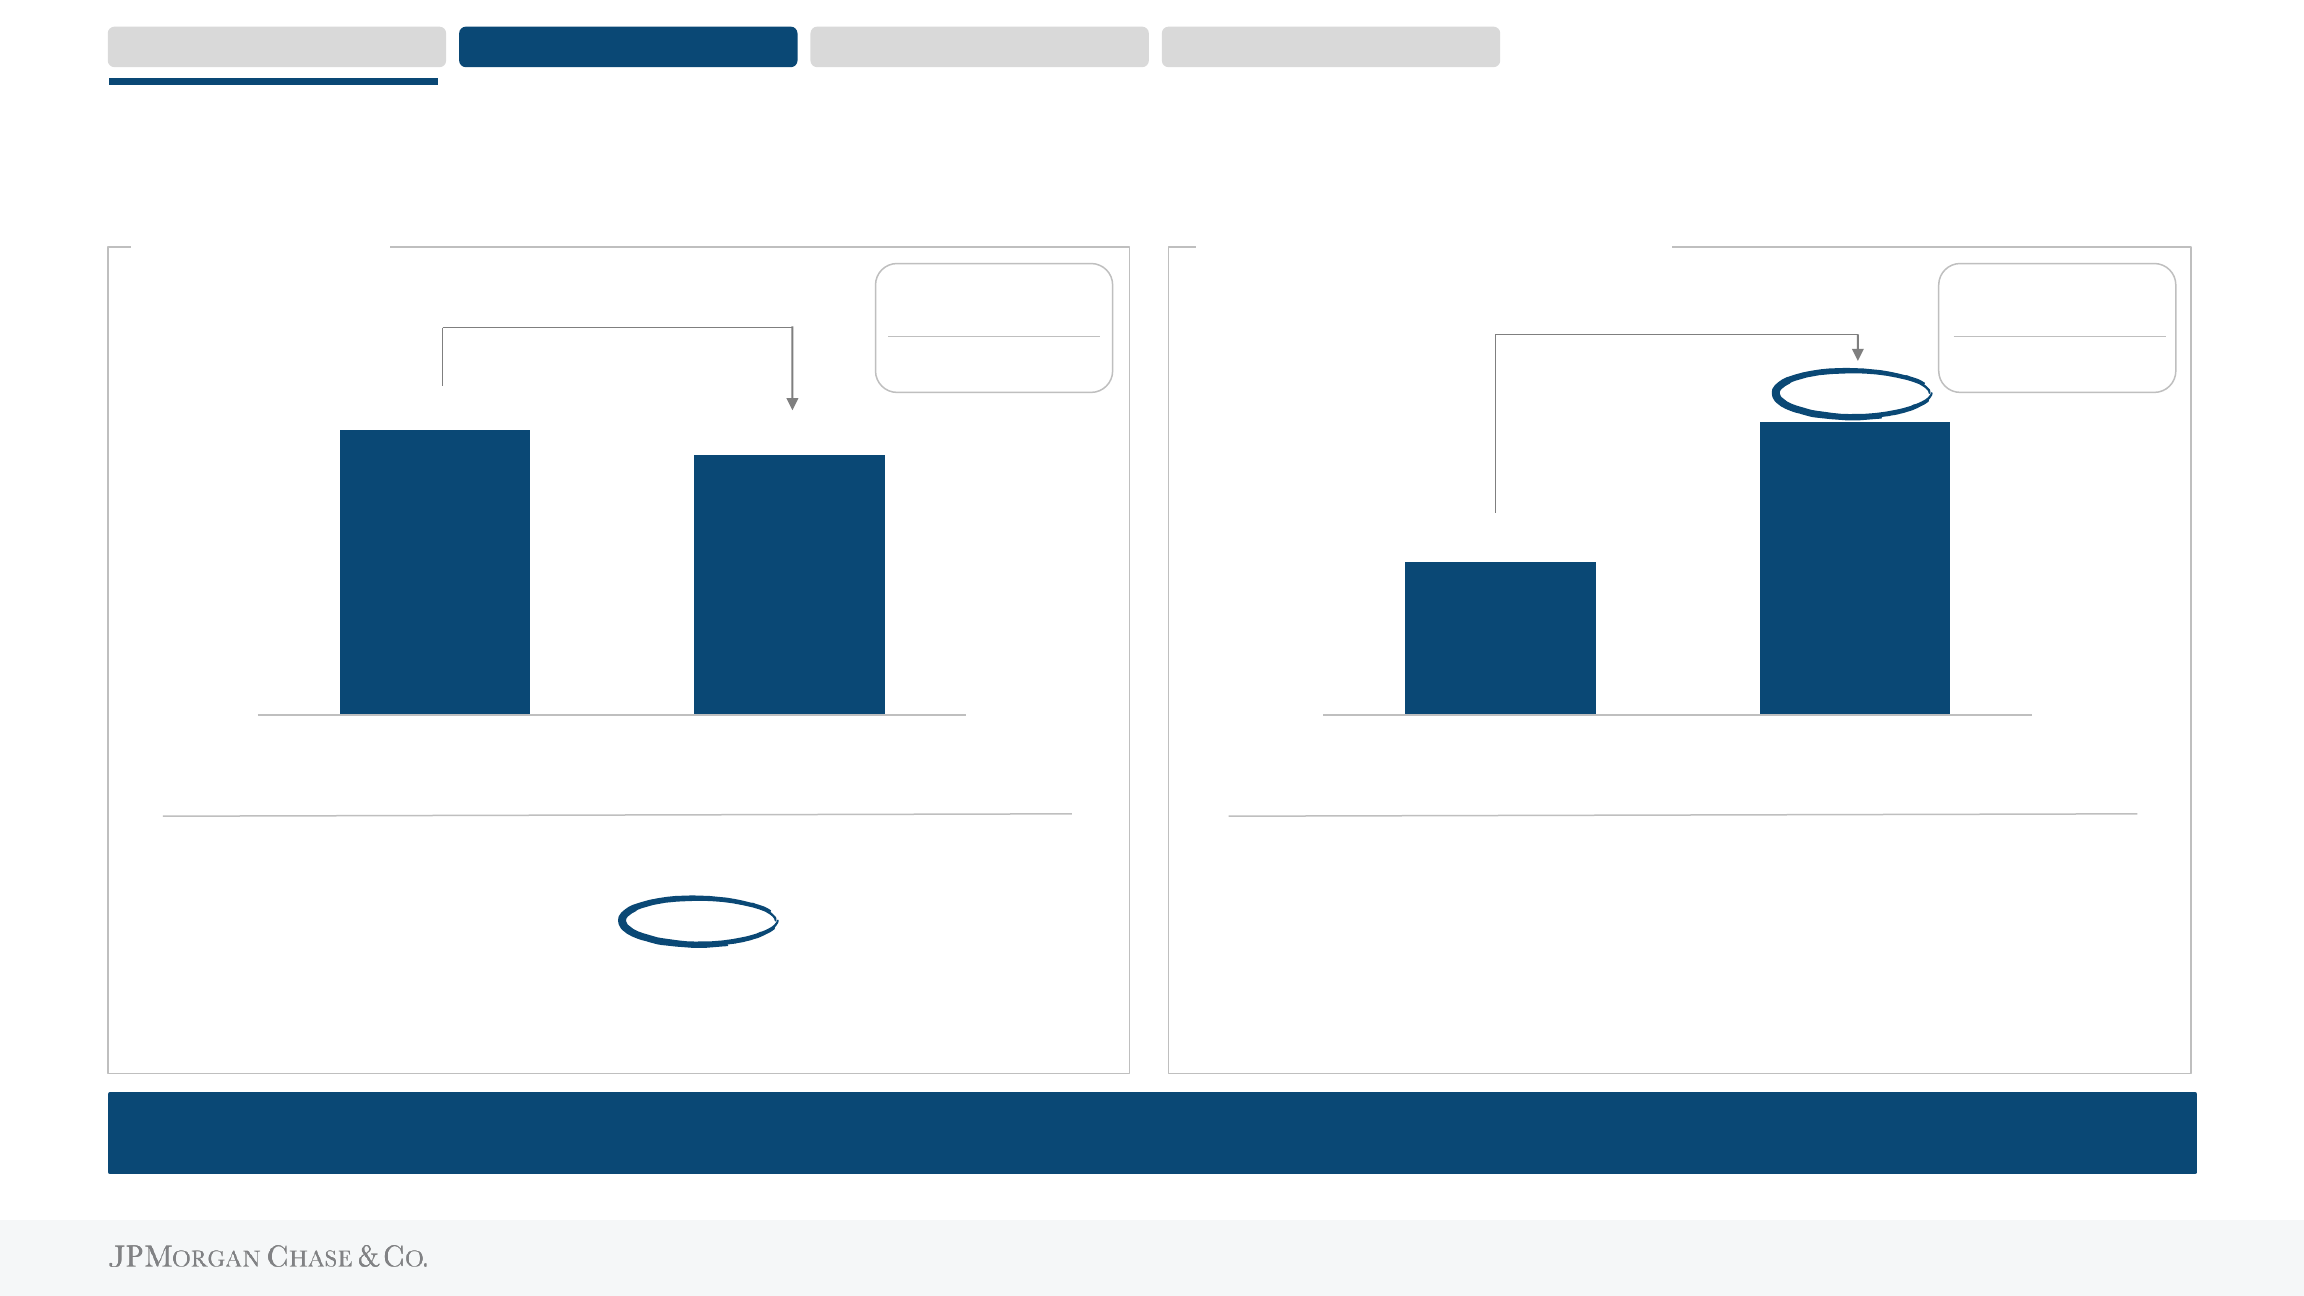
We continue to deliver strong financial performance
CCB Pretax Income ex. LLR ($B)
1,2
For footnoted information, refer to slide 78
8

$49.9
$54.8
$3.5
$1.9
($0.7)
($0.7)
$1.0
2021 Macro rate Volume Overdraft changes Margin MSR / Other 2022
We continue to drive core growth in the business: 2021-2022
▲ Deposit growth
▲ Card loan and spend growth
▼ Increase in Card acquisition costs
▼ Home Lending production volumes
▼ Auto leases
1
In the first quarter of 2023, the allocations of revenue and expense to CCB associated with a Merchant Services revenue sharing agreement were discontinued and are now retained in Payments in CIB. Prior-period amounts have been revised to conform with the current presentation
2
Totals may not sum due to rounding
Net Interest Income ($B)
2022
Actual
~$40
2023
Outlook
ex. FRC
~$50
(
▲
~$10 vs. ‘22)
▲ Card loan yield
▼ Home Lending production margin
▼ Card renewals and refreshes
2
CCB REVENUE ($B)
1
9

$49.1
$54.8
($5.1)
$13.0
($1.0)
($0.3)
($0.9)
2012 Macro rate Volume Overdraft changes Margin MSR / Other 2022
Revenue walk: 2012-2022
Net Interest Income ($B)
2022
Actual
~$40
2023
Outlook
ex. FRC
~$50
(
▲
~$10 vs. ‘22)
Deposit Margin
2
2.57%
Deposit Margin
2
1.71%
1
In the first quarter of 2023, the allocations of revenue and expense to CCB associated with a Merchant Services revenue sharing agreement were discontinued and are now retained in Payments in CIB. Prior-period amounts have been revised to conform with the current presentation
2
Banking & Wealth Management
CCB REVENUE ($B)
1
10

$1,173
$1,134
$80
($47)
($118)
$46
1Q22 Customer growth Customer activity Yield-seeking outflows Yield-seeking inflows 1Q23
We are retaining and growing primary bank relationships and capturing money in motion
▼ JPM WM investments
▼ Internal migration
3
▼ External brokerages
▼ Online banks
▲ Internal migration
6
▲ Net new money
$35
JPM WM investments
$81
retention of yield
seeking flows
7
~60%
of banking customers outflow to
an online bank with no change
in primary bank %
5
~5%
YoY customer
growth
2
>3%
Total yield-seeking inflows
4
52% checking
52% checking
Core
Drivers
~4%
For footnoted information, refer to slide 79
decline in deposit
balances driven by
higher taxes and spend
BANKING & WEALTH MANAGEMENT DEPOSIT BALANCES ($B)
1
11

23.9
24.2
We are maintaining expense discipline while we continue to invest for the future
$23.8
$24.0
~$25
$29.0
$(0.8)
$0.9
$0.1
$31.2
~$(0.1)
~$1.1
~$0.3
~$33
$1.9
~$0.7
2021 Volume- &
revenue-related
Structural Investments Other 2022 Actuals Volume- &
revenue-related
Structural Investments Other 2023 Outlook
Investments
▲ Wage inflation
▲ Higher headcount
▲ Technology
▼ Auto lease depreciation
▲ Core volume growth
▲ Salesforce incentives
$7.0
$5.2
2022
▲ FDIC base
assessment
CCB ADJUSTED EXPENSE ($B)
1,2,3
For footnoted information, refer to slide 80
ex. FRC
12

2021 2022 2023
Outlook
~3% CAGR
$23.8B
~$25B
~30%
Customers per branch
6
>15%
Tenured Advisors
7
>15%
Sales productivity per branch
8
BRANCH NETWORK & FIELD COST PER ACCOUNT
$24.0B
2019 2022 2023
Outlook
(5%)
For footnoted information, refer to slide 81
>20%
Servicing calls per customer
3
>50%
Total transaction volume
4
~5%
Fraud loss rate per transaction
5
OPERATIONS & FRAUD COST PER ACCOUNT
2019 2022 2023
Outlook
(11%)
We are realizing benefits of scale and efficiencies across our business
ADJUSTED EXPENSE
1,2
(EX. INVESTMENTS)ARE GROWING MODESTLY
Other volume-
related
Other structural
Tech production
Operations &
fraud
Branch network
& field
13

$7.1
~$7.9
$2.7
$3.1
$3.2
$3.9
$1.2
$0.9
2022 2023 Outlook
From 2022-2023, we will continue to invest in growing the franchise
Wealth
Management
Connected
Commerce
2
Branch
Network
Marketing
⚫ Roll-off of travel platform operating expenses
⚫ Deal integration & amortization (cxLoyalty, FROSCH)
⚫
Advisor hiring
⚫ New builds in expansion and mature markets
⚫ Banker hiring
⚫ Acquisitions & deepening
⚫ Branding
6 year
payback
4 year
break-even
4 year
break-even
2 – 3x ROI
Growth
businesses
$0.5
$0.4
$1.4
$2.5
Note: marketing investments
are part of ~$8B total gross
marketing spend
3
Technology
& product
⚫ Channels, products, and platform development
⚫ Infrastructure, applications, and data modernization
~50% pays
back in <5
years
4
Disciplined investment process – focus on long-term growth and profitability
$0.7
1
2023
Status
2022 Return
Profile
✓
✓
✓
✓
✓
Distribution
For footnoted information, refer to slide 82
14
CCB INVESTMENTS REPRESENT ~$7.9B OF ~$15.7B IN TOTAL FIRMWIDE INVESTMENTS ($B)

We continue to deliver customer and business value as we modernize our technology
$1.2
$1.4
$1.1
$1.3
$0.3
$0.4
2022 2023 Outlook
~$3.1
Tech
modernization
Product &
design org
Tech modernization: Improve speed and quality to help future-proof the business
Tech product development: Deliver experiences customers love
Tech product
development
$2.7
Channels
Evolve our self-service and
digital capabilities
Products
Offer new products and features
Platforms
Continuously improve to
meet customer needs
Digital channels
Improved self
-service capabilities to
reduce
call volumes by 20% per
customer since 2019
Engagement
Total active digital users up 20%
vs. 2019 as we continue to launch
new features and products
Account opening
~11mm accounts opened digitally, up
37%
vs. 2019
$0.4
Infrastructure
Increase resiliency, scalability,
and delivery
Applications
Faster speed to market
Data
Transform our data housing and
consumption
New data centers & public cloud
~50
%
of applications have migrated out
of legacy data centers, on track to
migrate
~95% by YE 2024
Interoperability
~65%
of customer digital account
opening flows moved to target platform,
on track to reach
99% goal by YE 2023
Cloud migration
~30%
of data is in the public cloud, on
target to reach
50% by YE 2023
Looking forward we expect total CCB investment spend growth to moderate – consistent with a profitable growing franchise
IMPACT BEING DRIVEN BY OUR TECHNOLOGY INVESTMENTS (SELECT EXAMPLES)
1
Note: Totals may not sum due to rounding
15
TECHNOLOGY AND PRODUCT INVESTMENTS ($B)
1

We closely monitor the health of our consumers’ balance sheets (1 of 2)
Median balances are down from their peak but
remain up from pre-pandemic levels
Historical avg. Pandemic high Mar '23
Median deposit balances
Total population
Historical avg. Pandemic high Mar '23
Median operating cash buffers
3
(days)
Total population
Jan ‘20
Mar ‘23
17%
19%
Median nominal income growthvs. inflation
Inflation rate
Nominal income growth (Stable cohort - all incomes)
Nominal income growth (Stable cohort - lowest incomes)
Operating cash buffers remain above pre-pandemic levels
and continue to slowly normalize
Nominal incomes are up but inflation
has impacted real wage gains
All incomes
+84% +21%
Lowest incomes
2
+115% +31%
All incomes
+126%
+75%
Lowest incomes
2
+183%
+92%
31%
4
Stable cohort
1
Stable cohort
1
5
6
For footnoted information, refer to slide 83
16
98%
54%
84%
21%
We closely monitor the health of our consumers’ balance sheets (2 of 2)
39%
11%
9%
36%
4%
3%
FY22 vs. FY19 Apr YTD ('23 vs. '22) Apr ('23 vs. '22)
Total credit and debit spend growth
1
Total population
Change in credit spend Change in debit spend
Overall, spend remains solid as our portfolio is growing
We also track the same customers’ spend over time and see
they have recently started to trade down
$169
$180
4Q19 1Q23
Period-end card outstandings ($B)
3
7%
O/S ($) per
account
Revolve O/S
($) over
same time
period up
~3%
While the number of customers who revolve continues to
normalize, those that do revolve have higher balances
10%
O/S ($) per revolving account
Driven by…
14%
% of revolvers (#)
5
17%
2.4%
-
0…
20%
3.5%
0.3%
FY22 vs. FY19 Apr YTD ('23 vs. '22) Apr ('23 vs. '22)
Credit spend growth
1
Stable cohort
2
All incomes Lowest incomes
(1.2%)
Total population
(9%)
Stable cohort
4
(All incomes)
(5%)
All
incomes
+15%
/ +23% +3% / +2% (2%) / 0%
Lowest
incomes
+19%
/ +23% +4% / +2% 0% / 0%
Stable credit cohort discretionary and non-discretionary spend mix
Total
population
+38%
/ +38%
+10%
/
+8%
+7% / +6%
Credit and debit discretionary and non-discretionary spend mix
For footnoted information, refer to slide 84
17

We’ve maintained a prudent risk profile while we continue to grow the business (1 of 2)
Card
1
Issuer
Sub-Prime Mix Sub-Prime Mix 30+ DQs
Net Credit
Losses
3
4Q19 4Q22
4Q22 as a % of
4Q19
4Q22 as a % of
4Q19
Peer 1 N/D N/D 63% 46%
Chase 16% 13% 78% 54%
Peer 2 18% 16% 77% 56%
Peer 3 20% 18% 97% 70%
Peer 4 23% 20% 79% 59%
Peer 5 32% 20% 79% 70%
Peer 6 28% 26% 82% 68%
Peer 7 33% 31% 87% 75%
Auto
1,2
Issuer
30+ DQs Net Credit Losses
3
4Q22 as a % of 4Q19 4Q22 as a % of 4Q19
Peer 1 82% 87%
Chase 89% 80%
Peer 2 99% 111%
Peer 3 103% 137%
INDUSTRY RISK PERFORMANCE METRICS
1
Peer information sourced from public disclosures
2
Chase Auto excludes Wholesale (DCS) & Lease
3
Represents net charge-offs
18

We’ve maintained a prudent risk profile while we continue to grow the business (2 of 2)
2012 2019 2022
Card
% of portfolio
<660 FICO score
1
16% 16% 13%
% of outstandings from balance
parker segment
2
20% 9% 5%
Auto
3
% of portfolio
<660 credit score
4
22% 18% 16%
% of portfolio
<660 FICO score and
LTV >120
5
1.6% 2.1% 1.3%
Home
Lending
6
Owned
-portfolio avg. FICO
1
692 758 769
Owned
-portfolio avg. CLTV 79% 55% 51%
2019 2022 ∆
Card
% of originations <660 credit score
Industry
7
10% 13% 3ppts
Chase 3% 3% -
Auto
3
% of originations with term ≥84 months
Industry
7
12% 18% 6ppts
Chase 5% 5% -
Home
Lending
% LTV >80 HFI jumbo origination mix
Industry
8
11% 13% 2ppts
Chase 9% 10% 1ppt
ORIGINATION RISK METRICSPORTFOLIO RISK METRICS
For footnoted information, refer to slide 85
19

Credit continues to return to pre-pandemic levels
⚫
Consumer balance sheets and credit remain healthy,
continuing a path of normalization
⚫
Leading credit indicators – notably early delinquency roll-rates
– remain below pre-pandemic levels
⚫
Card entry to delinquency rates are ~80% of pre-pandemic
levels, up from the low point in 2Q21
⚫
Chase Auto loan portfolio loss performance has normalized
to pre-pandemic levels
2019 2020 2021 2022 2023 Outlook
Card
3.10% 2.93% 1.94% 1.47% ~2.6%
Auto
0.33% 0.20% 0.05% 0.21% ~0.5%
Retail only 0.44% 0.25% 0.04% 0.24% ~0.55%
Home Lending
(0.05%) (0.09%) (0.17%) (0.14%) ~0.0%
Business
Banking
1
0.58% 0.57% 0.53% 0.40% ~0.6%
ex. Overdraft 0.47% 0.48% 0.41% 0.17% ~0.35%
< 3.5%
2024 Outlook
> 3.5%
2025 Outlook
CREDIT RISK OUTLOOK NET CHARGE-OFF GUIDANCE
1
Excludes Paycheck Protection Program loans
20

⚫ Primary driver of stress scenario is unemployment rate (UER)
⚫ Losses typically lag UER, and will vary depending on when UER peaks and shape of recovery
⚫ Table on the right shows annualized average losses over the two-year period 1Q24-4Q25, and cumulative losses over the same period
Annualized avg. (%) Cumulative ($)
Central case ~3.5% ~$15.5B
Moderate
recession scenario
~4.8% ~$18.8B
Incremental
+130bps +$3.3B
Estimated 2-Year net credit losses (2024-2025)
Unemployment rate
0%
1%
2%
3%
4%
5%
6%
7%
8%
4Q22 1Q23 2Q23 3Q23 4Q23 1Q24 2Q24 3Q24 4Q24 1Q25 2Q25 3Q25 4Q25 1Q26 2Q26 3Q26 4Q26
Moderate recession (peak 3Q24) Central case
5.1%
7.1%
KEY ASSUMPTIONS – NOT AN OUTLOOK
1
Stress scenario analysis for Card
1
Federal Reserve's 2022 DFAST Results and Methodology Disclosure remains instructive data point for more severe recession
21
Our Home Lending portfolio is in a position of strength with low delinquencies and strong LTVs
Our business is well-positioned given current
levels of equity and portfolio quality
Home Lending portfolio by CLTV
1,2
30+ Delinquency % (based on $)
Financial Crisis Pre-Covid Current
2010
3
Mar ‘20 Mar ‘23
13.5% 1.5% 0.8%
We continue to prepare for a variety of
stress scenarios
30+ delinquency rate at 0.2% if vintages prior to
2010 are excluded
~5% of portfolio resides in 80%+
HPI trough
(5%) (15%)
Peak UER
5.1% 7.1%
Central
case
Moderate
recession
Estimated 2024-2025 NCOs ($mm)
< 100
< 300
47%
21%
16%
11%
4%
1%
<50% 50-60% 60-70% 70-80% 80-90% >=90%
Home prices remain elevated but have begun to
decline from recent peaks
Major markets with >10% forecasted HPI
4,5
declines from peak to YE 2023
▪ Additional expected decline (current to Dec’23)
▪ Actual decline (2022 peak to current)
▪ % HFI 2022 originations
6
-13%
-11%
-10%
-9%
-11%
-6%
-9%
-7%
-9%
-6%
-8%
-6%
-7%
-7%
-7%
-8%
-6%
-8%
-5%
-7%
-4%
-7%
-5%
-3%
9%
6%
2%
3%
3%
1%
1%
3%
1%
1%
4%
11%
-20%
-18%
-17%
-17%
-16%
-14%
-14%
-14%
-13%
-13%
-13%
-10%
San Francisco-Oakland-Hayward, CA
Seattle-Tacoma-Bellevue, WA
Austin-Round Rock, TX
Phoenix-Mesa-Scottsdale, AZ
San Jose-Sunnyvale-Santa Clara, CA
Portland-Vancouver-Hillsboro, OR-WA
Las Vegas-Henderson-Paradise, NV
Denver-Aurora-Lakewood, CO
Sacramento-Roseville-Arden-Arcade, CA
Nashville-Davidson-Murfreesboro-Franklin, TN
San Diego-Carlsbad, CA
Los Angeles-Long Beach-Anaheim, CA
For footnoted information, refer to slide 86
22

We run our business for the long-term and manage through cycles
Forward-looking guidance of 25%+ ROE through the cycle
Current outlook is
uncertain
as macro factors may pressure
short term returns
Benefits of
reprice lags
Deposit outlook Credit trends
We leverage the power
of the CCB franchise
remaining confident in our
strategies through cycles
Scale of our
customer
relationships
Strength and
diversification of
our businesses
Operational
excellence and
discipline
Investment
through cycles
with unmatched
capacity
23

We have consistently driven core growth and strong returns over the long term
For footnoted information, refer to slide 87
$11.7
$12.3
$13.4
$14.4
$15.2
$15.0
$19.4
$21.7
$18.8
$18.1
$20.9
2012 2013 2014 2015 2016 2017 2018 2019 2020 2021 2022
$1,066 $2,249
7.1% (#3) 10.9%
(#1)
20.5% (#2)
22.4%
(#1)
17.7% (#1)
17.3%
(#1)
6.2% (#3) 9.3% (#1)
Fed Funds effective rate
6
CCB pretax income ex. LLR ($B)
5
CCB ROE ex. LLR
5
Client balances ($B)
7
: 8% CAGR
Retail deposit share (%)
8
: +380bps
Card sales market share (%)
9
: +190bps
BB Primary bank share (%)
10
: +310bps
0.14%
0.11%
0.09%
0.13%
0.40%
1.00%
1.83%
2.16%
0.38%
0.08%
1.68%
16%
15%
15%
17%
18%
18%
28%
31%
26%
26%
31%
Card O/S share (%): (40bps)
Card O/S share is
up >200bps since
2012 when
adjusting for risk-
appetite
CONSUMER & COMMUNITY BANKING – 10-YEAR PERFORMANCE
1,2,3,4
24

25

We are making strong progress against our strategy
#1
retail bank based on
deposits
1
Consumer
Banking
Branch
Network
⚫ Grow: ~40mm customers, up 14% since 2019
2
⚫ Engage: ~80% primary bank
⚫ Deepen: ~50% of primary customers are multi-LOB
3
1
st
bank in all lower
48 states
⚫ Grow: #1 deposit share in 11 of top 50 markets
4
⚫ Engage: >75% of balances held by regular branch visitors
5
⚫ Deepen: ~20% increase in banker productivity since 2019
Optimize and extend our
branch network to reach and
gain trust in more local
communities
Strengthen and tailor our
customer value propositions
to extend leadership
position
Consumer Banking Branch Network Business Banking Card & Connected Commerce
WE’RE THE MARKET LEADER OUR STRATEGY IS WORKING AND WE WILL EXTEND OUR LEAD
For footnoted information, refer to slide 88
26
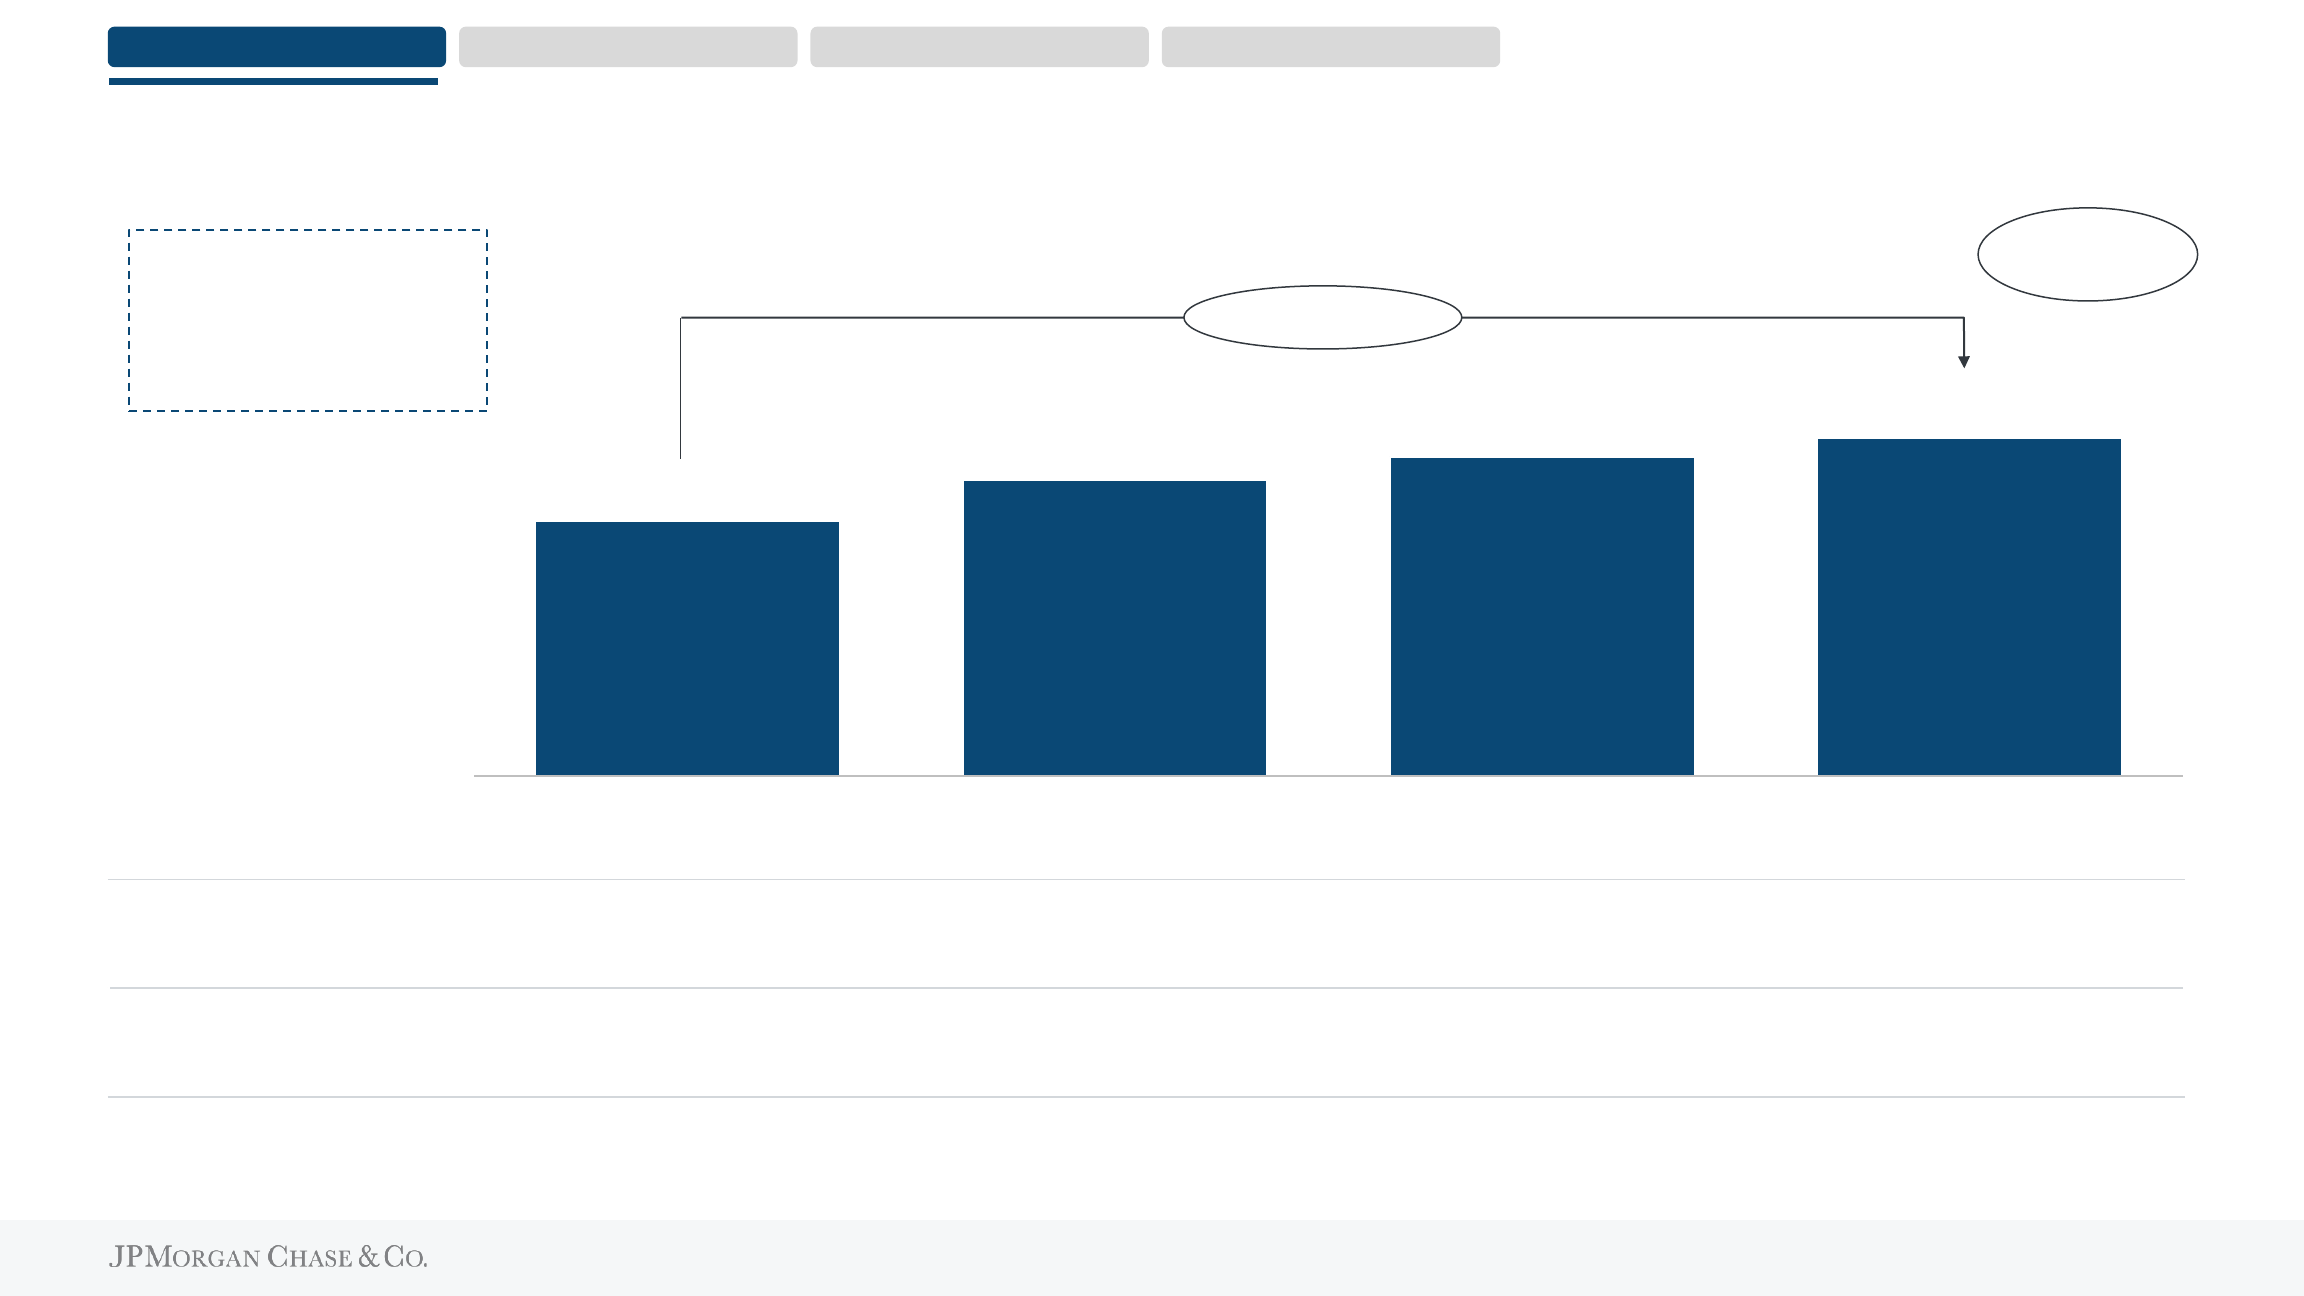
We have continued to drive core growth in our business
Consumer Banking Branch Network Business Banking Card & Connected Commerce
27
1
“Consumer Banking customer” reflects unique individuals that have financial ownership or decision making power with respect to Consumer Banking accounts
14%
11%
35.4
37.9
39.2
40.4
2019 2020 2021 2022
14%
We added 1.6mm
net new checking
accounts in 2022
4.5%
CAGR
Consumer Banking customers (mm)
1
Average deposits ($B)
$535 $629 $772 $848
Debit card sales ($B)
$314 $339 $414 $431

18.3%
11.3%
10.1%
Our core customer growth has driven significant outperformance
9.1%
9.9%
9.8%
10.9%
10.3%
9.8%
2019
2022
2019
2022
2019
2022
#3 #1 #1 #2 #2 #3
Rank
4
+180bps +40bps flat
Chase Peer 1 Peer 2
Chase Large Banks
2
Industry
(ex. Chase)
3-year deposit CAGR
1
WE OUTPERFORMED PEERS IN DEPOSIT GROWTH SINCE 2019…
National retail deposit share
3
…WHICH HAS LED TO ~180BPS OF DEPOSIT SHARE GAIN
Consumer Banking Branch Network Business Banking Card & Connected Commerce
For footnoted information, refer to slide 89
28

Satisfied
Loyal
Engaged
Our primary bank customers are satisfied, loyal, and engaged
~80%
of primary bank customers
would recommend Chase
2
of Consumer Banking checking customers
partner with us as their primary bank
1
~80%
of Consumer Banking Gen Z and Millennial
consumer checking customers are primary bank
retention rate among
primary bank customers
4
>95%
>75%
>75% >75%
of customers are
mobile active
7
of balances held by customers
who regularly use branches
6
customer satisfaction across
branch and digital channels
3
Record high
of primary bank customers choose
Chase for other financial needs
5
~50%
Consumer Banking Branch Network Business Banking Card & Connected Commerce
For footnoted information, refer to slide 90
29

Our customers engage with Chase to make payments and manage their finances
2019 2022
Cash & check
Debit
Digital
~40%
(25%)
~26mm
active Zelle
customers
2
>35
monthly debit transactions
per active debit customer
3
2019 2022
Mobile-active
>75%
+9ppts
Not mobile-active
~50%
of mobile-active Consumer
Banking users engage with
our financial health tools
5
~9B
digital logins by
Consumer Banking
users
6
Transactions by method of payment
1
CUSTOMERS ARE SHIFTING TO DIGITAL PAYMENTS…
Mobile engagement
4
…AND USING THE CHASE APP TO MANAGE THEIR FINANCES
Consumer Banking Branch Network Business Banking Card & Connected Commerce
For footnoted information, refer to slide 91
30

Wealth
Management
Business
Banking
Credit
Card
Home
Lending
>75%
of retail volume is from
Consumer Banking
customers
>75%
of Business Banking clients
also have a Consumer
Banking relationship
>45%
of Branded Card members
are also Consumer
Banking customers
1
~90%
of Wealth Management
relationships also have a
Consumer Banking relationship
2
~50% of Consumer Banking primary customers are engaged across products
Increases relationship value
Strengthens banking relationship
Lowers cost of acquisition
Consumer
Banking
CONSUMER BANKING SERVES A HIGH PROPORTION OF CUSTOMERS ACROSS EACH LOB AND GENERATES TREMENDOUS VALUE FOR THE FIRM
Consumer Banking Branch Network Business Banking Card & Connected Commerce
31
1
Excludes small business customers
2
Consumer and small businesses with Wealth Management relationships with balances >$0

We continue to strengthen our value proposition to meet the needs of customers across segments
2019 2022
2019 2022
Products &
Services
Advice
⚫ Launched Early Direct Deposit on Secure
Banking
⚫ Launching Freedom Rise for new-to-credit
⚫ Scaled Community Centers and branches
to build trust and financial health locally
⚫ Developing Credit Journey features for
credit building and new-to-credit
⚫ Deployed higher yield options for cash
management
⚫ Improved payments experiences
⚫ Launched Wealth Plan to help clients plan
for the future
⚫ Adding banker and advisor capacity to
serve more client needs
Low-cost entry to banking with tailored
solutions to build financial health
Relationship proposition to meet
banking, lending, and investing needs
2019 2022
⚫ Strengthened Overdraft Assist with next day
no fee / $50 buffer
⚫ Launched Pay in 4 to select customers
⚫ Launched Personal Advisors for mass
affluent clients looking for low-cost advice
⚫ Continuing branch expansion to serve more
communities
Full-service banking solution to meet
spend, save, and liquidity needs
Emerging segments Affluent segmentsMass market segments
~75%
~5%
~20%
% of accounts
4
# OF LOW-COST
CHECKING ACCOUNTS
1
# OF MASS MARKET
CHECKING ACCOUNTS
2
# OF PRIVATE CLIENT RELATIONSHIPS
WITH DEPOSITS AND INVESTMENTS
3
Consumer Banking Branch Network Business Banking Card & Connected Commerce
~40%
~10%
~30%
For footnoted information, refer to slide 92
32

33
5,293
4,831
2017 2022
We have accelerated our growth as we have extended and optimized our branch network
$119
$227
2017 2022
Chase Large banks
2
(ex. Chase)
% of current network opened
in the last five years
4
15% 3%
% of network consolidated in
the last five years
5
22% 24%
(1.8%) CAGR
Large Banks
2
(ex. Chase)
(4.7%) CAGR
13.8% CAGR
Large banks
2
(ex. Chase)
$165mm
3
Chase Large banks
2
(ex. Chase)
Deposits per branch
(10+ years cohort)
4
$259mm $170mm
Deposits per branch
(5
-10 years cohort)
4
$154mm $97mm
BRANCH COUNT
1
DEPOSITS PER BRANCH ($mm)
1,6
Consumer Banking Branch Network Business Banking Card & Connected Commerce
We have increased the number of consumer and small business customers per branch by ~30% from 2019 to 2022
7
For footnoted information, refer to slide 93
34
Network expansion creates an unparalleled growth engine
Meaningful contribution:
7%
3%
15%
5%
3%
6%
79%
88%
94%
ChaseLarge banks
2
(ex. Chase)
0-5 years
10+ years
~$85B
in deposit growth since
2017 from branches
<10 years old
3
5-10 years
~4 year
break-even on
new builds
4
More upside:
~$160B
in incremental deposits as our
branches mature to look like our
seasoned network
5
<5%
branch share in 19 of the top 50
markets, including 3 of the top 10
(DC, Boston, Philadelphia)
1,6
Industry
Branch network by age cohort
1
WE HAVE INVESTED IN NEW BRANCHES FASTER THAN PEERS
THESE INVESTMENTS ARE CONTRIBUTING MEANINGFULLY
TO OUR PERFORMANCE, WITH MORE UPSIDE
Consumer Banking Branch Network Business Banking Card & Connected Commerce
For footnoted information, refer to slide 94
35

We have a demonstrated ability to grow in different starting positions and markets
11.6%
14.8%
20.4%
2012 2017 2022
1.6%
4.2%
6.3%
2012 2017 2022
0.8%
2012 2017 2022
Out of footprint
8.8ppts
111
new builds from
2012-2022
4
~$9B
deposit growth from
2012-2022
1
~$2B
deposit growth from
2017-2022
1
4.7ppts
13.7% 16.5% 16.9%
Branch
share
2
5.7% 6.7% 8.7%
Branch
share
2
0.0% 0.0% 2.6%
Branch
share
2,3
~$86B
deposit growth from
2012-2022
1
42
new builds from
2017-2022
4
35
new builds from
2012-2022
4
0.8ppts
Deposit share
1
LOS ANGELES
Deposit share
1
ATLANTA
Deposit share
1
BOSTON
Consumer Banking Branch Network Business Banking Card & Connected Commerce
For footnoted information, refer to slide 95
36

Branches are an important part of our omnichannel service and engagement model
2019 2022
Branch-
centric
Multi-
channel
Digitally-
centric
2019 2022
>75% of balances are held by customers
who regularly use branches
(~25%)
~20%
Everyday branch transactions
1
WE ENABLE CUSTOMERS TO SELF-SERVE
Balance by customer channel engagement behavior
2
CUSTOMERS CONTINUE TO VISIT BRANCHES
Productivity per banker
3
WE ARE MEETING MORE CLIENT NEEDS
Consumer Banking Branch Network Business Banking Card & Connected Commerce
For footnoted information, refer to slide 96
37
Wealth
Management
Business
Banking
Credit
Card
Home
Lending
Our branches are the storefront for JPMC across lines of business
~50%
of mortgages are
originated in branches
2
~85%
of business checking accounts
are opened in branches
~25%
of Branded credit cards are
opened in branches
>85%
of first-time investors come
from banker referrals
1
Branch team
of experts
OUR BRANCH TEAMS GENERATE TREMENDOUS VALUE FOR THE FIRM ACROSS CCB AND JPMC MORE BROADLY
Creates a talent pipeline
Serves a wide range of client needs
Drives acquisitions across channels
Consumer Banking Branch Network Business Banking Card & Connected Commerce
38
1
Represents first-time investors with full-service relationships through Chase Wealth Management
2
Represents mortgage originations from branch Home Lending Advisors

We are extending our network to cover more Americans and gain trust in local communities
5,293
Branches
1
4,831
~60%
U.S. population coverage
by market
3
~80%
50%
U.S. populationcoverage
within a 10-minute drive time
4
60%
68%
Small business coverage
5
87%
$4.4T
Addressable deposits
6
$7.9T
~85%
coverage
by market
Looking ahead:
~70%
coverage within a
10-minute drive time
2017 CHASE BRANCH NETWORK COVERAGE BY STATE
1
2022 CHASE BRANCH NETWORK COVERAGE BY STATE
1
Consumer Banking Branch Network Business Banking Card & Connected Commerce
Increasing branch share
2
For footnoted information, refer to slide 97
39

40
41
585
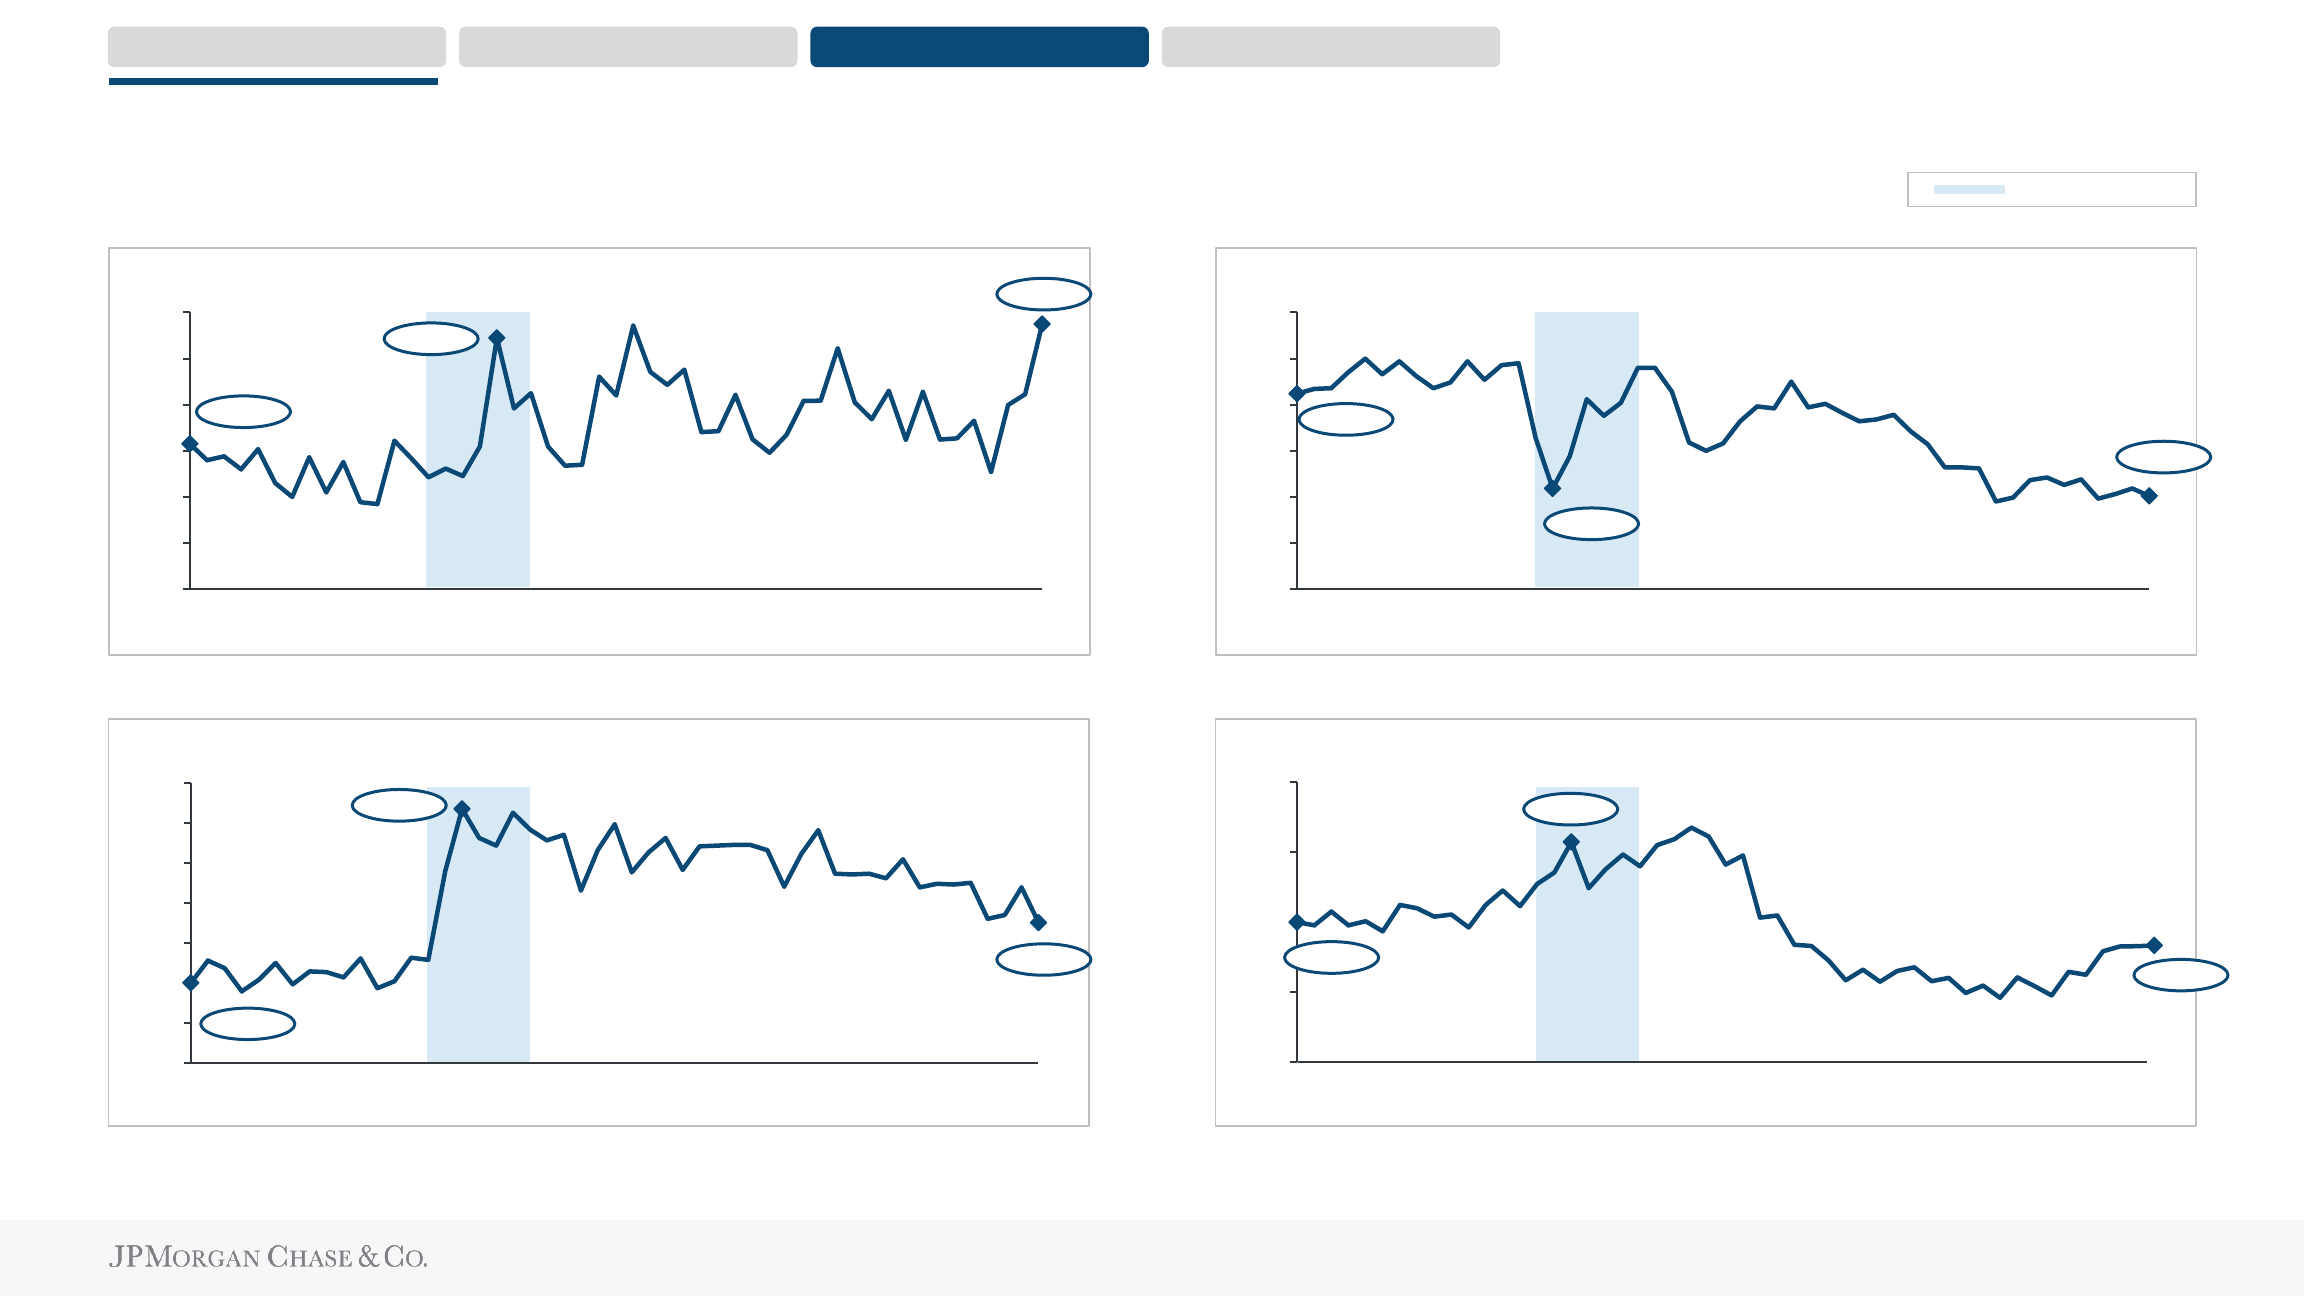
The small business ecosystem remains healthy despite economic headwinds
Monthly small business formations (#k)
1
Small business formations are elevated vs. pre-pandemic…
40
140
240
340
440
540
640
Jan-19 Jan-20 Jan-21 Jan-22 Jan-23
Consumer Banking Branch Network Business Banking Card & Connected Commerce
Small business optimism index
2
…and while optimism remains low…
80
85
90
95
100
105
110
Jan-19 Jan-20 Jan-21 Jan-22 Jan-23
Cash buffers (# of days of reserves, indexed to start of period)
3
…our clients are healthy, with strong cash buffers…
30-day delinquency rates (relative to start of period)
3
…and relatively low delinquencies
60%
80%
100%
120%
140%
160%
180%
200%
Jan-19 Jan-20 Jan-21 Jan-22 Jan-23
-0.8%
-0.4%
0.0%
0.4%
0.8%
615
355
101
90
100%
187%
130%
Start
91
Pandemic peak
Jan-19 Jan-20 Jan-21 Jan-22 Jan-23
+46bps
-13bps
-80bps
-40bps
0bps
+40bps
+80bps
1
Source: U.S. Census – Business and Industry Time Series, Monthly Business Formation Statistics; not seasonally adjusted
2
Source: NFIB: Optimism Index
3
Cash buffers data based on fixed cohort of clients active in both January 2020 and November 2022, with balances/outflows tracked from January 2019–March 2023; delinquency rates based on both Business Banking line/loan and Chase Small Business Card – excl. PPP loans, overdrafts

42
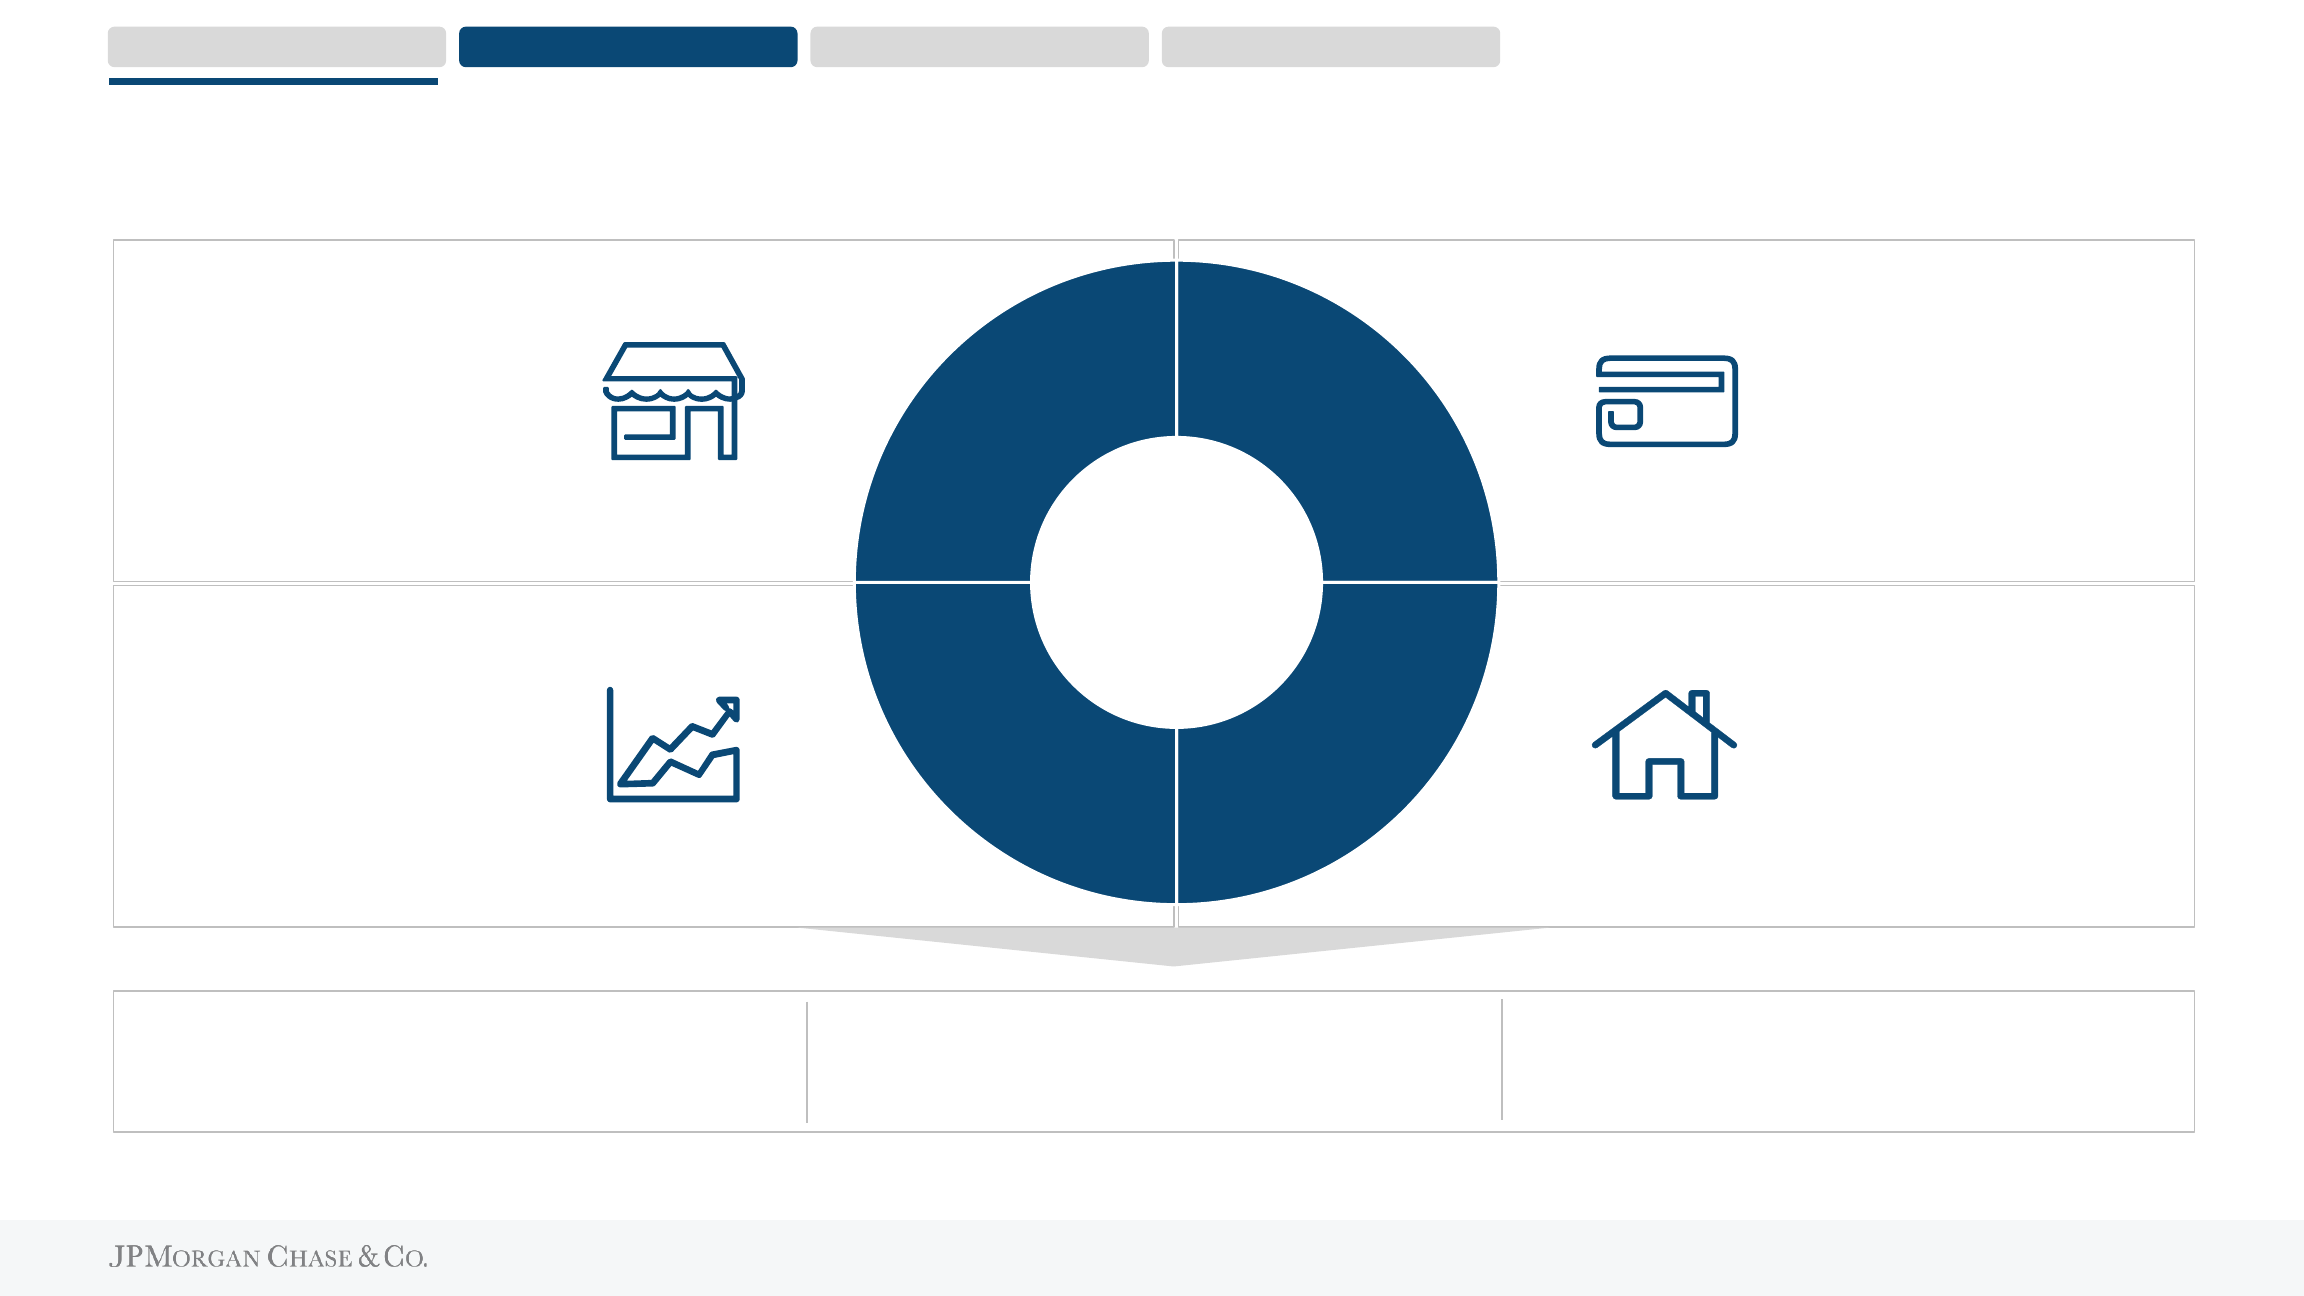
We serve ~6mm small- and medium-sized businesses (SMBs) across Chase for Business
1
Consumer Banking
Entrepreneurs who start businesses
Chase for Business
<$20mm sales size
Commercial Banking
~$20mm-$2B sales size
2
Corporate & Investment Bank
>$2B sales size
Business Banking Business Card Payments Services
#1
Primary bank market share
3
Today’s focus
#2
SMB credit card spend
3
#1
Payment provider for Business
Banking clients
1
Consumer Banking Branch Network Business Banking Card & Connected Commerce
1
6MM client count as of December 2022; payment provider rank as of April 2023
2
Annual sales size thresholds are directional and do not apply to select core segments and specialized industries within Commercial Banking
3
Primary bank market share sourced from Barlow Research Associates as of 4Q22. Rolling 8-quarter average of small businesses with sales size between $100k-$25mm; SMB credit card spend share based on internal estimates of Nilson (only 2021 available) and 2022 actuals if available

43
We help businesses of all sizes start, run, and grow with Chase
WE SERVE ALL TYPES OF SMALL- AND
MEDIUM-SIZED BUSINESSES…
~65%
of BB clients start in
Consumer Banking
~30%
of large BB clients
started as small clients
2
>15%
of new Middle Market
relationships come
from BB
1
Start Run Grow
~40%
~50%
~10%
<$100k $100k-$1mm >$1mm
(1) Professional Services
(2) Real Estate
(3) Construction
(4) Retail
(5) Healthcare
(6) Transportation
(7) Other
6.2%
9.3%
2012 2022
#3 #1
+310bps
Primary bank market share and rank
3
Annual sales size and industry mix of BB clients
Consumer Banking Branch Network Business Banking Card & Connected Commerce
1
2
3
4
5
6
7
…HELPING THEM START,
RUN, AND GROW…
…EARNING US THE RIGHT TO BE THE
TOP BUSINESS BANK IN THE U.S.
1
Data reflects FY2022
2
Large clients defined as businesses with an annual sales size of $1mm or greater; Small clients defined as businesses with an annual sales size of under $1mm; captures client sales size growth between 2020 and 2022
3
Primary bank market share sourced from Barlow Research Associates as of 4Q22. Rolling 8-quarter average of small businesses with sales size between $100k-$25mm

44
Our business is growing rapidly and delivers strong economics
Business Banking clients (mm)
2.9
3.2
3.5
3.8
0
0.5
1
1.5
2
2.5
3
3.5
4
2019 2020 2021 2022
Average deposits ($B)
$136 $175 $226 $259
Average loans
ex. PPP ($B)
$24 $24 $22 $20
Primary bank rank
1
#1 #1 #1 #1
30%
OUR BUSINESS HAS GROWN SIGNIFICANTLY…
~3x
higher balances per average BB
account vs. average Consumer
Banking account
~80%
of balances in noninterest-
bearing checking accounts
~9% CAGR
+ 90%
since ‘19
We originated >340k
net new checking
accounts in 2022
Consumer Banking Branch Network Business Banking Card & Connected Commerce
…THESE RELATIONSHIPS
HAVE STRONG ECONOMICS
1
Primary bank market share sourced from Barlow Research Associates as of 4Q22. Rolling 8-quarter average of small businesses with sales size between $100k-$25mm

45
The key to our success is continuing to win clients’ primary bank relationships
Are satisfied
~70%
digital and
~85%
branch satisfaction
Are loyal
~95%
retention rate
1
Are engaged
~75%
use multiple channels
2
Have higher balances
~4x
higher balances vs. non-primary
Have multiple products
~10ppts
higher SMB card ownership
2 of 3
Chase Business Banking clients choose us for
their primary operating account
These clients:
2. An industry-leading
omnichannel service model
anytime, anywhere, in the channel
of their choice
1. A complete suite of products and
services that make Chase the
best place to start, run, and grow a
small business
PRIMARY CLIENTS ARE SATISFIED, LOYAL, AND ENGAGED
Consumer Banking Branch Network Business Banking Card & Connected Commerce
WE EARN PRIMARY BANK RELATIONSHIPS THROUGH
BEST-IN-CLASS SOLUTIONS AND EXPERIENCES
1
Excluding businesses <2 years old from formation
2
Both digital and branch active in 2022

46
Our comprehensive suite of financial products and services makes Chase the best place to start, run, and
grow a small business
✓ Entry-level and premium checking
✓ LegalZoom partnership
✓ Payments services including Zelle, Wires, Bill Pay
✓ Coming soon: Digitizing more customer activities
✓ Coming soon: Invoicing
Banking and Cash Management
Invoicing
✓ Entry-level, premium, and co-brand credit cards
✓ SBA
1
, small- and large-dollar lending, digital lending
✓ Coming soon: Expanding Credit Journey
Credit Card / Lending
Lending platform modernization
⚫
6 app inputs
(vs. 50+)
2
⚫
<5 mins to
complete
⚫
Automated
post-app
tasks
✓ Merchant Services integrated with core banking
✓ Everyday 401(k)
✓ Fraud Hub
✓ Coming soon: Tap To Pay
✓ Coming soon: Payroll
Merchant and Adjacent Services
Everyday 401(k)
Consumer Banking Branch Network Business Banking Card & Connected Commerce
1
Small Business Administration
2
Comparison reflects comparable product on modernized platform vs. legacy

47
Our best-in-class omnichannel offering allows us to serve our clients anytime, anywhere, in the channel of
their choice
Multi-
channel
~80%
of clients are
digitally active
~65%
of clients are multi-
channel active
Deliver more omnichannel experiences:
⚫ Interactive demos for prospects
⚫ Video meetings for bankers and clients
⚫ Schedule a banker meeting online
Amplify our digital channels with:
⚫ Enhanced merchant offers
⚫ Expanded Credit Journey
⚫ Enhanced customer insights
>1B digital log-ins
in 2022
~85% branch satisfaction,
~70% digital satisfaction
Serving our
clients anytime,
anywhere, in the
channel of their
choice
Digital
People
Physical
Network
~90%
of assigned
clients met with a
Relationship Manager
2
~80%
of clients visit a
branch
Continue to leverage our expanding branch
footprint which currently covers 87% of U.S.
small businesses
1
Hire ~1,000 Relationship Managers by 2025,
given assigned clients have:
⚫ Higher retention
⚫ More multi-product relationships
⚫ Higher customer satisfaction
~4,800 Chase branches,
>15,000 ATMs
~12,000 Consumer Bankers &
~2,300 Business Relationship
Managers
Consumer Banking Branch Network Business Banking Card & Connected Commerce
1
Small business coverage by CBSA based on Dun and Bradstreet Small Business locations. Small business defined as <$20mm in annual sales size
2
180-day contact rate for clients assigned to either a remote or in-person Business Relationship Manager

48
The value of Business Banking relationships extends to the rest of CCB and JPMC
>15%
of new Middle Market
relationships came from
BB last year
~40%
of total CCB deposits held
by BB clients
1
>5ppt
higher share of Private
Bank client wallet when
they have BB relationship
2
~50%
more Business Card
clients with a BB
relationship vs. 2019
>75% >2x
of accounts opened by existing CCB
clients are originated without a
marketing offer
higher average BB client revenue when
clients have multiple CCB relationships
(vs. BB-only)
Increased revenue per clientLower cost of acquisition
Business Banking
generates
tremendous value
for the Firm…
…and benefits
significantly from
CCB and JPMC
Card
Banking &
Wealth
Private
Bank
Commercial
Banking
Business
Banking
Consumer Banking Branch Network Business Banking Card & Connected Commerce
1
Includes deposits held by Business Banking clients in business and personal accounts; as of January 2023
2
Excludes Private Bank clients who are only associated with Business Banking clients generating <$100k sales size, and client records that do not have wallet share data available; as of May 2023

49
We have a compelling opportunity for continued growth
Industry-leading share of a
rapidly-growing market
✓ ~450k small businesses formed each month
1
✓ #1 primary bank share
2
✓ ~9% annual client growth since 2019
✓ ~80% of balances in noninterest-bearing checking accounts
✓ ~40% of CCB deposits are held by BB clients
✓ ~2,300 Business Relationship Managers held 1.4mm
3
client meetings
✓ ~4,800 branches that reach 87% of U.S. small businesses
4
✓ ~80% of clients are digitally active, with >1B total log-ins in 2022
Unparalleled scale with a
localized service model
Strong unit economics and
contribution to the Firm
Consumer Banking Branch Network Business Banking Card & Connected Commerce
For footnoted information, refer to slide 97

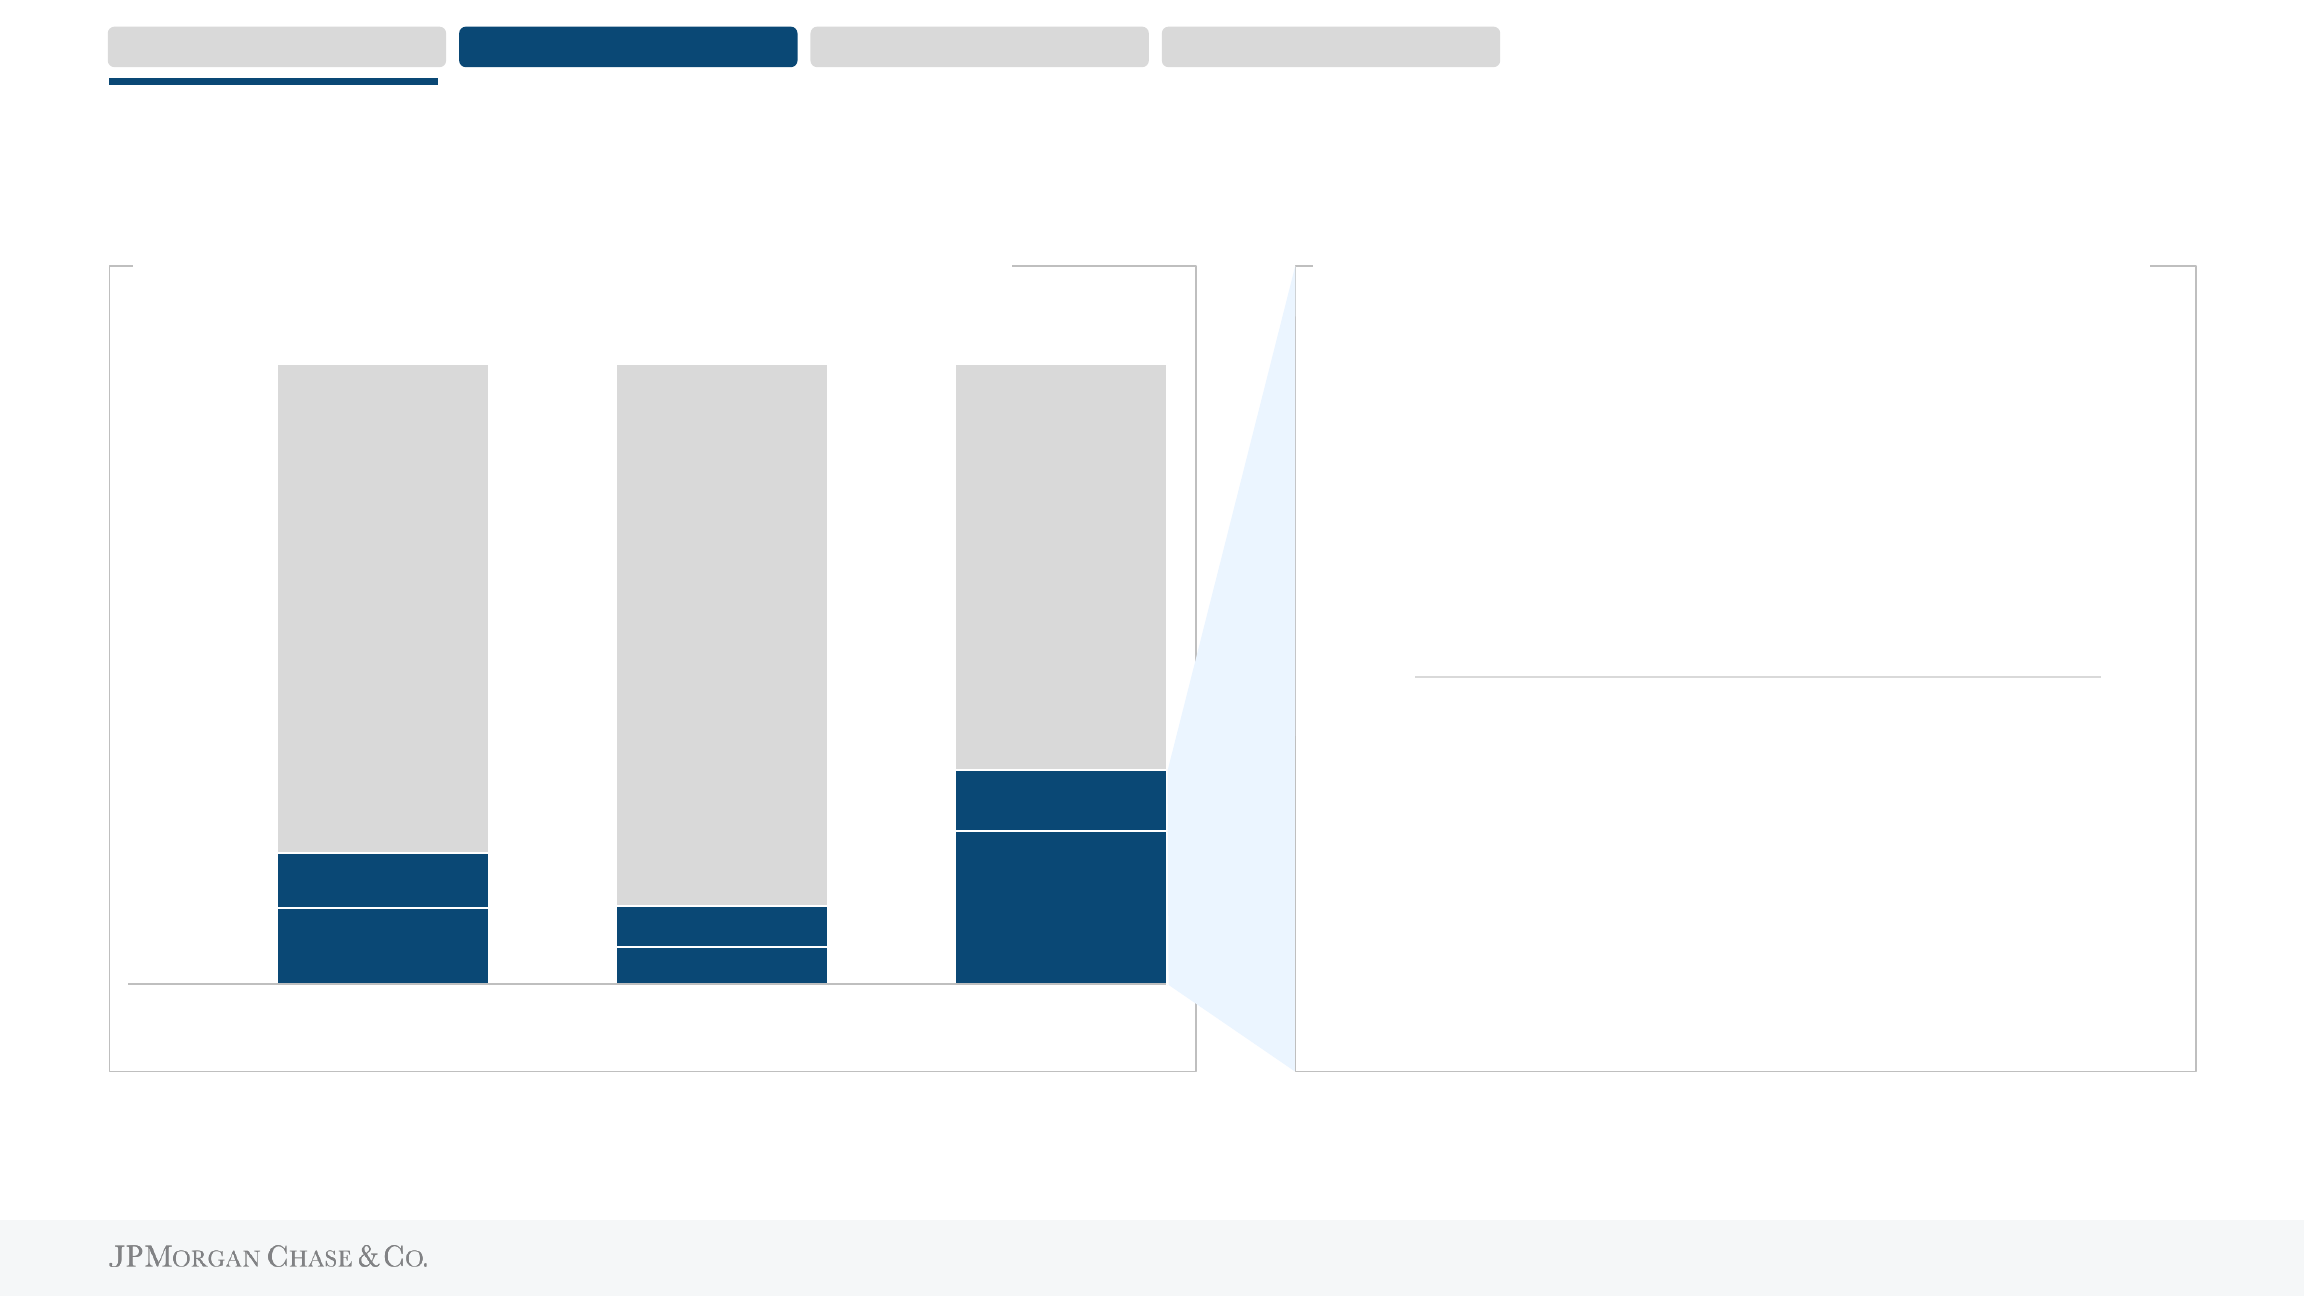
50

4.8
2.7
2.4
2019 2021 2022
5.9
6.4
6.5
2019 2021 2022
11.5
12.1
13.7
2019 2021 2022
31%
35%
32%
2019 2021 2022
Our Card franchise continues to be the industry leader in sales and outstanding balances
43
47
52
2019 2021 2022
16.4
14.8
16.1
2019 2021 2022
156
140
163
2019 2021 2022
763
893
1,065
2019 2021 2022
Active accounts (mm)
2
Average outstandings ($B)
Sales volume ($B)
Revenue ($B)
3
21%
40%
4%
Risk-adjusted revenue ($B)
3,4
19%
Net charge-offs ($B) ROE ex. LLR
4
(50%)
Pretax income ex. LLR ($B)
4
10%
3.10% 1.94% 1.47%
NCO Rate
(2%)
#1
in card sales volume since 2017
1
#1
in card outstandings for more than a decade
1
98%
customer retention in 2022
WE CONTINUED TO SCALE ACTIVE ACCOUNTS AND SALES – AND HAVE SEEN AVERAGE OUTSTANDINGS REBOUND FROM PANDEMIC LOWS
WE MAINTAINED OUR POSITION OF STRENGTH
1Q23 EOP O/S of $180B
Consumer Banking Branch Network Business Banking Card & Connected Commerce
51
For footnoted information, refer to slide 99

Our strategy will drive sustained success while making our business more resilient over time
STRATEGY
Create deeper
customer
relationships
Grow our card
member base across
key segments
Engage through
experiences
customers love
WHAT WINNING LOOKS LIKE
>$30B
volume through our Commerce
platforms in 2025
70 NPS
across Card and Commerce
experiences
⚫ Drive sticky relationships with customers through best-in-class experiences
⚫ Deepen relationships with customers across CCB and merchants across JPMC
⚫ Launch new, tailored products to win in key segments, including SMB and Starter
⚫ Fuel continued growth through our world-class marketing and distribution engine
⚫ Build out our two-sided platform through Connected Commerce
⚫ Continue to expand on our core enablers: payments and lending capabilities
20%
share of industry outstandings
in Card
ACTIONS WE ARE TAKING
Consumer Banking Branch Network Business Banking Card & Connected Commerce
52

10.7%
12.0%
21.8%
22.4%
20.4%
20.4%
2017 2018 2019 2020 2021 2022
We continually launch and refresh Card value propositions to deliver industry leading engagement
sales share
3
#1
Peer 1
Peer 2
10.0%
10.8%
16.2%
17.3%
7.0%
8.8%
2017 2018 2019 2020 2021 2022
outstandings share
3
#1
Peer 1
Peer 2
24 products launched or refreshed
since 2019
97% of co-brand sales contractually
extended to at least 2027
1
CARD HIGHLIGHTS
Continually launching and refreshing our world-class card products
while building stronger partnerships to expand our reach
Investing in new lifestyle benefits and experiences to differentiate
our products, and grow engagement with our customer base
3 airport lounges launched, with 2
more coming later this year
~70% of fee-based card demand
driven by Millennial and Gen Z
2
Consumer Banking Branch Network Business Banking Card & Connected Commerce
MARKET PERFORMANCE
53
For footnoted information, refer to slide 100

We are investing in products and experiences for key segments to drive growth
Strategic Focus Progress
Starter
Launching Freedom Rise in select channels this year
Leveraging the strategic advantage
of our branches to help new-to-
credit prospects
Affluent
Differentiating with investments in
travel and dining assets and
capabilities
Closely integrating key assets with the Sapphire brand
Small
Business
Expanding our product suite to
better serve the full continuum of
SMB needs
Launched Business Premier in all channels in October 2022
Lounges
Concierge
Services
Dining
Addressable Market
U.S. consumers
1
>25mm
U.S. SMBs
2
>40mm
U.S. consumers
3
>40mm
Consumer Banking Branch Network Business Banking Card & Connected Commerce
54
For footnoted information, refer to slide 101

$3.1
$2.1
$3.8
$4.0
$4.3
$1.3
$1.1
$1.4
$1.7
$1.6
2019 2020 2021 2022 ID Outlook 2022 Actuals
Product Benefits
(incl. co-brand)
Acquisition,
Distribution & Media
Our marketing engine fuels our scale and distribution
CARD GROSS CASH MARKETING SPEND ($B)
1
KEY DRIVERS AND PERFORMANCE METRICS
$4.5
$5.9
Revenue
Outlook from 2022 ID Revised Outlook
>30%
2
>50%
2
New accounts – 2022 vintage vs. 2019
New accounts
14% 23%
Active accounts
Outlook from 2022 ID 2022 Actuals
16% 21%
Total portfolio – 2022 vs. 2019
Sales volume
33% 40%
Annual fee
revenue
20% 28%
$3.2
$5.2
$5.7
Our disciplined approach to marketing enables us to generate predictable returns
Lifetime value
>1.5x
3
>1.7x
3
Consumer Banking Branch Network Business Banking Card & Connected Commerce
55
For footnoted information, refer to slide 102
We are improving productivity to better acquire and serve customers, and optimize expense
⚫ Our channels are getting more productive
Of new Branded card accounts acquired
through owned-channels in 2022 (+3ppts YoY)
1
85%
⚫ Our discipline drives more efficient account production
Decrease in customer call-in rates
since 2019
2
3ppts
Increase in accounts originated from pre-
qualified offers in 2022 vs. 2021
4ppts
⚫ Our investments drive a more seamless experience
Increase in digital active card customers
as % of total card base since 2019
5ppts
Improvement in Card fraud loss rate
since 2019
~1.5bps
Increase in new account production in 2022
vs. 2021
21%
⚫ Our ecosystem is serving customers more efficiently
WE ARE MORE PRODUCTIVE AT ACQUIRING CUSTOMERS… …AND SERVING THEM MORE EFFICIENTLY ONCE ACQUIRED
Consumer Banking Branch Network Business Banking Card & Connected Commerce
56
1
Owned channels include phone, chase.com, refer a friend, retail, and direct mail
2
Call-in rate is defined as the number of customer calls to specialists relative to annual customer statements

Our two-sided platform delivers unmatched value for consumers and brands
BrandsConsumers
>63mm
Digital active customers
2
>20
Monthly mobile logins per user
Digital Ecosystem
#1
Credit card issuer with >$1T in sales
>$5.6T
Payments volume
1
Consumer Payments
#1
Consumer bank based on deposits
#1
Most visited banking portal in U.S.
3
Base Beyond Card
Airlines
Hotels
Offers & Shopping
Dining
And >650 Luxury Hotel & Resort Collection partners
And >500 merchants on Chase Offers in 2022
Benefits
Scale of our assets Breadth of our solutions Richness of our data
No provider can match the:
Connected
Commerce
~300k hotel properties including…
>200 airline partners including…
Consumer Banking Branch Network Business Banking Card & Connected Commerce
57
For footnoted information, refer to slide 103

We are on-track to become a household name in premium leisure travel
>$3B
~$8B
~$15B
2019 2022 2025 Outlook
Chase Travel sales volume ($B)
3
✓ On track to hit ~$10B in Chase Travel sales this year
Chase Travel
Creating an end-to-end journey that delivers curated content,
unique experiences, and elevated servicing while operating as
a self-sustaining business
Booking platform that enables end-
to-end control over the experience
Highly-tenured agents that deliver
unique, customized trips
High Tech High Touch
1 in 4
Leisure travel dollars spent
on Chase cards
24%
YoY growth in transactions
through Chase Travel
2
Top 5
Consumer leisure
travel provider
1
~40%
YoY growth in customers
purchasing travel on Chase
2
PERFORMANCE HIGHLIGHTS CHASE TRAVEL VISION
Consumer Banking Branch Network Business Banking Card & Connected Commerce
58
For footnoted information, refer to slide 104

We are applying our consistent playbook to expand beyond Travel to win in Shopping and Dining
Where we are on our strategy
Identify high value experiences
that resonate with card members
Our strategy will migrate category spend to our platforms – driving >$30B in volume and ~$2B in revenue in 2025
Acquire capabilities to create
differentiated on-us journeys and
own the economics
1 3
Accelerate engagement in
existing channels and products
with benefits, rewards, and content
2
Key success metrics
1
Addressable spend
Travel
Reaching new customers through
premium servicing and content
in Chase Travel
sales volume
3
~$8B
Chase Travel visits
~40mm
Category spend on
Chase cards
2
>$140B
Shopping
Integrating our platform and data to enable
better targeting and personalization
in attribution spend
volume
5
>$6B
Offers served to
customers
4
>9B
Category spend on
Chase cards
2
>$470B
Dining
Expanding access to curated content and
experiences to accelerate engagement
Unique monthly
visitors
7
>5mm
Venues covered
6
>25k
Category spend on
Chase cards
2
>$90B
Journey
Make Chase the best platform to
book travel, explore shopping, and
discover new dining experiences
HOW WE’RE APPLYING OUR PLAYBOOK:
OUR COMMERCE PLAYBOOK:
Consumer Banking Branch Network Business Banking Card & Connected Commerce
59
For footnoted information, refer to slide 105

Payments and lending innovation are core enablers of our Connected Commerce strategy
>$5.6T
Payments volume
1
Installments at POSCard-linked installments
>27B
Payment transactions
1
2022 HIGHLIGHTS
Pay in 4 Paze
Card-based Pay-over-time solutions Checkout
Credit and debit
Highly engaged payments
4
customers have higher average NPS and higher likelihood to have multi-LOB relationships
>67mm
Payments active
customers
2
>25mm
Customers transacting >1
times a day
>$1.5T
Credit and debit spend
volume
Live today Live today Launching soon Launching soon
3
My Chase Plan originations
scaled 3x faster than BNPL
competitor outflows YoY
SM
Consumer Banking Branch Network Business Banking Card & Connected Commerce
$260.42 $130.21 $86.81
60
For footnoted information, refer to slide 106

We are investing in critical capabilities and experiences to better serve customers across all segments
“Best hotel co-brand
credit card”
– The Points Guy
1
“Best hotel travel
card”
– CNN
7
“Best cash-back
credit card”
– CNBC Select
6
“Best airline
credit card”
– Forbes Advisor
5
“Best overall
business card”
– CNET
3
70 NPS
On our path to achieving
NPS for select segments, 2022
Usage of machine learning to understand drivers of dissatisfaction
Investments in servicing innovation (e.g., dispute tools, chatbots)
Value of NPS: satisfied customers spend >30% more and attrite ~2x less
8
Customer complaints, 2019-2022
“Best card for small
businesses”
– Money.com
2
“Best travel rewards
credit card”
– The Points Guy
1
“Best premium card
for travel and dining”
– Business Insider
4
WE ARE BEING RECOGNIZED FOR THE WORK WE ARE DOING… …AND ARE TAKING ACTION TO BUILD UPON THIS MOMENTUM
Reduction in customer complaints
19%
+3 NPS
for Mass
vs. 2021
+1 NPS
for SMB
vs. 2021
+2 NPS
for Affluent
vs. 2021
Consumer Banking Branch Network Business Banking Card & Connected Commerce
61
For footnoted information, refer to slide 107
Consumer
Bank
Corporate &
Investment
Bank
~25%
of Chase Offers merchants
sourced through our B2B
franchises in 2022
2
>45%
of Branded Card members
are also Consumer Banking
customers
1
~40%
of SMB Card members
have a Business Banking
relationship
~17ppts
higher Card approval rate
when customer has a
deposit account
Being part of the JPMC ecosystem broadens our scale and distribution
Card
Card contributed ~50% of new CCB customers in 2022 – providing a significant deepening opportunity to the franchise
1
Consumer Banking Branch Network Business Banking Card & Connected Commerce
Business
Bank
62
1
Excludes small business customers
2
Reflects offers sourced through J.P. Morgan Payments and Business Banking

63

Our competitive advantages will enable sustained outperformance for decades to come
Forward-looking guidance of 25%+ ROE through the cycle
The scale of our
customer relationships is
the catalyst for everything
We operate with
excellence and execute
with discipline
We run this franchise for
the long term, with
unmatched capacity
to invest
The strength and
diversification of our
businesses create
resilience of returns
The Power of the CCB Franchise
64

65

Expert advice
and guidance
Premium
service
Value for
relationship
Elevated service and seamless experiences
⚫
Cross-product priority servicing experience
⚫
Higher limits and enhanced authorizations
⚫
Proactive client servicing
Easy access to a team of experts
⚫
Banker or advisor as a relationship quarterback
⚫
Financial planning, investment, and borrowing advice
⚫
Expanded banker and advisor capacity
Access to our best products and benefits
⚫
Expanded banking and investment services
⚫
Relationship-based pricing across products
⚫
Exclusive lifestyle benefits
First Republic provides capabilities to accelerate our existing affluent strategy
First Republic model CCB affluent strategy
High-touch servicing model
with industry-leading NPS and high client
and employee retention
Team of experts
to serve affluent client needs with a primary
relationship quarterback
Relationship-based lending
to acquire and deepen affluent relationships
Single family Multi-family CRE C&I Capital Call
RMs Business Bankers Preferred Bankers Wealth Managers
Preferred Banking Preferred Banking Offices WealthLending
66
First Republic value to Chase
Deepening opportunity
serving affluent client
lending needs
High quality loan
portfolio
strong LTVs, high FICO
scores
Relationship manager-
led acquisition
to drive firm value beyond
lending
First Republic has a unique operating model and strong loan portfolio
First Republic Portfolio Risk Metrics
1
Avg. CLTV
59%
Avg. FICO
774
Avg. Debt-to-
Income
30%
% CA or NY
77%
Avg. Balance
Outstandings
3
~$1.1mm
Loan Portfolio
2
~$100B
1
First Republic residential loan portfolio; funded loans only; CLTV and DTI reported as of time of origination
2
Prior to fair value marks
3
Average mortgage balance outstanding reflects unpaid principal balance
67
We provide advice across the wealth continuum and continue to grow our channels
Global
Private Bank
Advice-driven platform across
wealth, lending, and banking
Target client:
HNW / UHNW
Private Client Advisors
4,500+
Client investment assets
~$410B
Advisors
450+
Client investment assets
~$190B
Personal
Advisors
Lower-cost
remote advice
Target client:
Mass Affluent
Full-Service Wealth Management
Chase Wealth Management J.P. Morgan Advisors
CCB
AWM
Target client: Affluent Target client: Affluent / HNW
1
/ UHNW
2
Added 300+ Advisors in 2022
and on-track to scale
to 6k by 2025
✓
Launched Personal Advisors
to offer lower cost
advice (4Q22)
✓
Rolled out Wealth Plan
to Chase clients and
advisors (4Q22)
✓
Wealth Management Advised Channels
Added ~400 Client Advisors
and on-track to scale
to 4k by 2025
✓
We have invested to strengthen and scale our advised channels
1
High net-worth
2
Ultra high net-worth
68

First Republic Private Wealth Management adds scale to our office-based model
Global
Private Bank
Advice-driven platform across
wealth, lending, and banking
Target client:
HNW / UHNW
Private Client Advisors
4,500+
Client investment assets
~$410B
Advisors
450+
Client investment assets
~$190B
Personal
Advisors
Lower-cost
remote advice
Target client:
Mass Affluent
Full-Service Wealth Management
Chase Wealth Management J.P. Morgan Advisors
CCB
AWM
Target client: Affluent
Wealth Management Advised Channels
First Republic Private Wealth
Management
Private Wealth Advisors
~200
Client investment assets
~$200B
Target client: Affluent / HNW
1
/ UHNW
2
1
High net-worth
2
Ultra high net-worth
69
First Republic branches will support our affluent branch segmentation strategy
Formats
Emerging segments Affluent segments
Community Center
(in market)
Private Client Center
(under development)
First Republic
Preferred Banking Offices
Premium locations including SF, NYC, Boston
covering 50% of JPM WM balances
Roles
Community Centers to build trust locally and
promote financial health in underserved communities
Private Client Centers to build wealth brand and
provide exclusive spaces to engage with an
integrated team of experts
Preferred Bankers manage relationships and
provide service
Adapt proven integrated model with dedicated
Community Manager, Small Business Consultant,
and Community Home Lending Advisor roles
Deploy a senior team of experts with Private Client
Bankers & Advisors, Business Relationship
Managers, and Home Lending Advisors
Engagement
High-touch servicing model with industry-
leading experience
Tailored local objectives and engagement
methods to meet the distinct needs of underserved
communities
Serve clients across banking, lending and wealth
and curate financial planning and wealth-focused
experiences
Chase Branch Segmentation Strategy
70

71

Notes on non-GAAP financial measures
1. Adjusted expense excludes CCB legal expense and is a non-GAAP financial measure. For 2021, reported noninterest expense was $29,028 million and legal losses
were $55 million; for 2022, reported noninterest expense was $31,208 million and legal losses were $47 million. Management believes this information helps investors
understand the effect of certain items on reported results and provides an alternate presentation of the Firm’s performance
2. Income before income tax expense (pretax income) excluding the change in loan loss reserves (“pretax income ex. LLR”) and return on equity excluding the change in
loan loss reserves (“ROE ex. LLR”) are non-GAAP financial measures. These metrics reflect the exclusion of the portion of the provision for credit losses attributable
to the change in allowance for credit losses. ROE ex. LLR is calculated as net income excluding LLR divided by average common stockholders’ equity. For CCB
average common stockholders’ equity for the full years 2022, 2021 and 2020, refer to page 65 of JPMorgan Chase’s Annual Report on Form 10-K for the year ended
December 31, 2022. For all other periods presented, refer to the CCB Business Segment Results in JPMorgan Chase’s Annual Report on Form 10-K for each
respective year. The table below provides a reconciliation of reported results to these non-GAAP financial measures
Year ended December 31,
(in millions, except ROE)
2012
2013
2014
2015
2016
2017
2018
2019
2020
2021
2022
(1) Pretax income
Reported pretax income
17,236
17,808
14,689
15,472
15,053
14,637
19,399
21,950
11,034
27,840
19,793
Adjustments:
Change in loan loss reserves
(5,506)
(5,490)
(1,253)
(1,023)
150
320
42
(299)
7,809
(9,750)
1,125
Pretax income ex. LLR
11,730
12,318
13,437
14,449
15,203
14,957
19,441
21,651
18,843
18,090
20,918
(2) Net income
Reported net income
10,522
10,715
8,840
9,546
9,418
9,254
14,744
16,575
8,268
20,957
14,916
Adjustments:
Change in loan loss reserves
(3,337)
(3,300)
(742)
(632)
93
207
32
(226)
5,843
(7,356)
879
Net income ex. LLR
7,185
7,415
8,098
8,914
9,511
9,462
14,776
16,350
14,111
13,601
15,795
(3) ROE
Reported ROE
24%
23%
17%
18%
17%
17%
28%
31%
15%
41%
29%
ROE ex. LLR
16%
15%
15%
17%
18%
18%
28%
31%
26%
26%
31%
72

Notes on slide 3
1. See slide 72
2. Federal Deposit Insurance Corporation (“FDIC”) 2022 Summary of Deposits survey per S&P Global Market Intelligence. Applies a $1B deposit cap to Chase and
industry branches. Includes all commercial banks, savings banks, and savings institutions as defined by the FDIC. Prior periods have been revised to conform to the
current period presentation
3. Based on 2022 sales volume and loans outstanding public disclosures by peers (C, BAC, COF, AXP, DFS) and JPMorgan Chase estimates. Sales volume excludes
private label and Commercial Card. Loans outstanding exclude private label, AXP Charge Card, and Citi Retail Cards
73

Notes on slide 4
1. Businesses and legal entities with decision making rights
2. Federal Deposit Insurance Corporation (“FDIC”) 2022 Summary of Deposits survey per S&P Global Market Intelligence. Applies a $1B deposit cap to Chase and
industry branches. Includes all commercial banks, savings banks, and savings institutions as defined by the FDIC. Prior periods have been revised to conform to the
current period presentation
3. Barlow Research Associates, Primary Bank Market Share Database as of 4Q22. Rolling 8-quarter average of small businesses with revenue of more than $100,000
and less than $25 million
4. Based on 2022 sales volume and loans outstanding public disclosures by peers (C, BAC, COF, AXP, DFS) and JPMorgan Chase estimates. Sales volume excludes
private label and Commercial Card. Loans outstanding exclude private label, AXP Charge Card, and Citi Retail Cards
5. Refers to customers with two or more relationships within the following sub-LOBs: Consumer Banking, Business Banking, Wealth Management, Credit Card, Home
Lending, and Auto
74

Notes on slide 5
1. #1 in active users among digital banking mobile apps based on Data.ai and #1 most-visited banking portal in the U.S. (Chase.com) based on Similarweb
2. 2022 Chase branch network coverage by state. Federal Deposit Insurance Corporation (“FDIC”) 2022 Summary of Deposits survey per S&P Global Market
Intelligence. Includes all commercial banks, savings banks and savings institutions as defined by the FDIC. Prior periods have been revised to conform to the current
period presentation. Numbers do not foot to Form 10-K as FDIC represents branch counts as of June 30th, 2022
3. As of 4Q22. Users of all web and/or mobile platforms who have logged in within the past 90 days
4. Total logins on mobile and web platforms in FY 2022
5. In 2022, we achieved record high satisfaction in our branch and digital channels, determined by overall satisfaction and measured on a scale of 1 to 10. The score is
calculated as the share of “9” and “10” responses as a percent of total responses. Digital channel includes a weighted average of monthly active users of Chase.com
and the Chase Mobile app
75

Notes on slide 6
1. J.P. Morgan Wealth Management referenced in Form 10-K
2. Unique families with primary and joint account owners for open and funded accounts
3. Represents first-time investors with full-service relationships through Chase Wealth Management
4. Includes Chase Travel volumes, cxLoyalty non-Chase clients, and Frosch
5. Refers to customers associated with Business Banking line of business as referenced in Form 10-K
76

Notes on slide 7
1. Masterbrand Brand Health survey data from 1Q23. N = 3,681 completed surveys from random U.S. consumer sample (age 18+, financial decision makers for the
household, lower 48 states), fielded between 1/6/2023 and 3/30/2023. Consideration measured through % of respondents selecting “Probably would consider”,
“Definitely would consider” for question: “Please think about financial service companies in general. The next time you are in the market for a financial product or
service, how likely are you to consider the following providers?”
2. Consumer Banking: Federal Deposit Insurance Corporation (“FDIC”) 2022 Summary of Deposits survey per S&P Global Market Intelligence. Applies a $1B deposit
cap to Chase and industry branches. Includes all commercial banks, savings banks, and savings institutions as defined by the FDIC. Prior periods have been revised
to conform to the current period presentation. Business Banking: Barlow Research Associates, Primary Bank Market Share Database as of 4Q22. Rolling 8-quarter
average of small businesses with revenue of more than $100,000 and less than $25 million. Card: Based on 2022 sales volume and loans outstanding public
disclosures by peers (C, BAC, COF, AXP, DFS) and JPMorgan Chase estimates. Sales volume excludes private label and Commercial Card. Loans outstanding
exclude private label, AXP Charge Card, and Citi Retail Cards
3. Wealth: #1 outflow destination for Chase customers. Merchant: #1 payment provider for BB clients. Based on settlement $ volume (inflows into BB accounts from
merchant servicing providers), not by client count. Data is most recent available, from Feb 1 – Apr 20. Mortgage: Chase clients are defined as having a deposit
relationship or mortgage; based on Chase internal data and CoreLogic data
4. Retail mortgage originations in Home Lending
5. Excludes Commercial Term Lending clients
77

Notes on slide 8
1. See slide 72
2. In the first quarter of 2023, the allocations of revenue and expense to CCB associated with a Merchant Services revenue sharing agreement were discontinued and
are now retained in Payments in CIB. Prior-period amounts have been revised to conform with the current presentation
3. Banking & Wealth Management
78

Notes on slide 11
1. Totals may not sum due to rounding. End of period balances for 1Q22 and 1Q23
2. 1Q22 to 1Q23 customer growth represents balances from new Banking and Wealth Management customers
3. Migration of flows out of checking and savings accounts
4. Net flows for external brokerages, online banks, JPMWM investments. Gross flows for internal migration
5. For Consumer Banking customers who outflow regularly. A customer is considered primary bank if it meets one of the following conditions: ≥15 withdrawals from a
checking account or ≥5 withdrawals from a checking account and ≥$500 of inflows in a given month
6. Migration of flows into checking and savings accounts
7. % of internal yield seeking inflows (incl. JPMWM flows and internal migration) of total yield seeking outflows (incl. JPMWM flows, internal migration, external
brokerages, online banks)
79

Notes on slide 12
1. Totals may not sum due to rounding
2. In the first quarter of 2023, the allocations of revenue and expense to CCB associated with a Merchant Services revenue sharing agreement were discontinued and are
now retained in Payments in CIB. Prior-period amounts have been revised to conform with the current presentation
3. Adjusted to exclude legal expense. See slide 72
80

Notes on slide 13
1. Adjusted expense excludes CCB investments and legal expense and is a non-GAAP financial measure. For 2021, reported noninterest expense was $29.0 billion,
CCB investments were $5.2 billion and legal losses were $55 million; for 2022, reported noninterest expense was $31.2 billion, CCB investments were $7.1 billion
and legal losses were $47 million, respectively. Management believes this information helps investors understand the effect of certain items on reported results and
provides an alternate presentation of the Firm’s performance
2. In the first quarter of 2023, the allocations of revenue and expense to CCB associated with a Merchant Services revenue sharing agreement were discontinued and
are now retained in Payments in CIB. Prior-period amounts have been revised to conform with the current presentation
3. Includes total calls to Consumer Banking, Business Banking, Auto and Card client servicing divided by all Chase consumers and small businesses
4. Includes total check, debit, digital and credit payment / money movement volumes
5. Net operating losses divided by total transaction volume
6. Includes Consumer Banking customers and Business Banking small businesses per branch. Numerator and denominator exclude new builds and market expansion
captured as investments and zero-balance accounts. Reflects 2019-2022 only
7. Tenured Chase Wealth Management & J.P. Morgan Advisors
8. Average annualized deposit sales for branches >5 years old; reflects 2019-2022 only
81

Notes on slide 14
1. Totals may not sum due to rounding
2. Includes Connected Commerce acquisitions of cxLoyalty, FROSCH, The Infatuation, and Figg
3. Gross cash marketing spend represents total outlays in a calendar year, which includes expenses and contra revenues. Contra-revenue may be amortized and not all
recognized in the year the outlay was made
4. Refers to tech product development investment spend, excludes regulatory and controls spend
82

Notes on slide 16
1. Tracks cohort of primary bank customers from March 2020 – March 2023. At time of start in March 2020, cohort includes all primary bank customers, with at least one
year of consumer checking tenure, and greater than $6k of take-home income (payroll, government assistance, unemployment benefits, tax refunds, social security,
and retirement) within last twelve months
2. Represents customers within the cohort who had greater than $6k but less than $30k of take-home income within last twelve months of March 2020
3. Average Daily Balance divided by the total outflow in the month, multiplied by 30 to express in number of days. Includes all the checking and savings (ex. CDs) Chase
accounts that are owned or jointly owned by the customer. Customers without outflow in the month are excluded
4. Source: Bureau of Labor Statistics (CPIU)
5. Tracks income growth for cohort defined in Note 1 above from January 2020 – March 2023, requiring greater than $6k of take-home income (payroll, government
assistance, unemployment benefits, tax refunds, social security, and retirement) within last twelve months of Jan 2020. Additionally, take home income must be greater
than $0 within last twelve months throughout the measurement period
6. Represents customers within the cohort who had greater than $6k but less than $30k of take-home income within last twelve months of January 2020. Additionally,
take home income must be greater than $0 within last twelve months throughout the measurement period
83

Notes on slide 17
1. Based on time frames used in data which differs from time frames Form 10-K
2. Tracks Credit Card customers with 18+ months on book as of January 2019 that are still spend active in March 2023. Lowest income defined as gross income (self
reported) of <$50k
3. Refers to 4Q19 and 1Q23 period-end Card Services loans reported in quarterly earnings supplements
4. Tracks Credit Card accounts that are open in January 2020 and still open in April 2023
5. Percentage change in the number of accounts within the stable cohort holding a revolving balance between January 2020 and April 2023
84

Notes on slide 19
1. Represents refreshed FICO scores
2. Customers who revolve but are not spend active
3. Chase Auto excludes Wholesale (DCS) & Lease
4. Calculated using refreshed Vantage score sourced from Experian
5. Represents FICO scores and LTV at time of origination
6. Includes AWM and Corporate mortgage loans
7. Sourced from Experian
8. Sourced from Lender Share. Data is obtained from market shares relative to lenders participating in Curinos’ retail and correspondent channel origination analytics.
Curinos is not liable for reliance on the data
85

Notes on slide 22
1. As of December 31, 2022
2. CLTV defined as Combined Loan to Value
3. 2010 30+ delinquency rate revised from 10-K to include the impact of Purchased Credit Impaired (PCI) loans to conform to current disclosures
4. HPI defined as Home Price Index
5. All data in HPI forecast chart with exclusion of % originations data sourced from Moody’s Case-Shiller as of April 2023
6. % Held For Investment (HFI) 2022 is Internal Chase Data
86

Notes on slide 24
1. In 2020 Merchant Services along with the associated assets, liabilities, revenue, expenses and headcount were realigned to CIB from CCB and CB. Prior-period
amounts have been revised to conform with the current presentation
2. Certain wealth management clients were realigned from Asset & Wealth Management to Consumer & Community Banking in the fourth quarter of 2020; amounts in
periods prior to 2016, other than client balances, were not revised in connection with the realignment
3. In the first quarter of 2023, the allocations of revenue and expense to CCB associated with a Merchant Services revenue sharing agreement were discontinued and are
now retained in Payments in CIB. Prior-period amounts have been revised to conform with the current presentation
4. See slide 72
5. CCB ROE (ex. LLR) pre 2018 impacted by higher corporate tax rate
6. Board of Governors of the Federal Reserve System, Federal Funds Effective Rate, retrieved from FRED, Federal Reserve Bank of St. Louis
7. Reflects sum of average deposits, average loans, and end of period client investment assets, including the revision referenced in note 2 on this page
8. Federal Deposit Insurance Corporation (“FDIC”) 2022 Summary of Deposits survey per S&P Global Market Intelligence. Applies a $1B deposit cap to Chase and
industry branches for market share. Includes all commercial banks, savings banks, and savings institutions as defined by the FDIC. Prior periods have been revised to
conform to the current period presentation
9. Represents general purpose credit card spend, which excludes private label and Commercial Card. Based on company filings and JPMorgan Chase estimates
10.Barlow Research Associates, Primary Bank Market Share Database. Rolling 8-quarter average of small businesses with revenue of more than $100,000 and less than
$25 million
87

Notes on slide 26
1. Federal Deposit Insurance Corporation (“FDIC”) 2022 Summary of Deposits survey per S&P Global Market Intelligence. Applies a $1B deposit cap to Chase and
industry branches. Includes all commercial banks, savings banks, and savings institutions as defined by the FDIC. Prior periods have been revised to conform to the
current period presentation
2. “Consumer Banking customer” reflects unique individuals that have financial ownership or decision making power with respect to Consumer Banking accounts
3. Refers to primary bank customers with two or more relationships within the following sub-LOBs: Consumer Banking, Business Banking, Wealth Management, Credit
Card, Home Lending, and Auto Lending
4. Federal Deposit Insurance Corporation (“FDIC”) 2022 Summary of Deposits survey per S&P Global Market Intelligence. Top 50 markets were defined based on
industry deposit balances after applying a $1B deposit cap to each branch. Includes all commercial banks, savings banks, and savings institutions as defined by the
FDIC. Prior periods have been revised to conform to the current period presentation. Chase has branch presence in 47 of the top 50 markets; the three markets
without branches are San Juan, Virginia Beach, and Urban Honolulu
5. Deposit and investment balances associated with accounts where the primary owner visited a branch >4 times in 2022
88

Notes on slide 28
1. Federal Deposit Insurance Corporation (“FDIC”) 2022 Summary of Deposits survey per S&P Global Market Intelligence. Applies a $1B deposit exclusion to Chase
and industry branches. Includes all commercial banks, savings banks, and savings institutions as defined by the FDIC. Prior periods have been revised to conform to
the current period presentation
2. Federal Deposit Insurance Corporation (“FDIC”) 2022 Summary of Deposits survey per S&P Global Market Intelligence. Applies a $1B deposit cap to Chase and
industry branches. Includes all commercial banks, savings banks, and savings institutions as defined by the FDIC. Prior periods have been revised to conform to the
current period presentation. Large banks consist of institutions with >$100B in retail deposits
3. Federal Deposit Insurance Corporation (“FDIC”) 2022 Summary of Deposits survey per S&P Global Market Intelligence. Applies a $1B deposit cap to Chase and
industry branches. Includes all commercial banks, savings banks, and savings institutions as defined by the FDIC. Prior periods have been revised to conform to the
current period presentation
4. In 2022 and 1Q23, Chase ranked #1 in retail deposit share based on industry methodologies using Federal Deposit Insurance Corporation (“FDIC”) 2022 Summary of
Deposits survey and EOP deposits for BWM-equivalent businesses. For example, estimating retail deposits performance by applying a $1B cap on FDIC deposits –
$1,094B (Chase), $1,027B (Peer 1), $979B (Peer 2); uncapped methodology – $2,129B (Chase), $1,964B (Peer 1), $1,458B (Peer 2); EOP earnings (national retail
deposits in Banking and Wealth Management) disclosures – 2Q22 earnings: $1,179B (Chase), $1,077B (Peer 1), $892B (Peer 2); 1Q23 earnings: $1,147B (Chase),
$1,045B (Peer 1), $851B (Peer 2)
89

Notes on slide 29
1. A customer is considered primary bank if it meets one of the following conditions: ≥15 withdrawals from a checking account or ≥5 withdrawals from a checking
account and ≥$500 of inflows in a given month
2. Source: One Chase Net Promoter Score (NPS) Survey. Reflects promoters, calculated as share of “9” and “10” responses as a % of total responses
3. Refers to customer satisfaction across all Consumer Banking accountholders
4. Reflects FY 2022 retention for checking customers with a tenure of ≥ 6 months
5. Refers to primary bank customers with two or more relationships within the following sub-LOBs: Consumer Banking, Business Banking, Wealth Management, Credit
Card, Home Lending, and Auto Lending
6. Deposit and investment balances associated with accounts where the primary owner visited a branch >4 times in 2022
7. Percent of Consumer Banking users of all mobile platforms who have logged in within the past 90 days, as of 4Q22
90

Notes on slide 30
1. Inclusive of payments made from all Consumer Banking accounts; payments defined as debits, excluding internal transfers
2. Reflects number of Consumer and Business Banking accounts with a Zelle inflow or outflow in FY 2022
3. Average number of monthly debit transactions during 4Q22 of Consumer Banking checking customers that completed at least one debit card payment during this 90-
day period
4. Percent of Consumer Banking users of all mobile platforms who have logged in within the past 90 days, as of 4Q19 and 4Q22
5. Percent of mobile-active Consumer Banking users who engaged with a financial health tool in 4Q22
6. Total Consumer Banking user logins on mobile and web platforms in FY 2022
91

Notes on slide 32
1. Includes Chase First Banking, Chase High School Checking, Chase College Checking, and Chase Secure Banking
2. Includes Chase Total Checking, Chase Premier Checking, and Chase Sapphire Banking
3. Based on Chase Private Client households
4. Account distribution is based on YE 2022
92

Notes on slide 34
1. Federal Deposit Insurance Corporation (“FDIC”) 2022 Summary of Deposits survey per S&P Global Market Intelligence. Includes all commercial banks, savings
banks and savings institutions as defined by the FDIC. Prior periods have been revised to conform to the current period presentation. Numbers do not foot to Form
10-K as FDIC represents branch counts as of June 30th, 2022
2. Federal Deposit Insurance Corporation (“FDIC”) 2022 Summary of Deposits survey per S&P Global Market Intelligence. Applies a $1B deposit cap to Chase and
industry branches. Includes all commercial banks, savings banks, and savings institutions as defined by the FDIC. Prior periods have been revised to conform to the
current period presentation. Large banks consist of institutions with >$100B in retail deposits
3. Represents large banks’ deposit per branch in 2022
4. Calculated using 2022 FDIC data. Federal Deposit Insurance Corporation (“FDIC”) 2022 Summary of Deposits survey per S&P Global Market Intelligence. Includes
all commercial banks, savings banks and savings institutions as defined by the FDIC. Prior periods have been revised to conform to the current period presentation
5. Calculated using 2017 FDIC data. Federal Deposit Insurance Corporation (“FDIC”) 2022 Summary of Deposits survey per S&P Global Market Intelligence. Includes
all commercial banks, savings banks and savings institutions as defined by the FDIC. Prior periods have been revised to conform to the current period presentation
6. Federal Deposit Insurance Corporation (“FDIC”) 2022 Summary of Deposits survey per S&P Global Market Intelligence. Applies a $1B deposit cap to Chase and
industry branches. Includes all commercial banks, savings banks, and savings institutions as defined by the FDIC. Prior periods have been revised to conform to the
current period presentation
7. Includes Consumer Banking customers and Business Banking small businesses per branch. Numerator and denominator exclude new builds and market expansion
captured as investments and zero-balance accounts. Reflects 2019-2022 only
93

Notes on slide 35
1. Federal Deposit Insurance Corporation (“FDIC”) 2022 Summary of Deposits survey per S&P Global Market Intelligence. Includes all commercial banks, savings
banks and savings institutions as defined by the FDIC. Prior periods have been revised to conform to the current period presentation
2. Federal Deposit Insurance Corporation (“FDIC”) 2022 Summary of Deposits survey per S&P Global Market Intelligence. Applies a $1B deposit cap to Chase and
industry branches. Includes all commercial banks, savings banks, and savings institutions as defined by the FDIC. Prior periods have been revised to conform to the
current period presentation. Large banks consist of institutions with >$100B in retail deposits
3. Federal Deposit Insurance Corporation (“FDIC”) 2022 Summary of Deposits survey per S&P Global Market Intelligence. Applies a $1B deposit cap to Chase and
industry branches. Includes all commercial banks, savings banks, and savings institutions as defined by the FDIC. Prior periods have been revised to conform to the
current period presentation
4. Break-even defined as the first month of two consecutive months of a branch generating positive pre-tax profit
5. Federal Deposit Insurance Corporation (“FDIC”) 2022 Summary of Deposits survey per S&P Global Market Intelligence. Applies a $1B deposit cap to Chase and
industry branches. Includes all commercial banks, savings banks, and savings institutions as defined by the FDIC. Prior periods have been revised to conform to the
current period presentation. Represents the sum of the delta between deposits per branch for mature branches (10+ years, $259mm) and non-mature branches (0-5
years, $79mm; 5-10 years, $154mm) multiplied by the number of branches within that age cohort (0-5 years = 711; 5-10 years = 294)
6. Federal Deposit Insurance Corporation (“FDIC”) 2022 Summary of Deposits survey per S&P Global Market Intelligence. Top 50 markets were defined based on
industry deposit balances after applying a $1B deposit cap to each branch. Includes all commercial banks, savings banks, and savings institutions as defined by the
FDIC. Prior periods have been revised to conform to the current period presentation
94

Notes on slide 36
1. Federal Deposit Insurance Corporation (“FDIC”) 2022 Summary of Deposits survey per S&P Global Market Intelligence. Applies a $1B deposit cap to Chase and
industry branches. Includes all commercial banks, savings banks, and savings institutions as defined by the FDIC. Prior periods have been revised to conform to the
current period presentation
2. Federal Deposit Insurance Corporation (“FDIC”) 2022 Summary of Deposits survey per S&P Global Market Intelligence. Includes all commercial banks, savings
banks and savings institutions as defined by the FDIC. Prior periods have been revised to conform to the current period presentation
3. Excludes trust office
4. Reflects internal new build counts for licensed branch locations opened between calendar year 2012 through calendar year 2022 within the respective CBSAs. Does
not include relocations
95

Notes on slide 37
1. Teller transactions
2. Reflects deposit and investment balances, with engagement channel segments defined based on the level of interaction with branch and digital channels for primary
owners of Consumer Banking accounts. Branch-centric are accountholders who have >4 branch visits per year. Digitally-centric is 12+ digital transactions, 100+
logins, 24+ ACH payments. If both criteria are applicable, then accountholders are multi-channel
3. Tenured bankers. NPV normalized for margins across years
96

Notes on slide 39
1. Federal Deposit Insurance Corporation (“FDIC”) 2022 Summary of Deposits survey per S&P Global Market Intelligence. Includes all commercial banks, savings
banks and savings institutions as defined by the FDIC. Prior periods have been revised to conform to the current period presentation. Numbers do not foot to Form
10-K as FDIC represents branch counts as of June 30th, 2022
2. Grey represents states with zero branch share
3. Coverage defined as one or more branches in a CBSA using U.S. Census Population Data. Based on 2017 estimates for 2017 metrics and 2022 estimates for all
other time periods
4. Drive times and population are derived from ESRI Business Analyst using 2017, 2021, and forward-looking population metrics; drive times are derived from 2021
street network vintage for 2017, 2022, and forward-looking time periods. Branch network is as of YE 2017 and YE 2022
5. Small business coverage by CBSA based on Dun and Bradstreet Small Business locations. Small business defined as <$20mm in annual revenue
6. Federal Deposit Insurance Corporation (“FDIC”) 2022 Summary of Deposits survey per S&P Global Market Intelligence. Applies a $1B deposit cap to Chase and
industry branches. Includes all commercial banks, savings banks, and savings institutions as defined by the FDIC. Prior periods have been revised to conform to the
current period presentation. Addressable deposits represent the sum of all industry deposits in a given CBSA where Chase has at least one branch
97

Notes on slide 49
1. Source: U.S. Census – Business and Industry Time Series, Monthly Business Formation Statistics; not seasonally adjusted; average of FY2022 and 1Q2023
2. Primary bank market share sourced from Barlow Research Associates as of 4Q22. Rolling 8-quarter average of small businesses with sales size between $100k-
$25mm
3. Total meetings in FY2022 between Business Banking clients and either remote or in-person Business Relationship Managers
4. Small business coverage by CBSA based on Dun and Bradstreet Small Business locations. Small business defined as <$20mm in annual sales size
98

Notes on slide 51
1. Based on 2022 sales volume and loans outstanding public disclosures by peers (C, BAC, COF, AXP, DFS) and JPMorgan Chase estimates. Sales volume excludes
private label and Commercial Card. Loans outstanding exclude private label, AXP Charge Card, and Citi Retail Cards
2. Defined as average sales debit active accounts
3. Includes amortization of account origination costs
4. Risk-adjusted revenue, pretax income ex. LLR and ROE ex. LLR are all non-GAAP financial measures. Risk-adjusted revenue is revenue excluding net charge-offs of
$2.4B, $2.7B and $4.8B for the years ended December 31, 2022, December 31, 2021 and December 31, 2019, respectively. Pretax income ex. LLR and ROE ex.
LLR represents pretax income and ROE excluding credit loss reserves of $1.0B, $(7.6)B and $0.5B for the years ended December 31, 2022, December 31, 2021 and
December 31, 2019, respectively. Management believes this information helps investors understand the effect of these items on reported results and provides an
alternate presentation of the Firm’s performance.
99

Notes on slide 53
1. Based on 2022 co-brand portfolio sales volumes
2. Fee-based card demand applies to Branded consumer cards only; Millennials defined as 27-42 and Gen Z as 11-26 year-olds
3. Based on 2017-2022 sales volume and average loans outstanding public disclosures by peers (C, BAC, COF, AXP, DFS) and JPMorgan Chase estimates. Sales
volume excludes private label and Commercial Card. Loans outstanding exclude private label, AXP Charge Card, and Citi Retail
100

Notes on slide 54
1. Based on Chase and Census data
2. According to Bright Query, April 2023
3. Based on Personal Demographics Detail dataset, published by Axiom, December 2022
101

Notes on slide 55
1. Gross cash marketing spend represents total outlays in a calendar year, which includes expenses and contra revenues. Contra-revenue may be amortized and not all
recognized in the year the outlay was made
2. Reflects expected performance of 2022 vintage in Year 5
3. Defined as Net Present Value (NPV) of the vintage; NPV defined as the post-tax lifetime value of all incremental cash flows for the investment, including upfront
investment costs and all other variable revenues and costs resulting, discounted at the cost of equity
102

Notes on slide 57
1. Total payments transaction volume includes debit and credit card sales volume and gross outflows of ACH, ATM, teller, wires, BillPay, PayChase, Zelle, person-to-
person and checks
2. Users of all web and/or mobile platforms who have logged in within the past 90 days
3. #1 most-visited banking website in the U.S. (Chase.com) based on Similarweb
103

Notes on slide 58
1. Based on Travel Weekly Power List 2022, which disclosed 2021 sales volumes; Chase Travel and cxLoyalty 2021 sales volumes were not publicly disclosed on the
Power List; corporate/managed travel providers excluded for purposes of JPMC estimates
2. Represents Chase Ultimate Rewards booking volume
3. Includes Chase Travel volumes, cxLoyalty partner clients, and FROSCH; 2019 includes only Chase Ultimate Rewards
104

Notes on slide 59
1. Reflects 2022 actuals, unless otherwise noted
2. Shopping reflects credit and debit spend; Travel and Dining reflect credit spend only
3. Includes Chase Travel volumes, cxLoyalty partner clients, and FROSCH
4. Number of unique offers viewed by a customer for the first time during a campaign
5. Attribution spend is defined as spend on our cards at Chase Offers merchants once the offer is served and during the offer window (the average offer window is 45
days)
6. Reflects the number of individual geographic business locations featured on The Infatuation website and app (as of April 30, 2023)
7. Reflects the average number of user device identifications to visit The Infatuation website and app within a month (April 2023 LTM)
105

Notes on slide 60
1. Total payments transaction volume includes debit and credit card sales volume and gross outflows of ACH, ATM, teller, wires, BillPay, PayChase, Zelle, person-to-
person and checks
2. Payments active defined as customers who completed >1 payments outflow across any method of payment in 2022
3. Paze screen reflects a contemplated design; subject to change
4. Defined as consumer deposit customers and credit card-only customers who performed >30 payment transactions in a month across all digital, non-digital, and card-
based methods of payments on average in 2022; excludes business banking customers
106

Notes on slide 61
1. The Points Guy Awards, 2022
2. Money.com, March 2023
3. CNET, May 2023
4. Business Insider, May 2023
5. Forbes Advisor, May 2023
6. CNBC Select, May 2023
7. CNN Underscored, May 2023
8. For Net Promoter Score promoters compared to detractors
107
