
Article
__________________________________________________
a
Jindal Global Business School, O. P. Jindal Global University, Sonipat, Haryana, India (f09anujs@iimidr.ac.in)
b
Indian Institute of Management Nagpur, Maharashtra, India (kapilk@iimnagpur.ac.in)
c
Indian Institute of Management Nagpur, Maharashtra, India (prakash@iimnagpur.ac.in)
d
Indian Institute of Management Nagpur, Maharashtra, India (phd22abhishek@iimnagpur.ac.in)
Corresponding Author:
Kaushik (kapilk@iimnagpur.ac.in)
416
Leveraging Text Mining for Trend Analysis and
Comparison of Sustainability Reports: Evidence
from Fortune 500 Companies
American Business Review
Nov. 2022, Vol.25(2) 416 - 438
© The Authors 2022, CC BY-NC
ISSN: 2689-8810 (Online)
ISSN: 0743-2348 (Print)
Anuj Sharma
a
, Kapil Kaushik
b
, Prakash Awasthy
c
and Abhishek Gawande
d
https://doi.org/10.37625/abr.25.2.416-438
ABSTRACT
In the recent upsurge in environmental concerns, business sustainability has become more prominent than
ever. Organizations worldwide are expected to function sustainably, causing the least negative impact on the
environment and promoting harmony among the firm, environment, and society. Most firms report their
actions related to sustainability in corporate social responsibility (CSR) reports. This research aims to
understand and analyze contemporary trends in CSR reports by Fortune 500 companies using text mining. It
compares how the focus of sustainability reports varies across countries and industries along key dimensions
of sustainability (i.e., environmental, economic, social, and government). Findings from the study suggest
variations in the focus of sustainability reports based on various factors, such as country of origin and company
size, sector, and tenure, on the Fortune 500 list. Thus, it helps to gain a deeper understanding of the company’s
motivations for focusing on various dimensions of corporate sustainability.
KEYWORDS
Sustainability, Text Mining, Government Regulation, Sustainability Reporting, Environmental
INTRODUCTION
In recent years, issues pertaining to sustainability have become a topic of concern for regulators,
businesses, and researchers (Linnenluecke and Griffiths, 2013; Perkiss et al., 2020). Firms and
governments across countries have started to recognize that addressing environmental and social
challenges, such as poverty and climate change, has become more critical than ever (UNDP Annual
report 2021; Kumar et al., 2022). For example, rising CO
2
emissions are a major global issue
(Subbaraman, 2022). To address these challenges, business organizations have started adopting
sustainability-related practices in their policies and programs, either voluntarily or as a response to
government regulations (Dahlmann and Bullock, 2020; Lorenzoni and Benson, 2014). Moreover,
organizations publish details of their activities related to sustainability through annual reports,
sustainability reports, or Environmental Social Governance reports. Furthermore, several business
organizations have implemented frameworks such as the Global Reporting Initiative (GRI) to
understand and report sustainability-related initiatives in a structured and globally recognizable form.
The structured GRI framework is conducive to performing a comparative analysis of such reports.
In addition to actions by regulators and business organizations on sustainability fronts, there has
been a surge in sustainability research by academics and practitioners over the last couple of decades.
A. Sharma, K. Kaushik, P. Awasthy and A. Gawande American Business Review 25(2)
__________________________________________________
417
A review article by Minutiello and Tettamanzi (2021) suggests that the disclosure quality of
sustainability reporting is increasingly becoming a relevant research topic because the extent of
disclosure reflects a firm’s long-term performance and value creation for its stakeholders. Analyzing
almost 20 years of literature, Purvis et al., (2019) discuss three primary pillars of sustainability:
economic, social, and environmental. These three pillars were also explained from a triple-bottom-line
perspective by Elkington (2018). Rasmussen et al., (2017) used three pillars of sustainability to track
sustainability indicators in agricultural commodity production. The economic pillar pertains to profit,
which is a significant determinant of a firm’s success and survival, at least in the short- to medium-
term. The economic pillar includes better corporate governance and does not consider “profit at any
cost” to be appropriate. The social pillar emphasizes the importance of following business practices
that are fair to all stakeholders and neighboring communities and not just to shareholders. The social
pillar involves various responsible actions from the organization that promote giving back, including,
but not limited to, learning and growth opportunities, maternity/paternity leave for employees, and
better working conditions (Roberts, 2021). The environmental pillar refers to the firm’s responsibility
toward causing minimum negative externality in terms of emissions, pollution, and climate change,
which are generally unaccounted for while pricing the products traditionally. It involves initiatives from
the firm, such as zero-waste, zero-deforestation, water harvesting, efficient machines/equipment
usage, reduced packaging and transportation, recycling, and the usage of renewable energy. Based
on a review of the extant literature on sustainability and a content analysis of sustainability reports,
the authors generated a list of keywords representing each dimension of sustainability. The initial list
of such keywords was further refined using bigram analysis, which is discussed in detail in the
methodology section of the paper. These factors are of particular interest to regulators and
researchers in identifying problems concerning the variation in sustainability disclosures.
This study analyzes the sustainability reports of Fortune 500 firms from a three-pillar perspective
of sustainability. Moreover, it has been reported (Lyon et al., 2018; OECD, 2001) that government
regulations and policies play a critical role in enforcing organizations to take positive actions on
environmental and social fronts (Dauvergne and Lister, 2012). Therefore, in our study, we included a
fourth dimension: government regulation. This research proposes a framework to represent, analyze,
and compare sustainability reports by firms in terms of their focus on three pillars of sustainability
(economic, social, and environmental) along with government regulations. Using this framework, this
study aims to answer the following questions related to sustainability. Which dimensions of
sustainability are focused more on by companies in their reports? Why do companies focus on a
particular sustainability dimension? What external and internal factors drive a firm’s focus on these
different dimensions of sustainability?
The aforementioned questions were chosen because the literature reveals that organizations are
skewed in reporting on certain dimensions of sustainability (Hahn and Kühnen, 2013). Firms show such
behavior as they are bound by budgetary constraints, as a result of which the firms focus on low-
hanging fruits to generate relatively faster outcomes and impact. In certain cases, firms are bound by
regulatory pressure. For example, the outbreak of the COVID-19 pandemic has resulted in a global
health crisis. Globally, governments have pushed corporate entities to allocate their Corporate Social
Responsibility (CSR) budgets to improve the overall health and safety of their employees and
surrounding communities. In response, corporations across the globe have shifted their attention to
the social aspects of sustainability (Klymenko and Lillebrygfjeld Halse, 2021).
To answer the aforementioned questions, this study analyzes sustainability reports of leading
Fortune 500 companies on the economic, social, environmental, and government dimensions
(henceforth referred to as the four dimensions). We developed a novel methodology to generate
scores for the four dimensions of sustainability from sustainability reports of 360 companies in the
Fortune 500. To this end, we extended the sustainability score calculation proposed by Yadava and
A. Sharma, K. Kaushik, P. Awasthy and A. Gawande American Business Review 25(2)
__________________________________________________
418
Sinha (2016). In addition, we automated this process through an algorithm using text-mining
techniques. Based on the review of the literature, the authors synthesized the significant determinants
of sustainability reporting (Farisyi et al., 2022; Haidar et al., 2021). These factors were further
categorized into internal and external. Furthermore, we conducted an analysis to explore the
influence of external (origin country of company, sector, etc.) and internal (company size, tenure on
Fortune 500 list) factors on the sustainability scores along the four dimensions of sustainability.
Moreover, we conducted an analysis to explore the influence of external (origin country of
company, sector, etc.) and internal (company size, tenure on Fortune 500 list) factors on the
sustainability scores along the four dimensions of sustainability. We found that the development
ranking of a firm’s country of origin influences the economic and social scores reflected in the
sustainability report. Companies from relatively less developed countries are likely to have more focus
on economic development, while on the other hand, companies from developed countries have more
focus on the environmental dimension. Furthermore, the impact of other factors such as company
size, sector, and company age on the four dimensions of sustainability has also been analyzed.
The quantity of non-financially reported data is growing exponentially across sectors and
geographies. Thus, it is becoming increasingly important to assess the quality and quantity of the
reported data to derive meaningful insights. To bridge this gap, the present study developed a novel
methodology to assess the semantics of corporate sustainability data. By developing an automated
alternative to the manual evaluation of sustainability data proposed by Yadava and Sinha (2016), this
study contributes to overcoming the biases associated with manual evaluation.
BACKGROUND
Content analysis of firms’ non-financial disclosures has attracted the attention of researchers in both
academia and industry exploring sustainability trends in various parts of the world. Many studies have
focused on specific geographies. Skouloudis and Evangelinos (2009) evaluated the compliance and
quality of sustainability reports from Greek companies using the GRI 2002 reporting framework.
Yadava and Sinha (2016) assessed the sustainability reporting disclosures of leading Indian private- and
public-sector companies based on the GRI 2011 guidelines. Loh et al., (2017) investigated how the
adoption and quality of sustainability reporting disclosures are related to a firm’s market value for
Singaporean listed companies. Hongming et al., (2020) explored the relationship between corporate
sustainability practices and firm performance in 50 publicly limited companies on the Pakistan Stock
Exchange. Girón et al., (2021) investigated the relationship between sustainability disclosure and a
firm’s financial performance, particularly for firms in developing economies, such as Asia and Africa.
Some studies have explored sustainability reporting disclosures for a particular sector. Mahmood
and Orazalin (2017) examined Kazakhstan’s oil, gas, and mining companies to study the relationship
between board characteristics and sustainability reporting disclosures. Buallay (2019) investigated the
European banking sector to determine whether sustainability reporting disclosures are associated
with bank performance. Kumar and Prakash (2019) examined the banking sector to study Indian banks’
sustainability reporting. Raquiba and Ishak (2020) depicted the extent of sustainability reporting
practices in 19 energy companies in Bangladesh.
Several studies have targeted the Forbes Fortune list to understand the sustainability reporting
disclosures of leading firms across the globe and explore the relationship between firms’ corporate
sustainability (CS) reporting behavior and variables such as firm size, age, sector, ownership, country
of origin, and industry type. Morhardt et al., (2002) assessed the extent of sustainability reporting
using the GRI 2000, ISO 14031, and other criteria for 40 of the world’s largest companies. Jose and Lee
(2007) analyzed corporate environmental disclosures for the 200 largest corporations in the world on
the Fortune list. Furthermore, they investigated the environmental reporting of the 200 largest
A. Sharma, K. Kaushik, P. Awasthy and A. Gawande American Business Review 25(2)
__________________________________________________
419
corporations in the world and found that environmental disclosures vary with respect to country and
industry type. Morhardt (2010) examined the sustainability reports of 454 Fortune Global 500
companies and Fortune 1000 companies and observed that organization size has a negligible impact
on the sustainability reporting of the sampled companies. Gallo and Christensen (2011) analyzed the
effect of firm size and ownership on sustainability-related behavior and found that larger companies
report more sustainability information. In terms of firm ownership, public companies engage more in
sustainability reporting than private firms. Adler et al., (2018) specifically analyzed the corporate
disclosures related to wildlife, biodiversity, and threatened species of the top 150 Fortune Global
companies for the year 2014 and observed that the reporting by the sampled companies on
biodiversity and threatened species is quite limited, and there is inconsistency in reporting across the
index items, even among the high-scoring companies. Schreck and Raithel (2018) investigated the
effects of corporate social performance (CSP), visibility, and firm size on sustainability reporting levels
and observed that firm size has an inverted U-shaped relationship with sustainability reporting.
Ardiana (2021) assessed stakeholder engagement in sustainability reporting by examining 646
sustainability reports of Fortune Global 500 companies from 2015 to 2017 and found a lower level of
stakeholder engagement in sustainability reporting disclosures.
The aforementioned literature pertaining to the evaluation of sustainability reporting disclosures
has utilized different methodologies for assessing the quality, adherence, and extent of sustainability
reporting. Initial studies approached the analysis with the help of content analysis of reports using
human coders (Abbott and Monsen, 1979; Aggarwal and Singh, 2018; Daub, 2007; Jose and Lee, 2007;
Morhardt et al., 2002; Morhardt, 2010; Vormedal and Ruud, 2009; Yadava and Sinha, 2016; Zhang et al.,
2020). Later, some studies started to explore tools and text-mining techniques for conducting a
content analysis of CS reports. For instance, Székely and Vom Brocke (2017) applied a natural language
processing technique using topic modeling to identify the most common topics and practices in more
than 9,500 corporate sustainability reports published between 1999 and 2015. Amini et al., (2018)
performed a thematic and content analysis on sustainability reports of 2,013 Fortune 500 companies
using Leximancer software. Harymawan et al., (2020) examined the tone of language in sustainability
reports of construction sector companies listed in the Indonesian Stock Exchange using a sentiment
analysis technique in Python.
Recent studies of large firms in low- and middle-income countries in Africa and Asia have
investigated the key company features that influence the adoption and reporting of sustainability
practices. For instance, Kazemikhasragh et al., (2021) found that some peculiar characteristics such as
the type of company, its economic performance, increased engagement in CSR initiatives, and its
assurance by external parties have a positive correlation with the adoption of sustainability reporting.
The study by Cicchiello et al., (2022) reported that factors such as higher market-to-book value, higher
adoption of external assurance of reports, and higher representation of women and young directors
in the company’s board structure are positively related to the adoption of sustainability reporting.
Although scholars and practitioners have focused a great deal of attention toward the three-pillar
perspective on sustainability as proposed by Purvis et al., (2019), the current study has added
government regulation and compliance as the fourth pillar because the non-financial reporting
motives are highly influenced by regulatory requirements (Kolk, 2003). This is also evident from the
fact that sustainability reporting disclosures have entered from the voluntary to the mandatory realm,
and there is growing regulatory pressure in several countries, including the G20 members (European
Union and 19 countries including India, China, the UK, and the USA) that require environmental, social,
and governance (ESG) disclosures (Aggarwal and Singh, 2018).
The aforementioned studies that use text mining tools for analyzing sustainability reports are
limited to finding common themes, topics, and tones in sustainability reports. Our work uses
automated text mining and bigram analysis to analyze the focus of Fortune 500 companies on various

A. Sharma, K. Kaushik, P. Awasthy and A. Gawande American Business Review 25(2)
__________________________________________________
420
dimensions of sustainability. Therefore, our contribution is twofold: Using automated text mining and
bigram analysis; and developing a framework to compare Fortune 500 companies on four dimensions
of sustainability with help of the EESG (Economic, Environmental, Social, Government) framework
proposed in Figure 1.
Figure 1. EESG Framework for Four Dimensions of Sustainability
METHODOLOGY
To explore the sustainability reports of corporations worldwide, this study utilized the sustainability
reports of Fortune 500 companies in 2019. A sustainability report for each company was searched on
the web. Companies for which the 2019 report was not available, the sustainability report for the year
2018 was considered. For most Chinese and Korean companies, sustainability reports are not available
in English. The reports for these companies were not considered in further analyses. Overall, the
authors found sustainability reports for 395 companies out of Fortune 500 companies in the English
language. All sustainability reports were converted to a suitable format (txt format) for text mining
using custom code developed in Python 3.7.
As the research was conducted in the year 2020, the most recently available data, that is, for the
year 2019, were taken. Moreover, the authors wanted to avoid 2020 and 2021, as both of these years
were impacted by the COVID-19 pandemic. During the pandemic, the focus shifted to certain
dimensions of sustainability. For example, emissions were temporarily reduced because of the
slowdown in economic activity imposed by the lockdowns. Such situations would not have resulted in
estimating a true picture of the disclosures, and it may have failed to assess the long-term impact of
sustainability disclosures. In addition, 2019 witnessed a surge in regulatory requirements in various
parts of the world. For instance, the Securities and Exchange Board of India extended the business
responsibility reporting requirements from the top 500 to the top 1000 listed companies in 2019.
Similarly, the Stock Exchange of Hong Kong Limited amended the requirements for ESG reporting to
shift focus from mere reporting to the board of directors’ role in managing ESG-related aspects.
Similarly, NASDAQ and the Athens Stock Exchange strengthened their ESG reporting requirements.
The UK is legally committed to net zero by 2050, becoming the first major economy in the
world(KPMG, 2020).

A. Sharma, K. Kaushik, P. Awasthy and A. Gawande American Business Review 25(2)
__________________________________________________
421
The primary objective of this research was to compare sustainability reports on four dimensions of
sustainability: social, economic, environmental, and government. The authors generated a list of
keywords representing each dimension, based on a review of the extant literature on sustainability.
To identify other related keywords for each dimension, this study performed content analysis of
sustainability reports and backward snowballing using studies from the initial literature review. Hence,
the initial list was further refined by extracting important bigrams from the sustainability reports after
performing a bigram analysis using a bigram tokenizer implemented in Python 3.7. Initially, we
generated the top 1000 most frequent bigrams from all sustainability reports and manually examined
each bigram. If the bigram was relevant and related to one of the four dimensions, it was added to the
keyword list of that dimension. This step yielded four lists of 69, 69, 32, and 34 words representing
each dimension, namely environmental, social, economic, and governmental, respectively. Table 1 lists
the keywords extracted from the literature for each dimension. Similarly, a few sample bigram words
for each dimension are listed in Table 2. The reader may take a note that in a bigram, two words are
separated by ‘_’.
Table 1. List of Keywords Extracted from Literature
Dimension
Keywords
Environmental
environment, emission, pollution, co2, carbon, green, green-energy, solar, wind
power, responsible, deforestation, renewable, eco-friendly, ground water level,
sustainability
Social
social, responsible, community, human, safety, society, living standard, health
support, donation, contribution (not profit), ngo
Economic
profit, revenue, sales, cost, margin, market, segment, customer, promotion,
price, money, economic, loss, production, units, target
Government
regulations, policy, rule, compliance, amendment, restrictions, relaxation,
penalty, permission, law, restrictions, cap, government
Table 2. Sample Bigrams for Various Dimensions of Sustainability Extracted from Sustainability Reports
Environmental
(69 words)
Social
(69 words)
Economic
(32 words)
Government
(33 words)
climate_change
social_responsibility
energy_efficiency
audit_committee
environmental_protection
health_safety
carbon_economy
audit_supervisory
clean_energy
poverty_alleviation
technological_innovation
ethics_compliance
carbon_footprint
respect_human
zero_waste
internal_audit
environmental_footprint
social_governance
reduce_waste
code_ethics
wind_power
safety_health
technology_innovation
supervisory_committee
water_consumption
gender_equality
technology_development
ethics_integrity
food_waste
food_safety
development_sustainable
legal_compliance
emission_reduction
community_development
energy_waste
environmental_compliance
energy_conservation
socially_responsible
waste_reduction
regulatory_compliance
reduce_carbon
public_welfare
open_innovation
governance_code
solar_power
human_labor
sustainable_supply
ethical_conduct
hazardous_waste
occupational_safety
fair_trade
committee_audit
global_warm
inclusion_diversity
fuel_efficiency
compliance_committee
environmentally_friendly
child_labor
drive_innovation
governance_ethics

A. Sharma, K. Kaushik, P. Awasthy and A. Gawande American Business Review 25(2)
__________________________________________________
422
After creating the keyword lists for each dimension, the dimensionality reduction technique and
cosine similarity method were deployed to compute the similarity score of each report for all four
dimensions of sustainability. This study uses latent semantic indexing (LSI) (Deerwester et al., 1990)
based on singular value decomposition (Businger and Golub, 1969; Golub and Reinsch, 1971) to map
the semantic structure of sustainability reports from a high-dimensional vector space model to a low-
dimensional representation. This study first converted all sustainability reports into a matrix of terms
by document. This term-document matrix X was decomposed by Singular Vector Decomposition (SVD)
to analyze the semantic association among terms in the collection of sustainability reports. We used
the term frequency-inverse document frequency (a standard method used in information retrieval
research) to identify the weights of the terms (Turney, 2001). Matrix X of rank p was decomposed into
a product of three matrices, U, L, and A, which are called the linearly independent components of X.
X= ULA
T
where the matrices U and A have a unit length with orthonormal columns (and are called singular
vectors), and matrix L is a diagonal matrix (and is called singular values) of the same rank (p) as X. Most
of the singular values are very small and may be removed to retrieve a new matrix X' with rank k (k <
p) that best approximates X.
X'= U
k
L
k
A
k
T
where the matrix L
k
is the resultant matrix after removing (p-k) diagonal nonsignificant singular values.
To remain consistent, we removed the corresponding entries from matrices U and A to retrieve U
k
and
A
k
, respectively. In this way, we map all sustainability reports to this “compressed version” of the
vector space model.
To identify the similarity of these reports with the vector of the keyword list representing each
dimension, we converted each keyword list into a vector of dimension k using the fold-in method
(Adelman and Simina, 2004; Berry et al., 1995) of LSI. In this way, we converted each sustainability
report into a vector of dimension k and each sustainability dimension (social, economic,
environmental, and government) into vectors of dimension k. Finally, to assess the similarity between
a particular sustainability report of a company and the four sustainability dimensions, we estimated
cosine similarity (Han et al., 2012). We used the final cosine values as similarity scores to represent the
focus of a report on various dimensions of sustainability.
RESULTS
In this section, we analyze the results to explain the impact of various countries’ characteristics on
firms’ focus on various dimensions of sustainability. First, we explored the effect of the level of
development of the originating country on the scores of various sustainability dimensions. Further, we
explore the effects of firm size and age in the Fortune 500 list on sustainability disclosure across
various dimensions. Finally, the Results section concludes by exploring interesting sustainability
disclosure patterns across companies and industry sectors.
A. Sharma, K. Kaushik, P. Awasthy and A. Gawande American Business Review 25(2)
__________________________________________________
1
https://www.un.org/en/development/desa/policy/wesp/wesp_current/2014wesp_country_classification.pdf
2
https://epic.uchicago.edu/news/why-environmental-quality-is-poor-in-developing-countries-a-primer/
423
IMPACT OF THE LEVEL OF DEVELOPMENT
We segregated countries into two types – developing and developed – based on the report “World
Economic Situation and Prospects 2014” by the UN
1
. Table 3 presents the average scores for these
countries on various dimensions of sustainability.
Table 3. Comparison Between Firms from Developed and Developing Countries
Country of
Origin
No. of
Firms
Social
Environmental
Economic
Government
Developed
318
0.391
0.273
0.294
0.241
Developing
77
0.313
0.241
0.340
0.245
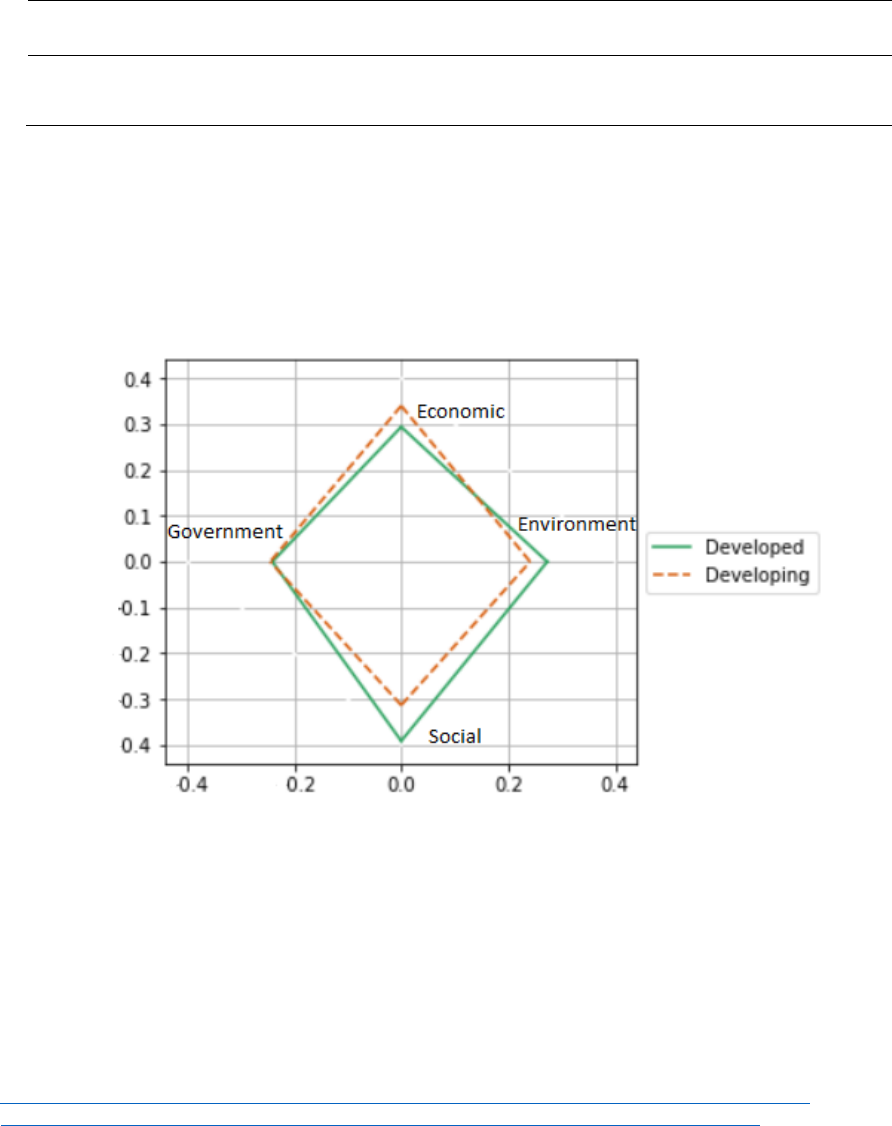
Figure 2 graphically represents the scores (Table 3) for firms in developed and developing countries.
We can observe from Figure 2 that for developed countries, the highest focus is on the social
dimension, whereas for developing countries, the highest focus is on the economic dimension. This is
justifiable from the fact that developed countries have already achieved economic sustainability and
have focused more on social aspects. We also find that, for developing countries, the environmental
dimension is the least focused one. This section is discussed in detail in the media
2
.
Figure 2. Comparison Between Firms Belonging to Developing and Developed Countries
We can observe from Figure 2 that the focus of firms in developed countries is skewed toward the
social dimension only. However, in developing countries, the focus is skewed toward economic and
social dimensions. Moreover, in the government/regulation dimension, firms in developing and
developed countries seem similar in terms of their focus.
To further understand the differences between firms in developed and developing countries, we
ran an independent samples t-test. Table 4 presents the results. The table shows that, except for the

A. Sharma, K. Kaushik, P. Awasthy and A. Gawande American Business Review 25(2)
__________________________________________________
424
government/regulation dimension, firms in developed and developing countries differ in their level of
focus on various dimensions of sustainability. This is also in line with the inferences from Figure 2.
Table 4. Comparison Between Developed and Developing Countries
Feature/Dimension
Developed-
Developing
Lower
Upper
p-value
Environmental
0.03
-0.001
0.07
0.06
Economic
-0.05
-0.08
-0.01
0.01
Government
-0.004
-0.04
0.03
0.81
Social
0.08
0.03
0.12
0.00
IMPACT OF FIRM CHARACTERISTICS
In this subsection, we analyze the impact of firm characteristics, such as size (with respect to the
number of employees) and age (duration for which it is part of the Fortune 500 list), on their relative
scores on the four dimensions. We can observe from Table 5 and Figure 3 that irrespective of firm size,
their scores on the economic dimension are similar. However, firms with fewer than 50,000 employees
do better than other firms in the remaining three dimensions (environmental, social, and
government). This implies that it is easier for smaller firms to manage other than the economic
dimensions of sustainability. Firms with more than 50,000 employees have a similar environmental
score, but firms in the size range 50,000–200,000 have a better score on social dimensions. This again
signifies the difficulty in managing social issues in a larger organization.
Table 5. Comparison of Sustainability Dimensions with Respect to Firm Size
Firm Size
Social
Environmental
Economic
Government
Below 50000
0.401
0.288
0.294
0.248
Between 50 K
and 200K
0.373 0.257 0.308 0.243
Above 200K
0.346
0.261
0.303
0.229
Figure 3. Comparison of Sustainability Dimensions with Respect to Firm Size

A. Sharma, K. Kaushik, P. Awasthy and A. Gawande American Business Review 25(2)
__________________________________________________
425
The samples t-test results presented in Table 6 confirm our earlier findings that firms larger than
200,000 (high) are significantly different from the other two categories. Moreover, firms below
50,000 (low and medium) do not differ from each other.
Table 6. Comparison of Social Score for Firms with Different Size
Size Pairs
Difference
Lower
Upper
p-value
Medium -Low
-0.03
-0.01
0.04
0.31
High-Low
-0.06
-0.11
0.00
0.08
High-Medium
-0.03
-0.05
0.001
0.07
We can observe from Table 7 and Figure 4 that the duration for which firms are part of the Fortune
500 list does not impact their score on the economic, environmental, and government fronts.
However, firms with more than 20 years of experience on the Fortune list perform better on social
scores than the rest. This finding, along with the finding with respect to size, indicates the sequence
in which firms focus on the various dimensions of sustainability. Firms justifiably focus first on the
economic dimension, followed by environmental and government regulations. The social dimension
appears to be the last dimension to focus on.
Table 7. Sustainability Dimension Scores with Respect to Firm’s tenure on Fortune 500 List
Years on Fortune 500 List
Social
Environmental
Economic
Government
Less than 10 years
0.347
0.257
0.314
0.236
Between 10 to 20
0.361
0.261
0.308
0.236
More than 20 years
0.395
0.273
0.296
0.247
Figure 4. Comparison of Sustainability Scores with Respect to Firm’s Tenure on Fortune 500 List
From Table 8, we observe that firms less than 10 years old (0 decade) and firms between 10 and 20
years old (1 decade) do not differ from each other. Similarly, 1-decade type firms are not different from
firms with more than 20 years (2 decade) on the Fortune list. However, the 0-decade firms are
significantly different from the 2-decade firms. This indicates that the transformation in these four
dimensions was a relatively slow process, and differences were observed only after a couple of
decades.

A. Sharma, K. Kaushik, P. Awasthy and A. Gawande American Business Review 25(2)
__________________________________________________
426
Table 8. Comparison of Social Scores Among Firms with Different Tenure on Fortune 500 list
Duration Pairs
Difference
Lower
Upper
p-value
1 decade- 0 decade
0.01
-0.05
0.07
0.85
2 decade- 0 decade
0.05
-0.01
0.10
0.09
2 decade- 1 decade
0.03
-0.02
0.08
0.25
ALIGNMENT BETWEEN COUNTRIES
We explored the similarity between the top-15 countries from the Gross Domestic Product (GDP)
perspective to assess the alignment between countries on different dimensions of sustainability. We
performed a community-based network analysis for this comparison. Network analysis is an
established method for developing relational interpretation of a community-based network to yield
additional insights regarding network properties (Lin et al., 2015; Maya-Jariego and Holgado, 2015). As
a part of the community-based network analysis, we obtain hubs, authorities, and communities of the
top-15 countries based on GDP. The hub and authority graphs are shown in Figure 5. From the
community detection graph presented in Figure 5, we observe three communities in each country.
Figure 5. Community Detection Graph for Top-15 GDP Countries
The first community is formed by countries such as China, India, the UK, and the USA, with South
Korea overlapping Communities 1 and 2. The presence of China, India, and South Korea in the same
community is justifiable because of the development path and commonly understood similarities

A. Sharma, K. Kaushik, P. Awasthy and A. Gawande American Business Review 25(2)
__________________________________________________
3
https://europa.eu/capacity4dev/articles/challenges-implementing-sustainable-development-goals-asia
427
based on dimensions such as environmental, economic, social, and government
3
. Firms in these
countries have relatively low scores for the environmental, economic, and government dimensions of
sustainability. Surprisingly, countries such as the UK and USA are in the same community.
Nevertheless, from Table 9, we can observe that China, India, and South Korea score lower than the
USA and UK on the environmental dimension.
The second community consisted of Australia, Brazil, Japan, Mexico, and South Korea. We can
observe from Table 9 that firms in Japan have better environmental dimension scores than firms
belonging to other countries in Community 2. Similarly, firms in Brazil are relatively better than other
firms in Community 2. The aforementioned observations of Japan and Brazil from Table 9 are
identifiable from the location of these two countries in the community detection graph shown in
Figure 5.
Table 9. Comparison of Top-15 GDP Countries on Sustainability Dimensions
Country
Social
Environmental
Economic
Government
Community
US
0.361
0.262
0.235
0.214
1
China
0.249
0.231
0.317
0.203
1
India
0.344
0.203
0.303
0.262
1
United
Kingdom
0.403 0.275 0.315 0.171 1
South Korea
0.421
0.236
0.361
0.227
1, 2
Japan
0.483
0.271
0.286
0.27
2
Brazil
0.499
0.217
0.415
0.345
2
Australia
0.489
0.212
0.282
0.297
2
Mexico
0.442
0.252
0.335
0.244
2
Germany
0.325
0.304
0.339
0.306
3
France
0.381
0.314
0.362
0.249
3
Italy
0.34
0.287
0.445
0.295
3
Canada
0.469
0.371
0.229
0.279
3
Russia
0.31
0.248
0.579
0.404
3
Spain
0.39
0.296
0.396
0.344
3
Canada, France, Germany, Italy, Spain, and Russia formed a third community. It is intuitive that
European countries, such as France, Germany, Italy, and Spain, are part of the same community
because of the similarity in their geographical, economic, and shared regulation practices. In certain
ways, the presence of Russia in the cluster could also be explained, as Russia shares some of the
aforementioned aspects. However, the presence of Canada in the same community is counterintuitive
because of differences in policies and initiatives on sustainability. Nevertheless, we can observe from
Figure 5 that Canada is relatively distant from the other countries in Community 3. Moreover, Table 9
shows that the scores of firms in Canada on the environmental, economic, and social dimensions are
quite distinct from those of other firms in the same community.

A. Sharma, K. Kaushik, P. Awasthy and A. Gawande American Business Review 25(2)
__________________________________________________
428
From Figure 6, it is evident that countries in Community 1 have lower government scores than
countries in Communities 2 and 3. To determine if this is statistically true, a t-test was conducted, with
the results shown in Table 10.
Figure 6. Alignment Among Communities with Respect to Countries
Table 10. Comparison of Government Score Among Various Country Communities
Community Pairs
Difference
Lower
Upper
p-value
Community 2-1
0.06
0.02
0.11
0.00
Community 3-1
0.09
0.05
0.13
0.00
Community 3-2
0.02
-0.03
0.07
0.72
Similarly, another interesting insight from Figure 6 is that social scores for countries in Community
2 are higher than those in the other two communities. To determine if this is statistically true, a t-test
was conducted, with the results shown in Table 11.
Table 11. Comparison of Social Score Among Various Country Communities
Community Pairs
Difference
Lower
Upper
p-value
Community 2-1
0.14
0.08
0.20
0.00
Community 2-3
0.11
0.05
0.18
0.00
Community 3-1
0.02
-0.03
0.08
0.51
From Figure 6, we can also see that Community 3 has a higher environmental score than the other
two communities. To determine if this is statistically true, a t-test was conducted, with the results
shown in Table 12.
Table 12. Comparison of Environmental Score Among Various Country Communities
Community Pairs
Difference
Lower
Upper
p-value
Community 3-1
0.06
0.01
0.10
0.00
Community 3-2
0.05
0.00
0.11
0.05
Community 2-1
0.01
-0.04
0.05
0.96

A. Sharma, K. Kaushik, P. Awasthy and A. Gawande American Business Review 25(2)
__________________________________________________
429
ALIGNMENT BETWEEN SECTORS
In this section, we apply community-based network analysis to visualize the alignment among
different business sectors. We can observe from the community detection graph shown in Figure 7
that five distinct communities are formed based on the sectors.
Figure 7. Community Detection Graph for Various Industry Sectors
The first community is represented by firms in the energy, motor vehicles and parts, wholesalers,
and chemical sectors. It is intuitive that firms in the chemical, energy, and motor sectors fall into the
same community because of the intensive raw material requirements and emissions during the
manufacturing process. However, the presence of a wholesale sector in the same community is
counterintuitive. Nevertheless, close observation of Table 13 reveals that wholesalers seem to be
different from the rest of the firms in the community in the economic dimension. The same can be
observed in the community detection graph presented in Figure 7. Unexpectedly, in the environmental
dimension, firms in the wholesale sector scored lower than firms in the energy sector, while they
scored higher than firms in the motor and chemical sectors. For a long time, energy sector firms
(mostly thermal power-based) have been known to have high environmental emissions and take
various steps, including switching to renewable energy sources. On the other hand, environmental
issues related to the auto and chemical sectors have not received much attention in the past, and
green initiatives in these sectors are a relatively recent phenomenon. Therefore, different stages of
green focus for these sectors could explain the aforementioned counterintuitive finding. Firms are
distinct from each other, except for firms in Communities 4 and 5, which appear to be similar.

A. Sharma, K. Kaushik, P. Awasthy and A. Gawande American Business Review 25(2)
__________________________________________________
430
Table 13. Comparison of Various Sectors on Sustainability Dimensions
The second community consisted of food and drug stores, retail, engineering, and construction
sectors. The presence of firms in food and drug stores and retail sectors in the same community is
expected; however, the inclusion of firms in the engineering and construction sectors is unexpected.
However, we can observe from Table 6 that engineering and construction share similarities with other
firms in the community on the economic and environmental dimensions, and therefore explain the
inclusion of these three sectors in the same community. Moreover, the wholesale sector is not far from
food and drug stores and retail, even though it is in a different community (Figure 7). This closeness is
justified because wholesale, food and drug stores, and retail are non-manufacturing sectors and have
similar business characteristics.
The financial, technological, aerospace, and defense sectors form a third community. Table 13
shows that firms in these three sectors are similar in all dimensions. However, they are relatively
dissimilar on the environmental front, and technology firms have a higher score than firms in the other
two sectors.
The fifth community comprises sectors such as healthcare, food, beverages and tobacco,
telecommunications, industries, and materials organized into one community. All four sectors except
the telecommunications sector require raw materials, and they are relatively more productive sectors
than services.
Healthcare is predominantly a service but requires material management for medicine and other
medical supplies. Therefore, the presence of materials, industrial, food, beverages and tobacco, and
healthcare in the same sector is justifiable. However, the presence of telecommunications is
counterintuitive, but we can observe from Table 13 that firms in the telecommunication sector are
different from other firms in the community in terms of social and government dimensions. Moreover,
the position of telecommunications in Figure 7 also indicates that it is different from other firms in the
Sector
Social
Environmental
Economic
Government
Group
Energy
0.20
0.16
0.17
0.10
1
Motor Vehicles & Parts
0.20
0.12
0.16
0.13
1
Wholesalers
0.22
0.14
0.12
0.12
1
Chemicals
0.19
0.12
0.17
0.08
1
Food & Drug Stores
0.21
0.16
0.12
0.08
2
Retailing
0.22
0.17
0.15
0.07
2
Engineering & Construction
0.25
0.15
0.15
0.08
2
Financials
0.17
0.14
0.11
0.09
3
Technology
0.19
0.16
0.12
0.08
3
Aerospace & Defence
0.18
0.13
0.10
0.08
3
Health Care
0.16
0.09
0.12
0.09
4
Food, Beverages & Tobacco
0.16
0.12
0.14
0.09
4
Telecommunications
0.19
0.12
0.13
0.05
4
Industrials
0.16
0.10
0.12
0.10
4
Materials
0.15
0.11
0.14
0.07
4
Transportation
0.16
0.15
0.14
0.08
5
A. Sharma, K. Kaushik, P. Awasthy and A. Gawande American Business Review 25(2)
__________________________________________________
431
community.
Further investigations of these communities reveal that sectors in Community 1 have higher scores
for social and economic dimensions, and sectors in Community 2 have a higher score for social and
environmental dimensions. Community 3 (financial, technology, aerospace, and defense sectors) has
a lower score for economic and social dimensions. Sectors in Community 4 had lower environmental
and social scores. Community 5 had a moderate social score and a lower score for the environmental
dimension.
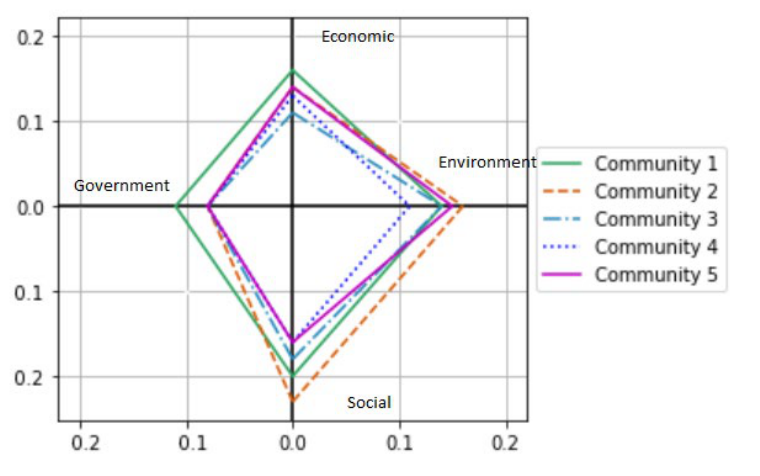
Figure 8 depicts the alignment among various communities of sectors on sustainability dimensions.
From Figure 8, we can observe that in the environmental dimension, all communities except
Community 5 are similar. Similarly, in the government dimension, all sectors except Community 1 are
similar. However, in the social dimension, all communities are different from each other.
Figure 8. Alignment Among Communities Based on Industry Sectors
Figure 8 shows that sectors in Community 1 have higher scores for the government than that for
other communities. However, we could not find a statistical difference in the government scores for
various communities of sectors. Another striking observation is the low score for the environment
dimension of Community 4 compared with other communities. Table 14 provides the statistical
differences in the environmental scores for Community 4 compared with other communities.
Companies belonging to sectors in Community 4 had significantly lower environmental scores than
those belonging to sectors in Communities 1, 2, and 3. Thus, sectors such as materials, healthcare,
telecommunications, and industries have a lower score on the environmental dimension than other
sectors.

A. Sharma, K. Kaushik, P. Awasthy and A. Gawande American Business Review 25(2)
__________________________________________________
432
Table 14. Comparison of Environmental Score Among Various Sector Communities
Community Pairs
Difference
Lower
Upper
p-value
Community 4-1
-0.07
-0.12
-0.01
0.01
Community 4-2
-0.09
-0.17
-0.01
0.01
Community 4-3
-0.06
-0.11
-0.01
0.01
Community 4-5
-0.07
-0.17
0.03
0.26
DISCUSSION
In continuation of the research efforts to evaluate corporate sustainability reports, we derived a novel
content analysis methodology to assess the sustainability reports of Fortune 500 companies and
subsequently compared the scores on different dimensions with an emphasis on factors such as level
of development, firm characteristics, sectors, and countrywide analysis.
The developmental status of a country has an impact on various dimensions of sustainability,
except for the government dimension. In comparison, the focus of firms in developed countries is
skewed only toward the social dimension, whereas firms in developing countries are skewed toward
the economic and social dimensions. This is evident from the fact that developed countries have
achieved economic sustenance and, as such, firms in developed countries are focusing more on social
development. By contrast, developing countries have the highest focus on economic dimensions and
the least focus on environmental dimensions. This is in line with the common notion that developing
countries aspire to transform into developed economies, and in the process, the focus on
environmental sustainability is compromised. In a similar context, Farisyi et al., (2022) investigated
sustainability reporting adoption in developing countries and found that lack of training, low level of
expertise, and negative attitudes toward sustainability reporting are significant determinants
affecting the quality of disclosures in developing countries. Bhatia and Tuli (2018) suggested that
developing nations should work more on the quality of sustainability reporting, as sustainability issues
are more pertinent in developing countries than in developed countries.
Many studies have explored the relationship between the size of a company (in terms of revenue)
and the different dimensions of sustainability. Gallo and Christensen (2011) analyzed the effect of firm
size on sustainability-related behavior and found that larger companies report more on sustainability
information, whereas Bergmann and Posch (2018) found that the size of the firm matters only in the
case of mandatory sustainability reporting, while it is not a crucial factor for firms not mandated by
law for sustainability reporting. However, our research did not find a significant impact of the size (in
terms of revenue) on the EESG dimensions. Hence, we analyzed the impact of firms’ characteristics,
such as size (in terms of the number of employees), on their relative scores on the EESG dimensions.
This adds a new perspective to the body of literature with regard to company size and sustainability
disclosures. In comparison, we observed that large firms (more than 200,000 employees) are
significantly different from small (below 50,000) and medium firms (50,000–200,000). We observed
that as company size increased, the score on the social dimension decreased, signifying ignorance of
managing social issues in larger organizations. At the same time, it poses great opportunities for large
organizations to tackle these issues by utilizing employee engagement in CSR activities.
We further observe that the longevity of the firm for which it is part of the Fortune 500 list does
not have much impact on the economic, environmental, and government dimensions. However, as the
number of years on the Fortune 500 list increased, the score on the social dimension also increased.
We also observed that firms below 10 years old (0-decade type) are significantly different from those
A. Sharma, K. Kaushik, P. Awasthy and A. Gawande American Business Review 25(2)
__________________________________________________
433
with more than 20 years old (2-decade type), which indicates that the transformation of the EESG
dimensions is a relatively slow process, and differences are observed only after a couple of decades.
When the two dimensions (size and age) are combined, old small firms have a greater focus on the
social dimension, whereas big new firms have a comparatively lesser focus on the social dimension.
This is in line with a study by Badulescu et al., (2018) that observes that newer (young) firms are less
involved in social responsibility actions than older firms that have dedicated departments or people to
manage social responsibility actions. Our findings also aligned with the finding by Prashar (2021), which
found that large and mature firms engage more in sustainability reporting because they have a
comparatively better presence of institutional investors in their corporate board composition.
IMPLICATIONS
As the pandemic was a big setback for sustainable development, it would be interesting to understand
the future trajectories of firms in both developed and developing countries. The Sustainable
Development Report 2021 reveals that sustainable development has been severely impacted by the
COVID-19 pandemic, leading to a downward trend in the global average SDG index score for 2020 since
the adoption of the SDGs in 2015 (Sachs et al., 2021). The United Nations have announced the 2020-30
decade as the Decade of Action, and 17 SDGs have to be achieved by 2030. As part of the Paris Climate
Agreement, the majority of countries have made climate-related commitments, and firms located in
these countries are also increasingly taking net-zero pledges to achieve carbon neutrality
commitments. Against the backdrop of this scenario, the current research provides a framework and
methodology to scrutinize communicated sustainability data with the help of technological
interventions.
THEORETICAL IMPLICATIONS
Sustainability reporting frameworks are evolving and will continue to evolve over time (Minutiello and
Tettamanzi, 2021). This necessitates the assessment of the information provided by these frameworks.
At this crucial juncture, the current study provides a technological intervention by developing a novel
content analysis methodology through digitalized means to assess various dimensions of
sustainability. Furthermore, this study contributes to sustainability disclosure research and aligns with
the findings of previous studies by suggesting that there are variations in sustainability reporting with
respect to organizational size, origin, age, and sector (Bergmann and Posch, 2018; Gallo and
Christensen, 2011; Prashar, 2021). The findings and observations from this study may serve as a premise
for future inquiries into the sustainability reporting behavior of firms across the globe. This study adds
a new EESG framework and automated text mining methodology using bigram analysis to the body of
literature to analyze corporate sustainability disclosures. The developed framework and methodology
have wide applications across various sectors and geographies for assessing longitudinal data
pertaining to corporate sustainability.
PRACTICAL IMPLICATIONS
This research reveals that there is a lack of a uniform set of standards for disclosing, measuring, and
reporting a company’s progress on various dimensions of sustainability. The need for a globally
recognized standard that integrates all previous standards and frameworks was recognized at the COP
26 summit. In response, the International Sustainability Standards Board is developing a standard for
sustainability reporting similar to the financial reporting standard developed by the International
A. Sharma, K. Kaushik, P. Awasthy and A. Gawande American Business Review 25(2)
__________________________________________________
434
Accounting Standards Board (Eccles and Mirchandani, 2022). Toward this end, the present study
would help stakeholders understand the underlying behavior of firms in a variety of contexts with the
robust methodology developed in this study. In particular, it would be helpful to generate insights into
the relative focus of firms on different dimensions of sustainability. Such information would be of
greater interest to regulators and evaluators in taking corrective measures to ensure long-term
impacts and outcomes in maintaining an equitable planet and just society. Community graphs would
particularly be of interest to policymakers in assessing the variation and similarities in reporting
between different countries.
LIMITAIONS AND CONCLUSION
This study has several limitations. First, the present research was restricted to analyzing the
sustainability reports of 395 out of Fortune 500 companies in the English language. Future research
could address this shortcoming by incorporating a large sample and including sustainability reports
written in other prominent international languages. Second, this study generated a list of limited
keywords by reviewing the literature pertaining to different dimensions of sustainability. The
keywords extracted from the literature were subjective in nature. Thus, future research may consider
analyzing other linguistic versions of sustainability reports using the automated text mining
methodology applied in the current study. In addition to limiting the analysis to keywords and bigrams,
future studies may also incorporate semantic analyses to extract deeper trends and patterns from
sustainability reports. Third, this study leverages the state-of-the-art LSI technique to project reports
to vectors. Future studies may utilize the latest advancements in natural language processing, such as
word embeddings and text encoders, for the effective analysis of sustainability reports.

A. Sharma, K. Kaushik, P. Awasthy and A. Gawande American Business Review 25(2)
__________________________________________________
435
REFERENCES
Abbott, W. F. & Monsen, R. J. (1979). On the measurement of Corporate Social Responsibility: Self-
Reported Disclosures as a Method of Measuring Corporate Social Involvement. Academy of
Management Journal, 22(3), 501-515.
Adelman, N. & Simina, M. (2004). Adapting LSI for Fine-Grained and Multi-Level Document
Comparison. American Association for Artificial Intelligence, 1, 141–146.
Adler, R., Mansi, M., & Pandey, R. (2018). Biodiversity and Threatened Species Reporting by the Top
Fortune Global Companies. Accounting, Auditing & Accountability Journal. 31 (3), 787-825.
Aggarwal, P. & Singh, A. K. (2018). CSR and Sustainability Reporting Practices in India: An In-Depth
Content Analysis of Top-Listed Companies. Social Responsibility Journal. 15(8), 1033-1053.
Amini, M., Bienstock, C. C., & Narcum, J. A. (2018). Status of Corporate Sustainability: A Content
Analysis of Fortune 500 Companies. Business Strategy and the Environment, 27(8), 1450-1461.
Ardiana, P. A. (2021). Stakeholder Engagement in sustainability Reporting by Fortune Global 500
Companies: A Call for Embeddedness. Meditari Accountancy Research.
Badulescu, A., Badulescu, D., Saveanu, T., & Hatos, R. (2018). The Relationship Between Firm Size and
Age, and Its Social Responsibility Actions—Focus on a Developing Country (Romania).
Sustainability, 10(3), 805.
Bergmann, A. & Posch, P. (2018). Mandatory Sustainability Reporting in Germany: Does Size Matter?
Sustainability, 3904.
Berry, M. W., Dumais, S. T., & Letsche, T. A. (1995, December). Computational Methods for Intelligent
Information Access. In Proceedings of the 1995 ACM/IEEE Conference on Supercomputing (p. 20).
Bhatia, A. & Tuli, S. (2018). Sustainability Reporting: An Empirical Evaluation of Emerging and
Developed Economies. Journal of Global Responsibility, 9(2), 207-234.
Buallay, A. (2019). Is Sustainability Reporting (ESG) Associated with Performance? Evidence from the
European Banking Sector. Management of Environmental Quality: An International Journal,
30(1), 98-115.
Businger, P. A. & Golub, G. H. (1969). Algorithm 358: Singular Value Decomposition of a Complex Matrix
[f1, 4, 5]. Communications of the ACM, 12(10), 564-565.
Cicchiello, A. F., Alicia, G., Kazemikhasragh A., & Eva, P. (2022). Company Characteristics and
Sustainability Reporting: Evidence from Asia and Africa. International Journal of Social Ecology
and Sustainable Development, 13, 1-18. https://doi.org/10.4018/IJSESD.290309.
Dahlmann, F. & Bullock, G. (2020). Nexus Thinking in Business: Analysing Corporate Responses to
Interconnected Global Sustainability Challenges. Environmental Science & Policy, 107, 90-98.
Daub, C. H. (2007). Assessing the Quality of Sustainability Reporting: An Alternative Methodological
Approach. Journal of Cleaner Production, 15(1), 75-85.
Dauvergne, P. & Lister, J. (2012). Big Brand Sustainability: Governance Prospects and Environmental
Limits. Global Environmental Change, 22(1), 36-45.
Deerwester, S., Dumais, S. T., Furnas, G. W., Landauer, T. K., & Harshman, R. (1990). Indexing by Latent
Semantic Analysis. Journal of the American Society for Information Science, 41(6), 391-407.
Eccles, R. G. & Mirchandani, B. (2022, February 15). We Need Universal ESG Accounting Standards.
Harvard Business Review.
Elkington, J. (2018). 25 Years Ago I Coined the Phrase “Triple Bottom Line.” Here’s Why It’s Time to
Rethink It. Harvard business review, 25, 2-5.
Farisyi, S., Musadieq, M., Utami, H., & Damayanti, C. (2022). A Systematic Literature Review:
Determinants of Sustainability Reporting in Developing Countries. Sustainability, 14(16), 10222.
https://doi.org/10.3390/su141610222.

A. Sharma, K. Kaushik, P. Awasthy and A. Gawande American Business Review 25(2)
__________________________________________________
436
Gallo, P. J. & Christensen, L. J. (2011). Firm Size Matters: An Empirical Investigation of Organizational
Size and Ownership on Sustainability-Related Behaviors. Business & Society, 50(2), 315-349.
Girón, A., Kazemikhasragh, A., Cicchiello, A. F., & Panetti, E. (2021). Sustainability Reporting and Firms’
Economic Performance: Evidence from Asia and Africa. Journal of the Knowledge Economy,
12(4), 1741-1759.
Golub, G. H. & Reinsch, C. (1971). Singular Value Decomposition and Least Squares Solutions. In
Handbook for Automatic Computation. Die Grundlehren der mathematischen Wissenschaften,
vol 186. Springer, Berlin, Heidelberg. https://doi.org/10.1007/978-3-642-86940-2_10.
Haidar, H. M., Sohail, R. M., & Al Qurashi, S. M. (2021). Emerging Trends in Sustainability Reporting (SR):
Comparative Literature Review in Developed, Developing and GCC Countries. Open Journal of
Business and Management, 2697-2718.
Hahn, R. & Kühnen, M. (2013). Determinants of Sustainability Reporting: A Review of Results, Trends,
Theory, and Opportunities in an Expanding Field of Research. Journal of Cleaner Production, 5-
21.
Han, J., Kamber, M., & Pei, J. (2012). Data Mining: Concepts and Techniques. Scopus.
https://doi.org/10.1016/C2009-0-61819-5.
Harymawan, I., Nasih, M., Ratri, M. C., Soeprajitno, R. R. W. N., & Shafie, R. (2020). Sentiment Analysis
Trend on Sustainability Reporting in Indonesia: Evidence from Construction Industry. Journal
of Security and Sustainability Issues, 9(3), 1017-1024.
Hongming, X., Ahmed, B., Hussain, A., Rehman, A., Ullah, I., & Khan, F. U. (2020). Sustainability
Reporting and Firm Performance: The Demonstration of Pakistani Firms. SAGE Open, 10(3), 1-
12.
Jose, A. & Lee, S. M. (2007). Environmental reporting of global corporations: A Content Analysis Based
on Website Disclosures. Journal of Business Ethics, 72(4), 307-321.
Kazemikhasragh, A., Cicchiello, A. F., & Pietronudo, M. C. (2021). Factors Influencing the Adoption of
SDG Reporting by Large African and Asian Companies. International Journal of Technology
Management & Sustainable Development, 43-60.
Klymenko, O. & Lillebrygfjeld Halse, L. (2021). Sustainability Practices During COVID-19: An Institutional
Perspective. The International Journal of Logistics Management, 33(4), 1315-1335.
Kolk, A. (2003). Trends in Sustainability Reporting by the Fortune Global 250. Business Strategy and the
Environment, 12(5), 279-291.
KPMG. (2020). The Time Has Come: The KPMG Survey of Sustainability Reporting 2020. KPMG.
Kumar, K. & Prakash, A. (2019). Examination of Sustainability Reporting Practices in Indian Banking
Sector. Asian Journal of Sustainability and Social Responsibility, 4(1), 1-16.
Kumar, P., Sharma, D., & Pandey, P. (2022). Industry 4.0 (I4. 0) Based Virtual Organization Model for
the Coordination of Sustainable Textile Supply Chain. American Business Review, 25(1), 10.
Lorenzoni, I. & Benson, D. (2014). Radical Institutional Change in Environmental Governance:
Explaining the Origins of the UK Climate Change Act 2008 Through Discursive and Streams
Perspectives. Global Environmental Change, 29, 10-21.
Lin, C. C., Kang, J. R., & Chen, J. Y. (2015). An Integer Programming Approach and Visual Analysis for
Detecting Hierarchical Community Structures in Social Networks. Information Sciences, 299,
296-311.
Linnenluecke, M. K. & Griffiths, A. (2013). Firms and Sustainability: Mapping the Intellectual Origins and
Structure of the Corporate Sustainability Field. Global Environmental Change, 23(1), 382-391.
Loh, L., Thomas, T., & Wang, Y. (2017). Sustainability Reporting and Firm Value: Evidence from
Singapore-listed Companies. Sustainability, 9(11), 2112.

A. Sharma, K. Kaushik, P. Awasthy and A. Gawande American Business Review 25(2)
__________________________________________________
437
Lyon, T. P., Delmas, M. A., Maxwell, J. W., Bansal, P., Chiroleu-Assouline, M., Crifo, P., ... & Wijen, F.
(2018). CSR Needs CPR: Corporate Sustainability and Politics. California Management Review,
60(4), 5-24.
Mahmood, M. & Orazalin, N. (2017). Green Governance and Sustainability Reporting in Kazakhstan's
Oil, Gas, and Mining Sector: Evidence from a Former USSR Emerging Economy. Journal of
Cleaner Production, 164, 389-397.
Maya-Jariego, I. & Holgado, D. (2015). Network Analysis for Social and Community Interventions.
Psychosocial Intervention, 24(3), 121-124.
Minutiello, V. & Tettamanzi, P. (2021). The Quality of Nonfinancial Voluntary Disclosure: A Systematic
Literature Network Analysis on Sustainability Reporting and Integrated Reporting. Corporate
Social Responsibility and Environmental Management.
Morhardt, J. E., Baird, S., & Freeman, K. (2002). Scoring Corporate Environmental and Sustainability
Reports Using GRI 2000, ISO 14031 and Other Criteria. Corporate Social Responsibility and
Environmental Management, 9(4), 215-233.
Morhardt, J. E. (2010). Corporate Social Responsibility and Sustainability Reporting on the Internet.
Business Strategy and the Environment, 19(7), 436-452.
OCED (2001), Policies to Enhance Sustainable Development. Meeting of the OCED Council at Minister
Level 2001, retrieved from: https://www.oecd.org/greengrowth/1869800.pdf.
Perkiss, S., Anastasiadis, S., Bayerlein, L., Dean, B., Jun, H., Acosta, P., ... & Gibbons, B. (2020).
Advancing Sustainability Education in Business Studies Through Digital Service Learning.
American Business Review, 23(2), 283-299.
Prashar, A. (2021). Moderating Effects on Sustainability Reporting and Firm Performance
Relationships: A Meta-Analytical Review. International Journal of Productivity and Performance
Management.
Purvis, B., Mao, Y., & Robinson, D. (2019). Three Pillars of Sustainability: In Search of Conceptual
Origins. Sustainability Science, 14(3), 681-695.
Raquiba, H. & Ishak, Z. (2020). Sustainability Reporting Practices in the Energy Sector of Bangladesh.
International Journal of Energy Economics and Policy, 10(1), 508.
Rasmussen, L. V., Bierbaum, R., Oldekop, J. A., & Agrawal, A. (2017). Bridging the Practitioner-
Researcher Divide: Indicators to Track Environmental, Economic, and Sociocultural
Sustainability of Agricultural Commodity Production. Global Environmental Change, 42, 33-46.
Roberts, M. (2021, November 1). The 'S' in ESG and What It Truly Means for Corporate Sustainability.
Business Think.
Sachs, J., Kroll, C., Lafortune, G., Fuller, G., & Woelm, F. (2021). The Decade of Action for the Sustainable
Development Goals: Sustainable Development Report 2021. Published online at sdgindex.org,
Cambridge. Retrieved from: https://unstats.un.org/sdgs/report/2020/.
Schreck, P. & Raithel, S. (2018). Corporate Social Performance, Firm Size, and Organizational Visibility:
Distinct and Joint Effects on Voluntary Sustainability Reporting. Business & Society, 57(4), 742-
778.
Skouloudis, A. & Evangelinos, K. I. (2009). Sustainability Reporting in Greece: Are We There Yet?
Environmental Quality Management, 19(1), 43-60.
Subbaraman, N., (2022), Carbon-Dioxide Level in Atmosphere Hits Historical High. The Wall Street
Journal. https://www.wsj.com/articles/carbon-dioxide-level-in-atmosphere-hits-historical-high-
11651777260?mod=Searchresults_pos7&page=1.
Székely, N. & Vom Brocke, J. (2017). What Can We Learn from Corporate Sustainability Reporting?
Deriving Propositions for Research and Practice from Over 9,500 Corporate Sustainability
Reports Published Between 1999 and 2015 Using Topic Modelling Technique. PloS One, 12(4),
e0174807.

A. Sharma, K. Kaushik, P. Awasthy and A. Gawande American Business Review 25(2)
__________________________________________________
438
Turney, P. D. (2001, September). Mining the Web for Synonyms: PMI-IR Versus LSA on TOEFL. In
European Conference on Machine Learning (pp. 491-502). Springer, Berlin, Heidelberg.
UNDP Annual Report (2021), United Nations Development Program Annual Report 2021, retrieved from:
https://www.undp.org/publications/undp-annual-report-2021.
Vormedal, I. & Ruud, A. (2009). Sustainability Reporting in Norway–An Assessment of Performance in
the Context of Legal Demands and Socio-Political Drivers. Business Strategy and the
Environment, 18(4), 207-222.
Yadava, R. N. & Sinha, B. (2016). Scoring Sustainability Reports Using GRI 2011 Guidelines for Assessing
Environmental, Economic, and Social Dimensions of Leading Public and Private Indian
Companies. Journal of Business Ethics, 138(3), 549-558.
Zhang, L., Zhao, S., Cui, L., & Wu, L. (2020). Exploring Green Innovation Practices: Content Analysis of
the Fortune Global 500 Companies. SAGE Open, 10(1), 1-13.
