
THE COOK COUNTY
PROPERTY ASSESSMENT PROCESS
A Primer on Assessment, Classification,
Equalization and Property Tax Exemptions
April 5, 2010

ACKNOWLEDGEMENTS
The Civic Federation would like to thank the following individuals at the Cook County
Assessor’s Office for providing data and answering our questions about property assessment:
Mike Stone, Chief Deputy Assessor, John Horbas, Director of Research, and Sherri Farris,
Senior Policy Analyst.
We are deeply grateful for the substantial legal contributions of Mark Davis, O'Keefe, Lyons &
Hynes, LLC; and for review by Whitney Carlisle, McCracken, Walsh & de laVan, and Timothy
Moran, Schmidt, Salzman and Moran, Ltd.
Copyright © 2010
The Civic Federation
Chicago, Illinois

1
TABLE OF CONTENTS
EXECUTIVE SUMMARY ......................................................................................................................................... 2
OVERVIEW ................................................................................................................................................................ 3
PROPERTY ASSESSMENT ...................................................................................................................................... 3
COOK COUNTY ASSESSMENT DISTRICTS ................................................................................................................... 3
ASSESSMENT METHODS ............................................................................................................................................ 6
CLASSIFICATION ........................................................................................................................................................ 9
ASSESSED VALUE .................................................................................................................................................... 12
CALCULATION OF TAXABLE VALUE .............................................................................................................. 13
EQUALIZATION ........................................................................................................................................................ 13
PROPERTY TAX EXEMPTIONS .................................................................................................................................. 18
Homestead Exemptions ...................................................................................................................................... 18
Charitable, Religious, Educational & Governmental Exemptions ..................................................................... 25
Other Property Tax Assistance Measures .......................................................................................................... 26
TAXABLE VALUE ..................................................................................................................................................... 28
ESTIMATED FULL VALUE OF REAL ESTATE ............................................................................................................. 29
APPENDIX A: NUMBER OF PARCELS BY CLASS 2000-2008 ........................................................................ 30
APPENDIX B: FINAL ASSESSED VALUE 2000-2008 ........................................................................................ 32
APPENDIX C: COOK COUNTY ASSESSED VALUES BY CLASS .................................................................. 33
APPENDIX D: COOK COUNTY MEDIAN LEVELS OF ASSESSMENT ........................................................ 34
APPENDIX E: HOMESTEAD EXEMPTIONS ..................................................................................................... 39
APPENDIX F: HOMESTEAD EXEMPTIONS VS. TAXABLE EAV ................................................................. 41

2
EXECUTIVE SUMMARY
The purpose of this report is to describe how the taxable value of real estate is established in Cook
County, Illinois. The report divides the process into two major parts: the determination of assessed value
and the calculation of taxable value.
Assessed Value Highlights:
Assessment Districts:
Cook County is divided into three districts for the purpose of property
assessment, each of which is assessed every three years. Approximately 47% of the county’s 1.8
million parcels are located within the boundaries of the City of Chicago, 24% of parcels are in the
North triad assessment district and 29% are in the South triad assessment district. Approximately
47% of the assessed value of Cook County property is in the City of Chicago, 33% of value is in the
North triad and 20% is in the South triad.
Assessment Methods:
The primary assessment method used by the Cook County Assessor for the
county’s 1.5 million residential (Class 2) parcels is a comparison to sale prices of other residential
properties using a computer-assisted technique that accounts for factors such as location, square
footage, and construction type. An evaluation of income or construction cost is sometimes used for
other types of property.
Classification:
Cook County is the only county in Illinois that sets different assessment levels for
different types of property. Beginning with assessment year 2009 (for taxes payable 2010), the
assessment level for most residential, vacant, and business incentive properties will be 10% of full
market value, while the level for not-for-profit, commercial, and industrial properties will be 25% of
full market value.
Assessed Value:
The total assessed value of property in Cook County grew 79.6% between 1999 and
2008, from $40.3 billion to $72.5 billion.
Taxable Value Highlights:
Equalization:
Equalization is the application of a factor, or multiplier, to all assessed values such that
the total equalized assessed value of the county equals 33 1/3% of the fair market value. The final
2008 equalization factor for Cook County was 2.9786. Median levels of assessment calculated by the
Illinois Department of Revenue in order to compute the equalization factor fell from 29.5% in 1994 to
a low of 15.7% in 2006 for Class 5a commercial properties, and from 33.5% in 1994 to a low of
18.0% in 2007 for Class 5b industrial properties.
Homestead Exemptions:
Illinois statute currently authorizes ten homestead exemptions available to
different types of homeowners. The total value of homestead exemptions in Cook County has grown
substantially in recent years. In 1999, homestead exemptions removed 5.0% of gross equalized
assessed value (EAV) in Cook County from the final taxable value. In 2008, homestead exemptions
exempted 12.6% of gross EAV from taxation. This increase in the value of homestead exemptions is
due primarily to dramatic growth in the Senior Citizens Assessment Freeze Exemption and expansion
of the General Homestead Exemption through the introduction of the Alternative General Homestead
Exemption. The Senior Citizens Assessment Freeze Exemption had the highest rate of growth,
increasing by 979.6%, or $4.7 billion of EAV between 1999 and 2008.
Total Taxable Value:
Total taxable value of real estate in Cook County increased 104.3% between
1999 and 2008, rising from $85.4 billion to $188.8 billion.
Estimated Full Value:
The full market value of taxable real estate in Cook County is estimated at
$656.5 billion in 2007, the latest year for which data is available from the Illinois Department of
Revenue.

3
OVERVIEW
The purpose of this report is to describe how the taxable value of real estate is established in
Cook County, Illinois. The report divides the process into two major parts: the determination of
assessed value and the calculation of taxable value.
In this report, “assessment” refers to the determination of value for the purpose of taxation.
Assessed value is not the final value used to calculate property tax liability in the State of
Illinois. After the assessed value has been established by the Cook County Assessor and
finalized by the Board of Review,
1
two more steps must occur in order to determine the taxable
value of a parcel: equalization and application of any exemptions.
The first part of this report describes the property assessment process, including Cook County
assessment districts, assessment methods, the classification system, and the finalization of
assessed value. The second part of the report describes the calculation of taxable value,
including equalization and exemptions. It also includes data on the estimated full value of real
estate in Cook County.
PROPERTY ASSESSMENT
The following sections describe the process of determining the assessed value of real estate in
Cook County for the purpose of property taxation.
Cook County Assessment Districts
Cook County is divided into three districts for the purpose of property assessment. Each district
is reassessed every three years. All other counties in Illinois must reassess property every four
years.
2
Properties in the City of Chicago were reassessed in 2009. Properties in the north and
northwestern suburbs will be reassessed in 2010, and properties in the south and southwestern
suburbs will be reassessed in 2011. North Avenue serves as the dividing line between the North
and South suburban triads, such that all Cook County properties outside the City of Chicago and
north of North Avenue are in the North triad, and all other suburban Cook County properties are
in the South triad.
3
1
There are some property types that are assessed by the Illinois Department of Revenue rather than the Assessor, as
described beginning on page 5 of this report.
2
Counties are permitted to subdivide into four assessment districts, one of which is reassessed each year on a
rotation. 35 ILCS 200/9-215 and 9-225. All farmland must be reassessed every year. 35 ILCS 200/10-115
3
35 ILCS 200/9-220

4
Approximately 47% of the county’s 1.8 million parcels are located within the boundaries of the
City of Chicago, 24% of parcels are in the North triad assessment district and 29% are in the
South triad assessment district.
4
Approximately 47% of the assessed value of Cook County
property is in the City of Chicago, 33% of value is in the North triad and 20% is in the South
triad, as illustrated below.
City of
Chicago
Triad
855,140
46.7%
North Triad
450,679
24.6%
South Triad
526,799
28.7%
Number of Parcels in Cook County by
Assessment Triad: Tax Year 2008
Source: Cook County Assessor, Final Abstract of Assessment 2008
City of
Chicago
Triad
$34.0
46.9%
North Triad
$23.7
32.7%
South Triad
$14.8
20.4%
Assessed Value of Parcels in Cook County by
Assessment Triad: Tax Year 2008
(in $ billions)
Source:Cook County Assessor, Final Abstract of Assessment 2008
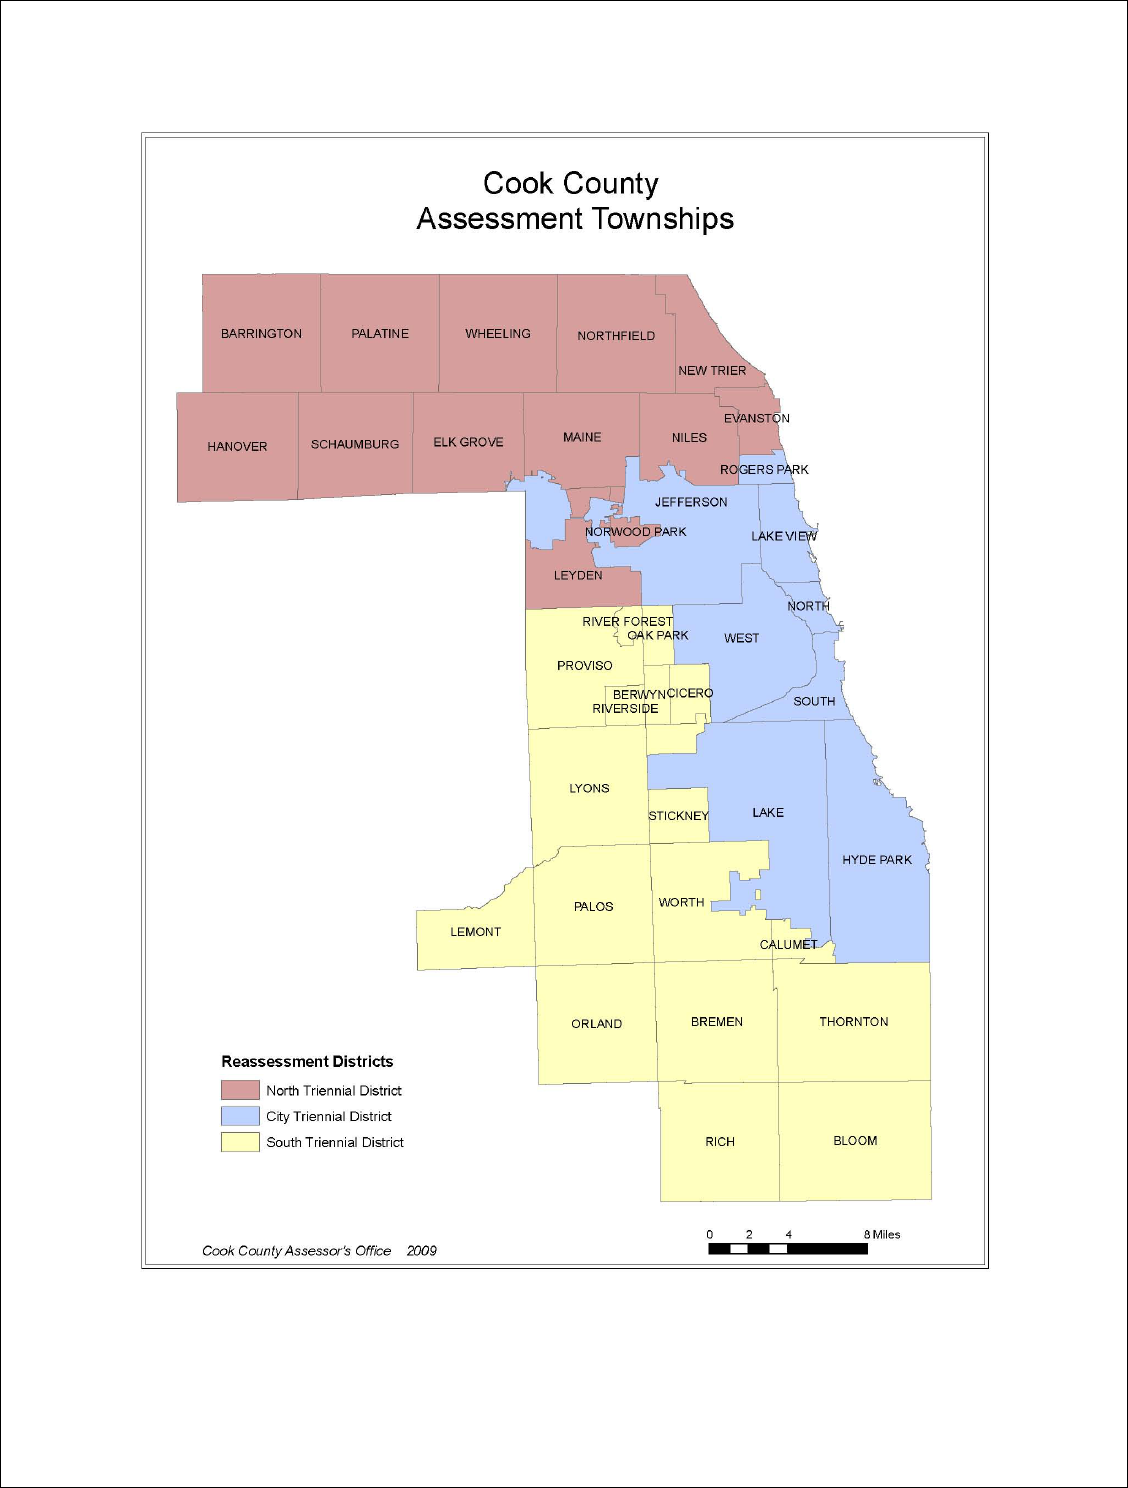
Each triad is subdivided into townships for the purpose of assessment. The townships are listed
below and illustrated in the map on the following page. There are a total of 38 assessment
townships in Cook County: 13 in the North, 17 in the South, and 8 in the City.
5
Triad North South Chicago
Reassessment
Years 2001, 2004, 2007, 2010 2002, 2005, 2008, 2011 2003, 2006, 2009, 2012
Townships
Barrington Berwyn Hyde Park
Elk Grove Bloom Jefferson
Evanston Bremen Lake
Hanover Calumet Lake View
Leyden Cicero North
Maine Lemont Rogers Park
New Trier Lyons South
Niles Oak Park West
Northfield Orland
Norwood Park Palos
Palatine Proviso
Schaumburg Rich
Wheeling River Forest
Riverside
Stickney
Thornton
Worth
Cook CountyTownships by Triad Assessment District
4
Cook County Assessor, Final Abstract of Assessment 2008.
5
Assessment districts, townships, and triennial reassessment years are codified in Cook County Code of Ordinances
Chapter 74 Article II Sections 74-31 and 74-32.
5
All assessment is performed by the Cook County Assessor’s Office, with the exception of the
following types of properties which are assessed by the Illinois Department of Revenue:
pollution control facilities, low sulfur dioxide coal fueled devices, railroad operating property,

6
and regional water treatment facilities.
6
The Department determines the assessed value of these
properties and notifies the Cook County Clerk, who includes them in the tax base.
In most Illinois counties, elected township or multi-township assessors are responsible for
township-level assessments, which are then submitted to a chief county assessment officer, an
appointed supervisor of assessments.
7
In Cook County, however, the elected Cook County
Assessor is responsible for all assessments except those performed by the Illinois Department of
Revenue as described above.
8
A state statute enacted in 1898 created a five-member Board of
Assessors to assess all property in Cook County, and additional legislation in 1932 delegated
assessment responsibility to a single elected assessor.
9
The legislation provided for the retention
of elected township assessors in suburban Cook County as deputy county assessors under the
supervision of the county assessor,
10
and their function is primarily to assist taxpayers in
interpreting and appealing their assessments. Townships within the City of Chicago are simply
geographical boundaries for the purpose of assessment and have no further function.
Assessment Methods
Illinois state statute requires assessment officials to determine the “fair cash value” of each
parcel. This is defined as “the amount for which a property can be sold in the due course of
business and trade, not under duress, between a willing buyer and a willing seller.”
11
It is
important to note that this “fair cash” or “market” value is not necessarily the actual sales price
of a given property, but rather an estimation of what it would sell for on a given valuation date
(January 1 in Cook County). There are states such as California that set the assessed value of a
parcel at its actual sales price and then apply an annual factor to adjust the assessed value over
time. In states such as Illinois that use the market value basis for assessment, adjusting the
assessment of an individual parcel based on its sales price (“sales chasing”) is prohibited when
other properties are not valued the same way.
12
In Illinois and most other states, the “fair cash value” is also expected to represent the
“unencumbered fee simple interest” in the property, meaning the sum total of all ownership
rights to the property regardless of other parties’ less-than-ownership interests such as
leaseholds. For example, if a property is subject to a long-term, below-market rate lease, the
6
35 ILCS 200/11-5 through 11-170.
7
Illinois Department of Revenue, “The Illinois Property Tax System” (PTAX-1004) November 2002, p. 10.
8
St. Clair County also has an elected countywide Assessor. Ibid.
9
Cook County Assessor’s Website, “History of Cook County Assessor’s Office.”
http://www.cookcountyassessor.com/info/history.asp
; “New Conference of Study Choice of Tax Official,” Chicago
Daily Tribune, January 27, 1932.
10
Percy Wood, “Senate Passes Assessing Bill; House Friendly,” Chicago Daily Tribune, January 7, 1932; Cook
County Assessor’s Website, “Township Assessor,”
http://www.cookcountyassessor.com/data/twnships/assessors01.asp
11
35 ILCS 200/1-50; see, also, Cook County Real Property Assessment Classification Ordinance, Cook County
Code of Ordinances § 74-62(b) (“market value” defined in terms of a “fair voluntary sale”).
12
Walsh v. Property Tax Appeal Board, 181 Ill. 2d 228 (1998). In the Walsh case, the Illinois Supreme Court ruled
that the uniformity clause of the Illinois Constitution was violated when some properties in Tazewell County were
assessed based on their recent sales prices while other properties were assessed using the mass appraisal method.

7
diminution of value to the actual owner caused by the lease should be ignored in the assessment
process.
13
A limited exception to the rule that the unencumbered fee simple interest in real estate is the
object of assessment and taxation, as well as an exception to the rule that less-than-fee interests
are not separately taxed, is found in the assessment of leaseholds in certain otherwise exempt
lands. Normally, the leasing of an otherwise exempt property for commercial or other non-
exempt purposes will simply defeat the exempt status, and the fee interest in the property will
become subject to assessment and tax in the normal manner. However, in some cases, such as
property owned by the State of Illinois, or municipalities within their corporate boundaries, the
exemption of the underlying fee is absolute and cannot be affected by a lease.
14
In such cases, the
leasehold interest itself becomes subject to assessment and is taxable to the lessee.
15
Probably
the largest concentrations of taxable leaseholds occur in the major metropolitan airports, which
are municipally owned and lease space to airlines, fixed base operators, and various
concessionaires.
The valuation of such taxable leasehold interests is a somewhat complex subject, largely beyond
the scope of this primer. Generally speaking, the object is to estimate the full “market value” of
the leasehold interest over the remaining life of the lease. This often differs from the valuation
that would be ascribed to the lessee’s interest for other legal purposes, such as condemnation,
and in the case of long-term leases it may closely approximate the value of the entire fee simple
interest.
16
Market value is conceptual and can be represented but not directly observed.
17
Sales prices of
similar properties provide an objective basis for estimating a parcel’s market value, and the sales
comparison approach to valuation is effective when there are sufficient sales to provide a reliable
basis for comparison.
18
Data on the characteristics of parcels, actual prices of parcels that sold,
and other factors affecting sale prices are entered into computer models that can estimate market
values of all parcels. The Cook County Assessor uses such a computer-assisted technique and
three to five years of sales data to value residential properties.
19
There were more than 1.5
million residential properties in Cook County in tax year 2008.
20
13
See Springfield Marine Bank v. Property Tax Appeal Board, 44 Ill.2d 428, 256 N.E.2d 334, 336 (1970)
14
See 35 ILCS 200/15-55 (state property), and 15-60(c) (municipal property).
15
35 ILCS 200/9-195.
16
The modern theory of leasehold valuation for assessment purposes in Illinois is derived from the decision in
People ex rel. Korzen v. American Airlines, 39 Ill.2d 11, 233 N.E.2d 568 (1967), and its progeny. Essentially, the
“American Airlines” methodology requires an estimate of the entire rental value of the leasehold (land and
improvements) in the marketplace to be discounted to a lump sum present value over the remaining term of the
lease. This estimated “market rent” may differ substantially from rent being paid under the actual lease contract.
17
International Association of Assessing Officers, Standard on Ratio Studies, (Kansas City, 2007), 7.
18
International Association of Assessing Officers, Standard on Mass Appraisal of Real Property, (Kansas City,
2002 revised 2008), 8.
19
http://www.cookcountyassessor.com/propertyvaluation.aspx
20
Cook County Assessor, Final Abstract of 2008 Assessment. In this report “residential” means Class 2 properties,
which include single family homes, condominiums, cooperatives, and apartment buildings of up to six units. Larger
apartment buildings (Class 3) are not included.

8
According to the International Association of Assessing Officials, the sales comparison approach
is the most useful mass appraisal approach for valuing single-family residences and
condominiums.
21
Another approach that is useful for revenue-producing properties such as
commercial, industrial, or multifamily residences is the income approach. The income approach
considers data on rental income and expenses, rate of return on investment, vacancy rates, and
other factors unique to income-producing properties.
22
The Cook County Assessor’s Office uses
the income approach for commercial and industrial properties, but also takes sales data into
account. The Assessor notes that values derived from the income approach are often lower than
recorded sales prices because sales prices reflect expectations of higher future income and are
not adjusted for non-realty components of a sale.
23
Therefore, the Assessor’s Office adjusts sales
prices for these factors, then compares the adjusted sales prices to the income market estimates
and reconciles them to produce a property value estimate.
24
Finally, the cost approach to valuation estimates the construction cost of a building minus its
depreciation, and is best suited to newer structures using standard materials and labor.
25
The
Cook County Assessor uses the cost approach for unique manufacturing properties that may not
have reliable income or comparable sales data.
26
Although the income and cost approaches to valuation are useful for certain types of property,
Illinois case law expresses a preference for the sales comparison approach when evidence of
such sales is available. The courts have overturned assessments in some notable cases due to the
failure of assessing officials or valuation experts to use the sales approach because they believed
that other approaches were superior.
27
21
International Association of Assessing Officers, Standard on Mass Appraisal of Real Property, (Kansas City,
2002 revised 2008), 9.
22
International Association of Assessing Officers, Standard on Mass Appraisal of Real Property, (Kansas City,
2002 revised 2008), 9.
23
http://www.cookcountyassessor.com/propertyvaluation.aspx
24
http://www.cookcountyassessor.com/propertyvaluation.aspx
25
International Association of Assessing Officers, Standard on Mass Appraisal of Real Property, (Kansas City,
2002 revised 2008), 8.
26
http://www.cookcountyassessor.com/propertyvaluation.aspx
27
See for example Cook County Board of Review v. Property Tax Appeal Board, 384 Ill.App.3d 472, 894 N.E.2d
400 (1
st
Dist. 2008) and Chrysler Corporation v. Property Tax Appeal Board, 69 Ill.App.3d 207, 387 N.E.2d 351 (2
nd
Dist. 1979)

9
The following table ranks the most useful valuation approaches for different types of property,
according to the International Association of Assessing Officers (“1” being most useful).
Type of Property
Sales
Comparison
Approach
Income
Approach
Cost
Approach
Single-Family Residential
132
Multi-family Residential
1,2 1,2 3
Commercial
213
Industrial
31,21,2
Non-Agricultural Land
12--
Agricultural*
21--
Special-Purpose**
2,3 2,3 1
Rank of Typical Usefulness of the Three Approaches to Value in the
Mass Appraisal of Major Types of Property
*Includes farm, ranch, and forest properties.
**Includes institutional, governmental, resort, and recreation properties.
Source: International Association of Assessing Officers, Standard on Mass Appraisal of Real
Property, (Kansas City, 2002 revised 2008), 9.
Farm home sites are valued as residential properties and are subject to equalization as described
on page 13. However, there are special rules for valuing farmland in Cook County. The Illinois
Constitution states that farmland cannot be assessed at a higher level of assessment than a single
family home.
28
State statute specifies that in Cook County the equalized assessed value per acre
of farmland must be the lesser of two values: 1) the value at the residential assessment level
based on a full market value if the farm were to be sold in a fair, voluntary sale for continued use
as a farm; or 2) 90% of the 1983 average equalized assessed value per acre certified by the
Illinois Department of Revenue.
29
The value of farmland is not subject to equalization.
30
Farmland represented only 0.07% of parcels and 0.01% of assessed value in Cook County for
2008.
31
Classification
Illinois state statute requires that all real property be valued for the purpose of property taxation
at 33 1/3% of its fair cash value in every county except Cook.
32
Cook County is the only county
in the State of Illinois that sets different property tax assessment levels for different types of
property. This differential assessment is called classification and is expressly permitted for
counties with a population greater than 200,000 by the Illinois Constitution Article IX Section 4.
The counties of Cook, DuPage, Kane, Lake, McHenry, Madison, St. Clair, Will, and Winnebago
all currently meet this population threshold but only Cook County has chosen to adopt
classification.
33
The state constitution also requires that the level of assessment or rate of tax for
28
Illinois Constitution Article IX Section 4.
29
35 ILCS 200/10-130
30
35 ILCS 200/10-135
31
Cook County Assessor, Final Abstract of 2008 Assessment
32
Illinois Property Tax Code, 35 ILCS 200/9-145.
33
Population data is the U.S. Census Bureau estimate as of July 1, 2008. See
http://www.census.gov/popest/counties/
.

10
the highest class of property be no more than 2.5 times the level of assessment or rate of tax for
the lowest class of property.
34
The authorization for classification in the 1970 Illinois Constitution first had the effect of
ratifying the existing de facto system of classification maintained by the Cook County Assessor,
which continued unchanged for another four years.
35
Effective January 1, 1974, the General
Assembly provided that future classifications had to be enacted by the County Board in order to
be valid and Cook County passed its first classification ordinance to comply with this law.
36
That ordinance established the following classes and assessment levels (i.e., percentages of the
full value of the property):
Class Description
A
ssessment Level
Class 1 Vacant or Farm Land
22%
Class 2
Residential (single family 6
units or less)
22%
Class 3 Apartments (7 units or more)
33%
Class 4 Not-for-Profit
30%
Class 5
All Other (Commercial,
Industrial)
40%
Cook County Property Classification System: 1974
The theoretical justification for use-based classification of property is usually stated in terms of
the incidence of the resulting tax burden, with the owners of higher-assessment-level properties
being assumed to have the ability to shift the incidence of the tax burden to others. Examples of
such parties are commercial space users who pass the tax on to consumers; manufacturers who
include taxes as a cost of production; and multi-unit apartment owners who recover the tax cost
from their tenants. By contrast, the homeowner absorbs the whole tax cost alone and cannot pass
it on to someone else.
However, the primary justification for classification operative at the time of the 1970 Illinois
Constitutional Convention was arguably the preservation of the de facto classification system
that had evolved in Cook County over many years dating back to at least the 1920s.
37
The
uniformity provisions of the Illinois Constitutions of 1848 and 1870 had been widely interpreted
as prohibiting any form of classified property tax.
38
The likelihood that Cook County’s de facto
classification system would be subject to increasing attack in the courts, and the specter that it
might be struck down, fueled much debate at the 1969-1970 Constitutional Convention.
39
The
34
Illinois Constitution 1970, Article IX, Section 4(b).
35
People ex rel. Kutner v. Cullerton, 58 Ill.2d 270-72, 319 N.E.2d 55, 57-59 (1974).
36
P.A. 78-700, eff. Jan. 1, 1974, now codified at 35 ILCS 200/9-150.
37
See Aldrich v. Harding, 340 Ill.354, 358, 172 N.E. 772, 774 (1930), cited in Richard Wattling, “Taxation of Real
Property in Cook County—The Railroad Cases and the Future of De Facto Classification,” John Marshall Journal
of Practice and Procedure 6 (1968), 212, 213 n. 6.
38
George D. Braden and Rubin G. Cohn, The Illinois Constitution, An Annotated and Comparative Analysis
(Champaign, IL: 1969), 415-416.
39
Joyce D. Fishbane and Glenn W. Fisher, Politics of the Purse: Revenue and Finance in the Sixth Illinois
Constitutional Convention (Champaign, IL: 1974), 70-74; and 7 Record of Proceedings, Sixth Illinois Constitutional
Convention, (1969-1970), 2108-2128.

11
convention delegates generally understood that no new constitution would have passed in 1970 if
it did not “in some way, maybe with some restrictions, make legal the de facto classification in
Cook County.”
40
There are also “incentive” classes, which provide reduced assessment levels for certain periods
of time to encourage specific use or redevelopment. For incentive classifications, the justification
is cast in terms of the social utility of the goal for which the incentive is granted: e.g., industrial
or commercial development of an economically depressed area; or the availability of housing for
economically disadvantaged citizens.
The ultimate goal of classification, which is to produce different effective tax rates for different
types or uses of property, could also be achieved by assigning different tax rates rather than
different assessment classes. The Illinois Constitution of 1970 expressly permits classification by
rate or by class.
41
However, Cook County elected to legalize assessment classification rather than
tax rate classification.
The Cook County Board has changed levels of assessment many times since 1974 and has added
additional classes of property. In every case, the change has been a reduction in the level of
assessment. The most recent major change to the classification ordinance was made in
September 2008 when the Board voted to reduce assessment levels for most classes to either
10% or 25%, effective for tax year 2009.
42
This change was arguably another attempt to bring
the law into alignment with the reality of de facto classification levels.
40
3 Record of Proceedings, Sixth Illinois Constitutional Convention, (1969-1970), 1898; and Hoffman v. Clark, 69
Ill.2d 402, 413-14, 372 N.E.2d 74 (1977).
41
1970 Illinois Constitution, Article IX Section 4: “The level of assessment or rate of tax of the highest class in a
county shall not exceed two and one-half times the level of assessment or rate of tax of the lowest class in that
county.”
42
Cook County ordinance 08-O-51.

12
Class Description New Assessment Level Previous Assessment Level
Class 1 Vacant or Farm Land 22%
Class 2 Residential (single family 6 units or fewer) 16%
Class 3 Apartments (7 units or more)
16% in 2009, 13% in 2010, 10%
in 2011 and subsequent
24% in 2006, 22% in 2007, 20%
in 2008 and subsequent
Class 4 Not-for-Profit 30%
Class 5a Commercial 38%
Class 5b Industrial 36%
Incentive Classes (in effect for limited durations)
Class 6b Industrial Development or Redevelopment
10% for first ten years and any
subsequent renewal periods; if
not renewed, 15% in year 11
and 20% in year 12
16% for first ten years and any
subsequent renewal periods; if
not renewed, 23% in year 11
and 30% in year 12
Class C Brownfields Clean Up and Revelopment
Class 7a
Commercial Development or Redevelopment
With Costs Under $2 Million
Class 7b
Commercial Development or Redevelopment
With Costs Over $2 Million
Class 8
Commercial and Industrial Development in
Areas of Severe Economic Stagnation
10% for first ten years and any
subsequent renewal periods; if
not renewed, 15% in year 11
and 20% in year 12
16% for first ten years and any
subsequent renewal periods; if
not renewed, 23% in year 11
and 30% in year 12
Class 9
Low-Income Multifamily Apartments (7 units or
more)
10% for first ten years;
renewable upon application for
additional ten-year periods
16% for first ten years;
renewable upon application for
additional ten-year periods
Class S
Section 8 Multifamily Apartments (7 units or
more)
10% for the term of the Section
8 contract renewal and for any
additional terms of renewal
16% for the term of the Section
8 contract renewal under the
mark up to market option and
for any additional terms of
renewal
Class L
Landmark Preservation: Commercial,
Industrial, Non-Profit, and Apartment
renewable properties: 10% for
first ten years and subsequent
ten-year renewal periods; if not
renewed, 15% in year 11 and
20% in year 12; commercial
properties: 10% for first ten
years, 15% in year 11 and 20%
in year 12
renewable properties: 16% for
first ten years and subsequent
ten-year renewal periods; if not
renewed, 23% in year 11 and
30% in year 12; commercial
properties: 16% for first ten
years, 23% in year 11 and 30%
in year 12
Cook County Property Classification System
Changes Per 10 & 25 Ordinance 08-O-51 passed September 2008
Note: Class descriptions are summaries. For complete descriptions see Cook County Code of Ordinances Chapter 74 Article II Section 74-63.
10%
25%
10% for first ten years, 15% in
year 11, 20% in year 12
16% for first ten years, 23% in
year 11, 30% in year 12
Assessed Value
Once the Cook County Assessor has estimated the full market value of a property, the class-
specific percentage “level of assessment” is applied to that value to produce the assessed value
(AV). This system whereby assessed value is a percentage of the full market value estimated by
the assessor is sometimes called “fractional assessment”.
43
When the Cook County Assessor’s initial work is completed for a particular township, notices of
assessed value are mailed to the owners of property in that township. Notices are mailed
throughout the year, typically from March through December as township assessments are
43
John L. Mikesell, Fiscal Administration: Analysis and Applications for the Public Sector (Belmont, CA:
Wadsworth/Thompson, 2003), 411-417.

13
completed.
44
The notices advise owners that they may file a complaint within 30 days at the
Assessor’s Office to obtain an internal review of the proposed assessment. The taxpayer may
also appeal the valuation to the Cook County Board of Review, a body charged with the power to
review assessments prior to the determination of final taxable value.
45
The Board of Review typically completes its review process in June and submits its final
valuations to the Illinois Department of Revenue for equalization, which is discussed in the
section below. This is roughly 18 months after the January 1 valuation date of the property.
The following table shows the ten-year change in assessed values for the City of Chicago,
suburban Cook County, and all of Cook County. The City experienced the greatest increase in
assessed values, rising 99.0% from $17.1 billion in 1999 to $34.0 billion in 2008. Total Cook
County assessed value reached $72.5 billion in 2008.
46
1999 2008 $ Change % Change
City of Chicago 17,084,235,762$ 33,995,117,837$ 16,910,882,075$ 99.0%
Suburban Cook County 23,257,055,928$ 38,471,480,450$ 15,214,424,522$ 65.4%
40,341,291,690$ 72,466,598,287$ 32,125,306,597$ 79.6%
Source: Cook County Assessor's Office, Final Assessment Abstracts
Total Cook County
Cook County Assessed Values
1999-2008
CALCULATION OF TAXABLE VALUE
After the assessed value of all properties has been established by the Assessor and finalized by
the Board of Review, two more steps must occur in order to determine the taxable value of a
parcel: equalization and application of any exemptions.
Equalization
Inter-county equalization (sometimes referred to as “state equalization”) is the application of a
factor, or multiplier, to all assessed values such that the aggregate total equalized assessed value
of the county equals 33 1/3% of fair market value. All counties, including Cook, are required to
undergo equalization to ensure that the total value is 33 1/3%. Counties other than Cook also
perform intra-county equalization in order to ensure that townships assessed by different
assessing officials are equalized.
47
Equalization is necessary for the fair implementation of certain state statutes. Assessed valuation
of property is a component in formulas for various education, transportation, and public
assistance grants to local jurisdictions so it is important that assessed values be made equivalent
statewide. State statutes that limit property tax rates and bonded indebtedness of local
44
See http://www.cookcountyassessor.com/appdeadlines/appealdeadlinesform.aspx for dates of notice mailings in
recent years.
45
For more detail on the appeals process see Civic Federation, “Cook County Property Tax Appeals: A Primer on
the Appeals Process with Comparative Data for 2000-2008,” November 17, 2009. http://www.civicfed.org/civic-
federation/publications/cook-county-property-tax-appeals-primer-appeals-process-comparative-da
46
See Appendix C for detailed trend data on Cook County assessed values by class.
47
35 ILCS 200/9-210.

14
governments are also related to assessed value, which must be equalized in order for the statutes
to apply equivalently across the state.
The State of Illinois Department of Revenue is responsible for calculating an equalization factor
for each county.
48
This calculation is made annually using a multi-year comparison of property
assessments and sales prices in each county called the assessment/sales ratio study. The
Department of Revenue uses sales data recorded on Real Estate Transfer Declarations, excluding
sales that are not “arms-length” transactions or are otherwise unrepresentative of market
values.
49
A sample of these sales is compared to the assessed values of the same parcels for the
year prior to the sale. Statistics including median ratio, coefficient of dispersion, and confidence
level are calculated and published in the Department’s annual assessment ratio tables.
50
For
Cook County, the Department calculates these statistics by township for property classes 1, 2, 3,
5a, and 5b when there are at least 25 valid sales in the class.
The Department of Revenue’s assessment/sales ratio studies have long indicated that various
classes of property are valued for assessment purposes at less than the ordinance level
percentages of their fair market value in Cook County. For example, the Department’s studies
show that the median assessment for Cook County residential properties is closer to 10% of full
market value than to the 16% ordinance level (see graph on page 15). Many Cook County
homeowners have noticed this for tax years prior to 2009, when their tax bills showed a fair
market value that is significantly less than what they know their home is worth. The systematic
and historic undervaluing of Cook County property has been widely recognized for many years
and was part of the impetus for Assessor Houlihan’s recent proposal to recalibrate the Cook
County ordinance levels down to 10% for residential and 25% for most other classes of property
(see table on page 12).
The findings of the Department of Revenue’s assessment/sales ratio studies for properties other
than Class 2 residential parcels are more controversial.
51
Controversy arises due to the relatively
small volume of sales for other classes of property because the smaller the sample size, the lesser
the statistical reliability.
52
The uniqueness of some commercial and industrial properties also
makes sales of them difficult to compare to sales of other properties. The Cook County Assessor
has urged the Department of Revenue to use appraisals to supplement the paucity of sales data
for such properties, and to edit sales data to account for sales of personal property and intangible
assets that are often included in the sales price of commercial real estate.
53
The International
Association of Assessing Officers also recognizes the use of appraisal ratios as a technique to
improve sample representativeness where there are few available sales, but it notes that in many
48
35 ILCS 200/17.
49
Illinois Department of Revenue, “PTAX 1007: Findings of the 1998 Assessment/Sales Ratio Study,” January
2003, 7.
50
See http://tax.illinois.gov/AboutIdor/TaxStats/index.htm for statistics and
http://tax.illinois.gov/LocalGovernment/table1-2-3statistics.pdf for an explanation of the statistics.
51
For more detail on this issue see Theodore M. Swain et al., “The Report of The Civic Federation Task Force on
Cook County Classification and Equalization” (Chicago: The Civic Federation, 1999), 8-10.
52
International Association of Assessing Officers, Standard on Ratio Studies, (Kansas City, 2007), 15.
53
Statement of James M. Houlihan, Cook County Assessor, Illinois Department of Revenue Hearing: 2008 State
Equalization Factor for Cook County, July 30, 2009.

15
respects sales ratios are superior to appraisals in terms of lower cost and greater objectivity, and
that appraisals, if possible, should be checked for accuracy against sales.
54
The following graph shows the Cook County median levels of assessment as computed in the
Department of Revenue’s assessment/sales ratio studies from 1994 to 2007, the most recent data
available. Class 2 residential levels fell from roughly 9.5% to 8.5% over this period, reaching
9.0% again in 2007. Class 5a commercial fell from 29.5% to a low of 15.7% in 2006. Class 5b
industrial fell from 33.5% to 17.9%.
55
0%
5%
10%
15%
20%
25%
30%
35%
40%
1994 1995 1996 1997 1998 1999 2000 2001 2002 2003 2004 2005 2006 2007
Total Cook County Median Levels of Assessment 1994-2007
Note: Median level is computed by comparing a sample of sales to the assessed values of the same parcels for the year prior to the sale.
Source: Illinois Department of Revenue, Table 1 Assessment Ratio Levels, http://www.revenue.state.il.us/AboutIdor/TaxStats/index.htm
1 Vacant
2 Residential
3 Apartment
5b Industrial
5a Commercial
54
Standard on Ratio Studies, §§ 3.2.3.1, 8.2 (IAAO 2007).
55
See Appendix D for more data on assessment/sales ratios by triad.

16
After conducting an assessment/sales ratio study for Cook County, the Department then
calculates the weighted median ratio, which is the countywide ratio of assessed value to full
market value estimated using the median ratios weighted by class. Each weighted median ratio
is also adjusted for any major assessment changes made by the Assessor or the Board of Review
since the original data was collected. The county equalization factor uses the average (mean) of
the adjusted weighted medians of the three years immediately preceding the assessment year and
divides it into 33.33% in order to determine the factor needed to bring the countywide three-year
average ratio to 33.33%.
56
For example, the assessment year 2008 final equalization factor was
calculated by averaging the weighted median levels of assessment for 2005, 2006, and 2007,
each adjusted to account for subsequent assessment changes. The three-year average was then
divided into 33.33% to yield an equalization factor of 2.9786 for tax year 2008, as shown below.
2005 2006 2007
3-Year
Average
Countywide Weighted Median
Level of Assessment 11.92% 10.82% 10.82% 11.19%
Cook County 2008 Final Equalization Factor Calculation
Statutory Level (33.33%) ÷ Prior 3-Year Average Median Level (11.19%) = 2.9786
Source: Illinois Department of Revenue 2008 final Cook County equalization factor press release
http://www.revenue.state.il.us/AboutIdor/PressReleases/PR-08-24-2009.pdf
The state equalization factor for most counties is close to 1.0 because counties other than Cook
do not classify property and they conduct intra-county equalization prior to state equalization.
The equalization factor for Cook County is significantly greater than one and continues to rise as
aggregate assessment levels fall farther below 33.33%.
56
http://tax.illinois.gov/LocalGovernment/table1-2-3statistics.pdf
17
Before publishing a final equalization factor each year, the Department of Revenue calculates a
tentative equalization factor and holds a public hearing on the tentative factor.
57
This tentative
factor is computed before the Board of Review releases its final assessments for a given
assessment year. For assessment year 2008, the Department released a tentative equalization
factor of 2.9058 on July 14, 2009. The final factor of 2.9786 was published on August 24, 2009.
The difference between the tentative and final factors is due to assessment reductions made by
the Board of Review.
58
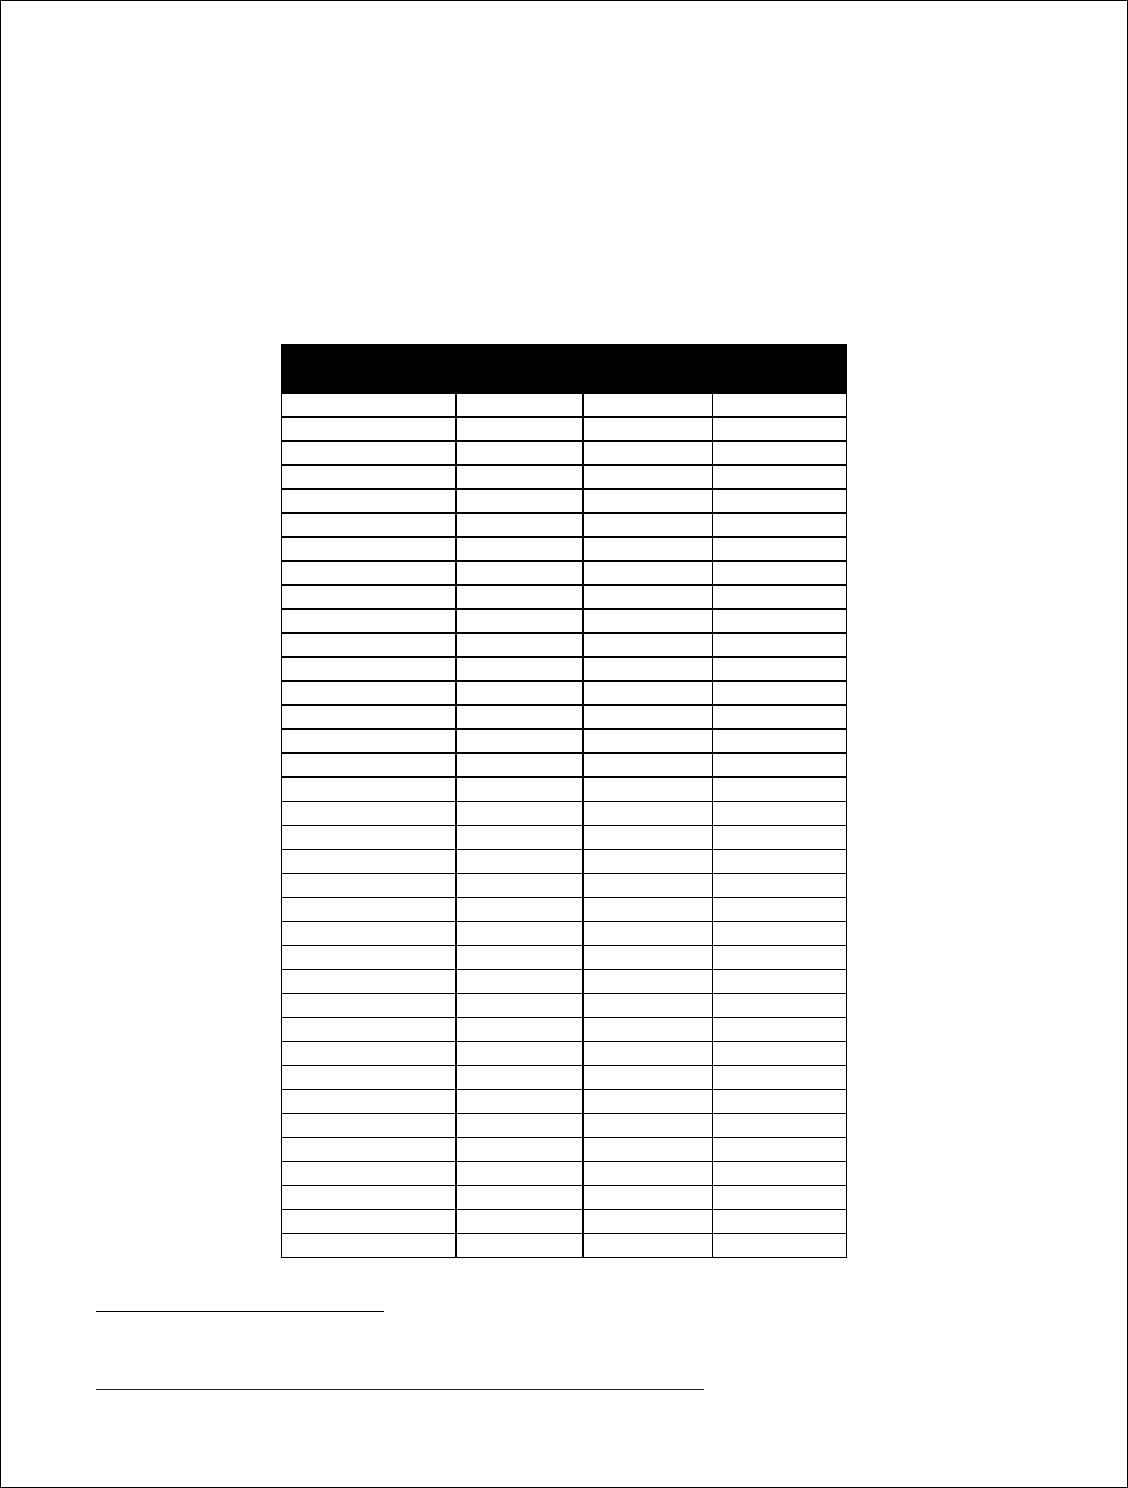
The following table shows the difference between the tentative and final
equalization factors from 1974 to 2008.
Tax Year Tentative Final Difference
1974 1.4453 1.4453 0.0000
1975 1.4271 1.4483 0.0212
1976 1.3824 1.4153 0.0329
1977 1.4028 1.4153 0.0125
1978 1.4807 1.4966 0.0159
1979 1.5917 1.6016 0.0099
1980 1.7296 1.7432 0.0136
1981 1.8364 1.8548 0.0184
1982 1.9288 1.9288 0.0000
1983 1.9122 1.9122 0.0000
1984 1.8445 1.8445 0.0000
1985 1.8085 1.8085 0.0000
1986 1.8293 1.8486 0.0193
1987 1.8809 1.8916 0.0107
1988 1.9266 1.9266 0.0000
1989 1.9133 1.9133 0.0000
1990 1.9946 1.9946 0.0000
1991 2.0348 2.0523 0.0175
1992 2.0897 2.0897 0.0000
1993 2.1407 2.1407 0.0000
1994 2.1135 2.1135 0.0000
1995 2.1243 2.1243 0.0000
1996 2.1517 2.1517 0.0000
1997 2.1489 2.1489 0.0000
1998 2.1799 2.1799 0.0000
1999 2.2505 2.2505 0.0000
2000 2.1813 2.2235 0.0422
2001 2.2612 2.3098 0.0486
2002 2.4364 2.4689 0.0325
2003 2.3858 2.4598 0.0740
2004 2.5023 2.5757 0.0734
2005 2.6771 2.732 0.0549
2006 2.6244 2.7076 0.0832
2007 2.7500 2.8439 0.0939
2008 2.9058 2.9786 0.0728
Cook County Tentative and Final Equalization Factors:
1974-2008
Source: Illinois Department of Revenue
57
35 ILCS 200/17-20
58
Illinois Department of Revenue 2008 final Cook County equalization factor press release,
http://www.revenue.state.il.us/AboutIdor/PressReleases/PR-08-24-2009.pdf

18
Once the Department of Revenue has certified the final Cook County equalization factor, the
Cook County Clerk applies the factor to the final assessed values determined by the Assessor and
modified by the Board of Review. The new value is called the equalized assessed value (EAV).
This value is the final taxable value of the property unless exemptions are applied, as discussed
in the next section. For example, a Cook County home with a tax year 2008 assessed value of
$32,000 would have an equalized assessed value of $95,315 ($32,000 x 2.9786 equalization
factor) before any exemptions were applied.
The equalization factor is not applied to farmland, coal production property, or wind energy
property.
59
Property Tax Exemptions
The Illinois Constitution specifically permits the General Assembly to grant homestead
exemptions and to completely exempt certain types of property from property taxation.
60
Homestead Exemptions
Illinois statute currently authorizes ten homestead exemptions available to different types of
homeowners. There is a general homestead exemption for all homeowners, as well as special
exemptions targeted at senior citizens, disabled persons, and veterans. Eight of the exemptions
exempt a portion of EAV from taxation, one exempts a portion of AV (Disabled Veterans’
Exemption), and one exempts a portion of cash (market) value (Homestead Improvements
Exemption). All homestead exemptions are designed to reduce the taxable value of
homeowners’ property.
Homestead exemptions are permitted only for a primary residence inhabited by the owner (not a
second home). Application for the exemptions must be made to the county assessor, with the
exception of the Disabled Veterans’ Exemption which is determined by the Illinois Department
of Veterans’ Affairs.
59
35 ILCS 200/10-135, 10-200, and 10-615.
60
Illinois Constitution 1970, Article IX, Section 6.

19
Four of the ten exemptions exempt a flat amount of EAV, and the General Homestead
Exemption effectively exempts a flat amount of EAV because virtually all applicants are eligible
for the maximum amount. The other five exemptions exempt varying amounts of EAV, AV, or
cash value. Four of the ten homestead exemptions were enacted in 2007 and all of the other
exemptions have been modified over the years. The table below lists the exemptions, some of
which are described in greater detail following the table.
61
Statute Name Eligibility Tax Year 2008 Amount
Year
Created
35 ILCS
20/15-165
Disabled Veterans'
Exemption
For disabled veteran homeowners and
their spouses
Property up to an assessed value of $70,000 is
exempted from taxation 1970
35 ILCS
200/15-167
Returning Veterans'
Homestead
Exemption
For veteran homeowners upon the year
of their return from an armed conflict $5,000 of EAV 2007
35 ILCS
200/15-168
Disabled Persons'
Homestead
Exemption
For disabled homeowners unable to
engage in substantial gainful activity by
reason of physical or mental impairment $2,000 of EAV 2007
35 ILCS
200/15-169
Disabled Veterans'
Standard Homestead
Exemption
For disabled veteran homeowners and
their spouses
$2,500 of EAV for 50% to 75% disability, $5,000 of
EAV for at least 75% disability 2007
35 ILCS
200/15-170
Senior Citizens
Homestead
Exemption For homeowners at least 65 years old $4,000 of EAV 1970
35 ILCS
200/15-172
Senior Citizens
Assessment Freeze
Homestead
Exemption
For homeowners at least 65 years old
and with household income under
$55,000 (in tax year 2008 and after),
freezes EAV at time of first application
Varies, equal to difference between current EAV
and base year EAV at time of first application 1994
35 ILCS
200/15-175
General Homestead
Exemption
For all homeowners outside Cook
County on their primary residence
Difference between 1977 EAV and current EAV up
to a maximum of $5,500 of EAV for tax year 2008,
and $6,000 of EAV for tax year 2009 and after 1978
35 ILCS
200/15-176
Alternative General
Homestead
Exemption
For all Cook County homeowners on
their primary residence
Varies, equal to difference between base year EAV
at time of first application and 7% per year growth
in EAV. Depends on assessment triad. 2008
maximum is $26,000 for North Triad, $33,000 of
EAV for South Triad, $20,000 for City Triad and
minimum $5,500 of EAV for all Triads. 2004
35 ILCS
200/15-177
Long-time Occupant
Homestead
Exemption
F
or
C
oo
k
C
oun
t
y
h
omeowners on
th
e
i
r
primary residence. Must have total
household income of $100,000 or less
and have lived in the home for 10
consecutive years, or 5 years if received
government assistance to acquire the
property
Varies, equal to difference between base year EAV
at time of first application and 7% per year growth
in EAV if income is $75,000 or less; 10% per year
EAV increase limit if income is from $75,001 to
$100,000. 2007
35 ILCS
200/15-180
Homestead
Improvements
For all homeowners on their primary
residence
Up to $75,000 fair cash value of improvements
made to homestead property for up to four years 1975
Homestead Exemptions in Illinois Statutes
Prior to the creation of the Alternative General Homestead Exemption (commonly called the
“7% cap”) in 2004, all homeowners across the state were eligible for the General Homestead
Exemption. Cook County had also used the statutory authority granted by 35 ILCS 250/1-99 to
create an additional exemption called the Homeowner Exemption for Long-term Properties
(HELP) in 2001.
62
The stated purpose of this exemption was “to stabilize the effects of soaring
61
See also Appendix E for a more detailed table of these exemptions.
62
Cook County Code of Ordinances Chapter 74 Article II Division 1 Sec. 74-36

20
property taxes for longtime homeowners who otherwise may be displaced from neighborhoods
where gentrification is occurring.”
63
The HELP exemption was for homeowners whose
household incomes did not exceed 115% of the area median, who had lived in their homes for 10
years (or five years if they received certain government assistance to acquire the property),
whose homes were valued at no more than $300,000 in market value and whose assessed value
increase exceeded 150% of the average increase in that assessment district. It provided an EAV
exemption that limited a homeowner’s EAV increase to the prior year EAV multiplied by 150%
of the average assessment increase, with no dollar amount maximum.
HELP first took effect in the City Triad in tax year 2000 and for the North and South triads in
their subsequent reassessment years (2001 and 2002, respectively). It was only in effect for three
years in each triad, however, because Public Act 93-715 amended 35 ILCS 250/20 to limit the
maximum HELP exemption to $20,000 of EAV. This change made the Alternative General
Homestead Exemption the operative homeowner exemption for HELP recipients. In 2002, the
only year when HELP was in effect for all three triads, 1.0% or 14,357 of the county’s 1.4
million Class 2 parcels received the exemption.
64
All counties were permitted by statute to adopt the Alternative General Homestead Exemption
but only Cook County chose to do so.
65
The Alternative General Homestead Exemption created
a range of EAV from $4,500 to $20,000 that could be exempted from taxation and was to expire
after three years. The exemption was implemented during the reassessment year of each triad,
such that it took effect for the City Triad in 2003, the North Triad in 2004, and the South Triad in
2005. It was created in reaction to a rapid increase in housing prices that occurred beginning in
2000 and was intended to prevent increases in taxable value greater than 7% each year, up to a
maximum exemption of $20,000 in EAV.
63
Cook County Code of Ordinances Chapter 74 Article II Division 1 Sec. 74-36(c).
64
Data provided by the Cook County Assessor’s Office, February 26, 2007.
65
The enabling ordinance adopted by the Cook County Board of Commissioners is called the Neighborhood
Preservation Homeowner Exemption, Cook County Code of Ordinances Chapter 74 Article II Division 1 Sec. 74-43.

21
A 2007 amendment to the Alternative General Homestead Exemption extended it for an
additional three years and increased the exemption maximums over the previous $20,000
maximum. As shown in the table below, the increase was introduced in the reassessment year of
each triad. The maximum exemption increased from $20,000 to $40,000 of EAV in the City
Triad for 2006 if the property’s 2006 EAV exceeded the 2002 EAV by 100% or more; the
maximum was $35,000 if the 2006 EAV exceeded the 2002 EAV by 80% or more, and was
$33,000 for all other eligible properties. The other triads had a maximum exemption of $33,000
in their reassessment year. The revised Alternative General Homestead Exemption was designed
to phase down the maximum exemption from $33,000 to $26,000 to $20,000 to $6,000 over four
years. It also increased the minimum exemption from $5,000 to $6,000 of EAV ($6,000 will be
both the minimum and maximum for the City in 2009).
Triad Min. Max.* Min. Max.** Min. Max.** Min. Max.** Min. Max.** Min. Max.**
City*
5,000$
40,000$
5,000$ 26,000$ 5,500$ 20,000$ 6,000$ 6,000$ 6,000$ 6,000$ 6,000$ 6,000$
North
5,000$ 20,000$ 5,000$
33,000$
5,500$ 26,000$ 6,000$ 20,000$ 6,000$ 6,000$ 6,000$ 6,000$
South
5,000$ 20,000$ 5,000$ 20,000$ 5,500$
33,000$
6,000$ 26,000$ 6,000$ 20,000$ 6,000$ 6,000$
*In the City 2006, the maximum exemption is $40,000 if the 2006 EAV exceeds the 2002 EAV by 100% or more; the maximum exemption is $35,000 if the 2006 EAV
exceeds the 2002 EAV by 80% or more; the maximum exemption for all other properties is $33,000.
**Beginning with the implementation of the Long-time Occupant Homestead Exemption in 2007, there is no maximum exemption for taxpayers who have owned the
home for ten years (or five if purchased with certain government assistance), and have a household income of $100,000 or less--the EAV of these homes may increase
no more than 10% per year. Likewise, there is no maximum exemption for taxpayers who have owned the home for ten years (or five if purchased with certain
government assistance), and have a household income of $75,000 or less--the EAV of these homes may increase no more than 7% per year.
Alternative General Homeowner Exemption Minimum and Maximum Amounts: Tax Years 2006-2011
2006 2007 2008 2009 2010 2011
The Long-time Occupant Homeowner Exemption was created at the same time as the extension
of the Alternative General Homestead Exemption. It effectively removes the dollar amount
maximum exemption of the Alternative General Homestead exemption for homeowners who
have lived in their homes for ten years (or five years if purchased with certain government
assistance) and have household income under specified levels. For household income of $75,000
or less, the EAV of the home may increase by no more than 7% each year with no dollar amount
maximum. For household income of $75,001 to $100,000 the EAV of the home may increase by
no more than 10% each year with no maximum.

22
The Cook County Assessor computes the value of homestead exemptions and conveys it to the
Cook County Clerk, who publishes it in an “Agency Exemption Detail Report” for each taxing
agency.
66
For tax year 2008 (the latest available data), the gross Cook County EAV before
exemptions was $215.9 billion and the value of homestead exemptions was $27.1 billion,
creating a net taxable EAV of $188.8 billion.
67
The general homeowner exemptions (Alternative
General Homestead Exemption and Long-time Occupant Homestead Exemption) represent the
vast majority of the value of exemptions, totaling $20.8 billion or 76.8% of total homestead
exemption value in 2008. The next largest exemption value is the Senior Citizens’ Assessment
Freeze Exemption, at $5.2 billion in EAV and 19.2% of total exemption value.
Exemption City of Chicago
Suburban Cook
County Total Cook County
% of Total
Cook
County
Homeowner Exemptions (Alternative
General and Long-time Occupant) $ 7,401,079,882 $ 13,422,348,427
$ 20,823,428,309 76.8%
Senior Citizens Assessment Freeze
Exemption $ 2,375,424,596 $ 2,823,920,420
$ 5,199,345,016 19.2%
Senior Citizens Homestead Exemption $ 398,715,932 $ 688,359,787
$ 1,087,075,719 4.0%
Disabled Persons' Homestead
Exemption $ 3,370,000 $ 7,380,356
$ 10,750,356 0.0%
Disabled Veterans' Exemption* $ 355,052 $ 2,163,661
$ 2,518,713 0.0%
Disabled Veterans' Standard
Homestead Exemption $ 940,889 $ 2,333,793
$ 3,274,682 0.0%
Returning Veterans' Exemption $ 120,000 $ 122,500
$ 242,500 0.0%
TOTAL $ 10,180,006,351 $ 16,946,628,944 $ 27,126,635,295 100.0%
Cook County Equalized Assessed Value of Homestead Exemptions, Tax Year 2008
*This exemption is determined by the Illinois Department of Veterans' Af fairs and certified to the county assessor. Application for all other
exemptions is made to the county assessor and the amounts are certified to the county clerk. The Homestead Improvements exemption is
done by the assessor prior to equalization and is not included here.
Source: Cook County Clerk Tax Year 2008 Agency Exemption Detail Report
66
See http://tax.cookctyclerk.com/ “Taxing Agency Reports”. Before tax year 2007 exemption amounts were
reported in “Equalized Valuations for Split Agencies” reports.
67
The net taxable EAV includes both EAV that is available for taxation by units of local government that levy
property taxes and EAV that is designated for Tax Increment Financing districts. TIF EAV is explained in the Civic
Federation’s Tax Increment Financing Issue Brief (http://www.civicfed.org/civic-federation/publications/tax-
increment-financing-tif-civic-federation-issue-brief) and in a forthcoming Civic Federation issue brief on the
property tax extension process.

23
The total value of homestead exemptions in Cook County has grown substantially in recent
years. The following graph shows that in 1999, homestead exemptions represented 5.0% of
gross EAV in Cook County. In other words, they removed 5.0% of total EAV from the net
taxable EAV. In 2008, homestead exemptions exempted 12.6% of gross EAV from taxation.
$-
$50
$100
$150
$200
$250
1999 2000 2001 2002 2003 2004 2005 2006 2007 2008
Billions of Equalized Assessed Value
Cook County Homestead Exemptions and Taxable EAV
Tax Years 1999-2008
Exemptions Taxab le EAV
Exemptions
= 5.0% of
gross EAV
Exemptions
= 12.6% of
gross EAV
Note: For data points detail see Appendix F
Source: Cook County Clerk Equalized Valuations for Split Agencies reports and Tax Increment Agency Distribution Summarys
This increase in the value of homestead exemptions is due primarily to dramatic growth in the
Senior Citizens Assessment Freeze Exemption and expansion of the General Homestead
Exemption through the introduction of the Alternative General Homestead Exemption.
The Senior Citizens Assessment Freeze Exemption “freezes” an eligible homeowner’s EAV at
the level of the year prior to a homeowner’s first application. In other words, it exempts all EAV
increases over the base amount. The household income eligibility limit was increased from
$35,000 to $40,000 for 1999-2003, from $40,000 to $45,000 for 2004-2005, to $50,000 for
2006-2007 and to $55,000 for tax year 2008. There is no exemption maximum or property value
maximum. Between 1999 and 2008 the Senior Citizens Assessment Freeze Homestead
Exemption value in Cook County increased by 979.6%, or $4.7 billion of EAV, from $481.6
million to $5.2 billion. The Senior Citizens’ Homestead Exemption has also existed for many
years but the total value of the exemption grew by only 69.2%, or $444.7 million from $642.4
million to $1.1 billion between 1999 and 2008. The flat dollar amount of the exemption was
increased from $2,500 to $3,000 for 2004-2005, to $3,500 for 2006-2007, and to $4,000 for tax
year 2008.

24
The “Homeowner Exemptions” category shown in the graph below includes the General
Homestead Exemption for 1998-2002, the Alternative General Homestead Exemption for 2003-
2007, the Homeowner Exemption for Long-term Properties for 2000-2004, the Long-time
Occupant Homestead Exemption for 2007-2008, and the Disabled Veterans' Exemption (1999-
2008).
68
The total value of these general homeowner exemptions in their various forms over the
years grew by $16.5 billion of EAV, or 386.5% between 1999 and 2008, from $4.3 billion to
$20.8 billion. Until tax year 2003, homeowner exemptions in Cook County consisted of the
General Homestead Exemption (a flat $4,500 of EAV) and the Homeowner Exemption for Long-
Term Properties, which did not have a maximum EAV amount but represented less than 0.1% of
total homeowner exemption value. In 2003, the Alternative General Homestead Exemption took
effect in Cook County, allowing a $4,500 minimum and $20,000 maximum homeowner
exemption.
69
The minimum was increased to $5,000 for 2004 and 2005. In 2006, the
Alternative General Homestead Exemption maximum was increased to $40,000 for the City
Triad (see page 20 for detail on this exemption). The Long-time Occupant Homestead
Exemption was added in 2007 with no maximum exemption (see page 21 for description).
$-
$5
$10
$15
$20
$25
1999 2000 2001 2002 2003 2004 2005 2006 2007 2008
Billions of Equalized Assessed Value
Cook County Homeowner and Senior Citizens Assessment Freeze Exemptions:
Tax Years 1999-2008
Homeowner Exemp tions Senior Citizens Assessment Freeze Exemption
Note: See Appendix E for data points detail
Source: Cook County Clerk Equalized Valuations for Split Agencies reports
68
The Disabled Veteran's Exemption is included because it could not be extracted from other homeowner exemption
data prior to 2007.
69
In state statute it is called the Alternative General Homestead Exemption (35 ILCS 200/15-176) but the
corresponding Cook County ordinance is called the Neighborhood Preservation Homeowner Exemption (Cook
County Code of Ordinances Chapter 74 Article II Division 1 Sec. 74-43).

25
By removing some EAV from taxation, exemptions make tax rates higher than they would be
otherwise. The composite tax rate for a typical Chicago property in tax year 2008 (payable in the
fall of 2009) was 4.816%, but if all the exempt EAV had been taxable that year the tax rate
would have been 4.265% or 11.4% lower.
70
Charitable, Religious, Educational & Governmental Exemptions
Article IX Section 6 of the Illinois Constitution authorizes the General Assembly to exempt from
taxation the following types of property: property of the State or local governments, property
used for agricultural and horticultural societies, and property used for school, religious,
cemetery, and charitable purposes.
State statutes currently exempt the following types and uses of property from taxation:
public schools and non-profit private schools and research institutions;
properties used for religious purposes, orphanages, or non-profit religious schools;
cemeteries;
United States federal government properties;
State of Illinois government properties;
local government properties including fire protection properties, public libraries, public
transportation systems, housing authorities, park and conservation districts, municipal
utilities, public water and drainage districts, and airport and port authorities;
properties used for charitable purposes, including non-profit hospitals, nursing homes and
health maintenance organizations;
historical, agricultural, and horticultural societies;
military schools and property of veterans’ organizations; and
parking areas related to any of the above uses.
71
Applications for charitable, religious, educational, and governmental exemptions are filed with
the Cook County Board of Review, which must provide the Assessor’s Office with a copy of the
application.
72
These exemptions may remove the entire value of a property from taxation, or
only a designated part of it, insofar as the property (or part) meets the statutory and constitutional
criteria. The Board of Review makes an initial determination about granting the exemption, but
its decision is not final.
73
Only the Illinois Department of Revenue can make a final
determination on granting or denying the exemption in the first instance, which determination is
then subject to review in the courts.
74
Owners of most types of exempt properties must submit
an annual affidavit stating whether or not there have been any changes to the ownership or use of
the property.
75
70
“Exempt EAV” here refers to homestead exemptions, not charitable, religious, and governmental property
exemptions described in the next section.
71
35 ILCS 200/15-35 to 15-60.
72
35 ILCS 200/15-5 et seq.
73
35 ILCS 200/16-130
74
35 ILCS 200/16-130. For detail on appealing these exemptions see the Civic Federation’s Cook County Property
Tax Appeals: A Primer with Comparative Data for 2000-2008, November 17, 2009, available at
http://civicfed.org/sites/default/files/091117_CookCountyAppealsReport.pdf
75
35 ILCS 200/15-10.

26
The number of exempt parcels in Cook County increased by 16.8% between tax years 1999 and
2008, from 79,260 to 92,548.
76
The total number of parcels for all classes in Cook County
increased 13.1% during the same time period, and exempt parcels remained steady at
approximately 5% of the total.
The value of exempt parcels is unknown because they are not assessed. There is one recent
example of an attempt to quantify the value of these property exemptions. At the request of the
Cook County Board of Commissioners, the Cook County Assessor estimated the full market
value of 54 tax-exempt hospitals in the county at $4.3 to $4.5 billion as of January 2006. This
represented approximately 0.72% to 0.75% of full market value countywide.
77
There is also a statute that permits but does not require taxing districts and owners of exempt
properties to enter into agreements whereby the owners make payments in lieu of taxes to
compensate the districts for the cost of services provided by the districts.
78
Other Property Tax Assistance Measures
State statutes make three additional property tax relief measures available to individuals: the
Senior Citizens Real Estate Tax Deferral, the Circuit Breaker, and the 5% income tax credit, all
described below.
The Senior Citizens Real Estate Tax Deferral Act first took effect in 1983 and allows persons
over 65 years of age or older with household incomes of $50,000 or less to defer payment of all
or part of their property taxes.
79
The State of Illinois will pay the property taxes owed by the
applicant and place a lien on the property equal to the deferred tax payment plus six percent
annual interest. The maximum amount of property tax that can be deferred is 80% of the
taxpayer’s equity in the property. The full amount must be repaid to the State within one year of
the applicant’s death or 90 days of the transfer of the property. Application is made to the Cook
County Treasurer.
The Senior Citizens and Disabled Persons Property Tax Relief and Pharmaceutical Assistance
Act—commonly known as the “Circuit Breaker”—provides property tax or rent assistance to
persons with disabilities and persons 65 years of age or older with a household income under
$22,218 for a single person ($36,740 for a household with three or more persons).
80
This
program is provided through grants by the State of Illinois Department of Aging. Grant amounts
range from $5 to $700 per a sliding scale based on income and tax or rent paid.
81
In FY2008 the
76
Cook County Assessor, Final Abstracts of Assessment 1999-2008. See Appendix A.
77
Cook County Assessor’s Office, “Exempt Hospitals: Valuation Estimates and Appraisal Methodology,”
November 6, 2007. Available at http://www.cookcountyassessor.com/LatestNews/LateNews.aspx?ID=171
78
35 ILCS 200/15-30
79
320 ILCS 30/1 et seq.
80
320 ILCS 25/1.
81
Illinois Department of Aging, “How to Estimate Your Circuit Breaker Property Tax Grant,”
http://www.cbrx.il.gov/aging/1rx/cbrx/estimate-tax.pdf

27
State appropriated $52.3 million for the Circuit Breaker Program (including pharmaceutical
assistance).
82
An individual income tax credit equal to 5% of residential property taxes paid was enacted
by the State of Illinois beginning with property tax year 1991 (payable during income tax year
1992).
83
The value of this income tax credit was $478.4 million in State fiscal year 2007, an
increase of 7.8% from $443.7 million the previous year.
84
The City of Chicago’s Homeowner Assistance Program provides 3% simple interest loans to
homeowners who need assistance paying their property taxes. Eligible properties are those
whose assessed value increased more than 1.25 times the median increase in the city’s most
recent reassessment, or any homeowner whom the Executive Director of the Chicago Tax
Assistance Center determines is in imminent danger of losing their home due to foreclosure or
tax sale. The homeowner may not have household income over 80% of the Chicago area median
family income and may not also be eligible for the Cook County Homeowner Exemption for
Long Term Properties. The loan is for the amount of tax increase attributable to the increase in
assessed value of the property. It can be no less than $500 and no more than $4,000.
85
As part of the City’s 2010 budget, the City Council approved a temporary Property Tax Relief
Program for qualified homeowners in the City of Chicago.
86
The program provides grants
between $25 and $200 depending on household income ($200,000 maximum) and the size of the
assessment increase for tax year 2008, payable fall of 2009.
82
State of Illinois FY2010 Budget, 7-2.
83
35 ILCS 5/208.
84
Illinois Comptroller, Illinois Fiscal Year 2007 Tax Expenditure Report, B-1. Available at
http://www.apps.ioc.state.il.us/ioc-pdf/TaxExpRptFY2007Web.pdf
.
85
City of Chicago Municipal Code 2-32-625.
86
See http://webapps.cityofchicago.org/PropertyTaxReliefWeb and
http://www.chicityclerk.com/journals/2009/Nov25th_2009/financeoptimize.pdf
. Last visited January 21, 2010.

28
Taxable Value
The net EAV of a property, after any EAV exemptions have been subtracted, is the taxable
value. The total taxable value of property in Cook County increased by $89.1 billion between tax
years 1999 and 2008, rising from $85.4 billion to $188.8 billion. This was an increase of 104.3%
over ten years.
87
$-
$20
$40
$60
$80
$100
$120
$140
$160
$180
$200
1999 2000 2001 2002 2003 2004 2005 2006 2007 2008
Billions of Equalized Assessed Value
Cook County Taxable EAV: Tax Years 1999-2008
Note: For data points detail see Appendix F
Source: Cook County Clerk Equalized Valuations for Split Agencies reports and Tax Increment Agency Distribution Summaries
87
The total taxable value of property in Cook County is different from the EAV available to taxing agencies such as
school districts due to Tax Increment Financing districts, as explained explained in the Civic Federation’s Tax
Increment Financing Issue Brief (http://www.civicfed.org/civic-federation/publications/tax-increment-financing-tif-
civic-federation-issue-brief) and in a forthcoming Civic Federation issue brief on the property tax extension process.
The total taxable EAV figure is arrived at by summing the EAV available to Cook County as a taxing agency and
the countywide TIF increment.

29
Estimated Full Value of Real Estate
The full market value of taxable real estate in Cook County can be roughly estimated by dividing
the assessed value of property reported by the Cook County Assessor’s Office into the median
level of assessment reported by the Illinois Department of Revenue:
Assessed Value ÷ Median Level of Assessment = Estimated Full Market Value
For example, the 2007 final assessed value of all residential real estate in Chicago was $18.9
billion and the adjusted median level of assessment was 8.81%, so the full market value of
residential property in Chicago can be estimated at $214.9 billion. The actual market value of
real estate could only be known by conducting an appraisal or sale of every property in the
county so this simple formula provides a useful, if crude, estimate.
The Civic Federation publishes an estimate of full value in Cook County every year.
88
The most
recent data available is for tax year 2007, when the total value of real estate in Cook County fell
for the first time since at least 1995, from $666.2 billion in 2006 to $656.5 billion in 2007. The
graph below illustrates the ten-year trend in estimated full value.
$0
$100
$200
$300
$400
$500
$600
$700
1998 1999 2000 2001 2002 2003 2004 2005 2006 2007
Billions
Estimated Full Value of Cook County Real Property: 1998-2007
Total Cook County
Suburban Cook County
City of Chicago
Source: Assessed Value (Cook County Assessor's Office) and Assessment Sales/Ratio Studies (Illinois Department of Revenue) data from the same year
88
See the latest report at http://www.civicfed.org/civic-federation/publications/estimated-full-value-cook-county-
real-estate-2007-property-tax-assessm.

30
APPENDIX A: NUMBER OF PARCELS BY CLASS 2000-2008
2000 2001 2002 2003 2004 2005 2006 2007 2008
Residential (Class 2) 1,344,442 1,364,507 1,384,815 1,406,734 1,432,085 1,459,580 1,491,332 1,525,514 1,553,604
Non-Residential (All other) 292,827 290,891 288,919 286,419 284,133 281,385 279,982 278,705 279,014
Total 1,637,269 1,655,398 1,673,734 1,693,153 1,716,218 1,740,965 1,771,314 1,804,219 1,832,618
2000 2001 2002 2003 2004 2005 2006 2007 2008
Residential (Class 2) 564,094 577,403 590,193 605,254 621,094 638,237 660,483 685,097 706,078
Non-Residential (All other) 154,120 153,328 153,211 152,065 151,600 151,034 149,728 148,646 149,062
Total 718,214 730,731 743,404 757,319 772,694 789,271 810,211 833,743 855,140
2000 2001 2002 2003 2004 2005 2006 2007 2008
Residential (Class 2) 372,547 375,674 379,266 382,043 387,217 392,097 397,942 403,909 408,712
Non-Residential (All other) 44,898 44,618 44,166 43,849 42,620 42,632 42,202 41,969 41,967
Total 417,445 420,292 423,432 425,892 429,837 434,729 440,144 445,878 450,679
2000 2001 2002 2003 2004 2005 2006 2007 2008
Residential (Class 2) 407,801 411,430 415,356 419,437 423,774 429,246 432,907
436,508 438,814
Non-Residential (All other) 93,809 92,945 91,542 90,505 89,913 87,719 88,052 88,090 87,985
Total 501,610 504,375 506,898 509,942 513,687 516,965 520,959 524,598 526,799
2000 2001 2002 2003 2004 2005 2006 2007 2008
Residential (Class 2) 82.1% 82.4% 82.7% 83.1% 83.4% 83.8% 84.2% 84.6% 84.8%
Non-Residential (All other) 17.9% 17.6% 17.3% 16.9% 16.6% 16.2% 15.8% 15.4% 15.2%
Total 100.0% 100.0% 100.0% 100.0% 100.0% 100.0% 100.0% 100.0% 100.0%
2000 2001 2002 2003 2004 2005 2006 2007 2008
Residential (Class 2) 78.5% 79.0% 79.4% 79.9% 80.4% 80.9% 81.5% 82.2% 82.6%
Non-Residential (All other) 21.5% 21.0% 20.6% 20.1% 19.6% 19.1% 18.5% 17.8% 17.4%
Total 100.0% 100.0% 100.0% 100.0% 100.0% 100.0% 100.0% 100.0% 100.0%
2000 2001 2002 2003 2004 2005 2006 2007 2008
Residential (Class 2) 89.2% 89.4% 89.6% 89.7% 90.1% 90.2% 90.4% 90.6% 90.7%
Non-Residential (All other) 10.8% 10.6% 10.4% 10.3% 9.9% 9.8% 9.6% 9.4% 9.3%
Total 100.0% 100.0% 100.0% 100.0% 100.0% 100.0% 100.0% 100.0% 100.0%
2000 2001 2002 2003 2004 2005 2006 2007 2008
Residential (Class 2) 81.3% 81.6% 81.9% 82.3% 82.5% 83.0% 83.1% 83.2% 83.3%
Non-Residential (All other) 18.7% 18.4% 18.1% 17.7% 17.5% 17.0% 16.9% 16.8% 16.7%
Total 100.0% 100.0% 100.0% 100.0% 100.0% 100.0% 100.0% 100.0% 100.0%
Note: Does not include parcels assessed by the Department of Revenue. Non-residential includes apartment buildings with 7 or more units.
Note: Does not include parcels assessed by the Department of Revenue. Non-residential includes apartment buildings with 7 or more units.
Source: Cook County Assessor's Office, Final Assessment Abstracts
Source: Cook County Assessor's Office, Final Assessment Abstracts
Cook County Number of Parcels By Class: Tax Years 2000-2008
Cook County Total
City of Chicago Triad
North Triad
South Triad
Cook County Number of Parcels By Class: Tax Years 2000-2008
Cook County Total
City of Chicago Triad
North Triad
South Triad

31
1999 2000 2001 2002 2003 2004 2005 2006 2007 2008 % Change
Class 0 Non-Assessed 79,260 80,971 83,117 86,266 88,732 90,311 91,282 91,980 91,914 92,548 16.8%
Class 1 Vacant 90,605 89,100 86,234 82,599 78,941 75,773 72,419 70,986 69,791 68,934 -23.9%
Class 2 Residential 1,313,917 1,344,442 1,364,507 1,384,815 1,406,734 1,432,085 1,459,580 1,491,332 1,525,514 1,553,604 18.2%
Class 3 Apartments 32,331 22,116 21,578 20,607 19,839 19,217 18,712 18,156 17,636 17,465 -46.0%
Class 4 Non-Profit 949 897 864 888 938 928 937 971 972 960 1.2%
Class 5(a) Commercial 73,002 69,036 68,628 68,052 67,743 67,728 67,848 68,003 68,749 69,263 -5.1%
Class 5(b) Industrial 27,879 27,532 27,317 27,205 26,894 26,519 26,053 25,684 25,287 25,110 -9.9%
Class 6 Industrial* 828 823 791 835 922 1,005 1,104 1,168 1,209 1,313 58.6%
Class 7Commercial* 64654626971878697971516.7%
Class 8 Commercial* 47 42 45 63 105 143 206 272 355 457 872.3%
Class 9 Apartment* 406 508 552 679 778 1,029 1,179 1,338 1,448 1,535 278.1%
Farm 1,575 1,571 1,527 1,481 1,458 1,409 1,558 1,338 1,247 1,332 -15.4%
Railroad 187185184182000000-100.0%
Total 1,620,992 1,637,269 1,655,398 1,673,734 1,693,153 1,716,218 1,740,965 1,771,314 1,804,219 1,832,618 13.1%
1999 2000 2001 2002 2003 2004 2005 2006 2007 2008 % Change
Class 0 Non-Assessed 43,284 44,353 46,012 48,501 50,484 51,507 51,794 52,187 51,932 52,167 20.5%
Class 1 Vacant 44,173 44,161 42,489 40,443 38,556 37,502 36,843 35,453 34,541 34,367 -22.2%
Class 2 Residential 542,116 564,094 577,403 590,193 605,254 621,094 638,237 660,483 685,097 706,078 30.2%
Class 3 Apartments 22,940 14,519 14,165 13,803 13,139 12,735 12,412 12,085 11,589 11,479 -50.0%
Class 4 Non-Profit 307 260 252 295 338 335 336 375 368 376 22.5%
Class 5(a) Commercial 39,566 36,097 35,840 35,682 35,343 35,445 35,766 35,906 36,697 37,244 -5.9%
Class 5(b) Industrial 14,292 13,918 13,719 13,560 13,299 13,034 12,721 12,433 12,156 11,974 -16.2%
Class 6 Industrial* 236 243 240 227 248 254 273 287 278 312 32.2%
Class 7Commercial* 64553546264706971701066.7%
Class 8Commercial* 7777777200-100.0%
Class 9 Apartment* 346 416 451 540 589 717 812 931 1,014 1,073 210.1%
Farm 0000000000--
Railroad 10010110099000000-100.0%
Total 707,373 718,214 730,731 743,404 757,319 772,694 789,271 810,211 833,743 855,140 20.9%
1999 2000 2001 2002 2003 2004 2005 2006 2007 2008 % Change
Class 0 Non-Assessed 35,976 36,618 37,105 37,765 38,248 38,804 39,488 39,793 39,982 40,381 12.2%
Class 1 Vacant 46,432 44,939 43,745 42,156 40,385 38,271 35,576 35,533 35,250 34,567 -25.6%
Class 2 Residential 771,801 780,348 787,104 794,622 801,480 810,991 821,343 830,849 840,417 847,526 9.8%
Class 3 Apartments 9,391 7,597 7,413 6,804 6,700 6,482 6,300 6,071 6,047 5,986 -36.3%
Class 4 Non-Profit 642 637 612 593 600 593 601 596 604 584 -9.0%
Class 5(a) Commercial 33,436 32,939 32,788 32,370 32,400 32,283 32,082 32,097 32,052 32,019 -4.2%
Class 5(b) Industrial 13,587 13,614 13,598 13,645 13,595 13,485 13,332 13,251 13,131 13,136 -3.3%
Class 6 Industrial* 592 580 551 608 674 751 831 881 931 1,001 69.1%
Class 7Commercial* 01187717172627--
Class 8 Commercial* 40 35 38 56 98 136 199 270 355 457 1042.5%
Class 9 Apartment* 60 92 101 139 189 312 367 407 434 462 670.0%
Farm 1,575 1,571 1,527 1,481 1,458 1,409 1,558 1,338 1,247 1,332 -15.4%
Railroad 87848483000000-100.0%
Total 913,619 919,055 924,667 930,330 935,834 943,524 951,694 961,103 970,476 977,478 7.0%
* Incentive Classes
Source: Cook County Assessor's Office, Final Assessment Abstracts
Number of Cook County Parcels By Class: Tax Years 1999-2008
Cook County
City of Chicago
Suburban Cook County
Note: Class 0 includes parcels assessed by the Department of Revenue (e.g., railroad and pollution control properties) and parcels that are exempt from assessment (e.g., charitable, religious,
educational, and governmental properties). Railroad properties were moved to Class 0 in 2003. 1999-2000 drop in Class 3 is due in part to reclassification of Class 3-18 parcels to Class 2-18.

32
APPENDIX B: FINAL ASSESSED VALUE 2000-2008
2000 2001 2002 2003 2004 2005 2006 2007 2008
Residential (Class 2) 21,722,123,814$ 23,478,586,633$ 24,848,164,396$ 28,470,271,147$ 31,601,784,043$ 34,129,303,022$ 39,491,832,739$ 43,354,555,882$ 45,036,821,173$
Non-Residential (All other) 21,624,525,367$ 22,066,033,113$ 22,336,596,358$ 23,992,224,642$ 24,198,682,318$ 24,690,009,461$ 26,579,338,342$ 27,169,675,459$ 27,429,777,114$
Total 43,346,649,181$ 45,544,619,746$ 47,184,760,754$ 52,462,495,789$ 55,800,466,361$ 58,819,312,483$ 66,071,171,081$ 70,524,231,341$ 72,466,598,287$
2000 2001 2002 2003 2004 2005 2006 2007 2008
Residential (Class 2) 8,758,681,649$ 8,973,795,507$ 9,221,622,066$ 12,677,199,294$ 12,988,216,247$ 13,420,538,211$ 18,521,873,454$ 18,937,256,455$ 19,339,573,551$
Non-Residential (All other) 11,226,530,314$ 11,153,577,213$ 11,211,896,134$ 13,024,983,243$ 12,749,938,229$ 12,807,410,295$ 14,852,914,715$ 14,686,208,897$ 14,655,544,286$
Total 19,985,211,963$ 20,127,372,720$ 20,433,518,200$ 25,702,182,537$ 25,738,154,476$ 26,227,948,506$ 33,374,788,169$ 33,623,465,352$ 33,995,117,837$
2000 2001 2002 2003 2004 2005 2006 2007 2008
Residential (Class 2) 7,559,640,949$ 9,028,510,104$ 9,106,199,490$ 9,201,006,544$ 11,930,162,765$ 12,075,351,272$ 12,257,117,655$ 15,631,960,742$ 15,616,351,765$
Non-Residential (All other) 6,617,551,936$ 7,145,402,000$ 7,080,531,870$ 6,991,102,757$ 7,513,759,177$ 7,488,988,466$ 7,393,779,434$ 8,163,917,968$ 8,056,705,027$
Total 14,177,192,885$ 16,173,912,104$ 16,186,731,360$ 16,192,109,301$ 19,443,921,942$ 19,564,339,738$ 19,650,897,089$ 23,795,878,710$ 23,673,056,792$
2000 2001 2002 2003 2004 2005 2006 2007 2008
Residential (Class 2) 5,403,801,216$ 5,476,281,022$ 6,520,342,840$ 6,592,065,309$ 6,683,405,031$ 8,633,413,539$ 8,712,841,630
$ 8,785,338,685$ 10,080,895,857$
Non-Residential (All other) 3,780,443,117$ 3,767,053,900$ 4,044,168,354$ 3,976,138,642$ 3,934,984,912$ 4,393,610,700$ 4,332,644,193$ 4,319,548,594$ 4,717,527,801$
Total 9,184,244,333$ 9,243,334,922$ 10,564,511,194$ 10,568,203,951$ 10,618,389,943$ 13,027,024,239$ 13,045,485,823$ 13,104,887,279$ 14,798,423,658$
Note: Total includes farm and railroad properties. Non-residential includes apartment buildings with 7 or more units.
Source: Cook County Assessor's Office, Final Assessment Abstracts
Cook County Final Assessed Values By Class: Tax Years 2000-2008
Cook County Total
City of Chicago Triad
South Triad
North Triad
2000 2001 2002 2003 2004 2005 2006 2007 2008
Residential (Class 2) 50.1% 51.6% 52.7% 54.3% 56.6% 58.0% 59.8% 61.5% 62.1%
Non-Residential (All other) 49.9% 48.4% 47.3% 45.7% 43.4% 42.0% 40.2% 38.5% 37.9%
Total 100.0% 100.0% 100.0% 100.0% 100.0% 100.0% 100.0% 100.0% 100.0%
2000 2001 2002 2003 2004 2005 2006 2007 2008
Residential (Class 2) 43.8% 44.6% 45.1% 49.3% 50.5% 51.2% 55.5% 56.3% 56.9%
Non-Residential (All other) 56.2% 55.4% 54.9% 50.7% 49.5% 48.8% 44.5% 43.7% 43.1%
Total 100.0% 100.0% 100.0% 100.0% 100.0% 100.0% 100.0% 100.0% 100.0%
2000 2001 2002 2003 2004 2005 2006 2007 2008
Residential (Class 2) 53.3% 55.8% 56.3% 56.8% 61.4% 61.7% 62.4% 65.7% 66.0%
Non-Residential (All other) 46.7% 44.2% 43.7% 43.2% 38.6% 38.3% 37.6% 34.3% 34.0%
Total 100.0% 100.0% 100.0% 100.0% 100.0% 100.0% 100.0% 100.0% 100.0%
2000 2001 2002 2003 2004 2005 2006 2007 2008
Residential (Class 2) 58.8% 59.2% 61.7% 62.4% 62.9% 66.3% 66.8% 67.0% 68.1%
Non-Residential (All other) 41.2% 40.8% 38.3% 37.6% 37.1% 33.7% 33.2% 33.0% 31.9%
Total 100.0% 100.0% 100.0% 100.0% 100.0% 100.0% 100.0% 100.0% 100.0%
South Triad
Note: Total includes farm and railroad properties. Non-residential includes apartment buildings with 7 or more
Source: Cook County Assessor's Office, Final Assessment Abstracts
Cook County Final Assessed Values By Class: Tax Years 2000-2008
Cook County Total
City of Chicago Triad
North Triad

33
APPENDIX C: COOK COUNTY ASSESSED VALUES BY CLASS
1999 2000 2001 2002 2003 2004 2005 2006 2007 2008 % Change
Class 1 Vacant 555,549,349$ 602,391,261$ 599,378,908$ 601,614,445$ 668,907,151$ 699,062,490$ 747,810,680$ 864,138,667$ 846,196,889$ 853,313,625$ 53.6%
Class 2 Residential 19,541,646,910$ 21,722,123,814$ 23,478,586,633$ 24,848,164,396$ 28,470,271,147$ 31,601,784,043$ 34,129,303,022$ 39,491,832,739$ 43,354,555,882$ 45,036,821,173$ 130.5%
Class 3 Apartments 3,112,532,820$ 2,954,804,197$ 2,949,056,624$ 2,904,131,313$ 3,156,864,537$ 2,752,941,696$ 2,740,459,558$ 2,806,587,568$ 2,534,926,057$ 2,328,329,683$ -25.2%
Class 4 Non-Profit 130,767,522$ 134,161,433$ 134,516,545$ 135,647,888$ 163,762,387$ 169,265,253$ 171,191,973$ 193,576,091$ 208,382,120$ 223,734,218$ 71.1%
Class 5(a) Commercial 12,693,904,933$ 13,609,845,964$ 13,962,816,333$ 14,289,054,588$ 15,700,509,409$ 16,197,969,499$ 16,575,557,467$ 18,081,666,969$ 18,745,510,132$ 19,162,339,407$ 51.0%
Class 5(b) Industrial 4,003,012,960$ 4,015,691,469$ 4,087,693,971$ 4,052,078,770$ 4,026,719,636$ 4,055,175,382$ 4,078,633,063$ 4,184,026,859$ 4,331,180,487$ 4,305,861,746$ 7.6%
Class 6 Industrial* 155,430,232$ 151,057,765$ 149,883,250$ 159,641,737$ 187,378,862$ 203,924,145$ 237,095,429$ 267,496,712$ 290,787,552$ 310,897,397$ 100.0%
Class 7 Commercial* 10,258,610$ 874,805$ 10,704,974$ 11,438,642$ 7,333,991$ 13,368,543$ 14,055,475$ 9,891,659$ 17,452,021$ 28,473,840$ 177.6%
Class 8 Commercial* 4,387,116$ 2,574,946$ 2,256,676$ 2,865,355$ 4,478,115$ 6,528,689$ 10,101,958$ 15,432,741$ 21,828,294$ 29,113,067$ 563.6%
Class 9 Apartment* 24,967,775
$ 30,375,124$ 37,785,837$ 48,594,407$ 66,355,145$ 91,086,422$ 105,964,771$ 148,054,890$ 165,188,430$ 178,514,326$ 615.0%
Farm 13,937,967$ 11,129,255$ 10,421,212$ 10,127,615$ 9,915,409$ 9,360,199$ 9,139,087$ 8,466,186$ 8,223,477$ 9,199,805$ -34.0%
Railroad 94,895,496$ 111,619,148$ 121,518,783$ 121,401,598$ -$ -$ -$ -$ -$ -$ --
Total 40,341,291,690$ 43,346,649,181$ 45,544,619,746$ 47,184,760,754$ 52,462,495,789$ 55,800,466,361$ 58,819,312,483$ 66,071,171,081$ 70,524,231,341$ 72,466,598,287$ 79.6%
1999 2000 2001 2002 2003 2004 2005 2006 2007 2008 % Change
Class 1 Vacant 177,579,515$ 238,515,923$ 233,690,278$ 221,053,482$ 319,469,249$ 272,429,422$ 257,026,036$ 415,639,835$ 391,413,271$ 383,909,602$ 116.2%
Class 2 Residential 6,777,399,785$ 8,758,681,649$ 8,973,795,507$ 9,221,622,066$ 12,677,199,294$ 12,988,216,247$ 13,420,538,211$ 18,521,873,454$ 18,937,256,455$ 19,339,573,551$ 185.4%
Class 3 Apartments 2,021,410,960$ 1,966,920,632$ 1,923,256,675$ 1,865,646,223$ 2,233,571,966$ 1,883,047,692$ 1,842,613,464$ 2,006,898,081$ 1,768,926,716$ 1,602,768,576$ -20.7%
Class 4 Non-Profit 38,320,622$ 46,327,495$ 45,597,774$ 44,727,441$ 69,898,173$ 69,591,072$ 69,004,531$ 89,049,825$ 90,691,565$ 92,375,650$ 141.1%
Class 5(a) Commercial 6,840,275,712$ 7,665,597,173$ 7,647,436,793$ 7,794,495,906$ 9,190,251,003$ 9,315,849,521$ 9,432,173,527$ 10,940,796,497$ 11,044,794,465$ 11,191,221,768$ 63.6%
Class 5(b) Industrial 1,070,562,393$ 1,141,846,904
$ 1,109,929,002$ 1,083,645,671$ 1,113,480,408$ 1,085,579,267$ 1,070,524,581$ 1,216,352,569$ 1,194,291,646$ 1,168,315,061$ 9.1%
Class 6 Industrial* 33,161,499$ 31,117,607$ 32,520,601$ 33,479,069$ 40,215,932$ 44,491,612$ 49,653,550$ 63,023,307$ 56,597,441$ 57,665,606$ 73.9%
Class 7 Commercial* 10,258,610$ 650,546$ 10,480,715$ 10,810,800$ 6,694,479$ 12,754,914$ 13,198,926$ 9,035,110$ 16,457,624$ 27,315,864$ 166.3%
Class 8 Commercial* 143,623$ 143,844$ 143,844$ 143,844$ 118,574$ 118,562$ 118,562$ 53,278$ -$ -$ --
Class 9 Apartment* 22,790,995$ 26,187,460$ 31,602,819$ 39,156,403$ 51,283,459$ 66,076,167$ 73,097,118$ 112,066,213$ 123,036,169$ 131,972,159$ 479.1%
Farm -$ -$ -$ -$ -$ -$ -$ -$ -$ -$ --
Railroad 92,332,048$ 109,222,730$ 118,918,712$ 118,737,295$ -$ -$ -$ -$ -$ -$ --
Total 17,084,235,762$ 19,985,211,963$ 20,127,372,720$ 20,433,518,200$ 25,702,182,537$ 25,738,154,476$ 26,227,948,506$ 33,374,788,169$ 33,623,465,352$ 33,995,117,837$ 99.0%
1999 2000 2001 2002 2003 2004 2005 2006 2007 2008 % Change
Class 1 Vacant 377,969,834$ 363,875,338$ 365,688,630$ 380,560,963$ 349,437,902$ 426,633,068$ 490,784,644$ 448,498,832$ 454,783,618$ 469,404,023$ 24.2%
Class 2 Residential 12,764,247,125$ 12,963,442,165$ 14,504,791,126
$ 15,626,542,330$ 15,793,071,853$ 18,613,567,796$ 20,708,764,811$ 20,969,959,285$ 24,417,299,427$ 25,697,247,622$ 101.3%
Class 3 Apartments 1,091,121,860$ 987,883,565$ 1,025,799,949$ 1,038,485,090$ 923,292,571$ 869,894,004$ 897,846,094$ 799,689,487$ 765,999,341$ 725,561,107$ -33.5%
Class 4 Non-Profit 92,446,900$ 87,833,938$ 88,918,771$ 90,920,447$ 93,864,214$ 99,674,181$ 102,187,442$ 104,526,266$ 117,690,555$ 131,358,568$ 42.1%
Class 5(a) Commercial 5,853,629,221$ 5,944,248,791$ 6,315,379,540$ 6,494,558,682$ 6,510,258,406$ 6,882,119,978$ 7,143,383,940$ 7,140,870,472$ 7,700,715,667$ 7,971,117,639$ 36.2%
Class 5(b) Industrial 2,932,450,567$ 2,873,844,565$ 2,977,764,969$ 2,968,433,099$ 2,913,239,228$ 2,969,596,115$ 3,008,108,482$ 2,967,674,290$ 3,136,888,841$ 3,137,546,685$ 7.0%
Class 6 Industrial* 122,268,733$ 119,940,158$ 117,362,649$ 126,162,668$ 147,162,930$ 159,432,533$ 187,441,879$ 204,473,405$ 234,190,111$ 253,231,791$ 107.1%
Class 7 Commercial* -$ 224,259$ 224,259$ 627,842$ 639,512$ 613,629$ 856,549$ 856,549$ 994,397$ 1,157,976$ --
Class 8 Commercial* 4,243,493$ 2,431,102$ 2,112,832$ 2,721,511$ 4,359,541$ 6,410,127$ 9,983,396$ 15,379,463$ 21,828,294$ 29,113,067$ 586.1%
Class 9 Apartment* 2,176,780$ 4,187,664$ 6,183,018$ 9,438,004$ 15,071,686$ 25,010,255$ 32,867,653$ 35,988,677$ 42,152,261$ 46,542,167$ 2038.1%
Farm 13,937,967$ 11,129,255$ 10,421,212$ 10,127,615$ 9,915,409
$ 9,360,199$ 9,139,087$ 8,466,186$ 8,223,477$ 9,199,805$ -34.0%
Railroad 2,563,448$ 2,396,418$ 2,600,071$ 2,664,303$ -$ -$ -$ -$ -$ -$ --
Total 23,257,055,928$ 23,361,437,218$ 25,417,247,026$ 26,751,242,554$ 26,760,313,252$ 30,062,311,885$ 32,591,363,977$ 32,696,382,912$ 36,900,765,989$ 38,471,480,450$ 65.4%
* Incentive Classes
Source: Cook County Assessor's Off ice, Final Assessment A bstracts
Note: Class 0 includes parcels assessed by the Department of Revenue (e.g., railroad and pollution control properties) and parcels that are exempt from assessment (e.g., charitable, religious, educational, and governmental properties). Railroad properties w ere moved to Class 0 in 2003. 1999-2000 drop in Class 3 is
due in part to reclassification of Class 3-18 parcels to Class 2-18.
Asse ssm e n t Ye a r
Cook County Assessed Values By Class: Tax Years 1999-2008
Cook County
Asse ssm e n t Ye a r
City of Chicago
Asse ssm e n t Ye a r
Suburban Cook County

34
APPENDIX D: COOK COUNTY MEDIAN LEVELS OF ASSESSMENT
1994 1995 1996 1997 1998 1999 2000 2001 2002 2003 2004 2005 2006 2007
Class 1 Vacant 0.1214 0.1197 0.1092 0.1011 0.1157 0.1038 0.1011 0.0887 0.0833 0.0983 0.0742 0.0740 0.0596 0.0796
Class 2 Residential 0.0946 0.0948 0.0938 0.095 0.0931 0.0888 0.0905 0.0843 0.0810 0.0838 0.0831 0.0815 0.0851 0.0904
Class 3 Apartment 0.2331 0.2164 0.2169 0.2202 0.2071 0.1909 0.1899 0.1648 0.1408 0.1430 0.1169 0.0876 0.1059 0.1086
Class 5a Commercial 0.2952 0.3018 0.2815 0.2811 0.2677 0.2674 0.2499 0.2222 0.2188 0.2267 0.1659 0.1734 0.1571 0.1653
Class 5b Industrial 0.3347 0.3329 0.3162 0.3201 0.3087 0.3004 0.2635 0.2576 0.2380 0.2298 0.1890 0.2133 0.1806 0.1799
1994* 1995 1996 1997* 1998 1999 2000* 2001 2002 2003* 2004 2005 2006* 2007
Class 1 Vacant 0.0797 0.0772 0.0627 0.0600 0.0614 0.0467 0.0401 0.0626 0.0623 0.0880 0.0444 0.0481 0.0659 0.0784
Class 2 Residential 0.0977 0.0933 0.0896 0.0953 0.0869 0.0784 0.0849 0.0754 0.0706 0.0876 0.0798 0.0743 0.0902 0.0881
Class 3 Apartment 0.2199 0.2033 0.1987 0.2155 0.1950 0.1761 0.1652 0.1569 0.1260 0.1387 0.1183 0.0853 0.1069 0.1074
Class 5a Commercial 0.2658 0.2799 0.2556 0.2602 0.2410 0.2399 0.2238 0.1754 0.1822 0.1905 0.1390 0.1451 0.1306 0.1552
Class 5b Industrial 0.3395 0.3177 0.2608 0.2675 0.2450 0.2259 0.1678 0.1660 0.1139 0.1110 0.1174 0.1129 0.0861 0.1048
1994 1995* 1996 1997 1998* 1999 2000 2001* 2002 2003 2004* 2005 2006 2007*
Class 1 Vacant 0.1274 0.1213 0.0992 0.0913 0.1319 0.1004 0.0772 0.0851 0.0830 0.0856 0.1059 0.0852 0.0794 0.0707
Class 2 Residential 0.0920 0.0988 0.0946 0.0930 0.0978 0.0909 0.0871 0.0915 0.0820 0.0750 0.0898 0.0844 0.0774 0.1000
Class 3 Apartment 0.2318 0.2369 0.2676 0.2146 0.2342
0.2148 0.1874 0.1623 0.1398 0.1379 0.1010 0.1203 0.1127 0.1086
Class 5a Commercial 0.3056 0.2974 0.3545 0.3122 0.2932 0.3071 0.2660 0.2665 0.2548 0.2407 0.1953 0.1941 0.1592 0.1961
Class 5b Industrial 0.3244 0.3460 0.3416 0.3433 0.3435 0.3248 0.2912 0.2950 0.2662 0.2652 0.2365 0.2430 0.2179 0.1990
1994 1995 1996* 1997 1998 1999* 2000 2001 2002* 2003 2004 2005* 2006 2007
Class 1 Vacant 0.1339 0.1296 0.1322 0.1312 0.1288 0.1347 0.1225 0.1122 0.1205 0.1114 0.1004 0.1320 0.0882 0.0788
Class 2 Residential 0.0931 0.0907 0.0971 0.0960 0.0943 0.0972 0.0936 0.0869 0.0966 0.0866 0.0792 0.0918 0.0816 0.0820
Class 3 Apartment 0.2475 0.2495 0.2477 0.2523 0.2333 0.2498 0.2304 0.1824 0.1952 0.1697 0.1118 0.0941 0.1012 0.1041
Class 5a Commercial 0.3314 0.3205 0.3021 0.3096 0.2853 0.3054 0.2762 0.2501 0.2564 0.2296 0.1885 0.2341 0.1752 0.1644
Class 5b Industrial 0.3364 0.3236 0.3319 0.3224 0.3062 0.3265 0.2801 0.2576 0.3086 0.2665 0.2156 0.2753 0.2366 0.2212
*= reassessment year
Source: Illinois Department of Revenue, Table 1 Assessment Ratio Levels, http://www.revenue.state.il.us/AboutIdor/TaxStats/index.htm
Note: Adjusted medians used when available. In 2001 there were insufficient sales in Southwest Class 5b so the countywide median was used. In 2007 there were insufficient sales in Northwest Class
3 so the countywide median was used.
Cook County Median Levels of Assessment, per Illinois Department of Revenue Assessment/Sales Ratio Studies: 1994-2007
Cook County Total
City of Chicago Assessment Triad
Northwest Suburbs Assessment Triad
Southwest Suburbs Assessment Triad

35
0%
5%
10%
15%
20%
25%
30%
35%
40%
1994 1995 1996 1997 1998 1999 2000 2001 2002 2003 2004 2005 2006 2007
Total Cook County Median Levels of Assessment 1994-2007
Source: Illinois Department of Revenue, Table 1 Assessment Ratio Levels, http://www.revenue.state.il.us/AboutIdor/TaxStats/index.htm
1 Vacant
2 Residential
3 Apartment
5b Industrial
5a Commercial

36
0%
5%
10%
15%
20%
25%
30%
35%
40%
1994* 1995 1996 1997* 1998 1999 2000* 2001 2002 2003* 2004 2005 2006* 2007
City of Chicago Triad Median Levels of Assessment 1994-2007
*=reassessment yea
r
1 Vacant
2 Residential
3 Apartment
5b Industrial
5a Commercial
Source: Illinois Department of Revenue, Table 1 Assessment Ratio Levels, http://www.revenue.state.il.us/AboutIdor/TaxStats/index.htm

37
0%
5%
10%
15%
20%
25%
30%
35%
40%
1994 1995* 1996 1997 1998* 1999 2000 2001* 2002 2003 2004* 2005 2006 2007*
Northwest Triad Median Levels of Assessment 1994-2007
*=reassessment year
1 Vacant
2 Residential
3 Apartment
5b Industrial
5a Commercial
Source: Illinois Department of Revenue, Table 1 Assessment Ratio Levels, http://www.revenue.state.il.us/AboutIdor/TaxStats/index.htm

38
0%
5%
10%
15%
20%
25%
30%
35%
40%
1994 1995 1996* 1997 1998 1999* 2000 2001 2002* 2003 2004 2005* 2006 2007
Southwest Triad Median Levels of Assessment 1994-2007
*=reassessment year
1 Vacant
2 Residential
3 Apartment
5b Industrial
5a Commercial
Source: Illinois Department of Revenue, Table 1 Assessment Ratio Levels, http://www.revenue.state.il.us/AboutIdor/TaxStats/index.htm

39
APPENDIX E: HOMESTEAD EXEMPTIONS
Statute Name Eligibility Tax Year 2008 Amount Restrictions on Other Exemptions
Year
Created
Application
Made To
35 ILCS
20/15-165
Disabled Veterans'
Exemption
For disabled veteran homeowners and
their spouses
Property up to an assessed value of $70,000 is
exempted from taxation
Cannot also receive the Disabled
Persons' Exemption or the Disabled
Veterans' Standard Homestead
Exemption 1970
Illinois
Department of
Veterans'
Affairs
35 ILCS
200/15-167
Returning Veterans'
Homestead
Exemption
For veteran homeowners upon the year
of their return from an armed conflict $5,000 of EAV None 2007 Assessor
35 ILCS
200/15-168
Disabled Persons'
Homestead
Exemption
For disabled homeowners unable to
engage in substantial gainful activity by
reason of physical or mental impairment $2,000 of EAV
Cannot also receive the Disabled
Veterans' Exemption or the Disabled
Veterans' Standard Homestead
Exemption 2007 Assessor
35 ILCS
200/15-169
Disabled Veterans'
Standard Homestead
Exemption
For disabled veteran homeowners and
their spouses
$2,500 of EAV for 50% to 75% disability, $5,000 of
EAV for at least 75% disability
Cannot also receive the Disabled
Persons' Homestead Exemption or the
Disabled Veterans' Homestead
Exemption 2007 Assessor
35 ILCS
200/15-170
Senior Citizens
Homestead
Exemption For homeowners at least 65 years old $4,000 of EAV None 1970 Assessor
35 ILCS
200/15-172
Senior Citizens
Assessment Freeze
Homestead
Exemption
For homeowners at least 65 years old
and with household income under
$55,000 (in tax year 2008 and after),
freezes EAV at time of first application
Varies, equal to difference between current EAV
and base year EAV at time of first application None 1994 Assessor
35 ILCS
200/15-175
General Homestead
Exemption
For all homeowners outside Cook
County on their primary residence
Difference between 1977 EAV and current EAV up
to a maximum of $5,500 of EAV for tax year 2008,
and $6,000 of EAV for tax year 2009 and after None 1978 Assessor
35 ILCS
200/15-176
Alternative General
Homestead
Exemption
For all Cook County homeowners on
their primary residence
Varies, equal to difference between base year EAV
at time of first application and 7% per year growth
in EAV. Depends on assessment triad. 2008
maximum is $33,000 of EAV for South Triad and
minimum $5,500 of EAV. None 2004 Assessor
35 ILCS
200/15-177
Long-time Occupant
Homestead
Exemption
F
or
C
oo
k
C
oun
t
y
h
omeowners on
th
e
i
r
primary residence. Must have total
household income of $100,000 or less
and have lived in the home for 10
consecutive years, or 5 years if received
government assistance to acquire the
property
Varies, equal to difference between base year EAV
at time of first application and 7% per year growth
in EAV if income is $75,000 or less; 10% per year
EAV increase limit if income is from $75,001 to
$100,000.
Cannot also receive the Alternative
General Homestead Exemption or
Senior Citizens Assessment Freeze
Homestead Exemption 2007 Assessor
35 ILCS
200/15-180
Homestead
Improvements
For all homeowners on their primary
residence
Up to $75,000 fair cash value of improvements
made to homestead property for up to four years None 1975 Assessor
Homestead Exemptions in Illinois Statutes

40
1999 2000 2001 2002 2003 2004 2005 2006 2007 2008
Homeowner
Exemptions $ 4,280,981,173 $ 4,440,423,559 $ 4,534,354,741 $ 4,063,713,275 $ 7,107,664,604 $ 10,575,198,195 $ 13,296,470,723 $ 16,809,420,592 $ 20,583,778,976 $ 20,825,947,022
Senior Citizens
Assessment Freeze
Exemption $ 481,612,624 $ 650,622,056 $ 982,393,838 $ 1,380,138,793 $ 1,835,245,328 $ 2,534,911,610 $ 3,278,711,041 $ 4,065,142,740 $ 4,567,291,177 $ 5,199,345,016
Senior Citizens
Homestead
Exemption $ 642,370,843 $ 645,963,730 $ 693,381,451 $ 638,568,646 $ 609,264,080 $ 760,845,304 $ 750,013,007 $ 843,575,677 $ 911,394,660 $ 1,087,075,719
Source: Cook County Clerk Equalized Valuations for Split Agencies reports and Agency Tax Rate reports
Note: Homeowner Exemptions include the General Homestead Exemption (1998-2002), Alternative General Homestead Exemption (2003-2008), Homeowner Exemption for Long-term Properties (2000-2004), Long-time Occupant Homestead Exemption (2007-2008), and
the Disabled Veterans' Exemption (1999-2008). The Disabled Veteran's Exemption is included because it could not be extracted from other homeowner exemption data prior to 2007.
Cook County Major Homestead Exemptions EAV: Tax Years 1999-2008
Exemption City of Chicago
Suburban Cook
County Total Cook County
% of Total
Cook
County
Homeowner Exemptions (Alternative
General and Long-time Occupant) $ 7,401,079,882 $ 13,422,348,427
$ 20,823,428,309 76.8%
Senior Citizens Assessment Freeze
Exemption $ 2,375,424,596 $ 2,823,920,420
$ 5,199,345,016 19.2%
Senior Citizens Homestead Exemption $ 398,715,932 $ 688,359,787
$ 1,087,075,719 4.0%
Disabled Persons' Homestead Exemption $ 3,370,000 $ 7,380,356
$ 10,750,356 0.0%
Disabled Veterans' Exemption* $ 355,052 $ 2,163,661
$ 2,518,713 0.0%
Disabled Veterans' Standard Homestead
Exemption $ 940,889 $ 2,333,793
$ 3,274,682 0.0%
Returning Veterans' Exemption $ 120,000 $ 122,500
$ 242,500 0.0%
TOTAL $ 10,180,006,351 $ 16,946,628,944 $ 27,126,635,295 100.0%
Cook County Equalized Assessed Value of Homestead Exemptions, Tax Year 2008
*This exemption is determined by the Illinois Department of Veterans' Affairs and certified to the county clerk. Application for all other exemptions is
made to the county assessor and the amounts are certified to the county clerk. The Homestead Improvements exemption is done by the assessor prior
to equalization and is not included here.
Source: Cook County Clerk Tax Year 2008 Agency Exemption Detail Report

41
APPENDIX F: HOMESTEAD EXEMPTIONS VS. TAXABLE EAV
1999 2000 2001 2002 2003 2004 2005 2006 2007 2008
Exemptions $ 4,454,918,475 $ 4,853,214,214 $ 6,210,130,030 6,082,420,714$ 9,552,174,012$ 13,870,955,109$ 17,325,194,771$ 21,718,139,009$ 26,068,552,833$ 27,126,635,295$
Taxable EAV $85,422,649,430 $90,663,494,088 $ 99,004,746,608 $110,430,379,185 $119,563,591,735 $129,865,412,796 $143,403,234,714 $157,189,565,787 $174,555,020,574 $188,792,890,691
Gross EAV 89,877,567,905$ 95,516,708,302$ 105,214,876,638$ 116,512,799,899$ 129,115,765,747$ 143,736,367,905$ 160,728,429,485$ 178,907,704,796$ 200,623,573,407$ 215,919,525,986$
1999 2000 2001 2002 2003 2004 2005 2006 2007 2008
Exemptions 5.0% 5.1% 5.9% 5.2% 7.4% 9.7% 10.8% 12.1% 13.0% 12.6%
Taxable EAV 95.0% 94.9% 94.1% 94.8% 92.6% 90.3% 89.2% 87.9% 87.0% 87.4%
Gross EAV 100.0% 100.0% 100.0% 100.0% 100.0% 100.0% 100.0% 100.0% 100.0% 100.0%
Source: Cook County Clerk Equalized Valuations for Split Agencies reports and Tax Increment Agency Distribution Summary.
Note: Exemptions include all exemptions listed on Cook County Clerk Equalized Valuations f or Split Agencies reports. Taxable EAV includes the EAV available to taxing agencies and TIF increment EA V.
Cook County Homestead Exemptions Compared to Taxable EAV: Tax Years 1999-2008
Homestead Exemptions as Percent of Gross EAV
