
by Kevin A. Park and Joshua J. Miller
413
Cityscape: A Journal of Policy Development and Research • Volume 25, Number 2 • 2023
U.S. Department of Housing and Urban Development • Office of Policy Development and Research
Cityscape
Policy Briefs
The Policy Briefs department summarizes a change or trend in national policy that may have
escaped the attention of researchers. The purpose is to stimulate the analysis of policy in the
field while the policy is being implemented and thereafter. If you have an idea for future Policy
Briefs, please contact david.l.har[email protected].
Mortgage Risk and Disparate Impact
Associated With Student Debt
Kevin A. Park
Joshua J. Miller
U.S. Department of Housing and Urban Development
The views and opinions expressed in this article are those of the authors and do not necessarily reflect
the official policy or position of any agency of the U.S. Government. This work was authored as part
of the authors’ official duties as employees of the U.S. Government and is therefore a work of the U.S.
Government. In accordance with 17 USC 105, no copyright protection is available for such works under
U.S. Law. The U.S. Government is granting a nonexclusive license to publish the article.
Abstract
Student debt payments represent a barrier to homeownership because student loan debt increases
the diculty in qualifying for a mortgage and decreases the amount of income available to sustain
homeownership. Yet student loans are dierent from other types of debt, such as automobile loans and
credit card debt, because student loans represent a direct investment in human capital, and higher
educational attainment is associated with higher lifetime earnings. To explore the eect of student loan
debt in mortgage performance, the authors disaggregate the back-end debt-to-income ratio commonly
used in mortgage underwriting into payments on mortgage, student debt, and other debt. The authors
find that the presence of student debt is associated with a lower risk of mortgage default, all else equal.
However, while disaggregating debt ratios improves the ability to assess default risk and could expand
overall access to credit, it also increases the disparate impact on most non-White borrowers.

Park and Miller
414
Policy Briefs
Introduction
Federal student loan debt is owed by over 43 million borrowers with an average outstanding
balance of over $37,000 (Hanson, 2022). Many borrowers view student loan debt as a significant
barrier to major lifetime milestones, including homeownership.
Several researchers have examined the relationship between student loan debt and
homeownership; however, no researchers to the authors’ knowledge have examined the effect of
student loan debt on mortgage performance. Understanding the relationship between student loan
debt and timely mortgage payments is important because student debt payments affect the “back-
end” debt-to-income (DTI) ratio, a common risk factor in mortgage underwriting. The DTI ratio is
the sum of all required monthly debt payments as a share of the borrower’s income but does not
distinguish between types of nonmortgage debt. Payments on student loans are traditionally treated
the same as consumer debt in mortgage underwriting.
However, student debt may instead be considered an investment in human capital. Graduates earn
significantly more than workers that did not attend college. On the other hand, the net wealth
premium associated with higher education has declined, possibly due to the increasing cost of
college being financed with rising student debt (Emmons, Kent, and Rickets, 2019). To the extent
that student debt also hinders qualifying for a mortgage, it also indirectly limits borrowers from the
wealth-building potential of homeownership (Stegman, Quercia, and Davis, 2007).
To explore the effect of student loan debt in mortgage performance, the authors disaggregate the
back-end DTI ratio commonly used in mortgage underwriting into payments on mortgage, student,
and other debt. Findings show that student debt is associated with a lower risk of default overall.
This finding is likely because student debt is correlated with higher educational attainment, which
is not observed or used in mortgage underwriting. Obtaining a college or graduate degree increases
the potential income of the borrower. Borrowers with student debt that do not graduate likely
experience the worst outcomes.
However, while disaggregating debt ratios improves the ability to assess default risk and could
expand overall access to credit, it also increases the disparate impact on most non-White
borrowers. As with the debate over the progressiveness of student debt forgiveness,
1
the disparate
impact of student debt in mortgage underwriting is complicated. Black borrowers are more likely
to have student debt than White borrowers, but Hispanic and other minority borrowers are less
likely. Therefore, discounting student debt in underwriting increases the likelihood of approval for
Black and White borrowers but not Hispanic and others relative to the baseline of only using the
overall DTI ratio.
Literature Review
The literature on student loan debt and economic outcomes is broad. The presence and
accumulation of student loan debt is shown to affect numerous milestones and economic
1
For example, Looney (2022) argues student debt forgiveness is regressive, whereas Perry, Steinbaum, and Romer (2021)
argue it is not. See also Leonhardt (2018).

Mortgage Risk and Disparate Impact Associated With Student Debt
415
Cityscape
outcomes. Studies have found, for example, that student loan debt is associated with delayed
marriage (Bozick and Estacion, 2014; Gicheva, 2011; Stone, Van Horn, and Zukin, 2012) and
childrearing (Nau, Dwyer, and Hodson, 2015; Sieg and Wang, 2017).
Another relevant strand of the literature looks at the relationship between student loan debt
and the financial health of borrowers post-schooling, such as repayment difficulties. Using the
2007–2009 Survey of Consumer Finances, Elliott and Nam (2013) find lower net worth for those
with high student loan debt, and Thompson and Bricker (2014) find families with student loans
more likely to be 60 or more days late paying bills. In addition, the research consistently finds high
student loan debt is not a strong predictor of repayment difficulties (Baum and Johnson, 2016;
Dynarski and Kreisman, 2013). Instead, high student loan debt is associated with higher levels of
degree attainment and completion. A recent study from Baum and Looney (2020) found that those
with professional and doctorate degrees, only 3 percent of the population sampled, held 20 percent
of the outstanding student loan debt.
In the context of homeownership, the relationship between student loan debt and homeownership
is also well examined. However, the findings are mixed between studies finding no relationship
between student loan debt and homeownership (Velez, Cominole, and Bentz, 2019; Zhang,
2013), and others finding a negative relationship between student loan debt and homeownership
(Bleemer et al., 2017; Mezza et al., 2016; Miller and Nikaj, 2018). The conflicting results are likely
explained by two factors. First, student loan debt is not randomly assigned, and selection into
student loan debt and homeownership are correlated. Studies have addressed this concern through
instrumental variables (Houle and Berger, 2015; Mezza et al., 2020; Velez, Cominole, and Bentz,
2019). The second concern is omitted variables. Dynarski (2016) and Miller and Nikaj (2018) find
degree completion to be an important consideration.
The literature on student loan debt is extensive. Prior studies find a direct relationship between
student loan debt and adult milestones such as marriage, childrearing, and homeownership.
Although the student loan literature is informative, this article may be the first to examine the
relationship between student loan debt and mortgage performance.
Data
To conduct the analysis, the authors obtained information on borrower characteristics and loan
performance from the National Mortgage Database (NMDB). The NMDB program is administered
by the Federal Housing Finance Agency (FHFA) and combines credit attributes and performance
data from a 1-in-20 sample of residential first lien mortgages from one of the three primary credit
bureaus with administrative records and information from the Home Mortgage Disclosure Act.
The authors examined owner-occupied home purchase mortgages originated between 2014
and 2018 and observed performance through 2019, ending before the COVID-19 pandemic.
Observations are restricted to loans with at least one borrower with a credit score and where
the reported back-end DTI ratio used in underwriting is greater than or equal to the sum of the
mortgage and any student debt payments reported to the credit bureau. Borrowers with student
debt are defined as any nonzero student debt balances when the mortgage was originated. The

Park and Miller
416
Policy Briefs
student debt payment is defined as the median nonzero student debt payment between the two
quarters prior to and after origination for those with a nonzero student debt balance at origination.
These parameters result in a sample of roughly 800,000 loan borrowers, of whom 29 percent had
student debt at the time of origination. Exhibit 1 provides descriptive statistics on the loans and
borrowers. Non-Hispanic White borrowers account for nearly three-fourths of all borrowers. Exhibit
2 shows Black borrowers are more likely to have student debt than White borrowers, but other
minority groups are less likely. This pattern among mortgage borrowers by race and ethnicity reflects
a similar distribution of debt among recent graduates. For example, among 2015–16 bachelor’s
degree recipients, 86.3 percent of Black graduates still owed on federal student loan debt 12 months
after completion—compared to 70.1 percent of Hispanic graduates, 67.7 percent of White graduates,
and 43.9 percent of Asian graduates (National Center for Education Statistics, 2021).
Exhibit 1
Descriptive Statistics
Description
No Student Debt With Student Debt
All
Non-Hispanic
White
All Other
Non-Hispanic
White
All Other
Share of Loans 52.4 18.3 22.2 7.1 100.0
DTI Ratio (%)
35.1 38.4 37.5 40.8 36.7
(10.1) (9.8) (9.1) (9.0) (9.9)
Front-End
21.4 25.6 20.5 23.5 22.1
(9.3) (9.9) (7.8) (8.5) (9.2)
Student
3.7 3.3 1.0
(3.4) (3.3) (2.4)
Credit Score
734 718 719 699 725
(66) (66) (59) (60) (65)
CLTV Ratio (%)
82.3 85.5 89.3 91.2 85.1
(19.5) (17.0) (14.2) (12.8) (17.9)
ARM (%) 19.7 20.4 16.3 14.1 18.8
Term≤15 (%) 31.7 26.8 22.0 17.7 28.2
Default Rate (%) 12.3 14.4 11.8 16.6 12.9
ARM = adjustable-rate mortgage. CLTV = combined loan-to-value. DTI = debt-to-income.
Note: Standard deviation is indicated using parentheses.
Source: National Mortgage Database

Mortgage Risk and Disparate Impact Associated With Student Debt
417
Cityscape
Exhibit 2
Share of Mortgage Borrowers With Student Debt by Race/Ethnicity
Share With Student Debt (%)
50
40
30
20
10
0
Other/Two+
Race/Ethnicity
TotalBlackHispanicWhite
29.8
26.4
42.5
20.3
29.3
Source: National Mortgage Database
The average back-end DTI ratio is nearly 37 percent. Student debt payments account for roughly 3.6
percent of borrower income on average. Borrowers with student debt have higher overall DTI ratios
even though the share of income devoted to mortgage payments is lower, which suggests student
debt is constraining housing consumption. Borrowers with student debt also have lower credit
scores and higher combined loan-to-value (CLTV) ratios than borrowers without student debt.
Methodology
To explore the effect of student loan debt in mortgage performance, the authors define default as
the first instance of a 90-day delinquency in the mortgage tradeline and utilize a Cox proportional
hazard model. The Cox proportional hazard model is defined as—
λ
(t) =
λ
0
(t)e
f(x)
f(x) =
βΩ
+
γ
DTI +
δ
STD
Where
λ
0
is an unspecified baseline hazard, and Ω represents a vector of common underwriting
factors at loan origination, including credit score, CLTV ratio, and binary indicators of adjustable
interest rates and loan terms less than or equal to 15 years. STD represents a binary indicator of a
nonzero student debt balance in the quarter in which the mortgage was originated. DTI represents
various formulations of the debt-to-income ratio. In addition to the commonly used overall back-
end DTI ratio, the authors also include separate ratios for mortgage principal, interest, tax, and
insurance payments (payment-to-income [PTI] ratio) and student debt payments relative to income
(STDTI ratio). The remaining back-end DTI ratio excludes these subcomponents when they are
included directly as separate explanatory variables.

Park and Miller
418
Policy Briefs
The linear combination of observation values and the estimated coefficients from these
specifications are then used to create risk scores that can be evaluated for predictiveness of default
and disparate impact with respect to race and ethnicity. The authors use Kolmogorov-Smirnov (KS)
statistics to summarize both impacts. The statistic is computed as the maximum difference in the
empirical distribution functions of two subpopulations, F
1
and F
2
, based on the linear combination
of borrower characteristics and estimated coefficients.
For evaluating the predictiveness of difference specifications, F
1
is the empirical distribution of
mortgages that did not default within 24 months of origination, and F
2
is the distribution of loans
that defaulted. The maximum difference is referred to as the Risk KS statistic. For evaluating disparate
impact, F
1
is the empirical distribution of non-Hispanic White borrowers, and F
2
is the distribution of
other racial or ethnic groups. The maximum difference is referred to as the Race KS statistic.
Findings
Exhibit 3 shows the cumulative default hazard by whether the borrowers have any student debt.
Overall, student debt is associated with a slightly higher cumulative default hazard.
Exhibit 3
Cumulative Default Hazard
Source: National Mortgage Database

Mortgage Risk and Disparate Impact Associated With Student Debt
419
Cityscape
Hazard Model
Exhibit 4 presents select results of the Cox proportional hazard model of default related to student
debt and DTI ratio. As expected, higher credit scores and shorter loan terms are associated with
lower default risk, whereas higher CLTV ratios are associated with greater risk. Controlling for
these risks, a 1-percentage-point increase in the back-end DTI ratio is associated with roughly a
2-percent increase in the likelihood of default.
Exhibit 4
Cox Proportional Hazard Model
(1) (2) (3) (4) (5) (6)
Any Student
Debt
0.8974*** 0.9533** 1.1240***
(0.0134) (0.0145) (0.0225)
DTI Ratio
†
1.0211*** 1.0216*** 1.0124*** 1.0129*** 1.0143*** 1.0139***
(0.0008) (0.0008) (0.0009) (0.0009) (0.0009) (0.0009)
Front-End
1.0319*** 1.0318*** 1.0318*** 1.0320***
(0.0009) (0.0009) (0.0009) (0.0009)
Student
0.9769*** 0.9618***
(0.0032) (0.0044)
Credit Score
0.9840*** 0.9840*** 0.9839*** 0.9839*** 0.9840*** 0.9840***
(0.0001) (0.0001) (0.0001) (0.0001) (0.0001) (0.0001)
CLTV Ratio
1.0112*** 1.0115*** 1.0105*** 1.0106*** 1.0108*** 1.0106***
(0.0005) (0.0005) (0.0006) (0.0006) (0.0006) (0.0006)
Term≤15
0.7864*** 0.7817*** 0.8530*** 0.8489*** 0.8419*** 0.8474***
(0.0244) (0.0242) (0.0264) (0.0263) (0.0260) (0.0262)
ARM
0.5486*** 0.5452*** 0.5630*** 0.5612*** 0.5567*** 0.5585***
(0.0382) (0.0380) (0.0392) (0.0391) (0.0388) (0.0389)
AIC 14127671 14126530 14117171 14116959 14113836 14113056
²
30492*** 30639*** 32274*** 32289*** 32630*** 32759***
AIC = Akaike information criterion. ARM = adjustable-rate mortgage. CLTV = combined loan-to-value. DTI = debt-to-income.
* Statistically significant at the 0.050 level. ** Statistically significant at the 0.010 level. *** Statistically significant at the 0.001 level.
† = back-end DTI ratio excluding components directly included.
Note: Standard errors are shown in parentheses.
Source: National Mortgage Database
The second column includes a binary indicator of whether the borrower has any student debt
at the time of origination. The estimated hazard ratio indicates borrowers with student debt are
associated with a 10-percent reduction in the likelihood of default, all else equal.
The third and fourth columns disaggregate the back-end DTI ratio into the front-end DTI ratio (PTI
ratio) and the remainder; this reveals that a 1-percentage-point increase in the share of income
devoted to the mortgage payment increases the likelihood of default more than a 1-percentage-point
increase in share of income devoted to other forms of debt. Having student debt is still associated
with a small but statistically significant reduction in the likelihood of default (fourth column).

Park and Miller
420
Policy Briefs
The fifth and sixth columns further disaggregate the back-end DTI ratio into the front-end ratio,
the STDTI ratio, and the remainder. A higher share of income devoted to student debt payments is
associated with a decrease in the likelihood of default.
NMDB provides the overall DTI ratio as reported in the administrative data. The PTI ratio is the
escrow payment reported by the credit bureau with some imputation by FHFA. As a robustness
check, the authors replace these ratios with the median overall debt and escrow payments only as
reported by the credit bureau data, comparable to how student debt payments are computed. The
results shown in appendix A are substantively similar.
Kolmogorov-Smirnov Statistics
The linear combination of borrower characteristics and estimated coefficients presented in exhibit
4 can be converted into measures of predicted risk. Exhibit 5A plots the cumulative distribution of
loans that defaulted within 24 months and all other loans by the risk score derived from the first
specification. Borrowers that defaulted generally have higher risk scores than borrowers that did
not. The maximum difference between the two cumulative distributions (Risk KS statistic) is 55.1
percentage points.
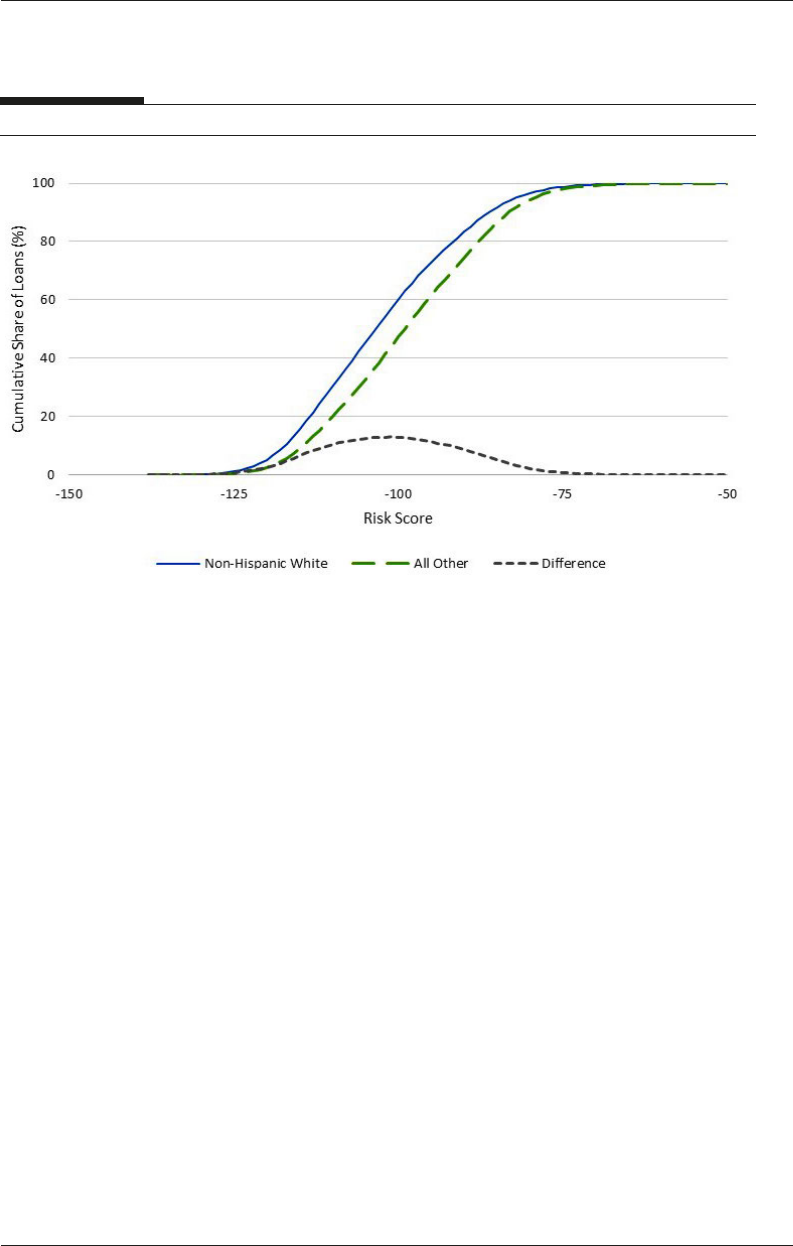
Exhibit 5B is a similar chart showing the cumulative distributions for non-Hispanic White
borrowers and borrowers of all other races and ethnicities. Based on their risk factors, White
borrowers have lower average levels of predicted risk. The maximum difference between the two
cumulative distributions (Race KS statistic) is 13.0 percentage points.
Exhibit 5
Cumulative Distributions and Kolmogorov-Smirnov Statistics (1 of 2)
A. By 24-Month Default
Mortgage Risk and Disparate Impact Associated With Student Debt
421
Cityscape
Exhibit 5
Cumulative Distributions and Kolmogorov-Smirnov Statistics (2 of 2)
B. By Race/Ethnicity
Source: National Mortgage Database
Risk and Race KS statistics are found for scores derived from each of the six specifications shown
in exhibit 4. In addition, seventh and eighth scores are computed using the fifth and sixth
specifications, respectively, except excluding components related to student debt (that is, any
student debt indicator and student debt payment to income ratio). These scores represent scenarios
in which student debt is not included in DTI ratio calculations at all. The overall results are
reported in the first two columns of exhibit 6 and displayed in exhibit 7A with the Risk KS on the
x-axis and the Race KS on the y-axis. Disaggregating back-end DTI ratio into mortgage payments,
student debt payments, and other debt payments improves the predictiveness of the derived risk
score, exhibited by higher Risk KS statistics. However, the improvement in predictiveness comes
with greater disparate impact, exhibited by higher Race KS statistics. Disaggregating DTI ratio but
excluding student debt from the risk score (that is, not rewarding borrowers spending a high share
of income on student debt) actually reduces its predictiveness.

Park and Miller
422
Policy Briefs
Exhibit 6
Risk and Race Kolmogorov-Smirnov Statistics
Non-Hispanic
White Versus
All Others Hispanic Black
Score
(1)
Risk
(2)
Race
(3)
Risk
(4)
Race
(5)
Risk
(6)
Race
1 55.10 13.00 54.75 20.32 55.97 30.86
2 55.26 13.24 54.93 20.62 56.07 30.70
3 55.37 14.26 54.77 21.62 56.16 31.43
4 55.45 14.34 54.83 21.74 56.20 31.29
5 55.60 14.61 55.11 22.13 56.51 31.17
6 55.50 14.55 54.96 22.06 56.45 31.28
7 55.51 14.38 54.92 21.80 56.32 31.35
8 55.49 14.39 54.92 21.83 56.31 31.32
Notes: Scores 1–6 are based on the specifications shown in exhibit 4. Scores 7 and 8 are based on the fifth and sixth specifications, respectively, but do not
include components related to student debt.
Source: National Mortgage Database
Exhibit 7
Risk and Race Kolmogorov-Smirnov (1 of 2)
A. Non-Hispanic White Versus All Others

Mortgage Risk and Disparate Impact Associated With Student Debt
423
Cityscape
Exhibit 7
Risk and Race Kolmogorov-Smirnov (2 of 2)
B. Non-Hispanic White Versus Hispanic (Any Race)
C. Non-Hispanic White Versus Non-Hispanic Black
KS = Kolmogorov-Smirnov statistic.
Source: National Mortgage Database
Exhibit 7B and the third and fourth columns of exhibit 6 show the KS statistics when comparing
non-Hispanic White and Hispanic borrowers only. The results are similar (disaggregation improves
predictiveness but worsens disparate impact), and the Race KS statistics are all notably higher.

Park and Miller
424
Policy Briefs
Exhibit 7C and the fifth and sixth columns of exhibit 6 show similar statistics comparing non-
Hispanic White and Black borrowers only. The Race KS statistics are even higher; however,
disaggregating student debt from the nonhousing DTI ratio reduces disparate impact on Black
borrowers relative to White borrowers.
Approval Rates
Measuring the differences in score distributions by race does not account for how a more predictive
underwriting model allows a lender to approve more borrowers. Because the marginal borrower is
more likely to be a minority borrower, this extensive margin may help offset any disparate impact.
Exhibit 8A shows the share of loans that could be approved while keeping the cumulative average
predicted 24-month default rate at 1 percent or less. Exhibit 8B shows the change in number of
approvals relative to the first specification. As expected, a more predictive model allows more
borrowers to be approved while maintaining the same overall level of risk. However, the effects are
heterogeneous: more White and Black borrowers are approved when the DTI ratio is disaggregated
but fewer Hispanic and Other borrowers are approved. This pattern mirrors the differences in the
share of borrowers with student debt.
Exhibit 8
Approval
Variable (1) (2) (3) (4) (5) (6) (7) (8)
A. Approval Rate (%)
White 92.4 92.4 92.7 92.7 92.8 92.8 92.7 92.7
Hispanic 86.7 86.6 86.1 86.1 86.0 86.0 86.1 86.1
Black 78.5 78.9 78.4 78.6 79.0 78.8 78.6 78.6
Other/Two+ 95.3 95.4 95.2 95.2 95.2 95.2 95.2 95.2
Total 91.1 91.2 91.3 91.3 91.4 91.4 91.3 91.3
B. Change in Approvals (%) Relative to (1)
White 0.06 0.35 0.36 0.43 0.43 0.39 0.39
Hispanic – 0.11 – 0.65 – 0.68 – 0.76 – 0.71 – 0.68 – 0.68
Black 0.55 – 0.11 0.16 0.74 0.41 0.14 0.17
Other/Two+ 0.04 – 0.16 – 0.13 – 0.14 – 0.14 – 0.14 – 0.13
Total 0.06 0.17 0.19 0.26 0.25 0.21 0.21
Note: Approval rates assuming overall cumulative average predicted 24-month default rate of 1 percent or less.
Source: National Mortgage Database
Conclusions
Student loan debt is held by a significant number of Americans. Further, researchers have shown
student loan debt to be associated with delays in marriage, childrearing, and homeownership.
Although student loan research is broad, this article may be the first to look at the relationship
between student loan debt and mortgage performance.

Mortgage Risk and Disparate Impact Associated With Student Debt
425
Cityscape
Student loan debt is included in most mortgage underwriting. Traditionally, student loan debt is
not differentiated from other types of debt, including auto and credit card, in the underwriting
process. One could reasonably argue that student loan debt is distinct from other types of debt
because it represents an identifiable investment in human capital that is associated positively with
future earnings.
This article analyzes the effect of student debt on mortgage performance using data from NMDB.
The authors find that student loan debt is associated with a lower risk of delinquency. The
results are robust to several specifications of student loans, including separate ratios for mortgage
principal, interest, tax and insurance payments, and student debt payments relative to income.
The finding is consistent with the hypothesis that student debt and obtaining a college or graduate
degree increases the potential income of the borrower. Borrowers with student debt that do not
graduate likely experience worse outcomes.
The authors also look at the disparate impact of student debt in mortgage underwriting, finding
that because of variations in the presence and burden of student loan debt by race and ethnicity,
discounting student loan debt in underwriting would increase the likelihood of approval for Black
and White borrowers but not Hispanic and others relative to the baseline of only using the overall
back-end DTI ratio.
The findings of this article are an important first step in understanding the relationship between
student loan debt and mortgage performance. The results suggest that student loan debt is distinct
from other forms of debt, and mortgage underwriting would benefit from separate treatment.
Policy changes, however, to the traditional treatment of student debt should carefully consider
disparate impact.

Park and Miller
426
Policy Briefs
Appendix A
Exhibit A-1
Cox Proportional Hazard Model, Credit Bureau Debt-to-Income
Variable (1) (2) (3) (4) (5) (6)
Any Student Debt
0.8932*** 0.9535** 1.1318***
(0.0132) (0.0147) (0.0227)
DTI Ratio†
1.0152*** 1.0156*** 1.0076*** 1.0080*** 1.0098*** 1.0096***
(0.0005) (0.0005) (0.0006) (0.0006) (0.0006) (0.0006)
Front-End
1.0266*** 1.0263*** 1.0257*** 1.0261***
(0.0008) (0.0008) (0.0008) (0.0008)
Student
0.9703*** 0.9546***
(0.0032) (0.0043)
Credit Score
0.9836*** 0.9837*** 0.9837*** 0.9837*** 0.9838*** 0.9838***
(0.0001) (0.0001) (0.0001) (0.0001) (0.0001) (0.0001)
CLTV Ratio
1.0112*** 1.0114*** 1.0108*** 1.0109*** 1.0110*** 1.0108***
(0.0006) (0.0006) (0.0006) (0.0006) (0.0006) (0.0006)
Term≤15
0.7855*** 0.7816*** 0.8463*** 0.8422*** 0.8339*** 0.8396***
(0.0243) (0.0242) (0.0262) (0.0261) (0.0258) (0.0260)
ARM
0.5683*** 0.5657*** 0.5709*** 0.5698*** 0.5672*** 0.5686***
(0.0396) (0.0394) (0.0398) (0.0397) (0.0395) (0.0396)
AIC 14108182 14106939 14099969 14099764 14096339 14095468
χ²
33004*** 33290*** 33414*** 33558*** 34242*** 34299***
AIC = Akaike information criterion. ARM = adjustable-rate mortgage. CLTV = combined loan-to-value. DTI = debt-to-income.
* Statistically significant at the 0.050 level. ** Statistically significant at the 0.010 level. *** Statistically significant at the 0.001 level.
† = back-end DTI ratio excluding components directly included.
Note: Standard errors shown in parentheses.
Source: National Mortgage Database
Acknowledgments
The authors would like to thank the National Mortgage Database staff at the Federal Housing Finance
Agency, including but not limited to Robert Avery, Ian Keith, Saty Patrabansh, and Jay Schultz.
Authors
Kevin A. Park was an economist in HUD’s Office of Policy Development and Research. Joshua J.
Miller is an economist in HUD’s Office of Fair Housing and Equal Opportunity. He can be reached
at Joshua.J.Miller@hud.gov.

Mortgage Risk and Disparate Impact Associated With Student Debt
427
Cityscape
References
Baum, Sandy, and Martha C. Johnson. 2016. Strengthening Federal Student Aid: Reforming the Student
Loan Repayment System. Washington, DC: Urban Institute.
Baum, Sandy, and Adam Looney. 2020. “Who Owes the Most in Student Loans: New Data from the
Fed,” Brookings, October 9.
Bleemer, Zachary, Meta Brown, Donghoon Lee, and Wilbert Van der Klaauw. 2017. Debt, Jobs, or
Housing: What’s Keeping Millennials at Home? Federal Reserve Bank of New York Staff Report No. 700.
Bozick, R., and A. Estacion. 2014. “Do Student Loans Delay Marriage? Debt Repayment and
Family Formation in Young Adulthood,” Demographic Research 30 (69): 1865–1891. doi:10.4054/
DemRes.2014.30.69.
Dynarski, Susan M. 2016. “The Dividing Line Between Haves and Have-Nots in Home
Ownership: Education, Not Student Debt.” Economic Studies at Brookings Evidence Speaks Reports
1 (17). https://www.brookings.edu/research/the-dividing-line-between-haves-and-have-nots-in-
home-ownership-education-not-student-debt/.
Dynarski, Susan M., and Daniel Kreisman. 2013. Loans for Educational Opportunity: Making
Borrowing Work for Today’s Students. Washington, DC: The Brookings Institution.
Elliott, W., and I. Nam. 2013. “Is Student Debt Jeopardizing the Short-Term Financial Health of
U.S. Households?” Federal Reserve Bank of St. Louis Review 95 (5): 405–424.
Emmons, William R., Ana H. Kent, and Lowell R. Ricketts. 2019. “Is College Still Worth It? The
New Calculus of Falling Returns,” Federal Reserve Bank of St. Louis Review 101 (4): 297–329.
Gicheva, D. 2011. Does the Student-Loan Burden Weigh into the Decision to Start a Family?
Department of Economics Working Paper Series. Greensboro, NC: University of North Carolina
at Greensboro.
Hanson, Melanie. 2022. “Student Loan Debt Statistics,” Education Data Initiative, February 10.
https://educationdata.org/student-loan-debt-statistics.
Houle, Jason N., and Lawrence Berger. 2015. “Is Student Loan Debt Discouraging Homeownership
Among Young Adults?” Social Service Review 89 (4): 589–621.
Leonhardt, David. 2018. “Eliminating All Student Debt Isn’t Progressive,” New York Times,
November 18.
Looney, Adam. 2022. Student Loan Forgiveness is Regressive Whether Measured by Income, Education,
or Wealth. Washington, DC: Hutchins Center on Fiscal & Monetary Policy at Brookings.
https://www.brookings.edu/research/student-loan-forgiveness-is-regressive-whether-measured-
by-income-education-or-wealth/.

Park and Miller
428
Policy Briefs
Mezza, Alvaro, Daniel Ringo, Shane Sherlund, and Kamila Sommer. 2020. “Student Loans and
Homeownership,” Journal of Labor Economics 38 (1): 215–260.
———. 2016. On the Effect of Student Loans on Access to Homeownership. Washington, DC: Divisions
of Research & Statistics and Monetary Affairs, Federal Reserve Board.
Miller, Joshua J., and Silda Nikaj. 2018. “Student Loan Debt, Educational Attainment, and Tenure
Choice,” Education Economics 26 (4): 393–410.
National Center for Education Statistics. 2021. “Loans for Undergraduate Students,”
Conditions of Education. U.S. Department of Education, Institute of Education Sciences.
https://nces.ed.gov/programs/coe/indicator/cub.
Nau, M., R.E. Dwyer, and R. Hodson. 2015. “Can’t Afford a Baby? Debt and Young Americans,”
Research in Social Stratification and Mobility 42: 114–122. doi:10.1016/j.rssm.2015.05.003.
Perry, Andre M., Marshall Steinbaum, and Carl Romer. 2021. Student Loans, the Racial
Wealth Divide, and Why We Need Full Student Debt Cancellation. The Brookings Institution.
https://www.brookings.edu/research/student-loans-the-racial-wealth-divide-and-why-we-need-
full-student-debt-cancellation/.
Sieg, H., and Y. Wang. 2017. The Impact of Student Debt on Education, Career, and Marriage
Choices of Female Lawyers. NBER Working Paper No. 23453. Cambridge, MA: National Bureau of
Economic Research.
Stegman, Michael A., Roberto G. Quercia, and W. Davis. 2007. “The Wealth-Creating Potential of
Homeownership,” Chasing the American Dream: New Perspectives on Affordable Homeownership 171.
Stone, Charley, Carl Van Horn, and Cliff Zukin. 2012. “Chasing the American Dream: Recent
College Graduates and the Great Recession.” Work Trends. New Brunswick, NJ: Rutgers, The State
University of New Jersey, John J. Heldrich Center for Workforce Development.
Thompson, J., and J. Bricker. 2014. Does Education Loan Debt Influence Household Financial
Distress? An Assessment Using the 2007-09 SCF Panel, Finance, and Economics Discussion Series.
Washington, DC: Divisions of Research & Statistics and Monetary Affairs, Federal Reserve Board.
Velez, Erin, Melissa Cominole, and Alexander Bentz. 2019. “Debt Burden After College: The Effect
of Student Loan Debt on Graduates’ Employment, Additional Schooling, Family Formation, and
Home Ownership,” Education Economics 27 (2): 186–206.
Zhang, L. 2013. “Effects of College Educational Debt on Graduate School Attendance and Early Career
and Lifestyle Choices,” Education Economics 21 (2): 154–175. doi:10.1080/09645292.2010.545204.
