
EPA/540/1-89/002
December 1989
Risk Assessment
Guidance for Superfund
Volume I
Human Health Evaluation Manual
(Part A)
Interim Final
Office of Emergency and Remedial Response
U.S. Environmental Protection Agency
Washington, D.C. 20450

Page ii
NOTICE
The policies and procedures set forth here are intended solely as guidance to EPA and other
government employees and contractors. This guidance does not constitute rulemaking by the Agency, and
cannot be relied on to create a substantive or procedural right enforceable by any party in litigation with
the United States. EPA may take action that is at variance with the policies and procedures in this manual
and may change them at any time without public notice.
This interim final guidance is based on policies in the proposed revisions to the National Oil and
Hazardous Substances Pollution Contingency Plan (NCP), which were published on December 21, 1988
(53 Federal Register 51394). The final NCP may adopt policies different than those in this manual and
should, when promulgated, be considered the authoritative source. A final version of this manual will be
published after the revised NCP is promulgated.
Following the date of its publication, this manual is intended to be used as guidance for all human
health risk assessments conducted as part of Superfund remedial investigations and feasibility studies.
Issuance of this manual does not invalidate human health risk assessments completed before (or in
progress at) the publication date and based on previously released Agency guidance.
Comment [A1]: The latest revisions to the
NCP were finalized in 1994. An overview of the
final NCP and a link to the full text are available
at:
http://www.epa.gov/oem/content/lawsregs/ncp
over.htm
This document represents an annotated version of the Risk Assessment Guidance for Superfund (RAGS)
Part A. Since the original publication of this guidance in 1988, EPA has issued a number of guidance
documents, directives and other policy documents that update, supplement, supersede or otherwise affect
RAGS Part A, or contain new information about one or more topics that are substantially addressed in
RAGS Part A. There may be additional supplemental guidance available on EPA's Superfund risk
assessment website
(see http://www.epa.gov/swerrims/riskassessment/risk_superfund.html)
The underlying text of RAGS Part A remains unchanged; any typographical errors or missing text
reflects the PDF original. Annotations have been added to this document as electronic `sticky notes.' To
view the information contained in a sticky note, simply place your cursor over it or click it and the text
will expand. To close the note, press the escape key or click on the `X' in the upper righthand corner of
the note header. In addition, the word `link' appears in parentheses near each sticky note. This text is a
hyperlink that users can click to open the relevant document that serves as the source of the information
provided in the note.
All sections of RAGS Part A that have at least one annotation are marked in the Table of Contents
with a blue arrow and highlighted in yellow. Click on the highlighted text in the Table of Contents to
jump to the annotated section of the guidance.
Annotations added: April 2010

Page iii
ABOUT THE REVISION . . .
WHAT IT IS EPA's Human Health Evaluation Manual is a revision of the Superfund Public Health
Evaluation Manual (SPHEM; October 1986); it is Volume I of the two-volume set
called Risk Assessment Guidance for Superfund. This manual has three main parts: the
baseline risk assessment (Part A); refinement of preliminary remediation goals (Part
B); and evaluation of remedial alternatives (Part C). (Only Part A is included in the
first distribution; see below.)
WHO IT'S Risk assessors, risk assessment reviewers, remedial project managers (RPMs), and risk
FOR managers involved in Superfund site cleanup activities will benefit from this revision.
WHAT'S This revision builds upon the process established in SPHEM and provides more
NEW detailed guidance on many of the procedures used to assess health risk. New
information and techniques are presented that reflect the extensive Superfund program
experience conducting health risk assessments at Superfund sites. Policies established
and refined over the years -- especially those resulting from the proposed National Oil
and Hazardous Substances Pollution Contingency Plan (NCP) -- have been updated
and clarified. Additionally, the links between the human health evaluation, the
environmental evaluation, and the remedial investigation/feasibility study (RI/FS)
have been strengthened.
In Part A you will find:
For the risk assessor -- Updated procedures and policies, specific equations and
variable values for estimating exposure, and a hierarchy of toxicity data sources.
For the risk assessment reviewer -- A baseline risk assessment outline for consistent
presentation of risk information and format, and a reviewer's checklist to ensure
appropriate quality and content of the risk assessment.
For the RPM -- A comprehensive overview of the risk assessment process in the
RI/FS, a checklist for RPM involvement throughout the process, and a complete index
for quick reference.
For the risk manager -- An expanded chapter on risk characterization (Chapter 8) to
help summarize and present risk information for the decision-maker, and more
detailed descriptions of uncertainties in the assessment.
DISTRIBU- This manual is being distributed as an interim final document while the proposed NCP
TION PLAN is being finalized. After the final NCP is published, the manual will be updated and
finalized. Parts B and C -- which were not distributed as interim final because they are
highly dependent on possible revisions to the NCP -- will be added. Periodically,
updates of portions of the manual will be distributed.
WHERE TO Toxics Integration Branch
SEND Office of Emergency and Remedial Response
COMMENTS 401 M Street, SW (OS-230)
Washington, DC 20460 Phone: 202-475-9486
Comment [A2]: The latest revisions to the
NCP were finalized in 1994. An overview of the
final NCP and a link to the full text are available
at:
http://www.epa.gov/oem/content/lawsregs/ncp
over.htm

Page iv
WORKGROUP
EPA HEADQUARTERS
Marlene Berg
Office of Emergency and Re medial Response:
David Cooper
Linda Cullen
Carla Dempsey
Steve Golian
Bruce Means
Pat Mundy
Sandra Panetta
Stephanie Irene
Office of Solid Waste:
Georgia Valaoras
Office of Waste Programs Enforcement:
Larry Zaragoza
Office of Solid Waste and Emergency Response:
Charlotte White
Office
of Policy, Planning, and Evaluation:
Craig Zamuda
Joe Freedman
Office of General Counsel:
Rebecca Madison
Office of Research
and Development:
Sue Norton
Frank Gostomski
Office of Water:
Robert Zeller
EPA REGIONAL O
FFICES
Sarah Levinson
Region I:
Dan Bicknell
Region V:
Pamela Blakley
Fred Reitman
Region VI:
Dana Davoli
Region X:
David Tetta
OTHER EPA OFFICES
Cynthia Fuller
Great Lakes National Program Office,
IL:
Office of Health and Environmental
Assessment, OH:
Chris DeRosa
Office of Air Quality
Planning
and Standards, NC:
Fred Hauchman

Page v
TABLE OF CONTENTS
Page
INTRODUCTION
CHAPTER 1 INTRODUCTION ............................................................................................................ 1-1
1.1 OVERVIEW OF THE HUMAN HEALTH EVALUATION PROCESS
IN THE RI/FS ................................................................................................................... 1-2
1.1.1 Project Scoping...................................................................................................1-3
1.1.2 Site Characterization (RI) ................................................................................... 1-4
1.1.3 Feasibility Study ................................................................................................. 1-8
1.2 OVERALL ORGANIZATION OF THE MANUAL...................................................... 1-10
CHAPTER 2 STATUTES, REGULATIONS, GUIDANCE, AND STUDIES RELEVANT
TO THE HUMAN HEALTH EVALUATION ............................................................2-1
2.1 STATUTES, REGULATIONS, AND GUIDANCE GOVERNING HUMAN
HEALTH EVALUATION ................................................................................................2-1
2.1.1 CERCLA AND SARA ....................................................................................... 2-1
2.1.2 NATIONAL CONTINGENCY PLAN (NCP) ................................................... 2-4
2.1.3 Remedial Investigation/ Feasibility Study Guidance..........................................2-5
2.1.4 ARARS GUIDANCE ......................................................................................... 2-7
2.1.5 SUPERFUND EXPOSURE ASSESSMENT MANUAL...................................2-8
2.2 RELATED SUPERFUND STUDIES ............................................................................... 2-8
2.2.1 ENDANGERMENT ASSESSMENTS .............................................................2-9
2.2.2 ATSDR HEALTH ASSESSMENTS ................................................................. 2-9
2.2.3 ATSDR HEALTH STUDIES .......................................................................... 2-10
CHAPTER 3 GETTING STARTED: PLANNING FOR THE HUMAN HEALTH
EVALUATION IN THE RI/FS .................................................................................... 3-1
3.1 GOAL OF THE RI/FS ...................................................................................................... 3-1
3.2 GOAL OF THE RI/FS HUMAN HEALTH EVALUATION ........................................... 3-1
3.3 OPERABLE UNITS ..........................................................................................................3-2
3.4 RI/FS SCOPING ............................................................................................................... 3-2
3.5 LEVEL OF EFFORT/LEVEL OF DETAIL OF THE
HUMAN HEALTH EVALUATION ................................................................................ 3-3
PART A -- BASELINE RISK ASSESSMENT
CHAPTER 4 DATA COLLECTION ..................................................................................................... 4-1
4.1 BACKGROUND INFORMATION USEFUL FOR DATA COLLECTION ...................4-1

Page vi
4.1.1 TYPES OF DATA ..............................................................................................4-1
4.1.2 DATA NEEDS AND THE RI/FS ......................................................................4-2
4.1.3 EARLY IDENTIFICATION OF DATA NEEDS .............................................. 4-3
4.1.4 USE OF THE DATA QUALITY OBJECTIVES (DQO) GUIDANCE .............4-3
4.1.5 OTHER DATA CONCERNS .............................................................................4-4
4.2 REVIEW OF AVAILABLE SITE INFORMATION ....................................................... 4-4
4.3 ADDRESSING MODELING PARAMETER NEEDS..................................................... 4-5
4.4 DEFINING BACKGROUND SAMPLING NEEDS ........................................................ 4-5
4.4.1 TYPES OF BACKGROUND.............................................................................4-5
4.4.2 BACKGROUND SAMPLING LOCATIONS ................................................... 4-8
4.4.3 BACKGROUND SAMPLE SIZE ......................................................................4-8
4.4.4 Comparing Background Samples to Site-Related Contamination ..................... 4-9
4.5 PRELIMINARY IDENTIFICATION OF POTENTIAL HUMAN EXPOSURE .......... 4-10
4.5.1 General Information .......................................................................................... 4-10
4.5.2 Soil.................................................................................................................... 4-11
4.5.3 Ground Water ................................................................................................... 4-12
4.5.4 Surface Water and Sediment ............................................................................. 4-13
4.5.5 Air ..................................................................................................................... 4-14
4.5.6 Biota.................................................................................................................. 4-16
4.6 DEVELOPING AN OVERALL STRATEGY FOR SAMPLE COLLECTION ........... 4-16
4.6.1 Determine Sample Size ..................................................................................... 4-17
4.6.2 Establish Sampling Locations .......................................................................... 4-18
4.6.3 Determine Types of Samples ............................................................................ 4-19
4.6.4 Consider Temporal and Meteorological Factors............................................... 4-20
4.6.5 Use Field Screening Analyses .......................................................................... 4-21
4.6.6 Consider Time and Cost of Sampling ............................................................... 4-21
4.7 QA/QC MEASURES ...................................................................................................... 4-21
4.7.1 SAMPLING PROTOCOL................................................................................ 4-21
4.7.2 Sampling Devices ............................................................................................. 4-22
4.7.3 QC Samples ...................................................................................................... 4-22
4.7.4 Collection Procedures ....................................................................................... 4-22
4.7.5 Sample Preservation ......................................................................................... 4-22
4.8 SPECIAL ANALYTICAL SERVICES .......................................................................... 4-22
4.9
TAKING AN ACTIVE ROLE DURING WORKPLAN DEVELOPMENT AND DATA
COLLECTION ................................................................................................................ 4-22
4.9.1 Present Risk Assessment Sampling Needs at Scoping Meeting ....................... 4-23
4.9.2 Contribute to Workplan and Review Sampling and Analysis Plan .................. 4-23

Page vii
4.9.3 Conduct Interim Reviews of Field Investigation Outputs ................................ 4-24
CHAPTER 5 DATA EVALUATION ..................................................................................................... 5-1
5.1 COMBINING DATA AVAILABLE FROM SITE INVESTIGATIONS ........................ 5-2
5.2 EVALUATION OF ANALYTICAL METHODS ............................................................5-5
5.3 EVALUATION OF QUANTITATION LIMITS .............................................................5-7
5.3.1 Sample Quantitation Limits (SQLs) That Are Greater Than Reference
Concentrations ....................................................................................................5-8
5.3.2 Unusually High SQLs....................................................................................... 5-10
5.3.3 When Only Some Samples in a Medium Test Positive for a Chemical ........... 5-10
5.3.4 When SQLs Are Not Available ........................................................................ 5-11
5.3.5 When Chemicals Are Not Detected In Any Samples in a Medium.................. 5-11
5.4 EVALUATION OF QUALIFIED AND CODED DATA ............................................. 5-11
5.4.1 Types of Qualifiers ........................................................................................... 5-11
5.4.2 Using the Appropriate Qualifiers...................................................................... 5-16
5.5 COMPARISON OF CONCENTRATIONS DETECTED IN BLANKS WITH
CONCENTRATIONS DETECTED IN SAMPLES ....................................................... 5-16
5.6 EVALUATION OF TENTATIVELY IDENTIFIED COMPOUNDS ........................... 5-17
5.6.1 When Few TICs are Present ............................................................................ 5-18
5.6.2 When Many TICs Are Present.......................................................................... 5-18
5.7 COMPARISON OF SAMPLES WITH BACKGROUND ............................................. 5-18
5.7.1 Use Appropriate Background Data................................................................... 5-19
5.7.2 Identify Statistical Methods.............................................................................. 5-19
5.7.3 Compare Chemical Concentrations with Naturally Occurring Levels ............. 5-19
5.7.4 Compare Chemical Concentrations with Anthropogenic Levels...................... 5-19
5.8 DEVELOPMENT OF A SET OF CHEMICAL DATA AND INFORMATION
FOR USE IN THE RISK ASSESSMENT ...................................................................... 5-20
5.9 FURTHER REDUCTION IN THE NUMBER OF CHEMICALS (OPTIONAL) ......... 5-20
5.9.1 Conduct Initial Activities.................................................................................. 5-20
5.9.2 Group Chemicals By Class ............................................................................... 5-22
5.9.3 Evaluate Frequency of Detection ...................................................................... 5-22
5.9.4 Evaluate Essential Nutrients ............................................................................. 5-23
5.9.5 Use a Concentration-Toxicity Screen ............................................................... 5-23
5.10 SUMMARY AND PRESENTATION OF DATA .......................................................... 5-24
5.10.1 Summarize Data Collection and Evaluation Results in Text............................ 5-27

Page viii
5.10.2 Summarize Data Collection and Evaluation Results in
Tables and Graphics.......................................................................................... 5-27
CHAPTER 6 EXPOSURE ASSESSMENT........................................................................................... 6-1
6.1 BACKGROUND............................................................................................................... 6-1
6.1.1 Components of an Exposure Assessment ........................................................... 6-1
6.1.2 Reasonable Maximum Exposure ........................................................................6-5
6.2 STEP 1: CHARACTERIZATION OF EXPOSURE SETTING ......................................6-5
6.2.1 Characterize Physical Setting .............................................................................6-5
6.2.2 Characterize Potentially Exposed Populations ................................................... 6-6
6.3 STEP 2: IDENTIFICATION OF EXPOSURE PATHWAYS .........................................6-8
6.3.1 Identify Sources and Receiving Media...............................................................6-8
6.3.2 Evaluate Fate and Transport in Release Media ................................................. 6-11
6.3.3 Identify Exposure Points and Exposure Routes................................................ 6-11
6.3.4 Integrate Information on Sources, Releases, Fate and Transport,
Exposure Points, and Exposure Routes Into Exposure Pathways..................... 6-17
6.3.5 Summarize Information on All Complete Exposure Pathways ........................ 6-17
6.4 STEP 3: QUANTIFICATION OF EXPOSURE: GENERAL CONSIDERATIONS....6-19
6.4.1 Quantifying the Reasonable Maximum Exposure ............................................ 6-19
6.4.2 Timing Considerations...................................................................................... 6-23
6.5 QUANTIFICATION OF EXPOSURE: DETERMINATION OF EXPOSURE
CONCENTRATIONS ..................................................................................................... 6-24
6.5.1 General Considerations for Estimating Exposure Concentrations.................... 6-24
6.5.2 Estimate Exposure Concentrations in Ground Water ....................................... 6-26
6.5.3 Estimate Exposure Concentrations in Soil ........................................................ 6-27
6.5.4 Estimate Exposure Concentrations in Air......................................................... 6-28
6.5.5 Estimate Exposure Concentrations in Surface Water ....................................... 6-29
6.5.6 Estimate Exposure Concentrations in Sediments ............................................. 6-30
6.5.7 Estimate Chemical Concentrations in Food...................................................... 6-30
6.5.8 Summarize Exposure Concentrations for Each Pathway .................................. 6-32
6.6 QUANTIFICATION OF EXPOSURE: ESTIMATION OF CHEMICAL INTAKE ..... 6-32
6.6.1 Calculate Ground-Water and Surface Water Intakes........................................ 6-34
6.6.2 Calculate Soil, Sediment, or Dust Intakes ........................................................ 6-39
6.6.3 Calculate Air Intakes ........................................................................................ 6-43
6.6.4 Calculate Food Intakes...................................................................................... 6-43
6.7 COMBINING CHEMICAL INTAKES ACROSS PATHWAYS .................................. 6-47

Page ix
6.8 EVALUATING UNCERTAINTY .................................................................................. 6-47
6.9 SUMMARIZING AND PRESENTING THE
EXPOSURE ASSESSMENT RESULTS ....................................................................... 6-50
CHAPTER 7 TOXICITY ASSESSMENT ............................................................................................7-1
7.1 TYPES OF TOXICOLOGICAL INFORMATION CONSIDERED IN TOXICITY
ASSESSMENT.................................................................................................................. 7-3
7.1.1 Human Data ........................................................................................................7-3
7.1.2 Animal Data........................................................................................................7-5
7.1.3 Supporting Data .................................................................................................. 7-5
7.2 TOXICITY ASSESSMENT FOR NONCARCINOGENIC EFFECTS ............................7-5
7.2.1 Concept of Threshold .......................................................................................... 7-6
7.2.2 Derivation of an Oral RfD (RfD
o
) ......................................................................7-6
7.2.3 Derivation of an Inhalation RfD (RfD
I
) .............................................................. 7-8
7.2.4 Derivation of a Subchronic RfD (RfD
S
) .............................................................7-8
7.2.5 Derivation of Developmental Toxicant RfD (RfD
dt
) ..........................................7-9
7.2.6 One-Day And Ten-Day Health Advisories ......................................................... 7-9
7.2.7 Verification of RfD
s
.......................................................................................... 7-10
7.3 TOXICITY ASSESSMENT FOR CARCINOGENIC EFFECTS .................................. 7-10
7.3.1 Concept of Nonthreshold Effects ...................................................................... 7-10
7.3.2 Assigning a Weight of Evidence ...................................................................... 7-11
7.3.3 Generating a Slope Factor................................................................................. 7-11
7.3.4 Verification of Slope Factors ............................................................................ 7-13
7.4 IDENTIFYING APPROPRIATE TOXICITY VALUES FOR
SITE RISK ASSESSMENT ........................................................................................... 7-13
7.4.1 Gather Toxicity Information for Chemicals Being Evaluated .......................... 7-13
7.4.2 Determine Toxicity Values for Noncarcinogenic Effects (RfD
s
) ..................... 7-15
7.4.3 Determine Toxicity Values for Carcinogenic Effects (Slope Factors) ............ 7-16
7.5 EVALUATING CHEMICALS FOR WHICH NO TOXICITY VALUES ARE
AVAILABLE .................................................................................................................. 7-16
7.5.1 Route-to-Route Extrapolation .......................................................................... 7-16
7.5.2 Dermal Exposure .............................................................................................. 7-16
7.5.3 Generation of Toxicity Values.......................................................................... 7-17
7.6 UNCERTAINTIES RELATED TO TOXICITY INFORMATION ............................... 7-17
7.7 SUMMARIZATION AND PRESENTATION OF THE
TOXICITY INFORMATION ......................................................................................... 7-20

Page x
7.7.1 Toxicity Information for the Main Body of the Text........................................ 7-20
7.7.2 Toxicity Information for Inclusion in an Appendix.......................................... 7-20
CHAPTER 8 RISK CHARACTERIZATION ...................................................................................... 8-1
8.1 REVIEW OF OUTPUTS FROM THE TOXICITY AND EXPOSURE
ASSESSMENTS ............................................................................................................... 8-1
8.1.1 Gather and Organize Information .......................................................................8-4
8.1.2 Make Final Consistency and Validity Check ...................................................... 8-4
8.2 QUANTIFYING RISKS ...................................................................................................8-6
8.2.1 Calculate Risks for Individual Substances.......................................................... 8-6
8.2.2 Aggregate Risks for Multiple Substances ....................................................... 8-11
8.3 COMBINING RISKS ACROSS EXPOSURE PATHWAYS ........................................ 8-15
8.3.1 Identify Reasonable Exposure Pathway Combinations .................................... 8-15
8.3.2 Sum Cancer Risks ............................................................................................. 8-16
8.3.3 Sum Noncancer Hazard Indices ........................................................................ 8-16
8.4 ASSESSMENT AND PRESENTATION OF UNCERTAINTY .................................... 8-17
8.4.1 Identify and Evaluate Important Site-Specific Uncertainty Factors ................. 8-17
8.4.2 Identify/Evaluate Toxicity Assessment Uncertainty Factors ............................ 8-22
8.5 CONSIDERATION OF SITESPECIFIC HUMAN STUDIES....................................... 8-22
8.5.2 Compare with Other Available Site-Specific Epidemiological or
Health Studies ................................................................................................... 8-24
8.6 SUMMARIZATION AND PRESENTATION OF THE BASELINE RISK
CHARACTERIZATION RESULTS .............................................................................. 8-25
8.6.1 Summarize Risk Information in Text ............................................................... 8-25
8.6.2 Summarize Risk Information in Tables ............................................................ 8-26
CHAPTER 9 DOCUMENTATION, REVIEW, AND MANAGEMENT TOOLS FOR THE
ASSESOR, REVIEWER, AND MANAGER ..............................................................9-1
9.1 DOCUMENTATION TOOLS .......................................................................................... 9-1
9.1.1 Basic Principles .................................................................................................. 9-1
9.1.2 Baseline Risk Assessment Report.......................................................................9-2
9.1.3 Other Key Reports ..............................................................................................9-3
9.2 REVIEW TOOLS .............................................................................................................. 9-3
9.3 MANAGEMENT TOOLS .............................................................................................. 9-14

Page xi
CHAPTER 10 RADIATION RISK ASSESSMENT GUIDANCE .................................................... 10-1
10.1 RADIATION PROTECTION PRINCIPLES AND CONCEPTS ................................... 10-3
10.2 REGULATION OF RADIOACTIVELY CONTAMINATED SITES ........................... 10-8
10.3 DATA COLLECTION .................................................................................................. 10-10
10.3.1 Radiation Detection Methods .........................................................................10-10
10.3.2 Reviewing Available Site Information ...........................................................10-14
10.3.3 Addressing Modeling Parameter Needs ..........................................................10-14
10.3.4 Defining Background Radiation Sampling Needs ..........................................10-14
10.3.5 Preliminary Identification of Potential Exposure............................................10-15
10.3.6 Developing a Strategy for Sample Collection ................................................10-15
10.3.7 Quality Assurance and Quality Control (Qa/Qc) Measures ............................10-16
10.4 DATA EVALUATION .................................................................................................10-16
10.4.1 Combining Data from Available Site Investigations......................................10-17
10.4.2 Evaluating Analytical Methods.......................................................................10-17
10.4.3 Evaluating Quantitation Limits .......................................................................10-17
10.4.4 Evaluating Qualified and Coded Data ............................................................10-20
10.4.5 Comparing Concentrations Detected in Blanks with
Concentrations Detected in Samples ..............................................................10-20
10.4.6 Evaluating Tentatively Identified Radionuclides............................................10-21
10.4.7 Comparing Samples with Background ...........................................................10-21
10.4.8 Developing a Set of Radionuclide Data And Information for Use
in a Risk Assessment ......................................................................................10-21
10.4.9 Grouping Radionuclides by Class ...................................................................10-21
10.4.10 Further Reduction In The Number Of Radionuclides .....................................10-21
10.4.11 Summarizing and Presenting Data..................................................................10-22
10.5 EXPOSURE AND DOSE ASSESSMENT ...................................................................10-22
10.5.1 Characterizing the Exposure Setting ...............................................................10-23
10.5.2 Identifying Exposure Pathways ......................................................................10-23
10.5.3 Quantifying Exposure: General Considerations .............................................10-24
10.5.4 Quantifying Exposure: Determining Exposure Point Concentrations ............10-25
10.5.5 Quantifying Exposure: Estimating Intake and Dose Equivalent ....................10-26
10.5.6 Combining Intakes and Doses Across Pathways ............................................10-27
10.5.7 Evaluating Uncertainty ...................................................................................10-27
10.5.8 Summarizing and Presenting Exposure Assessment Results ..........................10-27
10.6 TOXICITY ASSESSMENT..........................................................................................
10-27
10.6.1 Hazard Identification ......................................................................................10-28
10.6.2 Dose-Response Relationships .........................................................................10-30
10.7 RISK CHARACTERIZATION .....................................................................................10-32

Page xii
10.7.1 Reviewing Outputs from the Toxicity and Exposure Assessments ................10-32
10.7.2 QUANTIFYING RISKS .................................................................................10-32
10.7.3 Combining Radionuclide and Chemical Cancer Risks ..................................10-33
10.7.4 Assessing and Presenting Uncertainties..........................................................10-33
10.7.5 Summarizing and Presenting the Baseline Risk Characterization Results .....10-34
10.8 DOCUMENTATION, REVIEW, AND MANAGEMENT TOOLS FOR THE RISK
ASSESSOR, REVIEWER, AND MANAGER ............................................................. 10-34
PART B -- REFINEMENT OF PRELIMINARY REMEDIATION GOALS
[Reserved]
PART C -- RISK EVALUATION OF REMEDIAL ALTERNATIVES
[Reserved]APPENDICES
APPENDIX A ADJUSTMENTS FOR ABSORPTION EFFICIENCY............................................A-1
A.1 ADJUSTMENTS OF TOXICITY VALUE FROM ADMINISTERED TO ABSORBED
DOSE ............................................................................................................................... A-1
A.2 ADJUSTMENT OF EXPOSURE ESTIMATE TO AN ABSORBED DOSE .................A-3
A.3 ADJUSTMENT FOR MEDIUM OF EXPOSURE..........................................................A-3
APPENDIX B INDEX ............................................................................................................................ B-1

Page xiii
LIST OF EXHIBITS
Exhibit Page
1-1 Risk Information Activities in the RI/FS Process ......................................................................... 1-5
1-2 Part A: Baseeline Risk assessment ............................................................................................... 1-7
2-1 Relationship of documents governing human health Evaluation.................................................. 2-2
2-2 Role of the Human health evaluation in the superfund remedial Process.....................................2-6
4-1 Elements of a Conceptual Evaluation Model................................................................................ 4-6
4-2 Examples of Modeling Parameters for Which Information May Need to be
Obtained During a Site Sampling Investigation ...........................................................................4-7
5-1 Data Evaluation............................................................................................................................. 5-3
5-2 Example of Output Format for Validated Data.............................................................................5-4
5-3 Examples of the Types of Data Potentially Unsuitable for a Quantitative Risk QAssessment ....5-6
5-4 CLP Laboratory Data Qualifiers and Their Potential Use In Quantitative Risk Assessment .....5-12
5-5 Validation Data Qualifiers and Their Potential Use in Quantitative Risk Assessment .............. 5-13
5-6 Example of Table Format for Presenting Chemicals Sampled in Specific Media...................... 5-25
5-7 Example of Table Format For Summarizing Chemicals Of
Potential Concern
in All Media Sampled ................................................................................................................. 5-26
6-1 The Exposure Assessment Process .............................................................................................. 6-3
6-2 Illustration of Exposure Pathways ................................................................................................ 6-9
6-3 Common Chemical Release Sources at Sites in the Absence of Remedial Action ..................... 6-10
6-4 Important Physical/Chemical and Environmental Fate Parameters ............................................ 6-12
6-5 Important Considerations for Determining the Environmental Fate and Transport
of the Chemicals of Potential Concern at a Superfund Site ........................................................ 6-13
6-6 Flow Chart for Fate and Transport Assessments ........................................................................ 6-14
6-7 Matrix of Potential Exposure Routes.......................................................................................... 6-18
6-8 Example of Table Format for Summarizing Complete Exposure Pathways at a Site................. 6-20
6-9 Generic Equation for Calculating Chemical Intakes................................................................... 6-21
6-10 Example of Table Format for Summarizing Exposure Concentrations ...................................... 6-33
6-11 Residential Exposure: Ingestion of Chemicals in Drinking Water
a
(and Beverages Made Using Drinking Water)............................................................................ 6-35
6-12 Residential Exposure: Ingestion of Chemicals in Surface Water While Swimming .................. 6-36
6-13 Residential Exposure: Dermal Contact With Chemicals in Water ............................................. 6-37
6-14 Residential Exposure: Ingestion of Chemicals in Soil................................................................ 6-40
6-15 Residential Exposure: Dermal Contact With Chemicals in Soil................................................. 6-41
6-16 Residential Exposure: Inhalation of Airborne (Vapor Phase) Chemicals................................... 6-44
6-17 Residential Exposure: Food Pathway – Ingestion of Contaminated Fish and Shellfish ............. 6-45
6-18 Residential Exposure: Food Pathway – Ingestion of Contaminated Fruits and Vegetables .......6-44
6-19 Residential Exposure: Food Pathway – Ingestion of contaminated meat, eggs, and
dairy products ............................................................................................................................. 6-48
6-20 Example of Table Format for Summarizing Values Used to Estimate Exposure....................... 6-49
6-21 Example of an Uncertainty Table for Exposure Assessment...................................................... 6-51
6-22 Example of Table Format for Summarizing the Results of the
Exposure Assessment – Current Land Use ................................................................................. 6-52
7-1
Steps in Toxicity Assessment ....................................................................................................... 7-4
7-2 Example of Table Format for Toxicity Values: Potential Noncarcinogenic Effects .................. 7-18
7-3 Example of Table Format for Toxicity Values: Potential Carcinogenic Effects ........................ 7-19
8-1 Steps in Risk Characterization ...................................................................................................... 8-3

Page xiv
8-2 Example of Table Format for Cancer Risk Estimates ...................................................................8-7
8-3 Example of Table Format for Chronic Hazard Index Estimates................................................... 8-8
8-4 Example of Table Format for Subchronic Hazard Index Estimates .............................................8-9
8-5 Example of Presentation of Impact of Exposure Assumptions on Cancer Risk Estimate .......... 8-21
8-6 Example of Presentation of Impact of Exposure Assumptions on Hazard Index Estimate ........8-23
8-7 Example of Presentation of Relative Contribution of Individual Chemicals to
Exposure Pathway and Total Cancer Risk Estimates ................................................................. 8-27
8-8 Example of Presentation of Relative Contribution of Individual Chemicals to
Exposure Pathway and Total Hazard Index Estimates ............................................................... 8-28
9-1 Suggested Outline for a Baseline Risk Assessment Report.......................................................... 9-4
9-2 Reviewer Checklist ....................................................................................................................... 9-9
9-3 Checklist for Manager Involvement ........................................................................................... 9-15
10-1 Radiological Characteristics Of Selected Radionuclides Found at Superfund Sites .................. 10-5
10-2 Types of Field Radiation Detection Instruments ......................................................................10-11
10-3 Types of Laboratory Radiation Detection Instruments .............................................................10-13
10-4 Example of Lower Limits of Detection (LLD) for Selected Radionuclides Using Standard
Analytical Methods ................................................................................................................... 10-18
10-5 Summary of EPA's Radiation Risk Factors ..............................................................................10-31

Page xv
PREFACE
The Comprehensive Environmental
Response, Compensation, and Liability Act
(CERCLA) requires that actions selected to
remedy hazardous waste sites be protective of
human health and the environment. CERCLA also
mandates that when a remedial action results in
residual contamination at a site, future reviews
must be planned and conducted to assure that
human health and the environment continue to be
protected. As part of its effort to meet these and
other CERCLA requirements, EPA has developed
a set of manuals, together entitled Risk Assessment
Guidance for Superfund. The Human Health
Evaluation Manual (Volume I) provides guidance
for developing health risk information at
Superfund sites, while the Environmental
Evaluation Manual (Volume II) provides guidance
for environmental assessment at Superfund sites.
Guidance in both human health evaluation and
environmental assessment is needed so that EPA
can fulfill CERCLA's requirement to protect
human health and the environment.
The Risk Assessment Guidance for
Superfund manuals were developed to be used in
the remedial investigation/feasibility study (RI/FS)
process at Superfund sites, although the analytical
framework and specific methods described in the
manuals may also be applicable to other
assessments of hazardous wastes and hazardous
materials. These manuals are companion
documents to EPA's Guidance for Conducting
Remedial Investigations and Feasibility Studies
Under CERCLA (October 1988), and users should
be familiar with that guidance. The two Superfund
risk assessment manuals were developed with
extensive input from EPA workgroups comprised
of both regional and headquarters staff. These
manuals are interim final guidance; final guidance
will be issued when the revisions proposed in
December 1988 to the National Oil and Hazardous
Substances Pollution Contingency Plan (NCP)
become final.
Although human health risk assessment and
environmental assessment are different processes,
they share certain common information needs and
generally can use some of the same chemical
sampling and environmental setting data for a site.
Planning for both assessments should begin during
Comment [A3]: The latest revisions to the
NCP were finalized in 1994. An overview of the
final NCP and a link to the full text are available
at:
http://www.epa.gov/oem/content/lawsregs/ncp
over.htm
the scoping stage of the RI/FS, and site sampling
and other data collection activities to support the
two assessments should be coordinated. An
example of this type of coordination is the
sampling and analysis of fish or other aquatic
organisms; if done properly, data from such
sampling can be used in the assessment of human
health risks from ingestion and in the assessment
of damages to and
potential effects on the aquatic
ecosystem.
The two manuals in this set target somewhat
different audiences. The Environmental Evaluation
Manual is addressed primarily to remedial project
managers (RPMs) and on-scene coordinators
(OSCs), who are
responsible for ensuring
a
thorough evaluation of potential envi
ronmental
effects at sites. The Environmental Evaluation
Manual is not a detailed "how-to" type of
guidance, and it does
not provide "cookbook"
approaches for evaluation. Instead, it identifies the
kinds of help that RPMs/OSCs are likely
to need
and where they may find
that help. The manual
also provides an
overall framework to be used
in
considering
environmental effects. An
environmental evaluation methods compendium
published by
EPA's Office of Research and
Development,
Ecological Assessments of
Hazardous Waste Sites: A Field and Laboratory
Reference Document (EPA/600/3-89/013), is an
important reference to be
used with the
manual.
The Human Health Evaluation
Manual is
addressed pri
marily to the individuals actually
conducting
health risk assessments for sites, who
frequently are contractors to EPA, other federal
agencies, states, or potentially responsible parties.
It also is targeted to EPA staff, including those
responsible for review and o
versight of risk
assessments (e.g.,
technical staff in the regions)
and those
responsible for ensuring
adequate
evaluation of h uman health risks (i.e., RPMs). The
Human Health Evaluation Manual replaces a
previous EPA guidance document, The Superfund
Public Health Ev
aluation Manual (October 1986),
which should no longer be
used. The new
manual
incorporates lessons learned from application of
the earlier manual and
addresses a number of
issues raised since the earlier manual's publication.
Issuance of the new manual does not invalidate

Page xvi
human health risk assessments completed before
(or in progress at) the publication date.
The Human Health Evaluation Manual
provides a basic framework for health risk
assessment at Superfund sites, as the
Environmental Evaluation Manual does for
environmental assessment. The Human Health
Evaluation Manual differs, however, by providing
more detailed guidance on many of the procedures
used to assess health risk. This additional level of
detail is possible because of the relatively large
body of information, techniques, and guidance
available on human health risk assessment and the
extensive Superfund program experience
conducting such assessments for sites.
Even though the Human Health Evaluation
Manual is considerably more specific than the
Environmental Evaluation Manual, it also is not a
“cookbook,” and proper application of the
guidance requires substantial expertise and
professional judgment.

Page xvii
ACKNOWLEDGEMENTS
This manual was developed by the Toxics Integration Branch (TIB) of EPA's Office of Emergency
and Remedial Response, Hazardous Site Evaluation Division. Linda Cullen provided overall project
management, contract supervision, and technical coordination for the project under the direction of Bruce
Means, Chief of TIB's Health Effects Program.
The EPA Workgroup (comprised of members listed on the following page) provided valuable input
regarding the organization, content, and policy implications of the manual throughout its development.
The project manager especially wishes to acknowledge the assistance of the Workgroup Subcommittee
Chairpersons: Rebecca Madison, Bruce Means, Sue Norton, Georgia Valaoras, Craig Zamuda, and Larry
Zaragoza.
Other significant contributors to the manual included Joan Fisk, Michael Hurd, and Angelo Carasea
of the Analytical Operations Branch (Office of Emergency and Remedial Response); Paul White, Anne
Sergeant, and Jacqueline Moya of the Exposure Assessment Group (Office of Research and
Development); and Barnes Johnson of the Statistical Policy Branch (Office of Policy, Planning, and
Evaluation). In addition, many thanks are offered to the more than 60 technical and policy reviewers who
provided constructive comments on the document in its final stages of development.
ICF Incorporated provided technical assistance to EPA in support of the development of this
manual, under Contract No. 68-01-7389.
Robert Dyer, Chief of the Environmental Studies and Statistics Branch, Office of Radiation
Programs, served as project manager for Chapter 10 (Radiation Risk Assessment Guidance), with
assistance from staff in the Bioeffects Analysis Branch and the regional Radiation Program Managers.
Chapter 10 was prepared by S. Cohen and Associates, Incorporated (SC&A), under Contract No. 68-02-
4375.

CHAPTER 1
INTRODUCTION
The Comprehensive Environmental
Response, Compensation, and Liability Act of
1980, as amended (CERCLA, or "Superfund"),
establishes a national program for responding to
releases of hazardous substances into the
environment.
1
The National Oil and Hazardous
Substances Pollution Contingency Plan (NCP) is
the regulation that implements CERCLA.
2
Among other things, the NCP establishes the
overall approach for determining appropriate
remedial actions at Superfund sites. The
overarching mandate of the Superfund program
is to protect human health and the environment
from current and potential threats posed by
uncontrolled hazardous substance releases, and
the NCP echoes this mandate.
To help meet this Superfund mandate,
EPA's Office of Emergency and Remedial
Response has developed a human health
evaluation process as part of its remedial
response program. The process of gathering and
assessing human health risk information
described in this manual is adapted from well-
established chemical risk assessment principles
and procedures (NAS 1983; CRS 1983; OSTP
1985). It is designed to be consistent with EPA's
published risk assessment guidelines (EPA
1984; EPA 1986a-e; EPA 1988a; EPA 1989a)
and other Agency-wide risk assessment policy.
The Human Health Evaluation Manual revises
and replaces the Superfund Public Health
Evaluation Manual (EPA 1986f).
3
It
incorporates new information and builds on
several years of Superfund program experience
conducting risk assessments at hazardous waste
sites. In addition, the Human Health Evaluation
Manual together with the companion
Environmental Evaluation Manual (EPA 1989b)
replaces EPA's 1985 Endangerment Assessment
Handbook, which should no longer be used (see
Section 2.2.1).
The goal of the Superfund human health
evaluation process is to provide a framework for
developing the risk information necessary to
assist decision-making at remedial sites. Specific
objectives of the process are to:
provide an analysis of baseline risks 4
and help determine the need for action at
sites;
provide a basis for determining levels of
chemicals that can remain onsite and
still be adequately protective of public
health;
provide a basis for comparing potential
health impacts of various remedial
alternatives; and
provide a consistent process for
evaluating and documenting public
health threats at sites.
The human health evaluation process
described in this manual is an integral part of the
remedial response process defined by CERCLA
and the NCP. The risk information generated by
the human health evaluation process is designed
to be used in the remedial investigation/
feasibility study (RI/FS) at Superfund sites.
Although risk information is fundamental to the
RI/FS and to the remedial response program in
general, Superfund site experience has led EPA
to balance the need for information with the
need to take action at sites quickly and to
streamline the remedial process. Revisions
proposed to the NCP in 1988 reflect EPA
program management principles intended to
promote the efficiency and effectiveness of the
remedial response process. Chief among these
principles is a bias for action. EPA's Guidance
for Conducting Remedial Investigations and
Feasibility
Studies Under CERCLA (EPA
1988b) also was revised in 1988 to incorporate
Comment [A4]: The latest revisions to the
NCP were finalized in 1994. An overview of the
final NCP and a link to the full text are available
at:
http://www.epa.gov/oem/content/lawsregs/ncp
over.htm

Page 1-2
management initiatives designed to streamline
the RI/FS process and to make information
collection activities duri ng the RI more efficient.
The Risk Assessment Guidance for Superfund, of
which this Human Health Evaluation Manual is
Volume I,
5
has been developed to reflect
the
emphasis on streamlining the remedial process.
The Human Health Evaluation Manual is
a
companion doc
ument to the RI/FS guidance.
It
provides a basic framework for developing
health risk information at
Superfund sites
and
also gives specific guidance on appropriate
methods and data to use. Users of the
Human
Health Evaluation Manual
should be familiar
with the RI/FS guidance, as well as with other
guidances r
eferenced throughout later chapters
of this
manual.
The Human Health Evaluation Manual is
addressed primarily to the individuals actually
conducting human health evaluations for sites
(frequently contractors to EPA, other federal
agencies, states, or potentially responsible
parties). It also is targeted to EPA staff
responsible for review and oversight of risk
assessments (e.g., technical staff in the regions)
and those responsible for ensuring an adequate
evaluation of human health risks (i.e., remedial
project managers, or RPMs). Although the terms
risk assessor and risk assessment reviewer are
used in this manual, it is emphasized that they
generally refer to teams of individuals in
appropriate disciplines (e.g., toxicologists,
chemists, hydrologists, engineers). It is
recommended that an appropriate team of
scientists and engineers be assembled for the
human health evaluation at each specific site. It
is the responsibility of RPMs, along with the
leaders of human health evaluation teams, to
match the scientific support they deem
appropriate with the resources at their disposal.
Individuals having different levels of
scientific training and experience are likely to
use the manual in designing, conducting, and
reviewing human health evaluations. Because
assumptions and judgments are required in many
parts of the analysis, the individuals conducting
the evaluation are key elements in the process.
The manual is not intended to instruct non-
technical personnel how to perform
technical
evaluations,
nor to allow professionals trained in
one discipline
to perform the work of another.
The Human
Health Evaluation Manual
admittedly
cannot address all site circumstances.
Users of the manual
must
exercise technical and
management judgment, and should consult with
EPA regional risk
assessment contacts
and
appropriate
headquarters staff when
encountering unusual or
particularly complex
technical issues.
The first three chapters
of this
manual
provide background information to help place
the human health e
valuation process
in the
context of the Superfund
remedial process. This
chapter (Chapter 1) summarizes the human
health
evaluation process
during the RI/FS. The
three
main parts of this process
– baseline
risk
assessment, refinement of preliminary
remediation goals, and remedial alternatives risk
evaluation – are described in detail
in
subsequent chapters. Chapter
2 discusses in
a
more general way the role of risk information in
the overall Superfund remedial program by
focusing on the statutes, regulations, and
guidance relevant to the human health
evaluation.
Chapter 2 also identifies and
contrasts Superfund studies related to the human
health evaluation. Chapter 3 discusses issues
related to planning for th
e human h
ealth
evaluation.
1.1
OVERVIEW OF THE HUMAN
HEALTH EVALUATION
PROCESS
IN THE RI/FS
Section 300.430 of the proposed revised
NCP reiterates that the purpose
of the remedial
process is to implement remedies that reduce,
control,
or eliminate
risks to
human health and
the environment. The remedial investigation and
feasibility study (RI/FS) is the
methodology
that
the Superfund program
has
established for
characterizing the nature and extent
of
risks
posed b
y
uncontrolled hazardous
waste sites and
for developing and
evaluating re
medial options.
The 1986 amendments to CERCLA
reemphasized the original statutory
mandate
that
remedies
meet a
threshold requirement to protect
human
health and the environment
and that they
Comment [A5]: The latest revisions to the
NCP were finalized in 1994. An overview of the
final NCP and a link to the full text are available
at:
http://www.epa.gov/oem/content/lawsregs/ncp
over.htm

be cost-effective, while adding new emphasis to
the permanence of remedies. Because the RI/FS
is an analytical process designed to support risk
management decision-making for Superfund
sites, the assessment of health and
environmental risk plays an essential role in the
RI/FS.
This manual provides guidance on the
human health evaluation activities that are
conducted during the RI/FS. The three basic
parts of the RI/FS human health evaluation are:
baseline risk assessment (described in
Part A of this manual);
refinement of preliminary remediation
goals (Part B); and
remedial alternatives risk evaluation
(Part C).
Because these risk information activities
are intertwined with the RI/FS, this section
describes those activities in the context of the
RI/FS process. It relates the three parts of the
human health evaluation to the stages of the
RI/FS, which are:
project scoping (before the RI);
site characterization (RI);
establishment of remedial action
objectives (FS);
development and screening of
alternatives (FS); and
detailed analysis of alternatives (FS).
Although the RI/FS process and related
risk information activities are presented in a
fashion that makes the steps appear sequential
and distinct, in practice the process is highly
interactive. In fact, the RI and FS are conducted
concurrently. Data collected in the RI influences
the development of remedial alternatives in the
FS, which in turn affects the data needs and
scope of treatability studies and additional field
Page 1-3
investigations. The RI/FS should be viewed as a
flexible process that can and should be tailored
to specific circumstances and information needs
of individual sites, not as a rigid approach that
must be conducted identically at every site.
Likewise, the human health evaluation process
described here should be viewed the same way.
Two concepts are essential to the phased
RI/FS approach. First, initial data collection
efforts develop a general understanding of the
site. Subsequent data collection effort focuses on
filling previously unidentified gaps in the
understanding of site characteristics and
gathering information necessary to evaluate
remedial alternatives. Second, key data needs
should be identified as early in the process as
possible to ensure that data collection is always
directed toward providing information relevant
to selection of a remedial action. In this way, the
overall site characterization effort can be
continually scoped to minimize the collection of
unnecessary data and maximize data quality.
The RI/FS provides decision-makers with
a technical evaluation of the threats posed at a
site, a characterization of the potential routes of
exposure, an assessment of remedial alternatives
(including their relative advantages and
disadvantages), and an analysis of the trade-offs
in selecting one alternative over another. EPA's
interim final Guidance for Conducting Remedial
Investigations and Feasibility Studies under
CERCLA (EPA 1988b) provides a detailed
structure for the RI/FS. The RI/FS guidance
provides further background that is helpful in
understanding the place of the human health
evaluation in the RI/FS process. The role that
risk information plays in these stages of the
RI/FS is described below; additional background
can be found in the RI/FS guidance and in a
summary of the guidance found in Chapter 2.
Exhibit 1-1 illustrates the RI/FS process,
showing where in the process risk information is
gathered and analyzed.
1.1.1 Project Scoping
The purpose of project scoping is to
define more specifically the appropriate type and
extent of investigation and analysis that should

Page 1-4
be undertaken for a given site. During scoping,
to assist in evaluating the possible impacts of
releases from the site on human health and the
environment, a conceptual model of the site
should be established, considering in a
qualitative manner the sources of contamination,
potential pathways of exposure, and potential
receptors. (Scoping is also the starting point for
the risk assessment, during which exposure
pathways are identified in the conceptual model
for further investigation and quantification.)
The preliminary characterization during
project scoping is initially developed with
readily available information and is refined as
additional data are collected. The main
objectives of scoping are to identify the types of
decisions that need to be made, to determine the
types (including quantity and quality) of data
needed, and to design efficient studies to collect
these data. Potential site-specific modeling
activities should be discussed at initial scoping
meetings to ensure that modeling results will
supplement the sampling data and effectively
support risk assessment activities.
1.1.2 Site Characterization (RI)
During site characterization, the
sampling and analysis plan developed during
project scoping is implemented and field data
are collected and analyzed to determine the
nature and extent of threats to human health and
the environment posed by a site. The major
components of site characterization are:
collection and analysis of field data to
characterize the site;
PROJECT SCOPING
Program experience has shown that scoping is a
very important step for the human health evaluation
process, and both the health and environmental
evaluation teams need to get involved in the RI/FS
during the scoping stage. Planning for site data
collection activities is necessary to focus the human
health evaluation (and environmental evaluation) on
the minimum amount of sampling information in order
to meet time and budget constraints, while at the same
time ensuring that enough information is gathered to
assess risks adequately. (See Chapter 3 for information
on planning the human health evaluation.)
development of a baseline risk
assessment for both potential human
health effects and potential
environmental effects; and
treatability studies, as appropriate.
Part of the human health evaluation, the
baseline risk assessment (Part A of this manual)
is an analysis of the potential adverse health
effects (current or future) caused by hazardous
substance releases from a site in the absence of
any actions to control or mitigate these releases
(i.e., under an assumption of no action). The
baseline risk assessment contributes to the site
characterization and subsequent development,
evaluation, and selection of appropriate response
alternatives. The results of the baseline risk
assessment are used to:

Pa
g
g
e 1-5
E
X
X
HIBIT 1-1
RIS
K
K
INFORM
A
A
TION AC
T
T
IVITIES I
N
N
THE RI/F
S
S
PROCESS

Page 1-6
help determine whether additional
response action is necessary at the site;
modify preliminary remediation goals;
help support selection of the "no-action"
remedial alternative, where appropriate;
and
document the magnitude of risk at a site,
and the primary causes of that risk.
Baseline risk assessments are site-specific
and therefore may vary in both detail and the
extent to which qualitative and quantitative
analyses are used, depending on the complexity
and particular circumstances of the site, as well
as the availability of applicable or relevant and
appropriate requirements (ARARs) and other
criteria, advisories, and guidance. After an initial
planning stage (described more fully in Chapter
3), there are four steps in the baseline risk
assessment process: data collection and analysis;
exposure assessment; toxicity assessment; and
risk characterization. Each step is described
briefly below and presented in Exhibit 1-2.
Data collection and evaluation
involves
gathering and analyzing the site data relevant to
the human health evaluation and identifying the
substances present at the site that are the focus
of the risk assessment process. (Chapters 4 and 5
address data collection and evaluation.)
An exposure assessment is conducted to
estimate the magnitude of actual and/or potential
human exposures, the frequency and duration of
these exposures, and the pathways by which
humans are potentially exposed. In the exposure
assessment, reasonable maximum estimates of
exposure are developed for both current and
future land-use assumptions. Current exposure
estimates are used to determine whether a threat
exists based on existing exposure conditions at
the site. Future exposure estimates are used to
provide decision-makers with an understanding
of potential future exposures and threats and
include a qualitative estimate of the likelihood of
such exposures occurring. Conducting an
exposure assessment involves analyzing
contaminant releases; identifying exposed
populations; identifying all potential pathways
of exposure; estimating exposure point
concentrations for specific pathways, based both
on environmental monitoring data and predictive
chemical modeling results; and estimating
contaminant intakes for specific pathways. The
results of this assessment are pathway-specific
intakes for current and future exposures to
individual substances. (Chapter 6 addresses
exposure assessment.)
The toxicity assessment
component of the
Superfund baseline risk assessment considers:
(1) the types of adverse health effects associated
with chemical exposures; (2) the relationship
between magnitude of exposure and adverse
effects; and (3) related uncertainties such as the
weight of evidence of a particular chemical's
carcinogenicity in humans. Typically, the
Superfund site risk assessments rely heavily on
existing toxicity information developed on
specific chemicals. Toxicity assessment for
contaminants found at Superfund sites is
generally accomplished in two steps: hazard
identification and dose-response assessment.
The first step, hazard identification, is the
process of determining whether exposure to an
agent can cause an increase in the incidence of
an adverse health effect (e.g., cancer, birth
defect). Hazard identification also involves
characterizing the nature and strength of the
evidence of causation. The second step, dose-
response evaluation, is the process of
quantitatively evaluating the toxicity
information and characterizing the relationship
between the dose of the contaminant
administered or received and the incidence of
adverse health effects in the exposed population.
From this quantitative dose-response
relationship, toxicity values are derived that can
be used to estimate the incidence of adverse
effects occurring in humans at different
exposure levels. (Chapter 7 addresses toxicity
assessment.)

Pagge 1-7
E XHIBIT 1-2
PART T A: BASEEELINE RISKK ASSESSMEENT

Page 1-8
The risk characterization summarizes and
combines outputs of the exposure and toxicity
assessments to characterize baseline risk, both in
quantitative expressions and qualitative statements.
During risk characterization, chemical-specific
toxicity information is compared against both
measured contaminant exposure levels and
those levels predicted through fate and transport
modeling to determine whether current or future
levels at or near the site are of potential concern.
(Chapter 8 addresses risk characterization.)
The level of effort required to conduct a
baseline risk assessment depends largely on the
complexity of the site. In situations where the
results of the baseline risk assessment indicate
that the site poses little or no threat to human
health or the environment and that no further (or
limited) action will be necessary, the FS should
be scaled-down as appropriate.
The documents developed during site
characterization include a brief preliminary site
characterization summary and the draft RI
report, which includes either the complete
baseline risk assessment report or a summary of
it. The preliminary site characterization
summary may be used to assist in identification
of ARARs and may provide the Agency for
Toxic Substances and Disease Registry
(ATSDR) with the data necessary to prepare its
health assessment (different from baseline risk
assessment or other EPA human health
evaluation activities; see Chapter 2). The draft
RI report is prepared after the completion of the
baseline risk assessment, often along with the
draft FS report.
1.1.3 FEASIBILITY STUDY
The purpose of the feasibility study is to
provide the decision-maker with an assessment
of remedial alternatives, including their relative
strengths and weaknesses, and the trade-offs in
selecting one alternative over another. The FS
process involves developing a reasonable range
of alternatives and analyzing these alternatives
in detail using nine evaluation criteria. Because
the RI and FS are conducted concurrently, this
development and analysis of alternatives is an
interactive process in which potential
alternatives and remediation goals are
continually refined as additional information
from the RI becomes available.
Establishing protective remedial action
objectives. The first step in the FS process
involves developing remedial action objectives
that address contaminants and media of concern,
potential exposure pathways, and preliminary
remediation goals. Under the proposed revised
NCP and the interim RI/FS guidance,
preliminary remediation goals typically are
formulated first during project scoping or
concurrent with initial RI activities (i.e., prior to
completion of the baseline risk assessment). The
preliminary remediation goals are therefore
based initially on readily available chemical-
specific ARARs (e.g., maximum contaminant
levels (MCLs) for drinking water). Preliminary
remediation goals for individual substances are
refined or confirmed at the conclusion of the
baseline risk assessment (Part B of this manual
addresses the refinement of preliminary
remediation goals). These refined preliminary
remediation goals are based both on risk
assessment and on chemical-specific ARARs.
Thus, they are intended to be protective and to
comply with ARARs. The analytical approach
used to develop these refined goals involves:
identifying chemical-specific ARARs;
identifying levels based on risk
assessment where chemical-specific
ARARs are not available or situations
where multiple contaminants or multiple
exposure pathways make ARARs not
protective;
identifying non-substance-specific goals
for exposure pathways (if necessary);
and
determining a refined preliminary
remediation goal that is protective of
human health for all substance/exposure
pathway combinations being addressed.
Development and screening of
alternatives. Once remedial action objectives
Comment [A6]: The latest revisions to the
NCP were finalized in 1994. An overview of the
final NCP and a link to the full text are available
at:
http://www.epa.gov/oem/content/lawsregs/ncp
over.htm

Page 1-9
have been developed, general response actions,
such as treatment, containment, excavation,
pumping, or other actions that may be taken to
satisfy those objectives should be developed. In
the process of developing alternatives for
remedial action at a site, two important activities
take place. First, volumes or areas of waste or
environmental media that need to be addressed
by the remedial action are determined by
information on the nature and extent of
contamination, ARARs, chemical-specific
environmental fate and toxicity information, and
engineering analyses. Second, the remedial
action alternatives and associated technologies
are screened to identify those that would be
effective for the contaminants and media of
interest at the site. The information developed in
these two activities is used in assembling
technologies into alternatives for the site as a
whole or for a specific operable unit.
The Superfund program has long
permitted remedial actions to be staged through
multiple operable units. Operable units are
discrete actions that comprise incremental steps
toward the final remedy. Operable units may be
actions that completely address a geographical
portion of a site or a specific site problem (e.g.,
drums and tanks, contaminated ground water) or
the entire site. Operable units include interim
actions (e.g., pumping and treating of ground
water to retard plume migration) that must be
followed by subsequent actions to fully address
the scope of the problem (e.g., final ground-
water operable unit that defines the remediation
goals and restoration timeframe). Such operable
units may be taken in response to a pressing
problem that will worsen if unaddressed, or
because there is an opportunity to undertake a
limited action that will achieve significant risk
reduction quickly. The appropriateness of
dividing remedial actions into operable units is
determined by considering the interrelationship
of site problems and the need or desire to initiate
actions quickly. To the degree that site problems
are interrelated, it may be most appropriate to
address the problems together. However, where
problems are reasonably separable, phased
responses implemented through a sequence of
operable units may promote more rapid risk
reduction.
In situations where numerous potential
remedial alternatives are initially developed, it
may be necessary to screen the alternatives to
narrow the list to be evaluated in detail. Such
screening aids in streamlining the feasibility
study while ensuring that the most promising
alternatives are being considered.
Detailed analysis of alternatives. During
the detailed analysis, each alternative is assessed
against specific evaluation criteria and the
results of this assessment arrayed such that
comparisons between alternatives can be made
and key tradeoffs identified. Nine evaluation
criteria, some of which are related to human
health evaluation and risk, have been developed
to address statutory requirements as well as
additional technical and policy considerations
that have proven to be important for selecting
among remedial alternatives. These evaluation
criteria, which are identified and discussed in the
interim final RI/FS guidance, serve as the basis
for conducting the detailed analyses during the
FS and for subsequently selecting an appropriate
remedial action. The nine evaluation criteria are
as follows:
1) overall protection of human health and
the environment;
2) compliance with ARARs (unless waiver
applicable);
3) long-term effectiveness and
permanence;
4) reduction of toxicity, mobility, or
volume through the use of treatment;
5) short-term effectiveness;
6) implementability;
7) cost;
8) state acceptance; and
9) community acceptance.

Page 1-10
Risk information is required at the detailed
analysis stage of the RI/FS so that each
alternative can be evaluated in relation to the
relevant NCP remedy selection criteria.
The detailed analysis must, according to
the proposed NCP, include an evaluation of each
alternative against the nine criteria. The first two
criteria (i.e., overall protectiveness and
compliance with ARARs) are threshold
determinations and must be
met before a remedy
can be selected. Evaluation of the overall
protectiveness of an alternative during the RI/FS
should focus on
how a specific
alternative
achieves protection over time and
how site risks
are reduced.
The next five criteria (numbers 3 through
7) are primary balancing
criteria. The last two
(numbers 8 and 9) are
considered modifying
criteria, and risk information does not play a
direct role in the analysis
of
them. Of the five
primary balancing criteria, risk information is of
particular importance in the analysis of
effectiveness and p
ermanence. Analysis
of long-
term effectiveness and permanence involves an
evaluation of the results of a remedial action in
terms of
residual risk at the site af
ter response
objectives have been met. A primary focus of
this
evaluation is the effectiveness of the
controls
that will be applied to manage risk
posed by
treatment residuals and/or any
untreated wastes t
hat may be left on the site, as
well as the volume and nature of that material. It
should also
consider
the potential impacts on
human health and the environment should the
remedy fail. An evaluation of
short-term
effectiveness addresses the impacts of the
alternative during
the construction and
implementation phase until remedial response
objectives
will be met. Under t
his criterion,
alternatives should be
evaluated with respect to
the potential effects on human health
and the
environment during
implementation of the
remedial action and the length of
time until
protection is
achieved.
1.2 OVE RALL ORGANIZATION OF
THE MANUAL
The next two chapters present additional
background material for the human health
evaluation process. Chapter 2 discusses statutes,
regulations, guidance, and studies relevant to the
Superfund human health evaluation. Chapter 3
discusses issues related to planning for the
human health evaluation. The remainder of the
manual is organized by the three parts of the
human health evaluation process:
the baseline risk assessment is covered
in Part A of the manual (Chapters 4
through 10);
refinement of preliminary remediation
goals is covered in Part B of the manual
(not included as part of this interim final
version); and
the risk evaluation of remedial
alternatives is covered in Part C of the
manual (not included as part of this
interim final version).
Chapters 4 through 8 provide detailed
technical guidance for conducting the steps of a
baseline risk assessment, and Chapter 9 provides
documentation and review guidelines. Chapter
10 contains additional guidance specific to
baseline risk assessment for sites contaminated
with radionuclides. Sample calculations, sample
table formats, and references to other guidance
are provided throughout the manual. All material
is presented both in technical terms and in
simpler text. It should be stressed that the
manual is intended to be comprehensive and to
provide guidance for more situations than
usually are relevant to any single site. Risk
assessors need not use those parts of the manual
that do not apply to their site.
Each chapter in Part A includes a glossary
of acronyms and definitions of commonly used
terms. The manual also includes two appendices:
Appendix A provides technical guidance for
is an index.
making absorption adjustments and Appendix B
Comment [A7]: The index in Appendix B may
not reflect the true page numbers of this annotated
version.

Page 1-11
ENDNOTES FOR CHAPTER 1
1 References made to CERCLA throughout this document should be interpreted as meaning "CERCLA, as amended by the Superfund
Amendments and Reauthorization Act of 1986 (SARA)."
2 40 CFR Part 300. Proposed revisions to the NCP were published on December 21, 1988 (53 Federal Register 51394). \
3 The term "public health evaluation" was introduced in the previous risk assessment guidance (EPA 1986f) to describe the assessment
of chemical releases from a site and the analysis of public health threats resulting from those releases, and Superfund site risk
assessment studies often are referred to as public health evaluations, or PHEs. The term "PHE" should be replaced by whichever of
the three parts of the revised human health evaluation process is appropriate: "baseline risk assessment," "documentation of
preliminary remediation goals," or "risk evaluation of remedial alternatives."
4 Baseline risks are risks that might exist if no remediation or institutional controls were applied at a site.
5 Volume II of the Risk Assessment Guidance for Superfund is the Environmental Evaluation Manual (EPA 1989b), which provides
guidance for the analysis of potential environmental (i.e., not human health) effects at sites.

Page 1-12
REFERENCES FOR CHAPTER 1
Congressional Research Service (CRS), Library of Congress. 1983. A Review of Risk Assessment Methodologies. Washington, D.C.
Environmental Protection Agency (EPA). 1984. Risk Assessment and Management: Framework for Decisionmaking. EPA/600/9-
85/002.
Environmental Protection Agency (EPA). 1986a. Guidelines for Carcinogen Risk Assessment. 51 Federal Register 33992 (September
24, 1986).
Environmental Protection Agency (EPA). 1986b. Guidelines for Exposure Assessment. 51 Federal Register 34042 (September 24,
1986).
Environmental Protection Agency (EPA). 1986c. Guidelines for Mutagenicity Risk Assessment. 51 Federal Register 34006 (September
24, 1986).
Environmental Protection Agency (EPA). 1986d. Guidelines for the Health Assessment of Suspect Developmental Toxicants. 51 Federal
Register 34028 (September 24, 1986).
Environmental Protection Agency (EPA). 1986e. Guidelines for the Health Risk Assessment of Chemical Mixtures. 51 Federal Register
34014 (September 24, 1986).
Environmental Protection Agency (EPA). 1986f. Superfund Public Health Evaluation Manual. Office of Emergency and Remedial
Response. EPA/540/1-86/060. (OSWER Directive 9285.4-1).
Environmental Protection Agency (EPA). 1988a. Proposed Guidelines for Exposure-related Measurements. 53 Federal Register 48830
(December 2, 1988).
Environmental Protection Agency (EPA). 1988b. Guidance for Conducting Remedial Investigations and Feasibility Studies Under
CERCLA. Interim Final. Office of Emergency and Remedial Response. (OSWER Directive 9355.3-01).
Environmental Protection Agency (EPA). 1989a. Proposed Amendments to the Guidelines for the Health Assessment of Suspect
Developmental Toxicants. 54 Federal Register 9386 (March 6, 1989).
Environmental Protection Agency (EPA). 1989b. Risk Assessment Guidance for Superfund: Environmental Evaluation Manual. Interim
Final. Office of Emergency and Remedial Response. EPA/540/1-89/001A. (OSWER Directive 9285.7-01).
National Academy of Sciences (NAS). 1983. Risk Assessment in the Federal Government: Managing the Process. National Academy
Press. Washington, D.C.
Office of Science and Technology Policy (OSTP). 1985. Chemical Carcinogens: A Review of the Science and Its Associated Principles.
50 Federal Register 10372 (March 14, 1985).

CHAPTER 2
STATUTES, REGULATIONS,
GUIDANCE, AND
STUDIES RELEVANT TO
THE HUMAN HEALTH
EVALUATION
This chapter briefly describes the statutes,
regulations, guidance, and studies related to the
human health evaluation process. The
descriptions focus on aspects of these documents
most relevant to human health evaluations and
show how recent revisions to the documents
bear upon the human health evaluation process.
Section 2.1 describes the following documents
that govern the human health evaluation:
the Comprehensive Environmental
Response, Compensation, and Liability
Act of 1980 (CERCLA, or Superfund)
and the Superfund Amendments and
Reauthorization Act of 1986 (SARA);
the National Oil and Hazardous
Substances Pollution Contingency Plan
(National Contingency Plan, or NCP);
Guidance for Conducting Remedial
Investigations and Feasibility Studies
Under CERCLA (RI/FS guidance);
CERCLA Compliance with Other Laws
Manual (ARARs guidance); and
Superfund Exposure Assessment
Manual (SEAM).
Exhibit 2-1 shows the relationship of these
statutes, regulations, and guidances governing
human health evaluation. In addition, Section
2.2 identifies and briefly describes other
Superfund studies related to, and sometimes
confused with, the RI/FS human health
evaluation. The types of studies discussed are:
endangerment assessments;
ATSDR health assessments; and
ATSDR health studies.
2.1 STATUTES, REGULATIONS, AND
GUIDANCE GOVERNING HUMAN
HEALTH EVALUATION
This section describes the major
Superfund laws and program documents relevant
to the human health evaluation process.
2.1.1 CERCLA AND SARA
In 1980, Congress enacted the
Comprehensive Environmental Response,
Compensation, and Liability Act (CERCLA) (42
U.S.C. 9601 et seq.), commonly called
Superfund, in response to the dangers posed by
sudden or otherwise uncontrolled releases of
hazardous substances, pollutants, or
contaminants into the environment. CERCLA
authorized $1.6 billion over five years for a
comprehensive program to clean up the worst
abandoned or inactive waste sites in the nation.
CERCLA funds used to establish and administer
the cleanup program are derived primarily from
taxes on crude oil and 42 different commercial
chemicals.

Comprehensive Environmental Response,
Compensation, and Liability Act of 1980.
(CERCLA or Superfund)
Superfund Amendments and
Reauthorization Act of 1986 (SARA)
Regulation ("Blueprint" for
Implementing the Statutes)
Statutes
Guidance
RI/FS Guidance
Risk Assessment Guidance for Superfund (RAGS)
• Human Health Evaluation Manual (HHEM)
• Environmental Evaluation Manual (REM)
ARARs Guidance
Su
p
erfund Ex
p
osure Assessment Manual
(
SEAM
)
National Oil and Hazardous Substances
Pollution Contingency Plan (NCP)
Page 2-2
EXHIBIT 2-1
RELATIONSHIP OF DOCUMENTS GOVERNING
HUMAN HEALTH EVALUATION

The reauthorization of CERCLA is known
as the Superfund Amendments and
Reauthorization Act (SARA), and was signed by
the President on October 17, 1986. (All further
references to CERCLA in this appendix should
be interpreted as "CERCLA as amended by
SARA.") These amendments provided $8.5
billion for the cleanup program and an additional
$500 million for cleanup of leaks from
underground storage tanks. Under SARA,
Congress strengthened EPA's mandate to focus
on permanent cleanups at Superfund sites,
involve the public in decision processes at sites,
and encourage states and federally recognized
Indian tribes to actively participate as partners
with EPA to address these sites. SARA
expanded EPA's research, development
(especially in the area of alternative
technologies), and training responsibilities.
SARA also strengthened EPA's enforcement
authority. The changes to CERCLA sections 104
(Response Authorities) and 121 (Cleanup
Standards) have the greatest impact on the RI/FS
process.
Cleanup standards. Section 121
(Cleanup Standards) states a strong preference
for remedies that are highly reliable and provide
long-term protection. In addition to the
requirement for remedies to be both protective
of human health and the environment and cost-
effective, other remedy selection considerations
in section 121(b) include:
a preference for remedial actions that
employ (as a principal element of the
action) treatment that permanently and
significantly reduces the volume,
toxicity, or mobility of hazardous
substances, pollutants, and
contaminants;
offsite transport and disposal without
treatment as the least favored alternative
where practicable treatment
technologies are available; and
the need to assess the use of alternative
treatment technologies or resource
recovery technologies and use them to
the maximum extent practicable.
Section 121(c) of CERCLA requires a periodic
review of remedial actions, at least every five
Page 2-3
years after initiation, for as long as hazardous
substances, pollutants, or contaminants that may
pose a threat to human health or the environment
remain at the site. If during a five-year review it
is determined that the action no longer protects
human health and the environment, further
remedial actions will need to be considered.
Section 121(d)(2)(A) of CERCLA
incorporates into law the CERCLA Compliance
Policy, which specifies that Superfund remedial
actions meet any federal standards,
requirements, criteria, or limitations that are
determined to be legally applicable or relevant
and appropriate requirements (i.e., ARARs).
Also included is the new provision that state
ARARs must be met if they are more stringent
than federal requirements. (Section 2.1.4
provides more detail on ARARs.)
Health-related authorities. Under
CERCLA section 104(i)(6), the Agency for
Toxic Substances and Disease Registry
(ATSDR) is required to conduct a health
assessment for every site included or proposed
for inclusion on the National Priorities List. The
ATSDR health assessment, which is fairly
qualitative in nature, should be distinguished
from the EPA human health evaluation, which is
more quantitative. CERCLA section 104(i)(5)(F)
states that:
the term "health assessments" shall include
preliminary assessments of the potential
risk to human health posed by individual
sites and facilities, based on such factors as
the nature and extent of contamination, the
existence of potential pathways of human
exposure (including ground or surface
water contamination, air emissions, and
food chain contamination), the size and
potential susceptibility of the community
within the likely pathways of exposure, the
comparison of expected human exposure
levels to the short-term and long-term
health effects associated with identified
hazardous substances and any available
recommended exposure or tolerance limits
for such hazardous substances, and the
comparison of existing morbidity and
mortality data on diseases that may be
associated with the observed levels of
exposure. The Administrator of ATSDR
shall use appropriate data, risk assessments,

Page 2-4
risk evaluations and studies available from
the Administrator of EPA.
There are purposeful differences between
an ATSDR health assessment and traditional
risk assessment. The health assessment is
usually qualitative, site-specific, and focuses on
medical and public health perspectives.
Exposures to site contaminants are discussed in
terms of especially sensitive populations,
mechanisms of toxic chemical action, and
possible disease outcomes. Risk assessment, the
framework of the EPA human health evaluation,
is a characterization of the probability of adverse
effects from human exposures to environmental
hazards. In this context, risk assessments differ
from health assessments in that they are
quantitative, chemical-oriented characterizations
that use statistical and biological models to
calculate numerical estimates of risk to health.
However, both health assessments and risk
assessments use data from human
epidemiological investigations, when available,
and when human toxicological data are
unavailable, rely on the results of animal
toxicology studies.
2.1.2 NATIONAL CONTINGENCY PLAN
(NCP)
Comment [A8]: The latest revisions to the
NCP were finalized in 1994. An overview of the
final NCP and a link to the full text are available
at:
http://www.epa.gov/oem/content/lawsregs/ncp
over.htm
The National Contingency Plan provides
the organizational structure and procedures for
preparing for and responding to discharges of oil
and releases of hazardous substances, pollutants,
and contaminants. The NCP is required by
section 105 of CERCLA and by section 311 of
the Clean Water Act. The current NCP (EPA
1985) was published on November 20, 1985,
and a significantly revised version (EPA 1988a)
was proposed December 21, 1988 in response to
SARA. The proposed NCP is organized into the
following subparts:
Subpart A -- Introduction
Subpart B --Responsibility and
Organization for Response
Subpart C -- Planning and Preparedness
Subpart D -- Operational Response
Phases for Oil Removal
Subpart E -- Hazardous Substance
Response
Subpart F -- State Involvement in
Hazardous Substance Response
Subpart G -- Trustees for Natural
Resources
Subpart H -- Participation by Other
Persons
Subpart I -- Administrative Record for
Selection of Response Action
Subpart J -- Use of Dispersants and
Other Chemicals
Subpart E, Hazardous Substance
Response, contains a detailed plan covering the
entire range of authorized activities involved in
abating and remedying releases or threats of
releases of hazardous substances, pollutants, and
contaminants. It contains provisions for both
removal and remedial response. The remedial
response process set forth by the proposed NCP
is a seven-step process, as described below. Risk
information plays a role in each step.
Site discovery or notification. Releases
of hazardous substances, pollutants, or
contaminants identified by federal, state, or local
government agencies or private parties are
reported to the National Response Center or
EPA. Upon discovery, such potential sites are
screened to identify release situations warranting
further remedial response consideration. These
sites are entered into the CERCLA Information
System (CERCLIS). This computerized system
serves as a data base of site information and
tracks the change in status of a site through the
response process. Risk information is used to
determine which substances are hazardous and,
in some cases, the quantities that constitute a
release that must be reported (i.e., a reportable
quantity, or RQ, under CERCLA section
103(a)).
Preliminary assessment and site
inspection (PA/SI). The preliminary assessment
involves collection and review of all available
information and may include offsite
reconnaissance to evaluate the source and nature
of hazardous substances present and to identify

the responsible party(ies). At the conclusion of
the preliminary assessment, a site may be
referred for further action, or a determination
may be made that no further action is needed.
Site inspections, which follow the preliminary
assessment for sites needing further action,
routinely include the collection of samples and
are conducted to help determine the extent of the
problem and to obtain information needed to
determine whether a removal action is
warranted. If, based on the site inspection, it
appears likely that the site should be considered
for inclusion on the National Priorities List
(NPL), a listing site inspection (LSI) is
conducted. The LSI is a more extensive
investigation than the SI, and a main objective of
the LSI is to collect sufficient data about a site to
support Hazard Ranking System (HRS) scoring.
One of the main objectives of the PA/SI is to
collect risk-related information for sites so that
the site can be scored using the HRS and
priorities may be set for more detailed studies,
such as the RI/FS.
Establishing priorities for remedial
action. Sites are scored using the HRS, based on
data from the PA/SI/LSI. The HRS scoring
process is the primary mechanism for
determining the sites to be included on the NPL
and, therefore, the sites eligible for Superfund-
financed remedial action. The HRS is a
numerical scoring model that is based on many
of the factors affecting risk at a site. A revised
version of the HRS (EPA 1988b) was proposed
December 23, 1988.
Remedial investigation/feasibility study
(RI/FS). As described in Section 1.1, the RI/FS
is the framework for determining appropriate
remedial actions at Superfund sites. Although
RI/FS activities technically are removal actions
and therefore not restricted to sites on the NPL
(see sections 101(23) and 104(b) of CERCLA),
they most frequently are undertaken at NPL
sites. Remedial investigations are conducted to
characterize the contamination at the site and to
obtain information needed to identify, evaluate,
and select cleanup alternatives. The feasibility
study includes an analysis of alternatives based
on the nine NCP evaluation criteria. The human
health evaluation described in this manual, and
the environmental evaluation described
Page 2-5
elsewhere, are the guidance for developing risk
information in the RI/FS.
Selection of remedy. The primary
consideration in selecting a remedy is that it be
protective of human health and the environment,
by eliminating, reducing, or controlling risks
posed through each pathway. Thus, the risk
information developed in the RI/FS is a key
input to remedy selection. The results of the
RI/FS are reviewed to identify a preferred
alternative, which is announced to the public in a
Proposed Plan. Next, the lead agency reviews
any resulting public comments on the Proposed
Plan, consults with the support agencies to
evaluate whether the preferred alternative is still
the most appropriate, and then makes a final
decision. A record of decision (ROD) is written
to document the rationale for the selected
remedy.
Remedial design/remedial action. The
detailed design of the selected remedial action is
developed and then implemented. The risk
information developed previously in the RI/FS
helps refine the remediation goals that the
remedy will attain.
Five-year review. Section 121(c) of
CERCLA requires a periodic review of remedial
actions, at least every five years after initiation
of such action, for as long as hazardous
substances, pollutants, or contaminants that may
pose a threat to human health or the environment
remain at the site. If it is determined during a
five-year review that the action no longer
protects human health and the environment,
further remedial actions will need to be
considered.
Exhibit 2-2 diagrams the general steps of
the Superfund remedial process, indicating
where in the process the various parts of the
human health evaluation are conducted.
2.1.3 REMEDIAL INVESTIGATION/
FEASIBILITY STUDY GUIDANCE
EPA's interim final Guidance for
Conducting Remedial Investigations and
Feasibility Studies Under CERCLA (EPA
1988c) provides a detailed structure for

Page 2-6
EXHIBIT 2-2
ROLE OF THE HUMAN HEALTH EVALUATION IN
THE SUPERFUND REMEDIAL PROCESS

conducting field studies to support remedial
decisions and for identifying, evaluating,
and selecting remedial action alternatives
under CERCLA. This 1988 guidance
document is a revision of two separate
guidances for remedial investigations and
for feasibility studies published in 1985.
These guidances have been consolidated
into a single document and revised to:
reflect new emphasis and provisions of
SARA;
incorporate aspects of new or revised
guidance related to RI/FSs;
incorporate management initiatives
designed to streamline the RI/FS
process; and
reflect experience gained from previous
RI/FS projects.
The RI/FS consists of the following general
steps:
project scoping (during the RI);
site characterization (RI);
establishment of remedial action
objectives (FS);
development and screening of
alternatives (FS); and
detailed analysis of alternatives (FS).
Because Section 1.1 describes each of
these steps, focusing on the role that risk
information plays in the RI/FS, a discussion of
the steps is not repeated here. The RI/FS
guidance provides the context into which the
human health evaluation fits and should be used
in conjunction with this manual.
2.1.4 ARARS GUIDANCE
The interim final CERCLA Compliance
with Other Laws Manual (EPA 1988d; EPA
Page 2-7
1989a), or ARARs guidance, was developed to
assist in the selection of onsite remedial actions
that meet the applicable or relevant and
appropriate requirements (ARARs) of the
Resource Conservation and Recovery Act
(RCRA), Clean Water Act (CWA), Safe
Drinking Water Act (SDWA), Clean Air Act
(CAA), and other federal and state
environmental laws, as required by CERCLA
section 121. Part I of the manual discusses the
overall procedures for identifying ARARs and
provides guidance on the interpretation and
analysis of RCRA requirements. Specifically:
Chapter 1 defines "applicable" and "relevant
and appropriate," provides matrices listing
potential chemical-specific, location-
specific, and action-specific requirements
from RCRA, CWA, and SDWA, and
provides general procedures for identifying
and analyzing requirements;
discusses special issues of interpretation and
analysis involving RCRA requirements, and
provides guidance on when RCRA
requirements will be ARARs for CERCLA
remedial actions;
provides guidance for compliance with
CWA substantive (for onsite and offsite
actions) and administrative (for offsite
actions) requirements for direct discharges,
indirect discharges, and dredge and fill
activities;
provides guidance for compliance with
requirements of the SDWA that may be
applicable or relevant and appropriate to
CERCLA sites; and
provides guidance on consistency with
policies for ground-water protection.
The manual also contains a hypothetical
scenario illustrating how ARARs are identified
and used, and an appendix summarizing the
provisions of RCRA, CWA, and SDWA.
Part II of the ARARs guidance covers the
Clean Air Act, other federal statutes, and state
requirements. Specifically:

Page 2-8
Chapter 1 provides an introduction to
Part II of the guidance, and also includes
extensive summary tables;
describes Clean Air Act requirements
and related RCRA and state
requirements;
Chapters 3 and 4 provide guidance for
compliance with several other federal
statutes;
discusses potential ARARs for sites
contaminated with radioactive
substances;
addresses requirements specific to
mining, milling, or smelting sites; and
provides guidance on identifying and
complying with state ARARs.
2.1.5 SUPERFUND EXPOSURE
ASSESSMENT MANUAL
The Superfund Exposure Assessment
Manual (EPA 1988e), which was developed by
the Superfund program specifically as a
companion document to the original Superfund
Public Health Evaluation Manual (EPA 1986),
provides RPMs and regional risk assessors with
the guidance necessary to conduct exposure
assessments that meet the needs of the
Superfund human health risk evaluation process.
Specifically, the manual:
provides an overall description of the
integrated exposure assessment as it is
applied to uncontrolled hazardous waste
sites; and
serves as a source of reference
concerning the use of estimation
procedures and computer modeling
techniques for the analysis of
uncontrolled sites.
The analytical process outlined in the
Superfund Exposure Assessment Manual
provides a framework for the assessment of
exposure to contaminants at or migrating from
uncontrolled hazardous waste sites. The
application of both monitoring and modeling
procedures to the exposure assessment process is
outlined in the manual. This process considers
all contaminant releases and exposure routes and
assures that an adequate level of analytical detail
is applied to support the human health risk
assessment process.
The exposure assessment process described
in the Superfund Exposure Assessment Manual
is structured in five segments:
(1) analysis of contaminant releases from a
subject site into environmental media;
(2) evaluation of the transport and
environmental fate of the contaminants
released;
(3) identification, enumeration, and
characterization of potentially exposed
populations;
(4) integrated exposure analysis; and
(5) uncertainty analysis.
Two recent publications from EPA's
Office of Research and Development, the
Exposure Factors Handbook (EPA 1989b) and
the Exposure Assessment Methods Handbook
(EPA 1989c), provide useful information to
supplement the Superfund Exposure Assessment
Manual. All three of these key exposure
assessment references should be used in
conjunction with Chapter 6 of this manual.
2.2 RELATED SUPERFUND STUDIES
This section identifies and briefly
describes other Superfund studies related to, and
sometimes confused with, the RI/FS human
health evaluation. It contrasts the objectives and
methods and clarifies the relationships of these
other studies with RI/FS health risk assessments.
The types of studies discussed are endangerment
assessments, ATSDR health assessments, and
ATSDR health studies.

2.2.1 ENDANGERMENT ASSESSMENTS
Before taking enforcement action against
parties responsible for a hazardous waste site,
EPA must determine that an imminent and
substantial endangerment to public health or the
environment exists as a result of the site. Such a
legal determination is called an endangerment
assessment. For remedial sites, the process for
analyzing whether there may be an
endangerment is described in this Human Health
Evaluation Manual and its companion
Environmental Evaluation Manual. In the past,
an endangerment assessment often was prepared
as a study separate from the baseline risk
assessment. With the passage of SARA and
changes in Agency practice, the need to perform
a detailed endangerment assessment as a
separate effort from the baseline risk assessment
has been eliminated.
For administrative orders requiring a
remedial design or remedial action,
endangerment assessment determinations are
now based on information developed in the site
baseline risk assessment. Elements included in
the baseline risk assessment conducted at a
Superfund site during the RI/FS process fully
satisfy the informational requirements of the
endangerment assessment. These elements
include the following:
identification of the hazardous wastes or
hazardous substances present in
environmental media;
assessment of exposure, including a
characterization of the environmental
fate and transport mechanisms for the
hazardous wastes and substances
present, and of exposure pathways;
assessment of the toxicity of the
hazardous wastes or substances present;
characterization of human health risks;
and
Page 2-9
characterization of the impacts and/or
risks to the environment.
The human health and environmental
evaluations that are part of the RI/FS are
conducted for purposes of determining the
baseline risks posed by the site, and for ensuring
that the selected remedy will be protective of
human health and the environment. The
endangerment assessment is used to support
litigation by determining that an imminent and
substantial endangerment exists. Information
presented in the human health and
environmental evaluations is basic to the legal
determination of endangerment.
In 1985, EPA produced a draft manual
specifically written for endangerment
assessment, the Endangerment Assessment
Handbook. EPA has determined that a guidance
separate from the Risk Assessment Guidance for
Superfund (Human Health Evaluation Manual
and Environmental Evaluation Manual) is not
required for endangerment assessment;
therefore, the Endangerment Assessment
Handbook will not be made final and should no
longer be used.
2.2.2 ATSDR HEALTH ASSESSMENTS
CERCLA section 104(i), as amended,
requires the Agency for Toxic Substances and
Disease Registry (ATSDR) to conduct health
assessments for all sites listed or proposed to be
listed on the NPL. A health assessment includes
a preliminary assessment of the potential threats
that individual sites and facilities pose to human
health. The health assessment is required to be
completed "to the maximum extent practicable"
before completion of the RI/FS. ATSDR
personnel, state personnel (through cooperative
agreements), or contractors follow six basic
steps, which are based on the same general risk
assessment framework as the EPA human health
evaluation:
(1) evaluate information on the site's physical,
geographical, historical, and operational
setting, assess the demographics of nearby
populations, and identify health concerns
of the affected community(ies);

Page 2-10
(2) determine contaminants of concern
associated with the site;
(3) identify and evaluate environmental
pathways;
(4) identify and evaluate human exposure
pathways;
(5) identify and evaluate public health
implications based on available medical
and toxicological information; and
(6) develop conclusions concerning the health
threat posed by the site and make
recommendations regarding further public
health activities.
The purpose of the ATSDR health
assessment is to assist in the evaluation of data
and information on the release of toxic
substances into the environment in order to
assess any current or future impact on public
health, develop health advisories or other health-
related recommendations, and identify studies or
actions needed to evaluate and prevent human
health effects. Health assessments are intended
to help public health and regulatory officials
determine if actions should be taken to reduce
human exposure to hazardous substances and to
recommend whether additional information on
human exposure and associated risks is needed.
Health assessments also are written for the
benefit of the informed community associated
with a site, which could include citizen groups,
local leaders, and health professionals.
Several important differences exist
between EPA human health evaluations and
ATSDR health assessments. EPA human health
evaluations include quantitative, substance-
specific estimates of the risk that a site poses to
human health. These estimates depend on
statistical and biological models that use data
from human epidemiologic investigations and
animal toxicity studies. The information
generated from a human health evaluation is
used in risk management decisions to establish
cleanup levels and select a remedial alternative.
ATSDR health assessments, although they
may employ quantitative data, are more
qualitative in nature. They focus not only on the
possible health threats posed by chemical
contaminants attributable to a site, but consider
all health threats, both chemical and physical, to
which residents near a site may be subjected.
Health assessments focus on the medical and
public health concerns associated with exposures
at a site and discuss especially sensitive
populations, toxic mechanisms, and possible
disease outcomes. EPA considers the
information in a health assessment along with
the results of the baseline risk assessment to give
a complete picture of health threats. Local health
professionals and residents use the information
to understand the potential health threats posed
by specific waste sites. Health assessments may
lead to pilot health effects studies, epidemiologic
studies, or establishment of exposure or disease
registries.
EPA's Guidance for Coordinating ATSDR
Health Assessment Activities with the
Superfund Remedial Process (EPA 1987)
provides information to EPA and ATSDR
managers for use in coordinating human health
evaluation activities. (Section 2.1, in its
discussion of CERCLA, provides further
information on the statutory basis of ATSDR
health assessments.)
2.2.3 ATSDR HEALTH STUDIES
After conducting a health assessment,
ATSDR may determine that additional health
effects information is needed at a site and, as a
result, may undertake a pilot study, a full-scale
epidemiological study, or a disease registry.
Three types of pilot studies are predominant:
(1) a symptom/disease prevalence study
consisting of a measurement of self-reported
disease occurrence, which may be validated
through medical records if they are
available;
(2) a human exposure study consisting of
biological sampling of persons who have a
potentially high likelihood of exposure to

determine if actual exposure can be verified;
and
(3) a cluster investigation study consisting of an
investigation of putative disease clusters to
determine if the cases of a disease are
excessively high in the concerned
community.
A full-scale epidemiological study is an
analytic investigation that evaluates the possible
causal relationships between exposure to
hazardous substances and disease outcome by
testing a scientific hypothesis. Such an
epidemiological study is usually not undertaken
unless a pilot study reveals widespread exposure
or increased prevalence of disease.
ATSDR, in cooperation with the states,
also may choose to follow up the results of a
health assessment by establishing and
maintaining national registries of persons
Page 2-11
exposed to hazardous substances and persons
with serious diseases or illness. A registry is a
system for collecting and maintaining, in a
structured record, information on specific
persons from a defined population. The purpose
of a registry of persons exposed to hazardous
substances is to facilitate development of new
scientific knowledge through identification and
subsequent follow-up of persons exposed to a
defined substance at selected sites.
Besides identifying and tracking of
exposed persons, a registry also is used to
coordinate the clinical and research activities
that involve the registrants. Registries serve an
important role in assuring the uniformity and
quality of the collected data and ensuring that
data collection is not duplicative, thereby
reducing the overall burden to exposed or
potentially exposed persons.

Page 2-12
REFERENCES FOR CHAPTER 2
Environmental Protection Agency (EPA). 1985. National Oil and Hazardous Substances Pollution Contingency Plan. Final Rule. 50 Federal
Register 47912 (November 20, 1985).
Environmental Protection Agency (EPA). 1986. Superfund Public Health Evaluation Manual. Office of Emergency and Remedial Response.
EPA/540/1-86/060. (OSWER Directive 9285.4-1).
Environmental Protection Agency (EPA). 1987. Guidance for Coordinating ATSDR Health Assessment Activities with the Superfund Remedial
Process. Office of Emergency and Remedial Response. (OSWER Directive 9285.4-02).
Environmental Protection Agency (EPA). 1988a. National Oil and Hazardous Substances Pollution Contingency Plan. Proposed Rule. 53 Federal
Register 51394 (December 21, 1988).
Environmental Protection Agency (EPA). 1988b. Hazard Ranking System (HRS) for Uncontrolled Hazardous Substance Releases. Proposed
Rule. 53 Federal Register 51962 (December 23, 1988).
Environmental Protection Agency (EPA). 1988c. Guidance for Conducting Remedial Investigations and Feasibility Studies Under CERCLA.
Interim Final. Office of Emergency and Remedial Response. (OSWER Directive 9355.3-01).
Environmental Protection Agency (EPA). 1988d. CERCLA Compliance with Other Laws Manual. Part I. Interim Final. Office of Emergency and
Remedial Response. (OSWER Directive 9234.1-01).
Environmental Protection Agency (EPA). 1988e. Superfund Exposure Assessment Manual. Office of Emergency and Remedial Response.
EPA/540/188/001. (OSWER Directive 9285.5-1).
Environmental Protection Agency (EPA). 1989a. CERCLA Compliance with Other Laws Manual. Part II. Interim Final. Office of Emergency
and Remedial Response. (OSWER Directive 9234.1-02).
Environmental Protection Agency (EPA). 1989b. Exposure Factors Handbook. Office of Health and Environmental Assessment. EPA/600/8-
89/043.
Environmental Protection Agency (EPA). 1989c. Exposure Assessment Methods Handbook. Draft. Office of Health and Environmental
Assessment.

CHAPTER 3
GETTING STARTED: PLANNING
FOR THE HUMAN HEALTH
EVALUATION IN THE RI/FS
This chapter discusses issues related to
planning the human health evaluation conducted
during the RI/FS. It presents the goals of the
RI/FS process as a whole and the human health
evaluation in particular (Sections 3.1 and 3.2). It
next discusses the way in which a site that is
divided into operable units should be treated in
the human health evaluation (Section 3.3). RI/FS
scoping is discussed in Section 3.4, and Section
3.5 addresses the level of effort and detail
necessary for a human health evaluation.
3.1 GOAL OF THE RI/FS
The goal of the RI/FS is to gather
information sufficient to support an informed
risk management decision regarding which
remedy appears to be most appropriate for a
given site. The RI/FS provides the context for all
site characterization activity, including the
human health evaluation. To attain this goal
efficiently, EPA must identify and characterize
hazards in a way that will contribute directly to
the selection of an appropriate remedy. Program
experience has shown that Superfund sites are
complex, and are characterized by
heterogeneous wastes, extreme variability in
contamination levels, and a variety of
environmental settings and potential exposure
pathways. Consequently, complete
characterization of a site during the RI/FS, in the
sense of eliminating uncertainty, is not feasible,
cost-effective, or necessary for selection of
appropriate remedies. This view has motivated
the "streamlined approach" EPA is taking to
help accomplish the goal of completing an RI/FS
in 18 months at a cost of $750,000 per operable
unit and $1.1 million per site. The streamlined
approach recognizes that the elimination of all
uncertainties is not possible or necessary and
instead strives only for sufficient data to
generally characterize a site and support remedy
selection. The resulting remedies are flexible
and incorporate specific contingencies to
respond to new information discovered during
remedial action and follow-up.
3.2 GOAL OF THE RI/FS HUMAN
HEALTH EVALUATION
As part of the effort to streamline the
process and reduce the cost and time required to
conduct the RI/FS, the Superfund human health
evaluation needs to focus on providing
information necessary to justify action at a site
and to select the best remedy for the site. This
should include characterizing the contaminants,
the potential exposures, and the potentially
exposed population sufficiently to determine
what risks need to be reduced or eliminated and
what exposures need to be prevented. It is
important to recognize that information should
be developed only to help EPA determine what
actions are necessary to reduce risks, and not to
fully characterize site risks or eliminate all
uncertainty from the analysis.
In a logical extension of this view, EPA
has made a policy decision to use, wherever
appropriate, standardized assumptions,
equations, and values in the human health
evaluation to achieve the goal of streamlined
assessment. This approach has the added benefit
of making human health evaluation easier to

Page 3-2
review, easier to understand, and more
consistent from site to site. Developing unique
exposure assumptions or non-standard methods
of risk assessment should not be necessary for
most sites. Where justified by site-specific data
or by changes in knowledge over time, however,
nonstandard methods and assumptions may be
used.
3.3 OPERABLE UNITS
Current practice in designing remedies for
Superfund sites often divides sites into operable
units that address discrete aspects of the site
(e.g., source control, ground-water remediation)
or different geographic portions of the site. The
NCP defines operable unit as "a discrete action
that comprises an incremental step toward
comprehensively addressing site problems."
RI/FSs may be conducted for the entire site and
operable units broken out during or after the
feasibility study, or operable units may be
treated individually from the start, with focused
RI/FSs conducted for each operable unit. The
best way to address the risks of the operable unit
will depend on the needs of the site.
The human health evaluation should focus
on the subject of the RI/FS, whether that is an
operable unit or the site as a whole. The baseline
risk assessment and other risk information
gathered will provide the justification for taking
the action for the operable unit. At the same
time, personnel involved in conducting the
human health evaluation for a focused RI/FS
must be mindful of other potential exposure
pathways, and other actions that are being
contemplated for the site to address other
potential exposures. Risk analysts should foresee
that exposure pathways outside the scope of the
focused RI/FS may ultimately be combined with
exposure pathways that are directly addressed by
the focused RI/FS. Considering risks from all
related operable units should prevent the
unexpected discovery of high multiple pathway
risks during the human health evaluation for the
last operable unit. Consider, for example, a site
that will be addressed in two operable units: a
surface soil cleanup at the contamination source
and a separate ground-water cleanup. Risks
associated with residuals from the soil cleanup
and the ground-water cleanup may need to be
considered as a cumulative total if there is the
potential for exposure to both media at the same
time.
3.4 RI/FS SCOPING
Planning the human health evaluation
prior to beginning the detailed analysis is an
essential step in the process. The RPM must
make up-front decisions about, for example, the
scope of the baseline risk assessment, the
appropriate level of detail and documentation,
trade-offs between depth and breadth in the
analysis, and the staff and monetary resources to
commit.
Scoping is the initial planning phase of the
RI/FS process, and many of the planning steps
begun here are continued and refined in later
phases. Scoping activities typically begin with
the collection of existing site data, including
data from previous investigations such as the
preliminary assessment and site inspection. On
the basis of this information, site management
planning is undertaken to identify probable
boundaries of the study area, to identify likely
remedial action objectives and whether interim
actions may be necessary or appropriate, and to
establish whether the site may best be remedied
as one site or as several separate operable units.
Once an overall management strategy is agreed
upon, the RI/FS for a specific project or the site
as a whole is planned.
The development of remedial alternatives
usually begins during or soon after scoping,
when likely response scenarios may first be
identified. The development of alternatives
requires:
identifying remedial action objectives;
identifying potential treatment, resource
recovery, and containment technologies that
will satisfy these objectives; and
screening the technologies based on their
effectiveness, implementability, and cost.

Remedial alternatives may be developed
to address a contaminated medium, a specific
area of the site, or the entire site. Alternative
remedial actions for specific media and site
areas either can be carried through the FS
process separately or combined into
comprehensive alternatives for the entire site.
The approach is flexible to allow alternatives to
be considered in combination at various points
in the process. The RI/FS guidance discusses
planning in greater detail.
3.5 LEVEL OF EFFORT/LEVEL OF
DETAIL OF THE HUMAN HEALTH
EVALUATION
An important part of scoping is
determining the appropriate level of effort/level
of detail necessary for the human health
evaluation. Human health evaluation can be
thought of as spanning a continuum of
complexity, detail, and level of effort, just as
sites vary in conditions and complexity. Some of
the site-specific factors affecting level of effort
that the RPM must consider include the
following:
number and identity of chemicals
present;
availability of ARARs and/or applicable
toxicity data;
number and complexity of exposure
pathways (including complexity of
release sources and transport media),
and the need for environmental fate and
transport modeling to supplement
monitoring data;
necessity for precision of the results,
which in turn depends on site conditions
such as the extent of contaminant
migration, characteristics of potentially
exposed populations, and enforcement
considerations (additional quantification
may be warranted for some enforcement
sites); and
.
Page 3-3
quality and quantity of available
monitoring data.
1
This manual is written to address the most
complex sites, and as a result not all of the steps
and procedures of the Superfund human health
evaluation process described in this manual
apply to all remedial sites. For example, Section
6.6 provides procedures and equations for
estimating chemical intakes through numerous
exposure routes, although for many sites, much
of this information will not apply (e.g., the
exposure route does not exist or is determined to
be relatively unimportant). This manual
establishes a generic framework that is broadly
applicable across sites, and it provides specific
procedures that cover a range of sites or
situations that may or may not be appropriate for
any individual site. As a consequence of
attempting to cover the wide variety of
Superfund site conditions, some of the process
components, steps, and techniques described in
the manual do not apply to some sites. In
addition, most of the components can vary
greatly in level of detail. Obviously, determining
which elements of the process are necessary,
which are desirable, and which are extraneous is
a key decision for each site. All components
should not be forced into the assessment of a
site, and the evaluation should be limited to the
complexity and level of detail necessary to
adequately assess risks for the purposes
described in Sections 3.1 and 3.2.
Planning related to the collection and
analysis of chemical data is perhaps the most
important planning step. Early coordination
among the risk assessors, the remainder of the
RI/FS team, representatives of other agencies
involved in the risk assessment or related studies
(e.g., ATSDR, natural resource trustees such as
the Department of the Interior, state agencies),
and the RPM is essential and preferably should
occur during the scoping stage of the RI/FS.
Detailed guidance on planning related to
collection and analysis of chemical data is given
in Chapter 4 of this manual.

Page 3-4
ENDNOTE FOR CHAPTER 3
1. All site monitoring data must be subjected to appropriate quality assurance/quality control programs. Lack of acceptable data may limit by
necessity the amount of data available for the human health evaluation, and therefore may limit the scope of the evaluation. Acceptability is
determined by whether data meet the appropriate data quality objectives (see Section 4.1.2).


CHAPTER 4
DATA COLLECTION
This chapter discusses procedures for
acquiring reliable chemical release and exposure
data for quantitative human health risk
assessment at hazardous waste sites.
1
The
chapter is intended to be a limited discussion of
important sampling considerations with respect
to risk assessment; it is not intended to be a
complete guide on how to collect data or design
sampling plans.
Following a general background section
(Section 4.1), this chapter addresses the
following eight important areas:
(1) review of available site information
(Section 4.2);
(2) consideration of modeling parameter
needs (Section 4.3);
(3) definition of background sampling needs
(Section 4.4);
(4) preliminary identification of potential
human exposure (Section 4.5);
(5) development of an overall strategy for
sample collection (Section 4.6);
(6) definition of required QA/QC measures
(Section 4.7);
(7) evaluation of the need for Special
Analytical Services (Section 4.8); and
(8) activities during workplan development
and data collection (Section 4.9).
4.1 BACKGROUND INFORMATION
USEFUL FOR DATA COLLECTION
This section provides background
information on the types of data needed for risk
assessment, overall data needs of the RI/FS,
reasons and steps for identifying risk assessment
data needs early, use of the Data Quality
Objectives for Remedial Response Activities
(EPA 1987a,b, hereafter referred to as the DQO
guidance), and other data concerns.
4.1.1 TYPES OF DATA
In general, the types of site data needed
for a baseline risk assessment include the
following:
contaminant identities;
contaminant concentrations in the key
Most of these data are obtained during
the sources and media of interest;
2
course of a remedial
investigation/feasibility study (RI/FS).
Other sources of information, such as:
ACRONYMS FOR CHAPTER 4
CLP = Contract Laboratory Program
DQO = Data Quality Objectives
FIT = Field Investigation Team
FSP = Field Sampling Plan
HRS = Hazard Ranking System
IDL = Instrument Detection Limit
MDL = Method Detection Limit
PA/SI = Preliminary Assessment/Site Inspection
QA/QC = Quality Assurance/Quality Control
QAPjP = Quality Assurance Project Plan
RAS = Routine Analytical Services
RI/FS = Remedial Investigation/Feasibility Study
SAP = Sampling and Analysis Plan
SAS = Special Analytical Services
SMO = Sample Management Office
SOW = Statement of Work
TAL = Target Analyte List
TCL = Target Compound List
TIC = Tentatively Identified Compound

Page 4-2
DEFINITIONS FOR CHAPTER 4
Analytes. The chemicals for which a sample is analyzed.
Anthropogenic Background Levels. Concentrations of chemicals that are present in the environment due to human-made,
non-site sources (e.g., industry, automobiles).
Contract Laboratory Program (CLP). Analytical program developed for Superfund waste site samples to fill the need for
legally defensible analytical results supported by a high level of quality assurance and documentation.
Data Quality Objectives (DQOs). Qualitative and quantitative statements to ensure that data of known and documented
quality are obtained during an RI/FS to support an Agency decision.
Field Sampling Plan (FSP). Provides guidance for all field work by defining in detail the sampling and data gathering
methods to be used on a project.
Naturally Occurring Background Levels. Ambient concentrations of chemicals that are present in the environment and have
not been influenced by humans (e.g., aluminum, manganese).
Quality Assurance Project Plan (QAPjP). Describes the policy, organization, functional activities, and quality assurance and
quality control protocols necessary to achieve DQOs dictated by the intended use of the data (RI/FS Guidance).
Routine Analytical Services (RAS). The set of CLP analytical protocols that are used to analyze most Superfund site
samples. These protocols are provided in the EPA Statements of Work for the CLP (SOW for Inorganics, SOW for Organics)
and must be followed by every CLP laboratory.
Sampling and Analysis Plan (SAP). Consists of a Quality Assurance Project Plan (QAPjP) and a Field Sampling Plan (FSP).
Sample Management Office (SMO). EPA contractor providing management, operational, and administrative support to the
CLP to facilitate optimal use of the program.
Special Analytical Services (SAS). Non-standardized analyses conducted under the CLP to meet user requirements that
cannot be met using RAS, such as shorter analytical turnaround time, lower detection limits, and analysis of non-standard
matrices or non-TCL compounds.
Statement of Work (SOW) for the CLP. A document that specifies the instrumentation, sample handling procedures,
analytical parameters and procedures, required quantitation limits, quality control requirements, and report format to be used
by CLP laboratories. The SOW also contains the TAL and TCL.
Target Analyte List (TAL). Developed by EPA for Superfund site sample analyses. The TAL is a list of 23 metals plus total
cyanide routinely analyzed using RAS.
Target Compound List (TCL). Developed by EPA for Superfund site sample analyses. The TCL is a list of analytes (34
volatile organic chemicals, 65 semivolatile organic chemicals, 19 pesticides, 7 polychlorinated biphenyls, 23 metals, and
total cyanide) routinely analyzed using RAS.
characteristics of sources, especially
preliminary assessment/site inspection
(PA/SI) information related to release
potential; reports, also may be available.
and
characteristics of the environmental
setting that may affect the fate, transport
and persistence of the contaminants.
4.1.2 DATA NEEDS AND THE RI/FS
The RI/FS has four primary data collection
components:
(1) characterization of site conditions;
(2) determination of the nature of the
wastes;
(3) risk assessment; and
(4) treatability testing.
The site and waste characterization
components of the RI/FS are intended to
determine characteristics of the site (e.g.,
ground-water movement, surface water and soil
characteristics) and the nature and extent of
contamination through sampling and analysis of
sources and potentially contaminated media.
Quantitative risk assessment, like site

characterization, requires data on concentrations
of contaminants in each of the source areas and
media of concern. Risk assessment also requires
information on other variables necessary for
evaluating the fate, transport, and persistence of
contaminants and estimating current and
potential human exposure to these contaminants.
Additional data might be required for
environmental risk assessments (see EPA
1989a).
Data also are collected during the RI/FS to
support the design of remedial alternatives. As
discussed in the DQO guidance (EPA 1987a,b),
such data include results of analyses of
contaminated media "before and after" bench-
scale treatability tests. This information usually
is not appropriate for use in a baseline risk
assessment because these media typically are
assessed only for a few individual parameters
potentially affected by the treatment being
tested. Also, initial treatability testing may
involve only a screening analysis that generally
is not sensitive enough and does not have
sufficient quality assurance/quality control
(QA/QC) procedures for use in quantitative risk
assessment.
4.1.3 EARLY IDENTIFICATION OF DATA
NEEDS
Because the RI/FS and other site studies
serve a number of different purposes (e.g., site
and waste characterization, design of remedial
alternatives), only a subset of this information
generally is useful for risk assessment. To
ensure that all risk assessment data needs will be
met, it is important to identify those needs early
in the RI/FS planning for a site. The earlier the
requirements are identified, the better the
chances are of developing an RI/FS that meets
the risk assessment data collection needs.
One of the earliest stages of the RI/FS at
which risk assessment data needs can be
addressed is the site scoping meeting. As
discussed in the Guidance for Conducting
Remedial Investigations and Feasibility Studies
Under CERCLA (EPA 1988a, hereafter referred
to as RI/FS guidance), the scoping meeting is
part of the initial planning phase of site
remediation. It is at this meeting that the data
needs of each of the RI/FS components (e.g., site
Page 4-3
and waste characterization) are addressed
together. Scoping meeting attendees include the
RPM, contractors conducting the RI/FS
(including the baseline risk assessment), onsite
personnel (e.g., for construction), and natural
resource trustees (e.g., Department of Interior).
The scoping meeting allows development of a
comprehensive sampling and analysis plan
(SAP) that will satisfy the needs of each RI/FS
component while helping to ensure that time and
budget constraints are met. Thus, in addition to
aiding the effort to meet the risk assessment data
needs, this meeting can help integrate these
needs with other objectives of the RI/FS and
thereby help make maximum use of available
resources and avoid duplication of effort.
During scoping activities, the risk assessor
should identify, at least in preliminary fashion,
the type and duration of possible exposures (e.g.,
chronic, intermittent), potential exposure routes
(e.g., ingestion of fish, ingestion of drinking
water, inhalation of dust), and key exposure
points (e.g., municipal wells, recreation areas)
for each medium. The relative importance of the
potential exposure routes and exposure points in
determining risks should be discussed, as should
the consequences of not studying them
adequately. Section 4.5 and Chapter 6 provide
guidance for identifying exposure pathways that
may exist at hazardous waste sites. If potential
exposure pathways are identified early in the
RI/FS process, it will be easier to reach a
decision on the number, type, and location of
samples needed to assess exposure.
During the planning stages of the RI/FS,
the risk assessor also should determine if non-
routine (i.e., lower) quantitation limits are
needed to adequately characterize risks at a site.
Special Analytical Services (SAS) of the EPA
Contract Laboratory Program (CLP) may be
needed to achieve such lower quantitation limits.
(See Section 4.8 for additional information
concerning quantitation limits.)

Page 4-4
4.1.4 USE OF THE DATA QUALITY
OBJECTIVES (DQO) GUIDANCE
The DQO guidance (EPA 1987a,b)
provides information on the review of site data
and the determination of data quality needs for
sampling (see the box below).
OVERVIEW OF DQO GUIDANCE
According to the DQO guidance (EPA 1987a and
b), DQO are qualitative and quantitative statements
established prior to data collection, which specify the
quality of the data required to support Agency
decisions during remedial response activities. The
DQO for a particular site vary according to the end use
of the data (i.e., whether the data are collected to
support preliminary assessments/site inspections,
remedial investigations/feasibility studies, remedial
designs, or remedial actions).
The DQO process consists of three stages. In Stage
1 (Identify Decision Types), all available site
information is compiled and analyzed in order to
develop a conceptual model of the site that describes
suspected sources, contaminant pathways, and potential
receptors. The outcome of Stage 1 is a definition of the
objectives of the site investigation and an identification
of data gaps. Stage 2 (Identify Data Uses/Needs)
involves specifying the data necessary to meet the
objectives set in Stage 1, selecting the sampling
approaches and the analytical options for the site, and
evaluating multiple-option approaches to allow more
timely or cost-effective data collection and evaluation.
In Stage 3 (Design Data Collection Program), the
methods to be used to obtain data of acceptable quality
are specified in such products as the SAP or the
workplan.
Use of this guidance will help ensure that all
environmental data collected in support of RI/FS
activities are of known and documented quality.
4.1.5 OTHER DATA CONCERNS
The simple existence of a data collection
plan does not guarantee usable data. The risk
assessor should plan an active role in oversight
of data collection to ensure that relevant data
have been obtained. (See Section 4.9 for more
information on the active role that the risk
assessor must play.)
After data have been collected, they
should be carefully reviewed to identify reliable,
accurate, and verifiable numbers that can be
used to quantify risks. All analytical data must
be evaluated to identify the chemicals of
potential concern (i.e., those to be carried
through the risk assessment). Chapter 5
discusses the criteria to be considered in
selecting the subset of chemical data appropriate
for baseline risk assessment. Data that do not
meet the criteria are not included in the
quantitative risk assessment; they can be
discussed qualitatively in the risk assessment
report, however, or may be the basis for further
investigation.
4.2 REVIEW OF AVAILABLE SITE
INFORMATION
Available site information must be
reviewed to (1) determine basic site
characteristics, (2) initially identify potential
exposure pathways and exposure points, and (3)
help determine data needs (including modeling
needs). All available site information (i.e.,
information existing at the start of the RI/FS)
should be reviewed in accordance with Stage 1
of the DQO process. Sources of available site
information include:
RI/FS scoping information;
PA/SI data and Hazard Ranking System
(HRS) documentation;
listing site inspection (LSI) data
(formally referred to as expanded site
inspection, or ESI);
photographs (e.g., EPA's Environmental
Photographic Interpretation Center
[EPIC]);
records on removal actions taken at the
site; and
information on amounts of hazardous
substances disposed (e.g., from site
records).
If available, LSI (or ESI) data are
especially useful because they represent fairly
extensive site studies.
Based on a review of the existing data, the
risk assessor should formulate a conceptual
model of the site that identifies all potential or
suspected sources of contamination, types and
concentrations of contaminants detected at the

site, potentially contaminated m edia, and
potential exposure pathways, including receptors
(see Exhibit 4-1). As discussed previously,
identification of po tential exposure pathways,
especially the exposure points, is a k ey element
in the determination of dat a needs for the risk
assessment. Details concerning development of
a conceptual model for a site are provided in the
DQO guidance (EPA 1987a,b)
and the RI/FS
guidance (EPA 1988a).
In most cases, site information available
at the start of the RI/FS is insufficient to fully
characterize the site and t he potential exposure
pathways. The conceptual model developed at
this stage should be adequate to determine the
remaining data needs. The remainder of this
chapter addresses risk assessment data needs i n
detail.
4.3 ADD RESSING
MODELING
PARAMETER NEEDS
As discussed in detail
in Chapter 6,
contaminant
release, transport, and fate models
are often
needed
to supp
lement monitoring data
when estimating exposure concentrations.
Therefore,
a preliminary site modeling strategy
should be
developed during
RI/FS scoping
to
allow model input data requirements to be
incorporated into the data
collection
requirements. This
preliminary identification of
models and other related data requirements will
ensure that data for model calibration
and
validation are
collected along with other
physical and chemical data at the site. Exhibit 4-
2 lists (by medium) several site-specific
parameters often needed to incorporate fate and
transport models in risk assessments.
Although default values for some
modeling parameters are available,
it is
preferable to obtain site-specific values for as
many
input parameters as is feasible. If the
model is not sensitive to a particular parameter
for which a default
value is available, then a
default value may be used. Similarly, default
values may be used if obtaining th
e
site-specific
model parameter would be too time consuming
or expensive. For example, certain
airborne dust
emission
models use a default value for
the
average wind speed at the site; this is done
because representative
measurements of wind
Page 4-5
speed at
the site
would involve significant
amounts of
time (i.e., samples would have to be
collected over a large part
of the year).
Some model parameters are needed only
if
the
sampling conducted at a site
is
sufficient
to
support complex models. Such model
parameters may not be necessary
if
only simple
fate and transport
models
are used in the risk
assessment.
4.4 DEFINING BACKGROUND
SAMPLING NEEDS
Background sampling is conducted to
distinguish site-related contamination from
naturally occurring or other non-site-related
levels of chemicals. The following subsections
define the types of background contamination
and provide guidance on the appropriate location
and number of background samples.
4.4.1 TYPES OF BACKGROUND
There are two different types of
background levels of chemicals:
(1) na turally occurring levels, which are
ambient concentrations of chemicals
present in the environment that have not
been influenced by humans (e.g.,
aluminum, manganese); and
(2) anthropogenic levels, which are
concentrations of
chemicals that
are present
in the environment due
to human-made,
non-site sources (e.g., industry,
automobiles).
Background can range from localized to
ubiquitous. For example, pesticides -- most of
which
are not naturally occurring
(anthropogenic) -- may be
ubiquitous in certain
areas (e.g.,
agricultural areas); salt runoff from
roads during
periods
of snow may c
ontribute
high ubiquitous levels of
sodium. Polycyclic
aromatic hydrocarbons (PAHs) and
lead are
other examples of anthropogenic, ubiquitous
chemicals, although these chemicals also may
be
present at naturally
occurring levels in the
environment due to natural sources (e.g., forest
fires may be a source
of PAHs, and lead is a
natural component of soils in some areas).
Comment [A9]: The information on
background sampling presented in this
document is supplemented by EPA's
Guidance
for Comparing Background and Chemical
Concentrations in Soil for CERCLA Sites.
This
guidance presents information on determining
whether collecting background samples is
necessary; when, where, and how to collect
background samples; and how to evaluate
background data.
The
Guidance for Comparing Background and
Chemical Concentrations in Soil for CERCLA
Sites
may be found at:
http://www.epa.gov/oswer/riskassessment/pdf/
background.pdf

Page 4-6
EXHIBIT 4-1
ELEMENTS OF A CONCEPTUAL EVALUATION MODEL
SOURCES
Variables
CONTAMINANTS
CONCENTRATIONS
TIME
LOCATIONS
Hypotheses to be Tested
SOURCE EXISTS
SOURCE CAN BE
CONTAINED
SOURCE CAN BE
REMOVED AND
DISPOSED
SOURCE CAN
BE
TREATED
P
A
T
H
W
A
Y
MEDIA
P ATHWAY EXISTS
RATES OF MIGRATION
PATHWAY CAN BE
TIME
INTERRUPTED
LOSS AND
GAIN
PATHWAY CAN BE
FUNCTIONS
ELIMINATED
RECEPTORS
RECEPTOR IS NOT
IMPACTED BE
MIGRATION OF
TYPES
CONTAMINANTS
SENSITIVITIES
RECEPTOR CAN BE
TIME
RELOCATED
CONCENTRATION
INSTITUTIONAL
NUMBRS
CONTROLS CAN BE
APPLIED
RECEPTOR CAN BE
PROTECTED

Page 4-7
EXHIBIT 4-2
EXAMPLES OF MODELING PARAMETERS FOR WHICH
INFORMATION MAY NEED TO BE OBTAINED DURING
A SITE SAMPLING INVESTIGATION
Type of Modeling Modeling Parameters
Source Characteristics Geometry, physical/chemical conditions, emission rate, emission
strength, geography
Soil Particle size, dry weight, pH, redox potential, mineral class,
organic carbon and clay content, bulk density, soil porosity
Ground-water Head measurements, hydraulic conductivity (pump and slug test
results), saturated thickness of aquifer, hydraulic gradient, pH,
redox potential, soil-water partitioning
Air Prevailing wind direction, wind speeds, stability class, topography,
depth of waste, contaminant concentration in soil and soil gas,
fraction organic content of soils, silt content of soils, percent
vegetation, bulk density of soil, soil porosity
Surface Water Hardness, pH, redox potential, dissolved oxygen, salinity,
temperature, conductivity, total suspended solids, flow rates,
and depths for rivers/streams, estuary and embayment
parameters such as tidal cycle, saltwater incursion extent, depth
and area, lake parameters such as area, volume, depth, depth to
thermocline
Sediment Particle size distribution, organic content, pH, benthic oxygen
conditions, water content
Biota Dry weight, whole body, specific organ, and/or edible portion
chemical concentrations, percent moisture, lipid content,
size/age, life history stage
These parameters are not necessarily limited to the type of modeling with which they are
associated in this exhibit. For example, many of the parameters listed for surface water are also
appropriate for sediments.

Page 4-8
4.4.2 BACKGROUND SAMPLING
LOCATIONS
Background samples are collected at or
near the hazardous waste site in areas not
influenced by site contamination. They are
collected from each medium of concern in these
offsite areas. That is, the locations of
background samples must be areas that could not
have received contamination from the site, but
that do have the same basic characteristics as the
medium of concern at the site.
Identifying background location requires
knowing which direction is upgradient/upwind/
upstream. In general, the direction of water flow
tends to be relatively constant, whereas the
direction of air flow is constantly changing.
Therefore, the determination of background
locations for air monitoring requires constant
and concurrent monitoring of factors such as
wind direction.
4.4.3 BACKGROUND SAMPLE SIZE
In appropriate circumstances, statistics
may be used to evaluate background sample
data. Because the number of background
samples collected is important for statistical
hypothesis testing, at some sites a statistician
should be consulted when determining
background sample size. At all sites, the RPM
should decide the level of statistical analysis
applicable to a particular situation.
Often, rigorous statistical analyses are
unnecessary because site-and non-site-related
contamination clearly differ. For most sites, the
issue will not be whether a difference in
chemical concentrations can be demonstrated
between contaminated and background areas,
but rather that of establishing a reliable
representation of the extent (in three
dimensions) of a contaminated area. However,
statistical analyses are required at some sites,
making a basic understanding of statistics
necessary. The following discussion outlines
some basic statistical concepts in the context of
background data evaluation for risk assessment.
(A general statistics textbook should
be
reviewed for additional detail. Also, the box
below lists EPA guidance that might be useful.)
Comment [A10]: Supplemental information
on the use of statistical tests to evaluate
background sample data may be found in EPA’s
Guidance for Comparing Background and
Chemical Concentrations in Soil for CERCLA
Sites
.
http://www.epa.gov/oswer/riskassessment/pdf/
background.pdf
Comment [A11]: The statistical software
package ProUCL includes statistical methods
that can be used to estimate exposure point
concentration (EPC) terms, not-to-exceed, and
background threshold values (BTVs). ProUCL
4.0 addresses various statistical issues arising
in: exposure and risk assessment studies, in
background evaluations, and in background
versus site comparison applications. It also has
statistical methods that can be used to verify
the attainment of cleanup standards and to
estimate screening levels. ProUCL may be found
on EPA’s website at:
http://www.epa.gov/osp/hstl/tsc/software.htm
A statistical test of a hypothesis is a rule
used for deciding whether or not a statement
(i.e., the null hypothesis) should be rejected in
favor of a specified alternative statement (i.e.,
the alternative hypothesis). In the context of
background contamination at hazardous waste
sites, the null hypothesis can be expressed as
"there is no difference between contaminant
concentrations in background areas and onsite,"
and the alternative hypothesis can be expressed
as "concentrations are higher onsite." This
expression of the alternative hypothesis implies
a one-tailed test of significance.
STATISTICAL METHODS GUIDANCE
Statistical Methods for Evaluating Ground
water Monitoring Data from Hazardous
Waste Facilities (EPA 1988b)
Surface Impoundment Clean Closure
Guidance Manual (EPA 1988c)
Love Canal Emergency Declaration Area
Habitability Study (EPA 1988d)
Soils Sampling Quality Assurance Guide
(EPA 1989b)
error could result in a failure to clean up a site
when such an action is necessary.
The number of background samples
collected at a site should be sufficient to accept
or reject the null hypothesis with a specified
likelihood of error. In statistical hypothesis
testing there are two types of error. The null
hypothesis may be rejected when it is true (i.e., a
Type I error), or not rejected when it is false
(i.e., a Type II error). An example of a Type I
error at a hazardous waste site would be to
conclude that contaminant concentrations in
onsite soil are higher than background soil
concentrations when in fact they are not. The
corresponding Type II error would be to
conclude that onsite contaminant concentrations
are not higher than background concentrations
when in fact they are. A Type I error could result
in unnecessary remediation, while a Type II

Page 4-9
In customary notations, α (alpha) denotes
the probability that a Type I error will occur, and
β (beta) denotes the probability that a Type II
error will occur. Most statistical comparisons
refer to α, also known as the level of
significance of the test. If α = 0.05, there is a 5
percent (i.e., 1 in 20) chance that we will
conclude that concentrations of contaminants are
higher than background when they actually are
not.
Equally critical considerations in
determining the number of background samples
are β and a concept called "power." The power
of a statistical test has the value 1 - β and is
defined as the likelihood that the test procedure
detects a false null hypothesis. Power functions
for commonly used statistical tests can be found
in most general statistical textbooks. Power
curves are a function of α (which normally is
fixed at 0.05), sample size (i.e., the number of
background and/or onsite samples), and the
amount of variability in the data. Thus, if a 15
percent likelihood of failing to detect a false null
hypothesis is desired (i.e., β = 0.15), enough
background samples must be collected to ensure
that the power of the test is at least 0.85.
A small number of background samples
increases the likelihood of a Type II error. If an
insufficient number of background samples is
collected, fairly large differences between site
and background concentrations may not be
statistically significant, even though
concentrations in the many site samples are
higher than the few background samples. To
guard against this situation, the statistical power
associated with the comparison of background
samples with site samples should be evaluated.
In general, when trying to detect small
differences as statistically significant, the
number of background samples should be
similar to the number of onsite samples that will
be used for the comparison(s) (e.g., the number
of samples taken from one well). (Note that this
does not mean that the background sample size
must equal the total number of onsite samples.)
Due to the inherent variability of air
concentrations (see Section 4.6), background
sample size for air needs to be relatively large.
4.4.4 COMPARING BACKGROUND
SAMPLES TO SITE-RELATED
CONTAMINATION
The medium sampled influences the kind
of statistical comparisons that can be made with
background data. For example, air monitoring
stations and ground-water wells are normally
positioned based on onsite factors and gradient
considerations. Because of this purposive
placement (see Section 4.6.1), several wells or
monitors cannot be assumed to be a random
sample from a single population and hence
cannot be evaluated collectively (i.e., the
sampling results cannot be combined).
Therefore, the information from each well or air
monitor should be compared individually with
background.
Because there typically are many site-
related, media-specific sampling location data to
compare with background, there usually is a
"multiple comparison problem" that must be
addressed. In general, the probability of
experiencing a Type I error in the entire set of
statistical tests increases with the number of
comparisons being made. If α = 0.05, there is a 1
in 20 chance of a Type I error in any single test.
If 20 comparisons are being made, it therefore is
likely that at least one Type I error will occur
among all 20 tests. Statistical Analysis of
Ground-water Monitoring Data at RCRA
Facilities (EPA 1989c) is useful for designing
sampling plans for comparing information from
many fixed locations with background.
It may be useful at times to look at
comparisons other than onsite versus
background. For example, upgradient wells can
be compared with downgradient wells. Also,
there may be several areas within the site that
should be compared for differences in site-
related contaminant concentration. These areas
of concern should be established before
sampling takes place. If a more complicated
comparison scheme is planned, a statistician
should be consulted frequently to help distribute
the sampling effort and design the analysis.
Comment [A12]: Supplemental information
on considerations in comparing site and
background data may be found in EPA’s
Guidance for Comparing Background and
Chemical Concentrations in Soil for CERCLA
Sites
.
http://www.epa.gov/oswer/riskassessment/pdf/
background.pdf

Page 4-10
A statistically significant difference
between background samples and site-related
contamination should not, by itself, trigger a
cleanup action. The remainder of this manual
still must be applied so that the toxicological --
rather than simply the statistical -- significance
of the contamination can be ascertained.
4.5 PRELIMINARY IDENTIFICATION
OF POTENTIAL HUMAN
EXPOSURE
A preliminary identification of potential
human exposure provides much needed
information for the SAP. This activity involves
the identification of (1) media of concern, (2)
areas of concern (i.e., general locations of the
media to be
sampled),
3
(3) types of chemicals
expected at the site, and (4) potential routes of
contaminant transport through the environment
(e.g., inter-media transfer, food chain). This
section provides general information on the
preliminary identification of potential human
exposure pathways, as well as specific information
on the various media. (Also, see Chapter 6 for a
detailed discussion of exposure assessment.)
4.5.1 GENERAL INFORMATION
Prior to discussing various specific exposure
media, general information on the following is
provided: media, types of chemicals, areas of
concern, and routes of contaminant transport is
addressed.
Media of concern (including biota). For
risk assessment purposes, media of concern at a
site are:
any currently contaminated media to
which individuals may be exposed or
through which chemicals may be
transported to potential receptors; and
any currently uncontaminated media
that may become contaminated in the
future due to contaminant transport.
Several medium-specific factors in
sampling may influence the risk assessment. For
example, limitations in sampling the medium
may limit the detailed evaluation of exposure
pathways described in Chapter 6. To illustrate
this, if soil samples are not collected at the
surface of a site, then it may not be possible to
accurately evaluate potential exposures
involving direct contact with soils or exposures
involving the release of contaminants from soils
via wind erosion (with subsequent inhalation of
airborne contaminants by exposed individuals).
Therefore, based on the conceptual model of the
site discussed previously, the risk assessor
should make sure that appropriate samples are
collected from each medium of concern.
Areas of concern. Areas of concern refer
to the general sampling locations at or near the
site. For large sites, areas of concern may be
treated in the RI/FS as "operable units," and may
include several media. Areas of concern also can
be thought of as the locations of potentially
exposed populations (e.g., nearest residents) or
biota (e.g., wildlife feeding areas).
Areas of concern should be identified
based on site-specific characteristics. These
areas are chosen purposively by the investigators
during the initial scoping meeting. Areas of
concern should include areas of the site that:
(1) have different chemical types;
(2) have different anticipated concentrations
or hot spots;
(3) are a release source of concern;
(4) differ from each other in terms of the
anticipated spatial or temporal variability
of contamination;
(5) must be sampled using different
equipment; and/or
(6) are more or less costly to sample.
In some instances, the risk assessor may
want to estimate concentrations that are
representative of the site as a whole, in addition
to each area of concern. In these cases, two
conditions generally should be met in defining
areas of concern: (1) the boundaries of the areas
of concern should not overlap and (2) all of the
areas of concern together should account for the
entire area of the site.

Depending on the exposure pathways that
are being evaluated in the risk assessment, it
may not be necessary to determine site-wide
representative values. In this case, areas of
concern do not have to account for the entire
area of the site.
Types of chemicals. The types of
chemicals expected at a hazardous waste site
may dictate the site areas and media sampled.
For example, certain chemicals (e.g., dioxins)
that bioconcentrate in aquatic life also are likely
to be present in the sediments. If such chemicals
are expected at a particular site and humans are
expected to ingest aquatic life, sampling of
sediments and aquatic life for the chemicals may
be particularly important.
Due to differences in the relative toxicities
of different species of the same chemical (e.g.,
Cr
+3
versus Cr
+6
), the species should be noted
when possible.
Routes of contaminant transport. In
addition to medium-specific concerns, there may
be several potential current and future routes of
contaminant transport within a medium and
between media at a site. For instance, discharge
of ground water or surface runoff to surface
water could occur. Therefore, when possible,
samples should be collected based on routes of
potential transport. For cases in which
contamination has not yet reached points of
human exposure but may be transported to those
areas in the future, sampling between the
contaminant source and the exposure locations
should be conducted to help evaluate potential
future concentrations to which individuals may
be exposed (e.g., through modeling). (See
Chapter 6 for additional discussion on
contaminant transport.)
4.5.2 SOIL
Soil represents a medium of direct contact
exposure and often is the main source of
contaminants released into other media. As such,
the number, location, and type of samples
collected from soils will have a significant effect
on the risk assessment. See the box on this page
for guidance that provides additional detailed
information concerning soil sampling, including
information on sampling locations, general soil
Page 4-11
and vegetation conditions, and sampling
equipment, strategies, and techniques. In
addition to the general sampling considerations
discussed previously, the following specific
issues related to soil sampling are discussed
below: the heterogeneous nature of soils,
designation of hot spots, depth of samples, and
fate and transport properties.
SOIL SAMPLING GUIDANCE
Test Methods for Evaluating Solid Waste
(SW846): Physical/Chemical Methods (EPA
1986a)
Field Manual for Grid Sampling of PCB
Spill Sites to Verify Cleanups (EPA 1986b)
A Compendium of Superfund Field
Operations Methods (EPA 1987c)
Soil Sampling Quality Assurance Guide
(EPA Review Draft 1989b)
Heterogeneous nature of soils. One of
the largest problems in sampling soil (or other
solid materials) is that its generally
heterogeneous nature makes collection of
representative samples difficult (and
compositing of samples virtually impossible -see
Section 4.6.3). Therefore, a large number of soil
samples may be required to obtain sufficient
data to calculate an exposure concentration.
Composite samples sometimes are collected to
obtain a more homogeneous sample of a
particular area; however, as discussed in a later
section, compositing samples also serves to
mask contaminant hot spots (as well as areas of
low contaminant concentration).
Designation of hot spots. Hot spots (i.e.,
areas of very high contaminant concentrations)
may have a significant impact on direct contact
exposures. The sampling plan should consider
characterization of hot spots through extensive
sampling, field screening, visual observations, or
a combination of the above.

Page 4-12
Depth of samples. Sample depth should
be applicable for the exposure pathways and
contaminant transport routes of concern and
should be chosen purposively within that depth
interval. If a depth interval is chosen
purposively, a random procedure to s elect a
sampling point may be established. Assessment
of surface exposures will be more certain if
samples are collected from the shallowest depth
that can be practically obtained, rather than, for
example, zero to two feet. Subsurface soil
samples are important, however, if soil
disturbance i s likely or if leaching of chemicals
to ground water is of concern, or if the site has
current or potential agricultural
uses.
Fate and transport properties. The
sampling plan
should consider physical and
chemical characteristics of
soil that are
important
for evaluating fate and transport.
For
example, soil samples being collected to identify
potential sources of ground-water contamination
must be able to support models that estimate
both quantities of
chemicals leaching to ground
water and the time needed for chemicals t
o leach
to and within
the
ground water.
4.5.3 GROUND WATER
Considerable expense and effort normally
are required for the installation and development
of monitoring wells and the collection of
groundwater samples. Wells must not introduce
foreign materials
and must
provide a
representative hydraulic connection to the
geologic formations of
interest. In
addition,
ground-water samples need to be coll
ected using
an
approach that adequately defines the
contaminant plume with respect to potential
exposure points. Existing potential exposure
points
(e.g., existing drinking water wells)
should be sampled.
More detailed information concerning
ground-water sampling considerations (e.g.,
sampling equipment, types,
and techniques) can
be found in the
references in the box on th
is
page. In
addition
to the general sampling
considerations discussed previously in Section
4.5.1, those specific for ground water --
hydrogeologic properties, well location and
depth, and
filtered vs. unfiltered samples -- are
discussed below.
GROUND-WATER SAMPLING
GUIDANCE
Practical Guide to Ground-water Sampling (EPA
1985a)
A
Compendium of Superfund Field Operations
Methods
(EPA 1987c)
Handbook: Ground Water (EPA 1987d)
Statistical Methods for Evaluating Ground Water
from Hazardous Waste Facilities (EPA 1988b)
Guidance on Remedial
Actions for Contaminated
Ground Water at Superfund Sites
(EPA 1988e)
Ground-water Sampling for Metals Analyses
(EPA 1989d)
Hydrogeologic properties. The extent to
which the hydrogeologic properties (e.g.,
hydraulic conductivity, porosity, bulk density,
fraction organic carbon, productivity) of the
aquifer(s) are characterized may have a
significant effect on the risk assessment. The
ability to estimate future exposure
concentrations depends on the extent to which
hydrogeologic properties needed to evaluate
contaminant migration are quantified. Repetitive
sampling of wells is necessary to obtain samples
that are unaffected by drilling and well
development and that accurately reflect
hydrogeologic properties of the aquifer(s).
Well location and depth. The location of
wells should be such that both the horizontal and
vertical extent of contamination can be
characterized. Separate water-bearing zones may
have different aquifer classifications and uses
and therefore may need to be evaluated
separately in the risk assessment. In addition,
sinking or floating layers of contamination may
be present at different depths of the wells.
Filtered vs. unfiltered samples. Data
from filtered and unfiltered ground-water
samples are useful for evaluating chemical
migration in ground water, because comparison
of chemical concentrations in unfiltered versus

Page
4-13
filtered samples can provide important
information on the form in which a chemical
exists in ground water. For instance, if the
concentration of a chemical is much greater in
unfiltered samples compared to filtered samples,
it is likely that the majority of the chemical is
sorbed onto particulate matter and not dissolved
in the ground water. This information on the
form of chemical (i.e., dissolved or suspended
on particulate matter) is important to
understanding chemical mobility within the
aquifer.
If chemical analysis reveals significantly
different concentrations in the filtered and
unfiltered samples, try to determine whether
there is a high concentration of suspended
particles or if apparently high concentrations are
due to sampling or well construction artifacts.
Supplementary samples can be collected in a
manner that will minimize the influence of these
artifacts. In addition, consider the effects of the
following.
Filter size. A 0.45 um filter may screen
out some potentially mobile particulates
to which contaminants are absorbed and
thus under-represent contaminant
concentrations. (Recent research
suggests that a 1.0 um may be a more
appropriate filter size.)
Pumping velocity. Pumping at too high
a rate will entrain particulates (to which
contaminants are absorbed) that would
not normally be mobile; this could
overestimate contaminant
concentrations.
Sample oxidation. After contact with air,
many metals oxidize and form insoluble
compounds that may be filtered out; this
may underestimate inorganic chemical
concentrations.
Well construction materials. Corrosion
may elevate some metal concentrations
even in stainless steel wells.
If unfiltered water is of potable quality,
data from unfiltered water samples should be
used to estimate exposure (see Chapter 6). The
RPM should ultimately decide the type of
samples that are collected. If only one type of
sample is collected (e.g., unfiltered), justification
for not collecting the other type of sample (e.g.,
filtered) should be provided in the sampling
plan.
4.5.4 SURFACE WATER AND SEDIMENT
Samples need to be collected from any
nearby surface water body potentially receiving
discharge from the site. Samples are needed at a
sufficient number of sampling points to
characterize exposure pathways, and at potential
discharge points to the water body to determine
if the site (or some other source) is contributing
to surface water/sediment contamination. Some
important considerations for surface
water/sediment sampling that may affect the risk
assessment for various types and portions of
water bodies (i.e., lotic waters, lentic waters,
estuaries, sediments) are discussed below. More
detailed information concerning surface water
and sediment sampling, such as selecting
sampling locations and sampling equipment,
types, and techniques, is provided in the
references given in the references given in the
SURFACE WATER AND SEDIMENT
SAMPLING GUIDANCE
Procedures for Handling and Chemical Analysis
of Sediment and Water Samples (EPA and COE
1981)
Sediment Sampling Quality Assurance User's
Guide (EPA 1984)
Methods Manual for Bottom Sediment Sample
Collection (EPA 1985b)
A Compendium of Superfund Field Operations
Methods (EPA 1987c)
An Overview of Sediment Quality in the United
States (EPA 1987e)
Proposed Guide for Sediment Collection,
Storage, Characterization and Manipulation
(The American Society for Testing and

Page 4-14
box below.
Lotic waters. Lotic waters are fast-
moving waters such as rivers and streams.
Variations in mixing across the stream channel
and downstream in rivers and streams can make
it difficult to obtain representative samples.
Although the selection of sampling points will
be highly dependent on the exposure pathways
of concern for a particular site, samples
generally should be taken both toward the
middle of the channel where the majority of the
flow occurs and along the banks where flow is
generally lower. Sampling locations should be
downgradient of any possible contaminant
sources such as tributaries or effluent outfalls.
Any facilities (e.g., dams, wastewater treatment
plants) upstream that affect flow volume or
water quality should be considered during the
timing of sampling. "Background" releases
upstream could confound the interpretation of
sampling results by diluting contaminants or by
increasing contaminant loads. In general,
sampling should begin downstream and proceed
upstream.
Lentic waters. Lentic waters are slow-
moving waters such as lakes, ponds, and
impoundments. In general, lentic waters require
more samples than lotic waters because of the
relatively low degree of mixing of lentic waters.
Thermal stratification is a major factor to be
considered when sampling lakes. If the water
body is stratified, samples from each layer
should be obtained. Vertical composites of these
layers then may be made, if appropriate. For
small shallow ponds, only one or two sample
locations (e.g., the intake and the deepest points)
may be adequate depending on the exposure
pathways of concern for the site. Periodic
release of water should be considered when
sampling impoundments, as this may affect
chemical concentrations and stratification.
Estuaries. Contaminant concentrations in
estuaries will depend on tidal flow and salinity-
stratification, among other factors. To obtain a
representative sample, sampling should be
conducted through a tidal cycle by taking three
sets of samples on a given day: (1) at low tide;
(2) at high tide; and (3) at "half tide." Each
layer of salinity should be sampled.
Sediments. Sediment samples should be
collected in a manner that minimizes disturbance
of the sediments and potential contamination of
subsequent samples. Sampling in flowing waters
should begin downstream and end upstream.
Wading should be avoided. Sediments of
different composition (i.e., mud, sand, rock)
should not be composited. Again, it is important
to obtain data that will support the evaluation of
the potential exposure pathways of concern. For
example, for pathways such as incidental
ingestion, sampling of near-shore sediments may
be important; however, for dermal absorption of
sediment contaminants during recreational use
such as swimming, samples from different
points throughout the water body may be
important. If ingestion of benthic (bottom
dwelling) species or surface water will be
assessed during the risk assessment, sediment
should be sampled so that characteristics needed
for modeling (e.g., fraction of organic carbon,
particle size distribution) can be determined (see
Section 4.3).
4.5.5 AIR
Guidance for developing an air sampling
plan for Superfund sites is provided in
Procedures for Dispersion Modeling and Air
Monitoring for Superfund Air Pathway Analysis
(EPA 1989e). That document is Volume IV of a
series of four technical guidance manuals called
Procedures for Conducting Air Pathway
Analyses for Superfund Applications (EPA
1989e-h). The other three volumes of the series
include discussions of potential air pathways, air
emission sources, and procedures for estimating
potential source emission rates associated with
both the baseline site evaluation and remedial
activities at the site.
Air monitoring information, along with
recommendations for proper selection and
application of air dispersion models, is included
in Volume IV. The section on air monitoring
contained in this volume presents step-by-step
procedures to develop, conduct, and evaluate the
results of air concentration monitoring to
characterize downwind exposure conditions
from Superfund air emission sources. The first
step addressed is the process of collecting and
reviewing existing air monitoring information
relevant to the specific site, including source,

receptor, and environmental data. The second
step involves determining the level of
sophistication for the air monitoring program;
the levels range from simple screening
procedures to refined techniques.
Selection of a given level will depend on
technical considerations (e.g., detection limits)
and available resources. The third step on air
monitoring is development of the air monitoring
plan and includes determination of the type of
air monitors, the number and location of
monitors, the frequency and duration of
monitoring, sampling and analysis procedures,
and QA/QC procedures. Step four details the
day-to-day activities related to conducting the
air maintenance and calibration, and
documentation of laboratory results and QA/QC
procedures. The fifth and final step involves the
procedures necessary to (1) summarize and
evaluate the air monitoring results for validity,
(2) summarize the statistics used, (3) determine
site-related air concentrations (by comparison of
upwind and downwind concentrations), and (4)
estimate uncertainties in the results related to the
monitoring equipment and program and the
analytical techniques used in the laboratory.
Given the difficulties of collecting
sufficient air samples to characterize both
temporal and spatial variability of air
concentrations, modeling --along or in
conjunction with monitoring -- is often used in
the risk assessment. For the most efficient
sampling program, the section in Volume IV on
modeling should be used in conjunction with the
section on monitoring.
Volume IV also contains a comprehensive
bibliography of other sources of air monitoring
and modeling guidance. Note, however, that
while this volume contains an extensive
discussion on planning and conducting air
sampling, it does not provide details concerning
particular monitoring equipment and techniques.
The box on this page lists some sources of
detailed information on air sampling. The
following paragraphs address several specific
aspects of air sampling: temporal and spatial
considerations, emission sources, meteorological
conditions.
Page 4-15
Temporal and spatial considerations.
The goal of air sampling at a site is to
adequately characterize air-related contaminant
exposures. At a minimum, sampling results
should be adequate for predictive short-term and
long-term modeling. When evaluating long-term
inhalation exposures, sample results should be
representative of the long-term average air
concentrations at the long-term modeling. When
evaluating long-term inhalation exposures,
sample results should be representative of the
long-term average air concentrations at the long-
term exposure points. This requires an air
sampling plan of sufficient temporal scale to
encompass the range of meteorological and
climatic conditions potentially affecting
emissions, and of sufficient spatial scale to
characterize associated air concentrations at
potential exposure points. If acute or subchronic
exposures resulting from episodes of unusually
large emissions are of interest, sampling over a
much smaller time scale would be needed.
AIR SAMPLING GUIDANCE
Technical Assistance Document for Sampling and
Analysis of Toxic Organic Compounds in Ambient Air
(EPA 1983)
A Compendium of Superfund Field Operations
Methods (EPA 1987c)
Procedures for Dispersion Modeling and Air
Monitoring for Superfund Air Pathway Analysis
(EPA 1988f)
Emission sources. Selection of the
appropriate type of air monitor will depend on
the emission source(s) being investigated as well
as the exposure routes to be evaluated. For
example, if inhalation of dust is an exposure
pathway of concern, then the monitoring
equipment must be able to collect respirable dust
samples.
Meteorological conditions. Site-specific
meteorological conditions should be obtained
(e.g., from the National Weather Service) or
recorded during the air sampling program with
sufficient detail and quality assurance to
substantiate and explain the air sampling results.
The review of these meteorological data can
help indicate the sampling locations and

Page 4-16
frequencies. Meteorological characteristics also
will be necessary if air modeling is to be
conducted.
4.5.6 BIOTA
Organisms sampled for human health risk
assessment purposes should be those that are
likely to be consumed by humans. This may
include animals such as commercial and game
fish (e.g., salmon, trout, catfish), shellfish (e.g.,
oysters, clams, crayfish), fowl (e.g., pheasant,
duck), and terrestrial mammals (e.g., rabbit,
deer), as well as plants such as grains (e.g.,
wheat, corn), vegetables (e.g., spinach, carrots),
and fruit (e.g., melons, strawberries). An effort
should be made to sample species that are
consumed most frequently by humans. Guidance
for collecting biota samples is provided in the
references given in the box below. The
following paragraphs address the following
special aspects of biota sampling: portion vs.
whole sampling, temporal concerns, food
preference, fish sampling, involvement by other
agencies.
BIOTA SAMPLING GUIDANCE
Food and Drug Administration's Pesticide Analytical
Manual (FDA 1977)
Cooperative Agreement on the Monitoring of Contaminants
in Great Lakes Sport Fish for Human Health Purposes
(EPA 1985c)
FDA's Pesticides and Industrial Chemicals in Domestic
Foods (FDA 1986)
A Compendium of Superfund Field Operations Methods
(EPA 1987c)
Guidance Manual for Assessing Human Health Risks from
Chemically Contaminated Fish and Shellfish (EPA 1989i)
Portion vs. whole sampling. If only
human exposure is of concern, chemical
concentrations should be measured only in
edible portion(s) of the biota. For many fish
species, estimates of concentrations in fillets
(skin on or skin off) are the most appropriate
measures of exposure concentrations. Whole
body measurements may be needed, however,
for certain species of fish and/or for
environmental risk assessments. For example,
for some species, especially small ones (e.g.,
smelt), whole body concentrations are most
appropriate. (See Risk Assessment Guidance for
Superfund: Environmental Evaluation Manual
(EPA 1989a) for more information concerning
biota sampling for environmental assessment.)
The edible portion of an organism can vary with
species and with the potentially exposed
subpopulation.
Temporal concerns. Any conditions that
may result in non-representative sampling, such
as sampling during a species' migration or when
plants are not in season, should be avoided.
Food preferences. At some sites, human
subpopulations in the area may have different
food consumption patterns that need to be
evaluated. For example, some people commonly
eat the hepatopancreas of shellfish. In these
cases, organ concentrations would be most
appropriate for estimating exposure. Another
example of a less common food preference is
consumption of relatively large quantities of
seaweed and other less commonly eaten
seafoods in some Asian communities.
Fish sampling. It is recommended that
fish of "catchable" size be sampled instead of
young, small fish because extremely young fish
are not likely to be consumed. Older, larger fish
also generally are more likely to have been
exposed to site-specific contaminants for a long
time, although for some species (e.g., salmon)
the reverse is true. Both bottom-dwelling
(benthic) and open-water species should be
sampled if both are used as a food source.
Other agencies. Biota sampling may
involve other federal agencies such as the Fish
and Wildlife Service or the Department of
Agriculture. The equivalent state agencies also
may be involved. In such cases, these agencies
should be involved early in the scoping process.
4.6 DEVELOPING AN OVERALL
STRATEGY FOR SAMPLE COLLECTION
For each medium at a site, there are
several strategies for collecting samples. The
sampling strategies for a site must be appropriate
for use in a quantitative risk assessment; if
inappropriate, even the strictest QA/QC
procedures associated with the strategy will not
ensure the usability of sample results. Generally,
Comment [A13]: The information on
developing a strategy for sample collection
presented in this document is complemented by
EPA's
Guidance for Data Useability in Risk
Assessment (Part A)
. This guidance is designed
to provide data users with a nationally
consistent basis for making decisions about the
minimum quality and quantity of environmental
analytical data that are sufficient to support
Superfund risk assessment decisions. It
includes information on determining the number
of samples collected and applicability of
alternative sampling designs, and a sampling
design worksheet.
EPA’s
Guidance for Data Useability in Risk
Assessment (Part A)
may be found at:
http://www.epa.gov/oswer/riskassessment/data
use/parta.htm

persons actually conducting the field
investigation will determine the strategy. As
discussed in Section 4.1, risk assessors also
should be involved in discussions concerning the
strategy. The following areas of major concern
(from a risk assessment perspective) are
discussed in this section: sample size, sampling
location, types of samples, temporal and
meteorological factors, field analyses, and cost
of sampling. Many of these areas also are
discussed for specific media in Section 4.5. See
the box in the opposite column and Section 4.5
for more detailed guidance on sampling strategy.
4.6.1 DETERMINE SAMPLE SIZE
Typically, sample size and sample
location (see Section 4.6.2) are determined at the
same time. Therefore, much of the discussion in
this subsection is also pertinent to determining
sampling location. The discussion on statistics in
Section 4.4 is useful for both sample size and
location determinations.
A number of considerations are associated
with determining an appropriate number of
samples for a risk assessment. These
considerations include the following four
factors:
(1) number of areas of concern that will be
sampled;
(2) statistical methods that are planned;
(3) statistical performance (i.e., variability
power, and certainty) of the data that
will be collected; and
(4) practical considerations of logistics and
cost.
In short, many decisions must be made by the
risk assessor related to the appropriate sample
size for an investigation. A statistician cannot
estimate an appropriate sample size without the
supporting information provided by a risk
assessor. The following paragraphs discuss these
four factors as they relate to sample size
determinations.
Areas of concern. A major factor that
influences how many samples are appropriate is
the number of areas of concern that are
Page 4-17
SAMPLING STRATEGY GUIDANCE
Test Methods for Evaluating Solid Waste
(SW846): Physical/Chemical Methods (EPA
1986a)
Data Quality Objectives for Remedial Response
Activities: Development Process (EPA 1987a)
Data Quality Objectives for Remedial Response
Activities: Example Scenario: RI/FS Activities at
a Site with Contaminated Soils and Ground
Water (EPA 1987b)
Expanded Site Inspection (ESI) Transitional
Guidance for FY 1988 (EPA 1987f)
Quality Assurance Field Operations Manual
(EPA 1987g)
Statistical Methods for Evaluating the Attainment
of Superfund Cleanup Standards: Volume 1, Soils
and Solid Media (EPA 1988f)
Proposed Guidelines for Exposure-related
Measurements (EPA 1988g)
Interim Report on Sampling Design Methodology
(EPA 1988h)
Standard Handbook of Hazardous Waste
Treatment and Disposal (Freeman 1989)
Soil Sampling Quality Assurance Guide (EPA
established prior to sampling. As discussed in
the next subsection, if more areas of concern are
identified, then more samples generally will be
needed to characterize the site. If the total
variability in chemical concentrations is reduced
substantially by subdividing the site into areas of
concern, then the statistical performance should
improve and result in a more accurate
assessment of the site.
Statistical methods. A variety of
statistical manipulations may need to be
performed on the data used in the risk
assessment. For example, there may be
Comment [A14]: Additional statistical
methods guidance is provided in EPA’s
Guidance
for Data Useability in Risk Assessment (Part A)
,
published in 1992.
http://www.epa.gov/oswer/riskassessment/data
use/parta.htm

Page 4-18
comparisons with background concentrations,
estimates of upper confidence limits on means, and
determinations of the probability of identifying hot
spots. Each of these analyses requires different
calculations for determining a sample size that
will yield a specified statistical performance.
Some of the available guidance, such as the
Ground-water Monitoring guidance (EPA
1986c), the RCRA Delisting guidance (EPA
1985d), and the Soils Cleanup Attainment
guidance (EPA 1988f), address these strategies
in detail.
Statistical performance (i.e., variability,
power, and certainty). If samples will be taken
from an area that is anticipated to have a high
degree of variability in chemical concentrations,
then many samples may be required to achieve a
specified level of certainty and power. If
contaminant concentrations in an area are highly
variable and only a few samples can be obtained,
then the risk assessor should anticipate (1) a
great deal of uncertainty in estimating mean
concentrations at the site, (2) difficulty in
defining the distribution of the data (e.g.,
normal), and (3) upper confidence limits much
higher than the mean. Identification of multiple
areas of concern -- each with its own set of
samples and descriptive statistics -- will help
reduce the total variability if the areas of
concern are defined so that they are very
different in their contaminant concentration
profiles. Risk assessors should discuss in the
scoping meeting both the anticipated variability
in the data and the desired power and certainty
of the statistics that will be estimated from the
data.
As discussed in Section 4.4.3, power is the
likelihood of detecting a false null hypothesis.
Power is particularly important when comparing
site characteristics with background. For
example, if a 10 percent difference in mean
concentrations needs to be determined with 99
percent likelihood (i.e., power of 0.99), a very
large number of samples will likely be needed
(unless the site and background variabilities are
extremely low). On the other hand, if the
investigator is only interested in whether the
onsite average conditions are 100 times larger
than background or can accept a lower chance of
detecting the difference if it exists (i.e., a lower
power), then a smaller sample size could be
accommodated.
The other statistical performance quantity
besides power that may need to be specified is
the certainty of the calculations. One minus the
certainty is the significance level (i.e., α), or
false positive rate (see also Section 4.4.3). The
higher the desired certainty level (i.e., the lower
the significance level), the greater the true
difference must be to observe a statistical
difference. In the case of upper confidence limits
on estimates of mean concentrations, the higher
the desired certainty level, the higher will be the
upper confidence limit. This follows from the
fact that in general, as certainty increases (i.e., α
becomes smaller), the size of the confidence
interval also increases.
Practical considerations. Finally,
questions of practicality, logistics, sampling
equipment, laboratory constraints, quality
assurance, and cost influence the sample size
that will be available for data analysis. After the
ideal sample size has been determined using
other factors, practical considerations can be
introduced to modify the sample size if
necessary.
4.6.2 ESTABLISH SAMPLING LOCATIONS
There are three general strategies for
establishing sample locations: (1) purposive, (2)
completely random, and (3) systematic. Various
combinations of these general strategies are
possible and acceptable.
Much of the discussion on statistics in the
preceding subsection and in Section 4.4 is
appropriate here. Typically, a statistician should
be consulted when determining sampling
location.
Purposive sampling. Although areas of
concern are established purposively (e.g., with
the intention of identifying contamination), the
sampling locations within the areas of concern
generally should not be sampled purposively if
the data are to be used to provide defensible
information for a risk assessment. Purposively
identified sampling locations are not discouraged
if the objective is site characterization,
conducting a chemical inventory, or the
Comment [A15]: For additional information
on the applicability of different sampling
designs, see Section 4.1 of EPA’s
Guidance for
Data Useability in Risk Assessment (Part A)
.
This guidance may be found at:
http://www.epa.gov/oswer/riskassessment/data
use/parta.htm

evaluation of visually obvious contamination.
The sampling results, however, may
overestimate or underestimate the true
conditions at the site depending on the strategies
of the sampling team. Due to the bias associated
with the samples, data from purposively
identified sampling locations generally should
not be averaged, and distributions of these data
generally should not be modeled and used to
estimate other relevant statistics. After areas of
concern have been established purposively,
groundwater monitoring well locations,
continuous air monitor locations, and soil
sample locations should be determined randomly
or systematically within the areas of concern.
Random sampling. Random sampling
involves selecting sampling locations in an
unbiased manner. Although the investigator may
have chosen the area of concern purposively, the
location of random sampling points within the
area should be independent of the investigator
(i.e., unbiased). In addition, the sampling points
should be independent of each other; that is, it
should not be possible to predict the location of
one sampling point based on the location of
others. Random sampling points can be
established by choosing a series of pairs of
random numbers that can be mapped onto a
coordinate system that has been established for
each area of concern.
Several positive features are associated
with data collected in a random sampling
program. First, the data can be averaged and
used to estimate average concentrations for the
area of concern (rather than simply an average
of the samples that were acquired). Second,
estimates of the uncertainty of the average and
the distributional form of the concentration
measurements are informative and simple to
estimate when they are determined from data
that were obtained randomly. Finally, if there is
a trend or systematic behavior to the chemical
concentrations (e.g., sampling is occurring along
a chemical gradient), then random sampling is
preferred because it reduces the likelihood that
all of the high concentration locations are
sampled to the exclusion of the low
concentration locations.
Systematic sampling. Systematic sample
locations are established across an area of
Page 4-19
concern by laying out a grid of sampling
locations that follow a regular pattern.
Systematic sampling ensures that the sampling
effort across the area of concern is uniform and
that samples are collected in each area. The
sampling location grid should be determined by
randomly identifying a single initial location
from which the grid is constructed. If such a
random component is not introduced, the sample
is essentially purposive. The grid can be formed
in several patterns including square, rectangular,
triangular, or hexagonal, depending on the shape
of the area. A square pattern is often the simplest
to establish. Systematic sampling is preferable to
other types of sampling if the objective is to
search for small areas with elevated concentrations.
Also, geostatistical characterizations – as described
in the DQO guidance (EPA 1987a,b) – are best
done with data collected from a systematic
sample.
Disadvantages of systematic sampling
include the need for special variance
calculations in order to estimate confidence
limits on the average concentration. The Soils
Cleanup Attainment guidance (EPA 1988f)
discusses these calculations in further detail.
4.6.3 DETERMINE TYPES OF SAMPLES
Another item of concern is the
determination of the types of samples to be
collected. Basically, two types of samples may
be collected at a site: grab and composite.
Grab samples. Grab samples represent a
single unique part of a medium collected at a
specific location and time.
Composite samples. Composite samples
– sometimes referred to as continuous samples
for air – combine subsamples from different
locations and/or times. As such, composite
samples may dilute or otherwise misrepresent
concentrations at specific points and, therefore,
should be avoided as the only inputs to a risk
assessment. For media such as soil, sediment,
and ground water, composite samples generally
may be used to assess the presence or absence of
contamination; however, they may be used in
risk assessment only to represent average
concentrations (and thus exposures) at a site. For
example, "hot spots" cannot be determined using

Page 4-20
composite samples. For surface water and air,
composite samples may be useful if concentrations
and exposures are expected to vary over time or
space, as will often be the case in a large stream
or river. Composites then can be used to estimate
daily or monthly average concentrations, or to
account for stratification due to depth or varying
flow rates across a stream.
4.6.4 CONSIDER TEMPORAL AND
METEOROLOGICAL FACTORS
Temporal (time) and meteorological
(weather) factors also must be considered when
determining sampling strategies. The sampling
design should account for fluctuations in
chemical concentrations due to these factors
because in general, the variability in sampling
results increases with increasing complexity of
these factors. When these factors are complex,
specialized and detailed sampling designs are
needed to maintain a constant and certain level
of accuracy in the results. Countering this need,
however, is the cost of the sampling. The
following paragraphs address the interactions of
the single sampling event, annual/seasonal
sampling cycle, variability estimation, and the
cost of sampling.
Single sampling event. Variability
measures from a single sampling event will
underestimate the overall variability of
concentrations across an area of concern, which
in turn will result in the underestimation of the
confidence limits on the mean. The reason for
this underestimation is that temporal variability
is not included in an evaluation of the total
environmental variability at the site.
Annual/seasonal sampling cycle. The
ideal sampling strategy incorporates a full
annual sampling cycle. If this strategy cannot be
accommodated in the investigation, at least two
sampling events should be considered. These
sampling events should take place during
opposite seasonal extremes. For example,
sampling periods that may be considered
extremes in temporal sampling include (1) high
water/low water, (2) high recharge/low recharge,
(3) windy/calm, and (4) high suspended
solids/clear water. This type of sampling
requires some prior knowledge of regional
seasonal dynamics. In addition, a sampling team
that can mobilize rapidly might be needed if the
particular year of sampling is not typical and the
extreme conditions occur at an unusual time. See
the box on this page for examples of seasonal
variability.
Variability estimation. The simple
variance estimators that are often used in risk
assessment require that the data are independent
or uncorrelated. Certain types of repeated
samples, however, (e.g., those from ground-
water wells or air monitors) actually are time
SEASONAL VARIABILITY
Regardless of the medium sampled, sample
composition may vary depending on the time of
year and weather conditions when the sample is
collected. For example, rain storms may greatly
alter soil composition and thus affect the types
and concentrations of chemicals present on solid
material; heavy precipitation and runoff from
snowmelt may directly dilute chemical
concentrations or change the types of chemicals
present in surface water; heavy rain also may
result in sediment loading to water bodies, which
could increase contamination or affect the
concentrations of other contaminants through
adsorption and settling in the water column; if
ground-water samples are collected from an area
heavily dependent on ground water for irrigation,
the composition of a sample collected during the
summer growing season may greatly differ from
the composition of a sample collected in the
winter.
series data that might be correlated. In other
words, the concentration of a contaminant in an
aquifer measured at a well on a given day will
depend, in part, on what the concentration in the
aquifer was on the previous day. To reduce this
dependence (e.g., due to seasonal variability),
sampling of ground-water wells and air monitors
should be either separated in time or the data
should be evaluated using statistical models with
variance estimators that can accommodate a
correlation structure. Otherwise, if time series
data that are correlated are treated as a random
sample and used to calculate upper confidence
limits on the mean, the confidence limits will be
underestimated.
Ideally, samples of various media should
be collected in a manner that accounts for time

Page 4-21
and weather factors. If seasonal fluctuations
cannot be characterized in the investigations,
details concerning meteorological, seasonal, and
climatic conditions during sampling must be
documented.
4.6.5 USE FIELD SCREENING ANALYSES
An important component of the overall
sampling strategy is the use of field screening
analyses. These types of analyses utilize
instruments that range from relatively simple
(e.g., hand-held organic vapor detectors) to more
sophisticated (e.g., field gas chromatographs).
(See Field Screening Methods Catalog [EPA
1987h] for more information.) Typically, field
screening is used to provide threshold
indications of contamination. For example, on
the basis of soil gas screening, the field
investigation team may determine that
contamination of a particular area is indicated
and therefore detailed sampling is warranted.
Although field screening results usually are not
directly used in the risk assessment, they are
useful for streamlining sampling and the overall
RI/FS process.
4.6.6 CONSIDER TIME AND COST OF
SAMPLING
Two primary constraints in sampling are
time and cost. Time consuming or expensive
sampling strategies for some media may prohibit
multiple sampling points. For example, multiple
groundwater wells and air monitors on a grid
sampling pattern are seldom located within a
single area of concern. However, multiple
surface water and soil samples within each area
of concern are easier to obtain. In the case of
ground water and air, several areas of concern
may have to be collapsed into a single area so
that multiple samples will be available for
estimating environmental variability or so that
the dynamics of these media can be evaluated
using accepted models of fate and transport.
In general, it is important to remember
when developing the sampling strategy that
detailed sampling must be balanced against the
time and cost involved. The goal of RI/FS
sampling is not exhaustive site characterization,
but rather to provide sufficient information to
form the basis for site remediation.
Comment [A16]: For additional information
on the use of field analyses versus fixed
laboratory analyses, see the following
resources:
- Section 3.2.9 of EPA’s Guidance for Data
Useability in Risk Assessment (Part A). This
guidance may be found at:
http://www.epa.gov/oswer/riskassessment/dat
ause/parta.htm
- EPA's website for Field-based Analytical
Methods at:
http://www.epa.gov/superfund/programs/dfa/fl
dmeth.htm#hand
4.7 QA/QC MEASURES
This section presents an overview of the
following quality assurance/quality control
(QA/QC) considerations that are of particular
importance for risk assessment sampling:
sampling protocol, sampling devices, QC
samples, collection procedures, and sample
preservation. Note, however, that the purpose of
this discussion is to provide background
information; the risk assessor will not be
responsible for most QA/QC evaluations.
The Quality Assurance Field Operations
Manual (EPA 1987g) should be reviewed. In
addition, the EPA Environmental Monitoring
Support Laboratory in Las Vegas, Nevada,
(EMSLLV) currently is writing a guidance
document concerning the development of quality
assurance sample designs for Superfund site
investigations. Regional QA/QC contacts (e.g.,
the regional Environmental Services Division)
or EMSL-LV should be consulted if more
information concerning QA/QC procedures for
sampling is desired.
4.7.1 SAMPLING PROTOCOL
The sampling protocol for a risk assessment
should include the following:
objectives of the study;
procedures for sample collection,
preservation, handling, and transport;
and
analytical strategies that will be used.
Presenting the objectives of the RI
sampling is particularly important because these
objectives also will determine the focus of the
risk assessment. There should be instructions on
documenting conditions present during sampling
(e.g., weather conditions, media conditions).
Persons collecting samples must be adequately
trained and experienced in sample collection.
Test evaluations of the precision attained by
persons involved in sample collection should be
documented (i.e., the individual collecting a
sample should do so in a manner that ensures
that a homogeneous, valid sample is
reproducibly obtained). The discussion of

Page 4-22
analytical strategies should specify quantitation
limits to be achieved during analyses of each
medium.
4.7.2 SAMPLING DEVICES
The devices used to collect, store, preserve, and
transport samples must not alter the sample in
any way (i.e., the sampling materials cannot be
reactive, sorptive, able to leach analytes, or
cause interferences with the laboratory analysis).
For example, if the wrong materials are used to
construct wells for the collection of ground-
water samples, organic chemicals may be
adsorbed to the well materials and not be present
in the collected sample.
4.7.3 QC SAMPLES
Field QC samples (e.g., field blanks, trip
blanks, duplicates, split samples) must be
collected, stored, transported, and analyzed in a
manner identical to those for site samples. The
meaning and purpose of blank samples are
discussed in detail in Chapter 5. Field duplicate
samples are usually two samples collected
simultaneously from the same sampling location
and are used as measures of either the
homogeneity of the medium sampled in a
particular location or the precision in sampling.
Split samples are usually one sample that is
divided into equal fractions and sent to separate
independent laboratories for analysis. These split
samples are used to check precision and
accuracy of laboratory analyses. Samples may
also be split in the same laboratory, which can
provide information on precision. The laboratory
analyzing the samples should not be aware of
the identity of the field QC samples (e.g., labels
on QC samples should be identical to those on
the site samples).
4.7.4 COLLECTION PROCEDURES
Collection procedures should not alter the
medium sampled. The general environment
surrounding the location of the sample should
remain the same so that the collected samples
are representative of the situation due to the site
conditions, not due to conditions posed by the
sampling equipment.
4.7.5 SAMPLE PRESERVATION
Until analysis by the laboratory, any
chemicals in the samples must be maintained as
close to the same concentrations and identities as
in the environment from which they came.
Therefore, special procedures may be needed to
preserve the samples during the period between
collection and analysis.
4.8 SPECIAL ANALYTICAL SERVICES
EPA's SAS, operated by the CLP, may be
necessary for two main reasons: (1) the standard
laboratory methods used by EPA's Routine
Analytical Services (RAS) may not be
appropriate (e.g., lower detection limits may be
needed),4 and (2) chemicals other than those on
the target compound list (TCL; i.e., chemicals
usually analyzed under the Superfund program)
may be suspected at the site and therefore may
need to be analyzed. A discussion on the RAS
detection limits is provided in Chapter 5.
Additional information on SAS can be found in
the User's Guide to the Contract Laboratory
Program (EPA 1988i).
In reviewing the historical data at a site,
the risk assessor should determine if non-TCL
chemicals are expected. As indicated above,
non-TCL chemicals may require special sample
collection and analytical procedures using SAS.
Any such needs should be discussed at the
scoping meeting. SAS is addressed in greater
detail in Chapter 5.
4.9 TAKING AN ACTIVE ROLE
DURING WORKPLAN DEVELOPMENT
AND DATA COLLECTION
The risk assessor should be sure to take an
active role during workplan development and
data collection. This ole involves three main
steps:
Comment [A17]: For additional information
on selecting analytical methods, including the
use of routine and non-routine methods and a
method selection worksheet, see Section 4.2 of
EPA’s
Guidance for Data Useability in Risk
Assessment (Part A)
. This guidance may be
found at:
http://www.epa.gov/oswer/riskassessment/data
use/parta.htm
Comment [A18]: For additional information
about the role of the risk assessor during
workplan development, including the
development of the Sampling and Analysis Plan
(SAP) and Quality Assurance Project Plan
(QAPP), see Section 2.2 of EPA’s Risk
Assessment Guidance for Superfund Volume I:
Human Health Evaluation Manual (Part D,
Standardized Planning, Reporting, and Review
of Superfund Risk Assessments.) RAGS, Part D
may be found at:
http://www.epa.gov/oswer/riskassessment/rags
d/index.htm
(1) present risk assessment sampling needs at
the scoping meeting;
(2) contribute to the workplan and review the
Sampling and Analysis Plan; and

(3) conduct interim reviews of outputs of the
field investigation.
See Chapter 9 for information on the role of the
RPM during workplan development and data
collection.
4.9.1 PRESENT RISK ASSESSMENT
SAMPLING NEEDS AT SCOPING
MEETING
At the scoping meeting, the uses of
samples and data to be collected are identified,
strategies for sampling and analysis are
developed, DQOs are established, and priorities
for sample collection are assigned based on the
importance of the data in meeting RI/FS
objectives. One of the RI/FS objectives, of
course, is the baseline risk assessment.
Therefore, the risk assessment data needs and
their fit with those of other RI/FS components
are discussed. If certain risk assessment
sampling needs are judged infeasible by the
scoping meeting attendees, all persons involved
with site investigation should be made aware of
the potential effects of exclusion on the risk
assessment.
4.9.2 CONTRIBUTE TO WORKPLAN AND
REVIEW SAMPLING AND ANALYSIS
PLAN
The outcome of the scoping meeting is the
development of a workplan and a SAP. The
workplan documents the decisions and
evaluations made during the scoping process and
presents anticipated future tasks, while the SAP
specifies the sampling strategies, the numbers,
types, and locations of samples, and the level of
quality control. The SAP consists of a quality
assurance project plan (QAPjP) and a field
sampling plan (FSP). Elements of the workplan
and the SAP are discussed in detail in Appendix
B of the RI/FS guidance (EPA 1988a). Both the
workplan and the SAP generally are written by
the personnel who will be involved in the
collection of the samples; however, these
documents should be reviewed by all personnel
who will be using the resulting sample data.
Review the workplan. The workplan
should describe the tasks involved in conducting
the risk assessment. It also should describe the
Page 4-23
development of a preliminary assessment of
public health and environmental impacts at the
site. The risk assessor should review the
completed workplan to ensure that all feasible
risk assessment sampling needs have been
addressed as discussed in the scoping meeting.
In particular, this review should focus on the
descriptions of tasks related to:
field investigation (e.g., source testing,
media sampling), especially with respect
to
o background concentrations by
medium, --quantification of present
and future exposures, e.g.,
exposure pathways
present and potential future
land use
media that are or may be
contaminated
locations of actual and
potential exposure
present concentrations at
appropriate exposure points,
o data needs for statistical analysis of
the above, and
o data needs for fate and transport
models;
sample analysis/validation, especially
with respect to
o chemicals of concern, and
o analytical quantification levels;
data evaluation; and
assessment of risks.
In reviewing the above, the precise
information necessary to satisfy the remainder of
this guidance should be anticipated.
Review the SAP. The risk assessor should
carefully review and evaluate all sections of the
SAP to determine if data gaps identified in the

Page 4-24
workplan will be addressed adequately by the
sampling program. Of particular importance is
the presentation of the objectives. In the QAPjP
component of the SAP, the risk assessor should
pay particular attention to the QA/QC
procedures associated with sampling (e.g.,
number of field blanks, number of duplicate
samples -- see Section 4.8). The SAP should
document the detailed, site-specific procedures
that will be followed to ensure the quality of the
resulting samples. Special considerations in
reviewing the SAP are discussed in Section
4.1.3.
In reviewing the FSP, pay particular
attention to the information on sample location
and frequency, sampling equipment and
procedures, and sample handling and analysis.
As discussed in Section 4.5, the sampling
procedures should address:
each medium of concern;
background concentrations;
all potential exposure points within each
medium;
migration to potential exposure points,
including data for models;
potential exposures based on possible
future land uses;
sufficient data to satisfy concerns about
distributions of sampling data and
statistics; and
number and location of samples.
The analytical plans in the FSP should be
reviewed to ensure that DQOs set during the
scoping meeting will be met.
The SAP may be revised or amended
several times during the site investigation.
Therefore, a review of all proposed changes to
the sampling and analysis plan that potentially
may affect the data needs for risk assessment is
necessary. Prior to any changes in the SAP
during actual sampling, compliance of the
changes with the objectives of the SAP must be
checked. (If risk assessment objectives are not
specified in the original SAP, they will not be
considered when changes to an SAP are
proposed.)
4.9.3 CONDUCT INTERIM REVIEWS OF
FIELD INVESTIGATION OUTPUTS
All sampling results should be reviewed as
soon as they are available to determine if the risk
assessment data needs outlined in the workplan
have been met by the sampling. Compare the
actual number, types, and locations of samples
collected with those planned in the SAP.
Sampling locations frequently are changed in the
field when access to a planned sampling location
is obstructed. The number of samples collected
may be altered if, for instance, there is an
insufficient amount of a certain medium to
collect the planned number of samples (e.g., if
several wells are found to be dry).
If certain sampling needs have not been
met, then the field investigators should be
contacted to determine why these samples were
not collected. If possible, the risk assessor
should obtain samples to fill these data gaps. If
time is critical, Special Analytical Services (see
Section 4.7) may be used to shorten the
analytical time. If this is not possible, then the
risk assessor should evaluate all sampling results
as discussed in Chapter 5, documenting the
potential effect that these data gaps will have on
the quantitative risk assessment. In general, the
risk assessment should not be postponed due to
these data gaps.

Page 4-25
ENDNOTES FOR CHAPTER 4
1 Some information that is appropriate for the assessment of human health risks also may be suitable and necessary for an environmental
evaluation of the site. Procedures for conducting an environmental evaluation of the hazardous waste site are outlined in the companion
volume of this guidance, the Environmental Evaluation Manual (EPA 1989a), and are not discussed in this chapter.
2 The term "media" refers to both environmental media (e.g., soil) and biota (e.g., fish).
3 "Areas of Concern" within the context of this guidance should be differentiated from the same terminology used by the Great Lakes
environmental community. This latter use is defined by the International Joint Commission as an area found to be exceeding the Great
Lakes Water Quality Agreement objectives.
4 New routine services that provide lower detection limits are currently under development. Contact the headquarters Analytical Operations
Branch for further information.

Page 4-26
REFERENCES FOR CHAPTER 4
American Society of Testing and Materials (ASTM). Undated. A Proposed Guide for Sediment Collection, Storage, Characterization,
and Manipulation. Draft. Available from G. Allen Burton, Dept of Biological Sciences, Wright State University, Dayton, Ohio 45435.
Provides information concerning how to collect contaminated sediments, sediment spiking, dilution procedures, and QA/QC.
Will probably be in the annual ASTM manual.
Environmental Protection Agency (EPA). 1981. Procedures for Handling and Chemical Analysis of Sediment and Water Samples. Great
Lakes Laboratory.
Environmental Protection Agency (EPA). 1983. Technical Assistance Document for Sampling and Analysis of Toxic Organic
Compounds in Ambient Air. Office of Research and Development.
Provides guidance to persons involved in designing and implementing ambient air monitoring programs for toxic organic
compounds. Includes guidance on selecting sampling/analytical methods, sampling strategy, QA procedures, and data format.
Outlines policy issues.
Environmental Protection Agency (EPA). 1984. Sediment Sampling Quality Assurance User's Guide. Environmental Monitoring
Support Laboratory. Las Vegas, NV. NTIS: PB-85-233-542.
Overview of selected sediment models presented as a foundation for stratification of study of regions and selection of
locations for sampling sites, methods of sampling, sampling preparation and analysis. Discussion of rivers, lakes, and
estuaries.
Environmental Protection Agency (EPA). 1985a. Practical Guide to Ground-water Sampling. Environmental Research Laboratory. Ada,
OK. EPA 600/2-85/104.
Contains information on laboratory and field testing of sampling materials and procedures. Emphasizes minimizing errors in
sampling and analysis.
Environmental Protection Agency (EPA). 1985b. Methods Manual for Bottom Sediment Sample Collection. Great Lakes National
Program Office. EPA 905/4-85/004.
Provides guidance on survey planning, sample collection, document preparation, and quality assurance for sediment sampling
surveys. Sample site selection, equipment/containers, collection field observation, preservation, handling custody procedures.
Environmental Protection Agency (EPA). 1985c. Cooperative Agreement on the Monitoring of Contaminants in Great Lakes Sport Fish
for Human Health Purposes. Region V, Chicago, IL.
Discusses sampling protocols and sample composition used for sport fish (chinook salmon, coho salmon, lake trout, and
rainbow trout), maximum composite samples (5 fish) and length ranges which would be applicable to hazardous waste sites
contaminating lakes or streams used for recreational fishing.
Environmental Protection Agency (EPA). 1985d. Petitions to Delist Hazardous Wastes Guidance Manual. Office of Solid Waste.
EPA/530/SW-85/003.
Environmental Protection Agency (EPA). 1986a. Test Methods for Evaluating Solid Waste (SW-846): Physical/Chemical Methods.
Office of Solid Waste.
Provides analytical procedures to test solid waste to determine if it is a hazardous waste as defined under RCRA. Contains
information for collecting solid waste samples and for determining reactivity, corrosivity, ignitability, composition of waste,
and mobility of waste compounds.
Environmental Protection Agency (EPA). 1986b. Field Manual for Grid Sampling of PCB Spill Sites to Verify Cleanups. Office of Toxic
Substances. EPA/560/5-86/017.
Provides detailed, step-by-step guidance for using hexagonal grid sampling; includes sampling design, collection, QA/QC and
reporting.
Environmental Protection Agency (EPA). 1986c. Resource Conservation and Recovery Act (RCRA) Ground-water Monitoring
Technical Enforcement Guidance Document. Office of Waste Programs Enforcement.

Page 4-27
Contains a detailed presentation of the elements and procedures essential to the design and operation of ground-water
monitoring systems that meet the goals of RCRA and its regulations. Includes appendices on statistical analysis and some
geophysical techniques.
Environmental Protection Agency (EPA). 1987a. Data Quality Objectives for Remedial Response Activities: Development Process.
Office of Emergency and Remedial Response and Office of Waste Programs Enforcement. EPA/540/G-87/003. (OSWER Directive
9335.0-7B).
Identifies (1) the framework and process by which data quality objectives (DQOs; qualitative and quantitative statements that
specify the quality of the data required to support Agency decisions during remedial response activities) are developed and (2)
the individuals responsible for development of DQOs. Provides procedures for determining a quantifiable degree of certainty
that can be used in making site-specific decisions. Provides a formal approach to integration of DQO development with
sampling and analysis plan development. Attempts to improve the overall quality and cost effectiveness of data collection and
analysis activities.
Environmental Protection Agency (EPA). 1987b. Data Quality Objectives for Remedial Response Activities: Example Scenario: RI/FS
Activities at a Site with Contaminated Soils and Ground Water. Office of Emergency and Remedial Response and Office of Waste
Programs Enforcement. EPA/540/G-87/004.
Companion to EPA 1987a. Provides detailed examples of the process for development of data quality objectives (DQOs) for
RI/FS activities under CERCLA.
Environmental Protection Agency (EPA). 1987c. A Compendium of Superfund Field Operations Methods. Office of Emergency and
Remedial Response. EPA/540/P-87/001. (OSWER Directive 9355.0-14).
Environmental Protection Agency (EPA). 1987d. Handbook: Ground Water. Office of Research and Development. EPA/625/6-87/016.
Resource document that brings together the available technical information in a form convenient for personnel involved in
ground-water management. Also addresses minimization of uncertainties in order to make reliable predictions about
contamination response to corrective or preventative measures.
Environmental Protection Agency (EPA). 1987e. An Overview of Sediment Quality in the United States. Office of Water Regulations
and Standards.
Good primer. Contains many references.
Environmental Protection Agency (EPA). 1987f. Expanded Site Inspection (ESI) Transitional Guidance for FY 1988. Office of
Emergency and Remedial Response. (OSWER Directive 9345.1-.02).
Provides reader with a consolidated ready reference of general methodologies and activities for conducting inspection work on
sites being investigated for the NPL.
Environmental Protection Agency (EPA). 1987g. Quality Assurance Field Operations Manual. Office of Solid Waste and Emergency
Response.
Provides guidance for the selection and definition of field methods, sampling procedures, and custody responsibilities.
Environmental Protection Agency (EPA). 1987h. Field Screening Methods Catalog. Office of Emergency and Remedial Response.
Provides a listing of methods to be used during field screening, and includes method descriptions, their application to
particular sites, their limitations and uses, instrumentation requirements, detection limits, and precision and accuracy
information.
Environmental Protection Agency (EPA). 1988a. Guidance for Conducting Remedial Investigations and Feasibility Studies Under
CERCLA. Interim Final. Office of Emergency and Remedial Response. (OSWER Directive 9355.3-01).
Provides the user (e.g., EPA personnel, state agencies, potentially responsible parties (PRPs), federal facility coordinators, and
contractors assisting in RI/FS-related activities) with an overall understanding of the RI/FS process. Includes general
information concerning scoping meetings, the development of conceptual models at the beginning of a site investigation,
sampling, and analysis.
Environmental Protection Agency (EPA). 1988b. Statistical Methods for Evaluating Ground Water from Hazardous Waste Facilities.
Office of Solid Waste.

Page 4-28
Specifies five different statistical methods that are appropriate for ground-water monitoring. Outlines sampling procedures and
performance standards that are designed to help minimize the occurrence of Type I and Type II errors.
Environmental Protection Agency (EPA). 1988c. Surface Impoundment Clean Closure Guidance Manual. Office of Solid Waste.
Environmental Protection Agency (EPA). 1988d. Love Canal Emergency Declaration Area Habitability Study Report. Prepared by
CH2M Hill and Life Systems for EPA Region II.
Provides a formal comparison of samples with background as well as detailed discussions concerning problems associated
with sampling to evaluate data.
Environmental Protection Agency (EPA). 1988e. Guidance on Remedial Actions for Contaminated Ground Water at Superfund Sites.
Interim Final. Office of Emergency and Remedial Response. (OSWER Directive 9283.1-2).
Provides guidance to develop, evaluate, and select ground-water remedial actions at Superfund sites, focusing on policy issues
and establishing cleanup levels. Also includes discussion of data collection activities for characterization of contamination.
Environmental Protection Agency (EPA). 1988f. Statistical Methods for Evaluating the Attainment of Superfund Cleanup Standards.
Volume I: Soils and Solid Media. Draft. Office of Policy, Planning, and Evaluation.
Provides statistical procedures that can be used in conjunction with attainment objectives defined by EPA to determine, with
the desired confidence, whether a site does indeed attain a cleanup standard. It also provides guidance on sampling of soils to
obtain baseline information onsite, monitor cleanup operations, and verify attainment of cleanup objectives.
Environmental Protection Agency (EPA). 1988g. Proposed Guidelines for Exposure-related Measurements. 53 Federal Register 48830
(December 2, 1988).
Focuses on general principles of chemical measurements in various physical and biological media. Assists those who must
recommend, conduct, or evaluate an exposure assessment.
Environmental Protection Agency (EPA). 1988h. Interim Report on Sampling Design Methodology. Environmental Monitoring Support
Laboratory. Las Vegas, NV. EPA/600/X-88/408.
Provide guidance concerning the statistical determination of the number of samples to be collected.
Environmental Protection Agency (EPA). 1988i. User's Guide to the Contract Laboratory Program. Office of Emergency and Remedial
Response.
Environmental Protection Agency (EPA). 1989a. Risk Assessment Guidance for Superfund: Environmental Evaluation Manual. Interim
Final. Office of Emergency and Remedial Response. EPA/540/1-89/001A. (OSWER Directive 9285.7-01).
Environmental Protection Agency (EPA). 1989b. Soil Sampling Quality Assurance Guide. Review Draft. Environmental Monitoring
Support Laboratory. Las Vegas, NV.
Replaces earlier edition: NTIS Pb-84-198-621. Includes DQO's, QAPP, information concerning the purpose of background
sampling, selection of numbers of samples and sampling sites, error control, sample design, sample documentation.
Environmental Protection Agency (EPA). 1989c. Statistical Analysis of Ground-water Monitoring Data at RCRA Facilities. Office of
Solid Waste.
Environmental Protection Agency (EPA). 1989d. Ground-water Sampling for Metals Analyses. Office of Solid Waste and Emergency
Response. EPA/540/4-89-001.
Environmental Protection Agency (EPA). 1989e. Air Superfund National Technical Guidance Series. Volume IV: Procedures for
Dispersion Modeling and Air Monitoring for Superfund Air Pathway Analysis. Interim Final. Office of Air Quality Planning and
Standards. Research Triangle Park, NC. EPA/450/1-89/004.
This volume discusses procedures for dispersion modeling and air monitoring for superfund air pathway analyses. Contains
recommendations for proper selection and application of air dispersion models and procedures to develop, conduct, and
evaluate the results of air concentration monitoring to characterize downwind exposure conditions from Superfund air
emission sources.
Environmental Protection Agency (EPA). 1989f. Air Superfund National Technical Guidance Series. Volume I: Application of Air
Pathway Analyses for Superfund Activities. Interim Final. Office of Air Quality Planning and Standards. Research Triangle Park, NC.
EPA/450/189/001.

Page 4-29
Provides recommended procedures for the conduct of air pathway analyses (APAs) that meet the needs of the Superfund
program. The procedures are intended for use by EPA remedial project managers, enforcement project managers, and air
experts as well as by EPA Superfund contractors. The emphasis of this volume is to provide a recommended APA procedure
relative to the remedial phase of the Superfund process.
Environmental Protection Agency (EPA). 1989g. Air Superfund National Technical Guidance Series. Volume II: Estimation of Baseline
Air Emissions at Superfund Sites. Interim Final. Office of Air Quality Planning and Standards. Research Triangle Park, NC. EPA/450/1-
89/002.
This volume provides information concerning procedures for developing baseline emissions from landfills and lagoons.
Describes baseline emissions from both undisturbed sites and sites where media-disturbing activities are taking place. The
procedures described for landfills may be applied to solid hazardous waste, and those for lagoons may be applied to liquid
hazardous waste.
Environmental Protection Agency (EPA). 1989h. Air Superfund National Technical Guidance Series. Volume III: Estimation of Air
Emissions from Cleanup Activities at Superfund Sites. Interim Final. Office of Air Quality Planning and Standards. Research Triangle
Park, NC. EPA/450/1-89/003.
This volume provides technical guidance for estimating air emissions from remedial activities at NPL sites that may impact
local air quality for both onsite workers at a site and the surrounding community while the remedial activities are occurring.
Discusses methods to characterize air quality impacts during soil removal, incineration, and air stripping.
Environmental Protection Agency (EPA). 1989i. Guidance Manual for Assessing Human Health Risks from Chemically Contaminated
Fish and Shellfish. Office of Marine and Estuarine Protection. EPA/503/8-89/002.
Study designed to measure concentrations of toxic substances in edible tissues of fish and shellfish.
Environmental Protection Agency (EPA) and Army Corps of Engineers (COE). 1981. Procedures for Handling and Chemical Analysis
of Sediment and Water Samples. Technical Committee on Dredged and Fill Material. Technical Report EPA/DE-81-1.
Food and Drug Administration (FDA). 1977. Pesticide Analytical Manual. Volume I.
Provides a skin-on fillet (whole fish sampling) protocol used in USEPA monitoring of sportfish in the Great Lakes. Also
includes information on compositing.
Food and Drug Administration (FDA). 1986. Pesticides and Industrial Chemicals in Domestic Foods.
Provides guidance for sampling designs for fishery products from the market.
Freeman, H.M. 1989. Standard Handbook of Hazardous Waste Treatment and Disposal. McGraw-Hill. New York.
Provides detailed information concerning sampling and monitoring of hazardous wastes at remedial action sites (Chapters 12
and 13).
Gilbert, R.O. 1987. Statistical Methods for Environmental Pollution Monitoring. Van Nostrand Reinhold. New York.
Provides statistical analysis information by providing sampling plans, statistical tests, parameter estimation procedure
techniques, and references to pertinent publications. The statistical techniques discussed are relatively simple, and examples,
exercise, and case studies are provided to illustrate procedures.
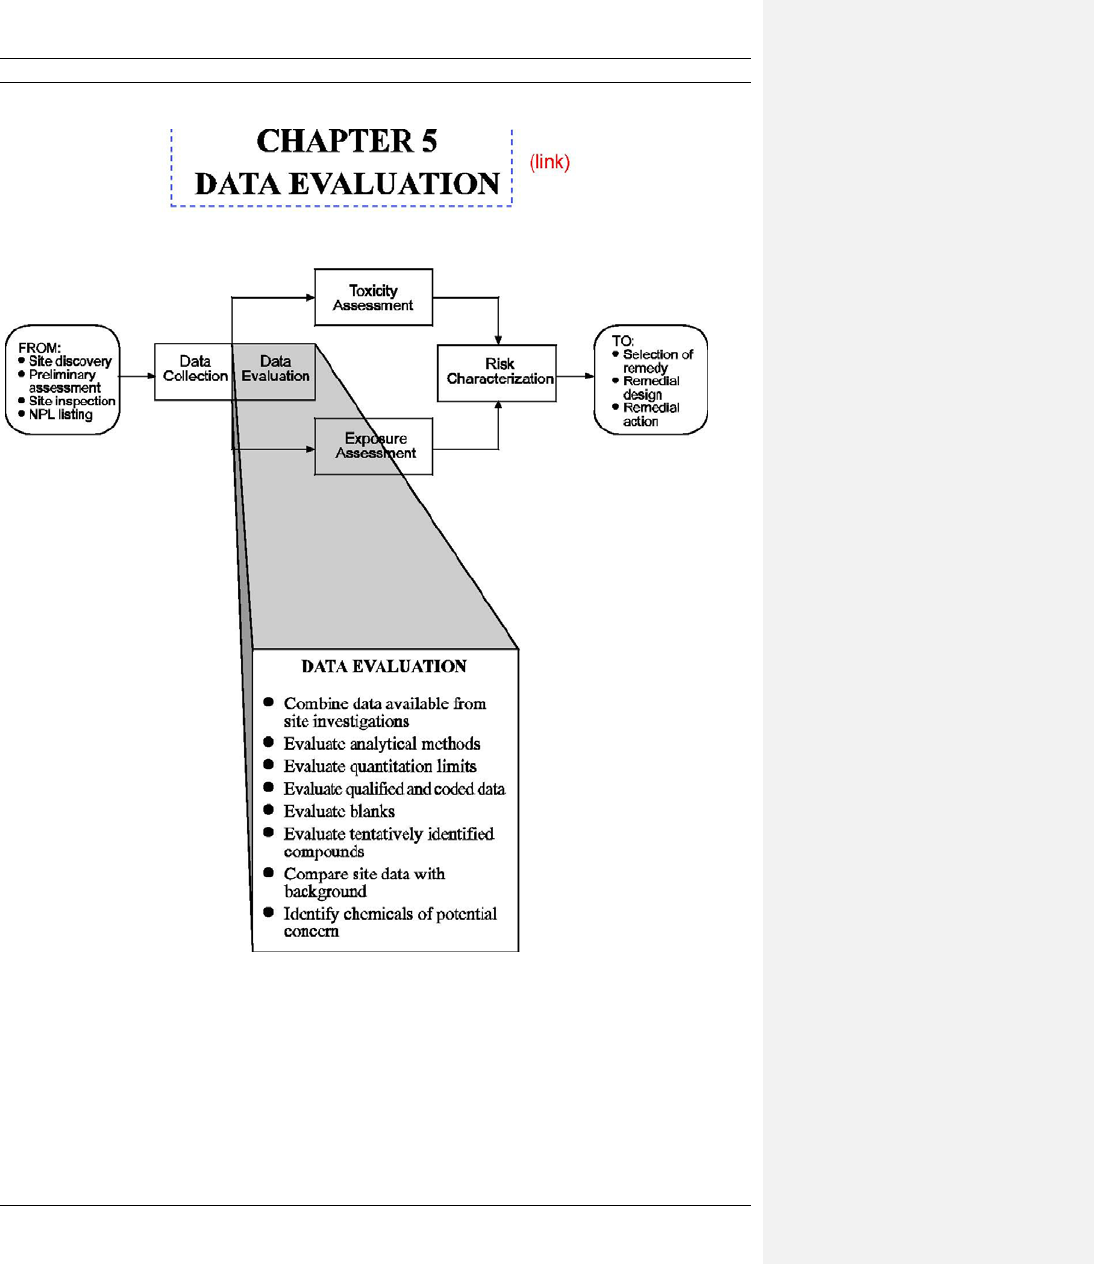

CHAPTER 5
DATA EVALUATION
Comment [A19]: For additional information on
assessing and interpreting data for use in baseline
human health risk assessments, see Chapter 5 of
EPA’s Guidance for Data Useability in Risk
Assessment (Part A). This guidance may be found at:
http://www.epa.gov/oswer/riskassessment/datause/pa
rta.htm
After a site sampling investigation has
been completed (see Chapter 4), a large quantity
of analytical data is usually available. Each
sample may have been analyzed for the presence
of over one hundred chemicals, and many of
those chemicals may have been detected. The
following nine steps should be followed to
organize the data into a form appropriate for a
baseline risk assessment:
(1)gather all data available from the site
investigation and sort by medium (Section
5.1);
(2)evaluate the analytical methods used
(Section 5.2);
(3)evaluate the quality of data with respect to
sample quantitation limits (Section 5.3);
(4)evaluate the quality of data with respect to
qualifiers and codes (Section 5.4);
(5)evaluate the quality of data with espect to
blanks (Section 5.5);
(6)evaluate tentatively identified compounds
(Section 5.6);
(7) compare poten tial site-related
contamination with background (Section
5.7);
(8)develop a set of data for use in the risk
assessment (Section 5.8); and
(9)if appropriate, further limit the number of
chemicals to be carried through the risk
assessment (Section 5.9).
Prior to conducting any of these steps, the
EPA remedial project manager (RPM) should be
consulted to determine if certain steps should be
modified, added, or deleted as a result of site-
specific conditions. Also, some of the steps may
be conducted outside the context of the risk
assessment (e.g., for the feasibility study). The
rationale for not evaluating certain data based on
any of these steps must be fully discussed in the
text of the risk assessment report.
The following sections address each of the
data evaluation steps in detail, and Exhibit 5-1
presents a flowchart of the process. The outcome
of this evaluation is (1) the identification of a set
of chemicals that are likely to be site-related and
(2) reported concentrations that are of acceptable
quality for use in the quantitative risk
assessment.
ACRONYMS FOR CHAPTER 5
CLP = Contract Laboratory Program
CRDL = Contract-Required Detection Limit
CRQL = Contract-Required Quantitation Limit
DL = Detection Limit
FIT = Field Investigation Team
IDL = Instrument Detection Limit
MDL = Method Detection Limit
ND = Non-detect
PE = Performance Evaluation
PQL = Practical Quantitation Limit
QA/QC = Quality Assurance/Quality Control
QL = Quantitation Limit
RAS = Routine Analytical Services
SAS = Special Analytical Services
SMO = Sample Management Office
SOW = Statement of Work
SQL = Sample Quantitation Limit
SVOC = Semivolatile Organic Chemical
TCL = Target Compound List
TIC = Tentatively Identified Compound
TOC = Total Organic Carbon
TOX = Total Organic Halogens
VOC = Volatile Organic Chemical

Page 5-2
DEFINITIONS FOR CHAPTER 5
Chemicals of Potential Concern. Chemicals that are potentially site-related and whose data are of sufficient quality for use in the
quantitative risk assessment.
Common Laboratory Contaminants. Certain organic chemicals (considered by EPA to be acetone, 2-butanone, methylene chloride,
toluene, and the phthalate esters) that are commonly used in the laboratory and thus may be introduced into a sample from laboratory
cross-contamination, not from the site.
Contract-required Quantitation Limit (CRQL). Chemical-specific levels that a CLP laboratory must be able to routinely and reliably
detect and quantitate in specified sample matrices. May or may not be equal to the reported quantitation limit of a given chemical in
a given sample.
Detection Limit (DL). The lowest amount that can be distinguished from the normal "noise" of an analytical instrument or method.
Non-detects (NDs). Chemicals that are not detected in a particular sample above a certain limit, usually the quantitation limit for the
chemical in that sample. Non-detects may be indicated by a "U" data qualifier.
Positive Data. Analytical results for which measurable concentrations (i.e., above a quantitation limit) are reported. May have data
qualifiers attached (except a U, which indicates a non-detect).
Quantitation Limit (QL). The lowest level at which a chemical can be accurately and reproducibly quantitated. Usually equal to the
instrument detection limit multiplied by a factor of three to five, but varies for different chemicals and different samples.
If the nine data evaluation steps are
followed, the number of chemicals to be
considered in the remainder of the risk
assessment usually will be less than the number
of chemicals initially identified. Chemicals
remaining in the quantitative risk assessment
based upon this evaluation are referred to in this
guidance as "chemicals of potential concern."
If the nine data evaluation steps are
followed, the number of chemicals to be
considered in the remainder of the risk
assessment usually will be less than the number
of chemicals initially identified. Chemicals
remaining in the quantitative risk assessment
based upon this evaluation are referred to in this
guidance as “chemicals of potential concern.”
5.1 COMBINING DATA AVAILABLE
FROM SITE INVESTIGATIONS
Gather data, which may be from several
different sampling periods and based on several
different analytical methods, from all available
sources, including field investigation team (FIT)
reports, remedial investigations, preliminary site
assessments, and ongoing site characterization
and alternatives screening activities. Sort data by
medium. A useful table format for presenting
data is shown in Exhibit 5-2.
Evaluate data from different time periods
to determine if concentrations are similar or if
changes have occurred between sampling
periods. If the methods used to analyze samples
from different time periods are similar in terms
of the types of analyses conducted and the
QA/QC procedures followed, and if the
concentrations between sampling periods are
similar, then the data may be combined for the
purposes of quantitative risk assessment in order
to obtain more information to characterize the
site. If concentrations of chemicals change
significantly between sampling periods, it may
be useful to keep the data separate and evaluate
risks separately. Alternatively, one could use
only the most recent data in the quantitative risk
assessment and evaluate older data in a
qualitative analysis of changes in concentrations
over time. The RPM should be consulted on the
elimination of any data sets from the risk
assessment, and justification for such
elimination must be fully described in the risk
assessment report.

Page 5-3
Is
quantitation limit (QL)
> health-based reference
concentration?
No
Yes
Eliminate data associated with
inappropriate methods. Possibly use
qualitatively in other risk
assessment sections.
Sampling data from each
medium of concern
(Sec. 5.1)
If QL cannot be reduced, use QL
or ½ QL as proxy concentration,
or eliminate chemical in sample,
as appropriate.
Analytical
method appropriate
for quantitative
risk assessment
(Sec. 5.1)?
Yes
Yes
Is a
chemical not detected
No
in a sample
(Sec. 5.1)?
Is QL unusually high?
Do other
samples in same
medium test
positive?
No
Yes
No
Use QL or ½ QL as
proxy concentration.
Generally eliminate
chemical.
Yes
Reanalyze or address
qualitatively, as appropriate.
NOTE: See text for details
concerning specific
steps in this flowchart.
Qualifiers
Evaluate qualified data, and
and codes
eliminate, modify, or leave data as
attached to data?
they are, as appropriate.
(Sec.5.4)
No
Blank
Sample
Yes Yes
contamination Common lab
No
concentration ≥ 10x
(Sec. 5.5)? Contaminants?
blank concentration?
No
Sample
concentration ≥ 5x
No
Eliminate blank
blank concentration
contaminants.
?
Yes
Expected
Many
to be present
tentatively identified
Yes Yes
and are primary
compounds (TICs;
contaminants
Sec. 5.6)?
at site
?
No
No
Eliminate TICs (as appropriate)..
Use SAS, if possible, to confirm identity and concentration;
otherwise, use TICs as they are (as appropriate).
Site
Chemicals of potential
No
chemicals equal to
Yes
Calculate risk of background chemicals
Concern for quantitative
background
Separately from site-related chemicals.
risk assessment.
(Sec. 5.7)?
EXHIBIT 5-1
DATA EVALUATION

Area X
Sample Medium Soil Soil Soil
Sample ID SRB-3-1 SRB-3-1DU SRB-3-2
Sample or Screen 0-1’ 0-1’ 2-4’
Depth
Date Collected 12/14/87 12/14/87 12/10/87
Units μg/kg μg/kg μg/kg
Blanks or Duplicates Duplicate
Q
Chemical CRQL
a
Concentration Qualifier
b
CRQL
a
ualifier
Concentration Qualifier
b
CRQL
a
Concentration
b
Aroclor-1016
80
80
U
80
80
U
2000
c
2000
UJ
Aroclor-1221
80
80
U
80
80
U
2000
c
2000
UJ
Aroclor-1232
80
80
U
80
80
U
2000
c
2000
UJ
Aroclor-1242
80
40
J
80
42
J
2000
c
2000
UJ
Aroclor-1248
80
30
J
80
36
J
2000
c
2000
UJ
Aroclor-1254
160
120
J
160
110
J
2000
c
1800
J
Aroclor-1260
160
210
160
220
2000
c
2100
c
Page 5-4
EXHIBIT 5-2
EXAMPLE OF OUTPUT FORMAT FOR VALIDATED DATA
Note: All values other than qualifiers must be entered as numbers, not as labels.
a
Contract-required quantitation limit (unless otherwise noted). Values for illustration only.
b
Refer to Section 5.4 for an explanation of qualifiers.
Sample quantitation unit.

5.2 EVALUATION OF ANALYTICAL
METHODS
Group data according to the types of
analyses conducted (e.g., field screening
analysis, semivolatiles analyzed by EPA
methods for water and wastewater, semivolatiles
analyzed by EPA's Superfund Contract
Laboratory Program [CLP] procedures) to
determine which analytical method results are
Page 5-5
appropriate for use in quantitative risk
assessment. Often, this determination has been
made already by regional and contractor staff.
An overview of EPA analytical methods is
provided in the box below. Exhibit 5-3 presents
examples of the types of data that are not usually
appropriate for use in quantitative risk
assessment, even though they may be available
from a site investigation.
OVERVIEW OF THE CLP AND OTHER EPA ANALYTICAL METHODS
The EPA Contract Laboratory Program (CLP) is intended to provide analytical services for Superfund waste site
samples. As discussed in the User's Guide to the Contract Laboratory Program (EPA 1988a, hereafter referred to as the CLP
User's Guide), the program was developed to fill the need for legally defensible results supported by a high level of quality
assurance (i.e., data of known quality) and documentation.
Prior to becoming CLP laboratories, analytical laboratories must meet stringent requirements for laboratory space and
practices, instrumentation, personnel training, and quality control (QC), and also must successfully analyze performance
evaluation (PE) samples. Before the first samples are shipped to the laboratory, audits of CLP labs are conducted to verify all
representations made by laboratory management. Continuing performance is monitored by periodic PE sample analyses,
routine and remedial audits, contract compliance screening of data packages, and oversight by EPA.
Superfund samples are most commonly analyzed using the Routine Analytical Services (RAS) conducted by CLP
laboratories. Under RAS, all data are generated using the same analytical protocols specifying instrumentation, sample
handling, analysis parameters, required quantitation limits, QC requirements, and report format. Protocols are provided in the
CLP Statement of Work (SOW) for Inorganics (EPA 1988b) and the CLP Statement of Work for Organics (1988c). The
SOWs also contain EPA's target analyte or compound lists (TAL for inorganics, TCL for organics), which are the lists of
analytes and required quantitation limits (QLs) for which every Superfund site sample is routinely analyzed under RAS. As
of June 1989, analytes on the TCL/TAL consist of 34 volatile organic chemicals (VOCs), 65 semivolatile organic chemicals
(SVOCs), 19 pesticides, 7 polychlorinated biphenyls, 23 metals, and total cyanide. Finally, the SOW specifies data qualifiers
that may be placed on certain data by the laboratory to communicate information and/or QC problems.
CLP labs are required to submit RAS data packages to EPA's Sample Management Office (SMO) and to the EPA
region from which the samples originated within 35 days of receipt of samples. SMO provides management, operational, and
administrative support to the CLP to facilitate optimal use of the program. SMO personnel identify incomplete or missing
elements and verify compliance with QA/QC requirements in the appropriate SOW. In addition to the SMO review, all CLP
data are inspected by EPA-appointed regional data validators. Using Laboratory Data Validation Functional Guidelines
issued by EPA headquarters (hereafter referred to as Functional Guidelines for Inorganics [EPA 1988d] and Functional
Guidelines for Organics [EPA 1988e]), regional guidelines, and professional judgment, the person validating data identifies
deviations from the SOW, poor QC results, matrix interferences, and other analytical problems that may compromise the
potential uses of the data. In the validation process, data may be flagged with qualifiers to alert data users of deviations from
QC requirements. These qualifiers differ from those qualifiers attached to the data by the laboratory.
In addition to RAS, non-standard analyses may be conducted using Special Analytical Services (SAS) to meet user
requirements such as short turnaround time, lower QLs, non-standard matrices, and the testing of analytes other than those on
the Target Compound List. Under SAS, the user requests specific analyses, QC procedures, report formats, and timeframe
needed.
Examples of other EPA analytical methods include those described in Test Methods for Evaluating Solid Waste (EPA
1986; hereafter referred to as SW-846 Methods) and Methods for Organic Chemical Analysis of Municipal and Industrial
Wastewater (EPA 1984; hereafter referred to as EPA 600 Methods). The SW-846 Methods provide analytical procedures to
test solid waste to determine if it is a hazardous waste as defined under the Resource Conservation and Recovery Act
(RCRA). These methods include procedures for collecting solid waste samples and for determining reactivity, corrosivity,
ignitability, composition of waste, and mobility of waste components. The EPA 600 Methods are used in regulatory
programs under the Clean Water Act to determine chemicals present in municipal and industrial wastewaters.

Page 5-6
EXHIBIT 5-3
EXAMPLES OF THE TYPES OF DATA POTENTIALLY UNSUITABLE
FOR A QUANTITATIVE RISK ASSESSMENT
Analytical Instrument or Method Purpose of Analysis Analytical Result
HNu Organic Vapor Detector Health and Safety, Field Screen Total Organic Vapor
Organic Vapor Analyzer Health and Safety, Field Screen Total Organic Vapor
Combustible Gas Indicator
Health
and Safety
Combustible Vapors,
Oxygen-deficient
Atmosphere
Field Gas Chromatography
a
Field S
creen/Analytical Method
Specific Volatile and Semi-
volatile Organic Chemicals
a
Depending on the detector used, this instrument can be sufficiently sensitive to yield adequate data
for use in quantitative risk assessment; however, a confirming analysis by GC/MS should be
performed on a subset of the samples in a laboratory prior to use.

Analytical results that are not specific for
a particular compound (e.g., total organic carbon
[TOC], total organic halogens [TOX]) or results
of insensitive analytical methods (e.g., analyses
using portable field instruments such as organic
vapor analyzers and other field screening
methods) may be useful when considering
sources of contamination or potential fate and
transport of contaminants. These types of
analytical results, however, generally are not
appropriate for quantitative risk assessment;
therefore, the risk assessor may not want to
include them in the summary of chemicals of
potential concern for the quantitative risk
assessment. In addition, the results of analytical
methods associated with unknown, few, or no
QA/QC procedures should be eliminated from
further quantitative use. These types of results,
however, may be useful for qualitative
discussions of risk in other sections of the risk
assessment report.
The outcome of this step is a set of site
data that has been developed according to a
standard set of sensitive, chemical-specific
methods (e.g., SW846 Methods [EPA 1986],
EPA 600 Methods [EPA 1984], CLP Statements
of Work [EPA 1988b,c]), with QA/QC
procedures that are well-documented and
traceable. The data resulting from analyses
conducted under the CLP, which generally
comprise the majority of results available from a
Superfund site investigation, fall into this
category.
Although the CLP was developed to
ensure that consistent QA/QC methods are used
when analyzing Superfund site samples, it does
not ensure that all analytical results are
consistently of sufficient quality and reliability
for use in quantitative risk assessment. Neither
the CLP nor QA/QC procedures associated with
other methods make judgments concerning the
ultimate "usability" of the data. Do not accept at
face value all remaining analytical results,
whether from the CLP or from some other set of
analytical methodologies. Instead, determine --
according to the steps discussed below -- the
limitations and uncertainties associated with the
data so that only data that are appropriate and
Page 5-7
reliable for use in a quantitative risk assessment
are carried through the process.
5.3 EVALUATION OF QUANTITATION
LIMITS
This step involves evaluation of quantitation
limits and detection limits (QLs and DLs) for all
of the chemicals assessed at the site. This
evaluation may lead to the re-analysis of some
samples, the use of "proxy" (or estimated)
concentrations, and/or the elimination of certain
chemicals from further consideration (because
they are believed to be absent from the site).
Types and definitions of QLs and DLs are
presented in the box on the next page.
Before eliminating chemicals because they are
not detected (or conducting any other
manipulation of the data), the following points
should be considered:
(1) the sample quantitation limit (SQL) of a
chemical may be greater than
corresponding standards, criteria, or
concentrations derived from toxicity
reference values (and, therefore, the
chemical may be present at levels greater
than these corresponding reference
concentrations, which may result in
undetected risk); and
(2) a particular SQL may be significantly
higher than positively detected values in
other samples in a data set.
These two points are discussed in detail in
the following two subsections. A third
subsection provides guidance for situations
where only some of the samples for a given
medium test positive for a particular chemical. A
fourth subsection addresses the special situation
where SQLs are not available. The final
subsection addresses the specific steps involved
with elimination of chemicals from the
quantitative risk assessment based on their QLs.
Comment [A20]: For additional information
on assessing data quality indicators and
interpretation of qualified and coded data, see
Section 5.6 of EPA’s
Guidance for Data
Useability in Risk Assessment (Part A)
. This
guidance may be found at:
http://www.epa.gov/oswer/riskassessment/data
use/parta.htm

Page 5-8
5.3.1 SAMPLE QUANTITATION LIMITS
(SQLS) THAT ARE GREATER THAN
REFERENCE CONCENTRATIONS
As discussed in Chapter 4, QLs needed for
the site investigation should be specified in the
sampling plan. For some chemicals, however,
SQLs obtained under RAS or SAS may exceed
certain reference concentrations (e.g., maximum
contaminant levels [MCLs], concentrations
corresponding to a 10
-6
cancer risk). The box on
the next page illustrates this problem. For certain
chemicals (e.g., antimony), the CLP contract-
required quantitation limits (CRQLs) exceed the
corresponding reference concentrations for
noncarcinogenic effects, based on the EPA-
verified reference dose and a 2-liter per day
ingestion by a 70-kilogram person.
1
Estimation
of cancer risks for several other chemicals (e.g.,
arsenic, styrene) at their CRQLs yields cancer
risks exceeding 10
-4
, based on the same water
ingestion factors. Most potential carcinogens
with EPA-derived slope factors have CRQLs
that yield cancer risk levels exceeding 10
-6
in
water, and none of the carcinogens with EPA-
derived slope factors have CRQL values
yielding less than 10
-7
cancer risk levels (as of
the publication date of this manual; data not
shown).
Three points should be noted when considering
this example.
(1) Review of site information and a
preliminary determination of chemicals of
potential concern at a site prior to sample
collection may allow the specification of
lower QLs (i.e., using SAS) before an
investigation begins (see Chapter 4). This
is the most efficient way to minimize the
problem of QLs exceeding levels of
potential concern.
(2) EPA's Analytical Operations Branch
currently is working to reduce the CRQL
values for several chemicals on the TCL
TYPES AND DEFINITIONS OF DETECTION LIMITS AND QUANTITATION LIMITS
Strictly interpreted, the detection limit (DL) is the lowest amount of a chemical that can be "seen" above the normal,
random noise of an analytical instrument or method. A chemical present below that level cannot reliably be distinguished
from noise. DLs are chemical-specific and instrument-specific and are determined by statistical treatment of multiple
analyses in which the ratio of the lowest amount observed to the electronic noise level (i.e., the signal-to-noise ratio) is
determined. On any given day in any given sample, the calculated limit may not be attainable; however, a properly
calculated limit can be used as an overall general measure of laboratory performance.
Two types of DLs may be described -- instrument DLs (IDLs) and method DLs (MDLs). The IDL is generally the
lowest amount of a substance that can be detected by an instrument; it is a measure only of the DL for the instrument, and
does not consider any effects that sample matrix, handling, and preparation may have. The MDL, on the other hand, takes
into account the reagents, sample matrix, and preparation steps applied to a sample in specific analytical methods.
Due to the irregular nature of instrument or method noise, reproducible quantitation of a chemical is not possible at
the DL. Generally, a factor of three to five is applied to the DL to obtain a quantitation limit (QL), which is considered to be
the lowest level at which a chemical may be accurately and reproducibly quantitated. DLs indicate the level at which a small
amount would be "seen," whereas QLs indicate the levels at which measurements can be "trusted."
Two types of QLs may be described -- contract-required QLs (CRQLs) and sample QLs (SQLs). (Contract-required
detection limits [CRDL] is the term used for inorganic chemicals. For the purposes of this manual, however, CRQL will
refer to both organic and inorganic chemicals.) In order to participate in the CLP, a laboratory must be able to meet EPA
CRQLs. CRQLs are chemical-specific and vary depending on the medium analyzed and the amount of chemical expected to
be present in the sample. As the name implies, CRQLs are not necessarily the lowest detectable levels achievable, but rather
are levels that a CLP laboratory should routinely and reliably detect and quantitate in a variety of sample matrices. A
specific sample may require adjustments to the preparation or analytical method (e.g., dilution, use of a smaller sample
aliquot) in order to be analyzed. In these cases, the reported QL must in turn be adjusted. Therefore, SQLs, not CRQLs, will
be the QLs of interest for most samples. In fact, for the same chemical, a specific SQL may be higher than, lower than, or
equal to SQL values for other samples. In addition, preparation or analytical adjustments such as dilution of a sample for
quantitation of an extremely high level of only one compound could result in non-detects for all other compounds included
as analytes for a particular method, even though these compounds may have been present at trace quantities in the undiluted
sample. Because SQLs take into account sample characteristics, sample preparation, and analytical adjustments, these
values are the most relevant QLs for evaluating non-detected chemicals.

Page 5-9
and TAL, and to develop an analytical
service for chemicals with special
standards (e.g., MCLs).
(3) In several situations, an analytical
laboratory may be able to attain QLs in
particular samples that are below or above
the CRQL values.
If
SAS was not s
pecified before sampling
began and/or if a chemical
is not detected in any
sample
from
a particular
medium
at the QL, then
available modeling data, as well as professional
judgment, should b
e
used to evaluate whether
the chemical
may be present above reference
concentrations. If the available information
indicates the che
mical
is not present, see Section
5.3.5 for guidance on e
liminating chemicals. If
there is some indication that
the chemical
is
present, then either reanalyze selected
samples
using SAS, if time allows, or address the
chemical qualitatively. In determining which
option is most
appropriate
for a site, a sc
reening-
level risk assessment should be performed by
assuming that the che
mical is present in the
sample at the
SQL (see Section 5.3.4 for
situations where SQLs are not available). Carry
the
chemical
through the screening risk
assessment, essentially
conducting the assessment
on the SQL for the particular chemical. In this
way, the risks that
would be posed if the
chemical
is present at the SQL can be compared
with risks
posed by other chemicals
at the site.
Re-analyze
the sample. This (preferred)
option discourages elimination of questionable
chemicals (i.e., chemicals that may be present
below their QL but above a level of potential
concern) from
the risk assessment. If
time
allows and a
sufficient quantity of the sample is

Page 5-10
available, submit a SAS request to re-analyze
the sample at QLs that are below reference
concentrations. The possible outcome of this
option is inclusion of chemicals positively
detected at levels above reference concentrations
but below the QLs that would normally have
been attained under routine analysis of
Superfund samples in the CLP program.
Address the chemical qualitatively. A
second and less desirable option for a chemical
that may be present below its QL (and possibly
above its health-based reference concentration)
is to eliminate the chemical from the quantitative
risk assessment, noting that if the chemical was
detected at a lower QL, then its presence and
concentration could contribute significantly to
the estimated risks.
5.3.2 UNUSUALLY HIGH SQLS
Due to one or more sample-specific problems
(e.g., matrix interferences), SQLs for a particular
chemical in some samples may be unusually
high, sometimes greatly exceeding the positive
results reported for the same chemical in other
samples from the data set. Even if these SQLs
do not exceed health-based standards or criteria,
they may still present problems. If the SQLs
EXAMPLE OF UNUSUALLY HIGH
QUANTIFICATION LIMITS
In this example, concentrations of semivolatile organic
chemicals in soils have been determined using the
CLP's RAS.
Concentration (ug/kg)
Chemical Sample 1 Sample 2 Sample 3 Sample 4
Phenol 330 U
a
390 19,000 U 490
a
U = Compound was analyzed for, but not detected.
Value presented (e.g., 330 U) is the SQL.
The QLs presented in this example (i.e., 330 to 19,000
μg/kg) vary widely from sample to sample. SAS would
not aid in reducing the unusually high QL of 19,000
ug/kg noted in Sample 3, assuming it was due to
unavoidable matrix interferences. In this case, the
result for phenol in Sample 3 would be eliminated from
the quantitative risk assessment because it would cause
the calculated exposure concentrations (from Chapter
6) to exceed the maximum detected concentration (in
this case 490 ug/kg). Thus, the data set would be
reduced to three samples: the non-detect in Sample 1
and the two detected values in Samples 2 and 4.
cannot be reduced by re-analyzing the sample
(e.g., through the use of SAS or sample cleaning
procedures to remove matrix interferences),
exclude the samples from the quantitative risk
assessment if they cause the calculated exposure
concentration (i.e., the concentration calculated
according to guidance in Chapter 6) to exceed
the maximum detected concentration for a
particular sample set. The box on this page
presents an example of how to address a
situation with unusually high QLs.
5.3.3 WHEN ONLY SOME SAMPLES IN A
MEDIUM TEST POSITIVE FOR A
CHEMICAL
Most analytes at a site are not positively
detected in each sample collected and analyzed.
Instead, for a particular chemical the data set
generally will contain some samples with
positive results and others with non-detected
results. The non-detected results usually are
reported as SQLs. These limits indicate that the
chemical was not measured above certain levels,
which may vary from sample to sample. The
chemical may be present at a concentration just
below the reported quantitation limit, or it may
not be present in the sample at all (i.e., the
concentration in the sample is zero).
In determining the concentrations most
representative of potential exposures at the site
(see Chapter 6), consider the positively detected
results together with the non-detected results
(i.e., the SQLs). If there is reason to believe that
the chemical is present in a sample at a
concentration below the SQL, use one-half of
the SQL as a proxy concentration. The SQL
value itself can be used if there is reason to
believe the concentration is closer to it than to
one-half the SQL. (See the next subsection for
situations where SQLs are not available.)
Unless site-specific information indicates that a
chemical is not likely to be present in a sample,
do not substitute the value zero in place of the
SQL (i.e., do not assume that a chemical that is
not detected at the SQL would not be detected in
the sample if the analysis was extremely
sensitive). Also, do not simply omit the non-
detected results from the risk assessment.

5.3.4 WHEN SQLS ARE NOT AVAILABLE
A fourth situation concerning QLs may
sometimes be encountered when evaluating site
data. For some sites, data summaries may not
provide the SQLs. Instead, MDLs, CRQLs, or
even IDLs may have been substituted wherever
a chemical was not detected. Sometimes, no
detection or quantitation limits may be provided
with the data. As a first step in these situations,
always attempt to obtain the SQLs, because
these are the most appropriate limits to consider
when evaluating non-detected chemicals (i.e.,
they account for sample characteristics, sample
preparation, or analytical adjustments that may
differ from sample to sample).
If SQLs cannot be obtained, then, for CLP
sample analyses, the CRQL should be used as
the QL of interest for each non-detected
chemical, with the understanding that these
limits may overestimate or underestimate the
actual SQL. For samples analyzed by methods
different from CLP methods, the MDL may be
used as the QL, with the understanding that in
most cases this will underestimate the SQL
(because the MDL is a measure of detection
limits only and does not account for sample
characteristics or matrix interferences). Note that
the IDL should rarely be used for non-detected
chemicals since it is a measure only of the
detection limit for a particular instrument and
does not consider the effect of sample handling
and preparation or sample characteristics.
5.3.5 WHEN CHEMICALS ARE NOT
DETECTED IN ANY SAMPLES IN A
MEDIUM
After considering the discussion provided
in the above subsections, generally eliminate
those chemicals that have not been detected in
any samples of a particular medium. On CLP
data reports, these chemicals will be designated
in each sample with a U qualifier preceded by
the SQL or CRQL (e.g., 10 U). If information
exists to indicate that the chemicals are present,
they should not be eliminated. For example, if
chemicals with similar transport and fate
characteristics are detected frequently in soil at a
site, and some of these chemicals also are
Page 5-11
detected frequently in ground water while the
others are not detected, then the undetected
chemicals are probably present in the ground
water and therefore may need to be included in
the risk assessment as ground-water
contaminants.
The outcome of this step is a data set that
only contains chemicals for which positive data
(i.e., analytical results for which measurable
concentrations are reported) are available in at
least one sample from each medium. Unless
otherwise indicated, assume at this point in the
evaluation of data that positive data to which no
uncertainties are attached concerning either the
assigned identity of the chemical or the reported
concentration (i.e., data that are not "tentative,"
"uncertain," or "qualitative") are appropriate for
use in the quantitative risk assessment.
5.4 EVALUATION OF QUALIFIED AND
CODED DATA
For CLP analytical results, various
qualifiers and codes (hereafter referred to as
qualifiers) are attached to certain data by either
the laboratories conducting the analyses or by
persons performing data validation. These
qualifiers often pertain to QA/QC problems and
generally indicate questions concerning
chemical identity, chemical concentration, or
both. All qualifiers must be addressed before the
chemical can be used in quantitative risk
assessment. Qualifiers used by the laboratory
may differ from those used by data validation
personnel in either identity or meaning.
5.4.1 TYPES OF QUALIFIERS
A list of the qualifiers that laboratories are
permitted to use under the CLP --and their
potential use in risk assessment -- is presented in
Exhibit 5-4. A similar list addressing data
validation qualifiers is provided in Exhibit 5-5.
In general, because the data validation process is
intended to assess the effect of QC issues on
data usability, validation data qualifiers are
attached to the data after the laboratory
qualifiers and supersede the laboratory
qualifiers.
Comment [A21]: For additional information
on assessing data quality indicators and
interpretation of qualified and coded data, see
Section 5.6 of EPA’s
Guidance for Data
Useability in Risk Assessment (Part A)
. This
guidance may be found at:
http://www.epa.gov/oswer/riskassessment/data
use/parta.htm

Page 5-12
EXHIBIT 5-4
CLP LABORATORY DATA QUALIFIERS AND THEIR POTENTIAL USE
IN QUANTITATIVE RISK ASSESSMENT
Indicates:
Include Data in
Uncertain Uncertain Quantitative Risk
Qualifier Definition Identity Concentration? Assessment?
Inorganic Chemical Data:
a
B Reported value is <CRDL, but No No Yes
>IDL.
U Compound was analyzed for, Yes Yes ?
but not detected.
E Value is estimated due to No Yes Yes
matrix interferences.
M Duplicate injection precision No Yes Yes
criteria not met.
N Spiked sample recovery not No Yes Yes
within control limits.
S Reported value was determined No No Yes
by the Method of Standard
Additions (MSA).
W Post-digestion spike for furnace No Yes Yes
AA analysis is out of control
limits, while sample absorbance
is <50% of spike absorbance.
* Duplicate analysis was not No Yes Yes
within control limits.
+ Correlation coefficient for MSA Yes Yes ?
was <0.995.
Organic Chemical Data:
b
U Compound was analyzed for, Yes Yes ?
but not detected.
(continued)

Page 5-13
EXHIBIT 5-4 (CONTINUED)
CLP LABORATORY DATA QUALIFIERS AND THEIR POTENTIAL USE
IN QUANTITATIVE RISK ASSESSMENT
Indicates:
Include Data in
Uncertain Uncertain Quantitative Risk
Qualifier Definition Identity Concentration? Assessment?
J Value is estimated, either for a
No, for TCL No
Yes
tentatively identified
chemicals;
compound (TIC) or when a
compound is
present (spectral
identification criteria are m
et,
but the value is <CRQL).
C
Pesticide results were
Yes, for TICs
Yes ?
confirmed by
GC/MS.
B
Analyte found in
associated
No No Yes
blank as well as
in
sample.
c
E Concentration exceeds No Yes Yes
calibration range of GC/MS
instrument.
D Compound identified in an No No Yes
analysis at a secondary
dilution factor.
A The TIC is a suspected aldol- Yes No Yes
condensation product.
X Additional flags defined — — —
separately.
— = Data will vary with laboratory conducting analyses.
a
Source: EPA 1988b.
b
Source: EPA 1988c. See Section 5.5 for guidance concerning blank contamination. Exhibit 5-5
Validation Data Qualifiers and Their
Potential Use in Quantitative Risk Assessment

Page 5-14
EXHIBIT 5-5
VALIDATION DATA QUALIFIERS AND THEIR
POTENTIAL USE IN QUANTITATIVE RISK ASSESSMENT
Indicates:
Include Data in
Uncertain Uncertain Quantitative Risk
Qualifier Definition Identity Concentration? Assessment?
Inorganic and Organic Chemical Data:
a
U The material was analyzed Yes Yes ?
for, but not detected. The
associated numerical value
is the SQL.
J The associated numerical
No Yes Yes
value is an estimated
quantity.
R Quali ty control indicates No Yes Yes
that the data are unusable
(compound may or may not
be present). Re-sampling
and/or re-analysis is
necessary for verification.
Z No analytical result
No Yes Yes
(inorganic data only).
Q No analytical result
No No Yes
(organic data only).
N Presumptive evidence of
No Yes Yes
presence of material
(tentative identification).
b
– = Not applicable
a
Source: EPA 1988d,e.
b
Organic chemical data only

If data have both laboratory and validation
qualifiers and they appear contradictory, ignore
the laboratory qualifier and consider only the
validation qualifier. If qualifiers have been
attached to certain data by the laboratory and
have not been removed, revised, or superseded
during data validation, then evaluate the
laboratory qualifier itself. If it is unclear whether
the data have been validated, contact the
appropriate data validation and/or laboratory
personnel.
The type of qualifier and other site-
specific factors determine how qualified data are
to be used in a risk assessment. As seen in
Exhibits 54 and 5-5, the type of qualifier
attached to certain data often indicates how that
data should be used in a risk assessment. For
example, most of the laboratory qualifiers for
both inorganic chemical data and organic
chemical data (e.g., J, E, N) indicate uncertainty
in the reported concentration of the chemical,
but not in its assigned identity. Therefore, these
data can be used just as positive data with no
qualifiers or codes. In general, include data with
qualifiers that indicate uncertainties in
concentrations but not in identification.
Examples showing the use of certain
qualified data are presented in the next two
boxes. The first box addresses the J qualifier, the
most commonly encountered data qualifier in
Superfund data packages. Basically, the
guidance here is to use J-qualified
EXAMPLE OF J QUALIFIERS
In this example, concentrations of volatile organic
chemicals in ground water have been determined using
the CLP's RAS.
Concentration (μg/L)
Chemical Sample 1 Sample 2 Sample 3 Sample 4
Tetrachloro-
ethene 14,000 J
a
40 30 U
b
20 J
a
J = The numerical value is an estimated quantity.
b
U
= Compound was analyzed for, but not detected. Value
presented (e.g., 30 U) is the SQL.
Tetrachlorethene was detected in three of four samples
at concentrations of 14,000 µg/1, 40 µg/1, and 20 μg/1;
therefore, these concentrations – as well as the non-
detect – should be used in determining representative
concentrations.
Page 5-15
concentrations the same way as positive data
that do not have this qualifier. If possible, note
potential uncertainties associated with the
qualifier, so that if data qualified with a J
contribute significantly to the risk, then
appropriate caveats can be attached.
An illustration of the use of R-qualified
data is presented in the box in this column. The
definition, and therefore the use of the R
qualifier, differs depending on whether the data
have been validated or not. (Note that the CLP
formerly used R as a laboratory qualifier to
indicate low spike recovery for inorganics. This
has been changed, but older data may still have
been qualified by the laboratory with an R.) If it
is known that the R data qualifier indicates that
the sample result was rejected by the data
validation personnel, then this result should be
eliminated from the risk assessment; if the R
data qualifier was placed on the data to indicate
estimated data due to low spike recovery (i.e.,
the R was placed on the data by the laboratory
and not by the validator), then use the R-
qualified data in a manner similar to the use of J-
qualified data (i.e., use the R-qualified
concentrations the same way as positive data
that do not have this qualifier). If possible, note
whether the R-qualified data are overestimates
EXAMPLE OF VALIDATED DATA
CONTAINING R QUALIFIERS
In this example, concentrations of inorganic chemicals
in ground water have been determined using the CLP's
RAS.
Concentration (μg/L)
Chemical Sample 1 Sample 2 Sample 3 Sample 4
Manganese 310 500 R
a
30 UR
b
500
a
R = Quality control indicates that the data are
unusable (compound may or may not be present).
b
U = Compound was analyzed for, but not detected.
Value presented (e.g., 30 U) is the SQL.
These data have been validated, and therefore the R
qualifiers indicate that the person conducting the data
validation rejected the data for manganese in Samples
2 and 3. The "UR" qualifier means that manganese was
not detected in Sample 3; however, the data validator
rejected the non-detected result. Eliminate these two
samples so that the data set now consists of only two
samples (Samples 1

Page 5-16
or underestimates of actual expected chemical
concentrations so that appropriate caveats may
be attached if data qualified with an R contribute
significantly to the risk.
5.4.2 USING THE APPROPRIATE
QUALIFIERS
The information presented in Exhibits 5-4
and 5-5 is based on the most recent EPA
guidance documents concerning qualifiers: the
SOW for Inorganics and the SOW for Organics
(EPA 1988b,c) for laboratory qualifiers, and the
Functional Guidelines for Inorganics and the
Functional Guidelines for Organics (EPA
1988d,e) for validation qualifiers. The types and
definitions of qualifiers, however, may be
periodically updated within the CLP program. In
addition, certain EPA regions may have their
own data qualifiers and associated definitions.
These regional qualifiers are generally consistent
with the Functional Guidelines, but are designed
to convey additional information to data users.
In general, the risk assessor should check
whether the information presented in this section
is current by contacting the appropriate regional
CLP or headquarters Analytical Operations
Branch staff. Also, if definitions are not reported
with the data, regional contacts should be
consulted prior
to evaluating qualified data.
These variations may affect how data with
certain qualifiers should be used in a risk
assessment. Make sure that definitions of data
qualifiers used in the data set for the site have
been reported with the data and are current.
Never guess about the definition of qualifiers.
5.5 COMPARISON OF
CONCENTRATIONS DETECTED IN
BLANKS WITH CONCENTRATIONS
DETECTED IN SAMPLES
Blank samples provide a measure of
contamination that has been introduced into a
sample set either (1) in the field while the
samples were being collected or transported to
the laboratory or (2) in the laboratory during
sample preparation or analysis. To prevent the
inclusion of non-site-related contaminants in the
risk assessment, the concentrations of chemicals
detected in blanks must be compared with
concentrations of the same chemicals detected in
site samples. Detailed definitions of different
types of blanks are provided in the box on the
next page.
Blank data should be compared with
results from samples with which the blanks are
associated. It is often impossible, however, to
determine the association between certain blanks
and data. In this case, compare the blank data
with results from the entire sample data set. Use
the guidelines in the following paragraphs when
comparing sample concentrations with blank
concentrations.
Blanks containing common laboratory
contaminants. As discussed in the CLP SOW
for Organics (EPA 1988c) and the Functional
Guidelines for Organics (EPA 1988e), acetone,
2butanone (or methyl ethyl ketone), methylene
chloride, toluene, and the phthalate esters are
considered by EPA to be common laboratory
contaminants. In accordance with the Functional
Guidelines for Organics (EPA 1988e) and the
Functional Guidelines for Inorganics (EPA
1988d), if the blank contains detectable levels of
common laboratory contaminants, then the
sample results should be considered as positive
results only
if the concentrations in the sample
exceed ten times the maximum amount detected
in any blank. If the concentration of a common
laboratory contaminant is less than ten times the
blank concentration, then conclude that the
chemical was not detected in the particular
sample and, in accordance with EPA guidance,
consider the blank-related concentrations of the
chemical to be the quantitation limit for the
chemical in that sample. Note that if all samples
contain levels of a common laboratory
contaminant that are less than ten times the level
of contamination noted in the blank, then
completely eliminate that chemical from the set
of sample results.
Blanks containing chemicals that are
not common laboratory contaminants. As
discussed in the previously referenced guidance,
if the blank contains detectable levels of one or
more organic or inorganic chemicals that are not
considered by EPA to be common laboratory

Page 5-17
TYPES OF BLANKS
Blanks are analytical quality control samples analyzed in the same manner as site samples. They are used in the
measurement of contamination that has been introduced into a sample either (1) in the field while the samples
were being collected or transported to the laboratory or (2) in the laboratory during sample preparation or
analysis. Four types of blanks -- trip, field, laboratory calibration, and laboratory reagent (or method) -- are
described below. A discussion on the water used for the blank also is provided.
Trip Blank. This type of blank is used to indicate potential contamination due to migration of volatile organic
chemicals (VOCs) from the air on the site or in sample shipping containers, through the septum or around the lid
of sampling vials, and into the sample. A trip blank consists of laboratory distilled, deionized water in a 40-ml
glass vial sealed with a teflon septum. The blank accompanies the empty sample bottles to the field as well as
the samples returning to the laboratory for analysis; it is not opened until it is analyzed in the lab with the actual
site samples. The containers and labels for trip blanks should be the same as the containers and labels for actual
samples, thus making the laboratory "blind" to the identity of the blanks.
Field Blank. A field blank is used to determine if certain field sampling or cleaning procedures (e.g., insufficient
cleaning of sampling equipment) result in cross-contamination of site samples. Like the trip blank, the field
blank is a sample of distilled, deionized water taken to the field with empty sample bottles and is analyzed in the
laboratory along with the actual samples. Unlike the trip blank, however, the field blank sample is opened in the
field and used as a sample would be (e.g., it is poured through cleaned sampling equipment or it is poured from
container to container in the vicinity of a gas-powered pump). As with trip blanks, the field blanks' containers
and labels should be the same as for actual samples.
Laboratory Calibration Blank. This type of blank is distilled, deionized water injected directly into an instrument
without having been treated with reagents appropriate to the analytical method used to analyze actual site
samples. This type of blank is used to indicate contamination in the instrument itself, or possibly in the distilled,
deionized water.
Laboratory Reagent or Method Blank. This blank results from the treatment of distilled, deionized water with all
of the reagents and manipulations (e.g., digestions or extractions) to which site samples will be subjected.
Positive results in the reagent blank may indicate either contamination of the chemical reagents or the glassware
and implements used to store or prepare the sample and resulting solutions. Although a laboratory following
good laboratory practices will have its analytical processes under control, in some instances method blank
contamination cannot be entirely eliminated.
Water Used for Blanks. For all the blanks described above, results are reliable only if the water comprising the
blank was clean. For example, if the laboratory water comprising the trip blank was contaminated with VOCs
prior to being taken to the field, then the source of VOC contamination in the trip blank cannot be isolated (see
laboratory calibration blank).
contaminants (e.g., all other chemicals on the
TCL), then consider site sample results as
positive only if the concentration of the chemical
in the site sample exceeds five times the
maximum amount detected in any blank. Treat
samples containing less than five times the
amount in any blank as non-detects and, in
accordance with EPA guidance, consider the
blank-related chemical concentration to be the
quantitation limit for the chemical in that
sample. Again, note that if all samples contain
levels of a
TCL chemical that are less than five
times the level of contamination noted in the
blank, then completely eliminate that chemical
from the set of sample results.
5.6 EVALUATION OF TENTATIVELY
IDENTIFIED COMPOUNDS
Both the identity and reported concentration
of a tentatively identified compound (TIC) is
questionable (see the box on the next page for
background on TICs). Two options for addressing
TICs exist, depending on the relative number of
TICs compared to non-TICs.

Page 5-18
5.6.1 WHEN FEW TICS ARE PRESENT
When only a few TICs are present
compared to the TAL and TCL chemicals, and
no historical or other site information indicates
that either a particular TIC may indeed be
present at the site (e.g., because it may be a by-
product of a chemical operation conducted when
the site was active) or that the estimated
concentration may be very high (i.e., the risk
would be dominated by the TIC), then generally
do not include the TICs in the risk assessment.
Otherwise, follow the guidance provided in the
next subsection. Consult with the RPM about
omitting TICs from the quantitative
risk
assessment, and document reasons for excluding
TICs in the risk assessment report.
TENTATIVELY IDENTIFIED
COMPOUNDS
EPA's TCL may be a limited subset of the organic
compounds that could actually be encountered at a
particular site. Thus, although the CLP RAS requires
the laboratory to analyze samples only for compounds
on the TCL, the analysis of VOCs and SVOCs may
indicate the presence of additional organic compounds
not on the TCL. These additional compounds are
shown by "peaks" on the chromatograms. (A
chromatogram is a paper representation of the response
of the instrument to the presence of a compound.) The
CLP laboratory must attempt to identify the 30 highest
peaks (10 VOCs and 20 SVOCs) using computerized
searches of a library containing mass spectra
(essentially "fingerprints" for particular compounds).
When the mass spectra match to a certain degree, the
compound (or general class of compound) is named;
however, the assigned identity is in most cases highly
uncertain. These compounds are called tentatively
identified compounds (TICs).
The CLP SOW provides procedures to obtain a rough
estimate of concentration of TICs. These estimates,
however, are highly uncertain and could be orders of
magnitude higher or lower than the actual
concentration. For TICs, therefore, assigned identities
may be inaccurate, and quantitation is certainly
inaccurate. Due to these uncertainties, TIC information
often is not provided with data summaries from site
investigations. Additional sampling and analysis under
SAS may reduce the uncertainty associated with TICs
and, therefore, TIC information should be sought when
it is absent from data summaries.
5.6.2 WHEN MANY TICS ARE PRESENT
If many TICs are present relative to the
TAL and TCL compounds identified, or if TIC
concentrations appear high or site information
indicates that TICs are indeed present, then
further evaluation of TICs is necessary. If
sufficient time is available, use SAS to confirm
the identity and to positively and reliably
measure the concentrations of TICs prior to their
use in the risk assessment. If SAS methods to
identify and measure TICs are unavailable, or if
there is insufficient time to use SAS, then the
TICs should be included as chemicals of
potential concern in the risk assessment and the
uncertainty in both identity and concentration
should be noted (unless information exists to
indicate that the TICs are not present).
5.7 COMPARISON OF SAMPLES WITH
BACKGROUND
In some cases, a comparison of sample
concentrations with background concentrations
(e.g., using the geometric mean concentrations
of the two data sets) is useful for identifying the
non-site-related chemicals that are found at or
near the site. If background risk might be a
concern, it should be calculated separately from
site-related risk. Often, however, the comparison
of samples with background is unnecessary
because of the low risk usually posed by the
background chemicals compared to site-related
chemicals.
As discussed in Chapter 4, information
collected during the RI can provide information
on two types of background chemicals: (1)
naturally occurring chemicals that have not been
influenced by humans and (2) chemicals that are
present due to anthropogenic sources. Either
type of background chemical can be either
localized or ubiquitous.
Information on background chemicals
may have been obtained by the collection of
site-specific background samples and/or from
other sources (e.g., County Soil Conservation
Service surveys, United States Geological
Survey [USGS] reports). As discussed in
Comment [A22]: Supplemental information on
use of statistical methods in comparing site and
background data may be found in EPA’s Guidance
for Comparing Background and Chemical
Concentrations in Soil for CERCLA Sites at:
http://www.epa.gov/oswer/riskassessment/pdf/backg
round.pdf

Chapter 4, background concentrations should be
from the site or the vicinity of the site.
5.7.1 USE APPROPRIATE BACKGROUND
DATA
Background samples collected during the
site investigation should not be used if they were
obtained from areas influenced or potentially
influenced by the site. Instead, the literature
sources mentioned in the previous paragraph
may be consulted to determine background
levels of chemicals in the vicinity of the site.
Care must be taken in using literature sources,
because the data contained therein might
represent nationwide variation in a particular
parameter rather than variation typical of the
geographic region or geological setting in which
the site is located. For example, a literature
source providing concentrations of chemicals in
ground water on a national scale may show a
wide range of concentrations that is not
representative of the variation in concentrations
that would be expected at a particular site.
5.7.2 IDENTIFY STATISTICAL METHODS
In cases where background comparisons will be
made, any statistical methods that will be used
should be identified prior to the collection of
samples (see Chapter 4). Guidance documents and
reports that are available to aid in background
comparison are listed in Section 4.4.3. Prior to
conducting the steps discussed in the next two
subsections, the RPM should be consulted to
determine the type of comparison to be made, if
any. Both a justification for eliminating chemicals
based on a background comparison and a brief
overview of the type of comparison conducted
should be included in the risk assessment report.
5.7.3 COMPARE CHEMICAL
CONCENTRATIONS WITH
NATURALLY OCCURRING LEVELS
As defined previously, naturally occurring levels
are levels of chemicals that are present under
ambient conditions and that have not been
increased by anthropogenic sources. If inorganic
chemicals are present at the site at naturally
occurring levels, they may be eliminated from
the quantitative risk assessment. In some cases,
Page 5-19
however, background concentrations may
present a significant risk, and, while cleanup
may or may not eliminate this risk, the
background risk may be an important site
characteristic to those exposed. The RPM will
always have the option to consider the risk
posed by naturally occurring background
chemicals separately.
In general, comparison with naturally
occurring levels is applicable only to inorganic
chemicals, because the majority of organic
chemicals found at Superfund sites are not
naturally occurring (even though they may be
ubiquitous). The presence of organic chemicals
in background samples collected during a site
investigation actually may indicate that the
sample was collected in an area influenced by
site contamination and therefore does not qualify
as a true background sample. Such samples
should instead be included with other site
samples in the risk assessment. Unless a very
strong case can be made for the natural
occurrence of an organic chemical, do not
eliminate it from the quantitative risk assessment
for this reason.
5.7.4 COMPARE CHEMICAL
CONCENTRATIONS WITH
ANTHROPOGENIC LEVELS
Anthropogenic levels are ambient
concentrations resulting from human (non-site)
sources. Localized anthropogenic background is
often caused by a point source such as a nearby
factory. Ubiquitous anthropogenic background is
often from nonpoint sources such as
automobiles. In general, do not eliminate
anthropogenic chemicals because, at many sites,
it is extremely difficult to conclusively show at
this stage of the site investigation that such
chemicals are present at the site due to operations
not related to the site or the surrounding area.
Often, anthropogenic background chemicals
can be identified and considered separately
during or at the end of the risk assessment.
These chemicals also can be omitted entirely
from the risk assessment, but, as discussed for
natural background, they may present a
significant risk. Omitting anthropogenic

Page 5-20
background chemicals from the risk assessment
could result in the loss of important information
for those potentially exposed.
5.8 DEVELOPMENT OF A SET OF
CHEMICAL DATA AND
INFORMATION FOR USE IN THE
RISK ASSESSMENT
After the evaluation of data is complete as
specified in previous sections, a list of the
samples (by medium) is made that will be used
to estimate exposure concentrations, as
discussed in Chapter 6 of this guidance. In
addition, as shown in the flowchart in Exhibit 5-
1, a list of chemicals of potential concern (also
by medium) will be needed for the quantitative
risk assessment. This list should include
chemicals that were:
(1) positively detected in at least one CLP
sample (RAS or SAS) in a given
medium, including (a) chemicals with no
qualifiers attached (excluding samples
with unusually high detection limits), and
(b) chemicals with qualifiers attached
that indicate known identities but
unknown concentrations (e.g., J-qualified
data);
(2) detected at levels significantly elevated
above levels of the same chemicals
detected in associated blank samples;
(3) detected at levels significantly elevated
above naturally occurring levels of the
same chemicals;
(4) only tentatively identified but either may
be associated with the site based on
historical information or have been
confirmed by SAS; and/or
(5) transformation products of chemicals
demonstrated to be present.
Chemicals that were not detected in
samples from a given medium (i.e., non-detects)
but that may be present at the site also may be
included in the risk assessment if an evaluation
of the risks potentially present at the detection
limit is desired.
5.9 FURTHER REDUCTION IN THE
NUMBER OF CHEMICALS (OPTIONAL)
For certain sites, the list of potentially site-
related chemicals remaining after quantitation
limits, qualifiers, blank contamination, and
background have been evaluated may be
lengthy. Carrying a large number of chemicals
through a quantitative risk assessment may be
complex, and it may consume significant
amounts of time and resources. The resulting
risk assessment report, with its large, unwieldy
tables and text, may be difficult to read and
understand, and it may distract from the
dominant risks presented by the site. In these
cases, the procedures discussed in this section –
using chemical classes, frequency of detection,
essential nutrient information, and a
concentration-toxicity screen – may be used to
further reduce the number of chemicals of
potential concern in each medium.
If conducting a risk assessment on a large
number of chemicals is feasible (e.g., because of
adequate computer capability), then the
procedures presented in this section should not
be used. Rather, the most important chemicals
(e.g., those presenting 99 percent of the risk) --
identified after the risk assessment -- could be
presented in the main text of the report, and the
remaining chemicals could be presented in the
appendices.
5.9.1 CONDUCT INITIAL ACTIVITIES
Several activities must be conducted
before implementing any of the procedures
described in this section: (1) consult with the
RPM; (2) consider how the rationale for the
procedure should be documented; (3) examine
historical information on the site; (4) consider
concentration and toxicity of the chemicals; (5)
examine the mobility, persistence, and
bioaccumulation potential of the chemicals; (6)
consider special exposure routes; (7) consider
the treatability of the chemicals; (8) examine
applicable or relevant and appropriate
requirements (ARARs); and (9) examine the
need for the procedures. These activities are
described below.

Consultation with the RPM. If a large number
of chemicals are of potential concern at a
particular site, the RPM should be consulted.
Approval by the RPM must be obtained prior to
the elimination of chemicals based on any of
these procedures. The concentration-toxicity
screen in particular may be needed only in rare
instances.
Documentation of rationale. The rationale for
eliminating chemicals from the quantitative risk
assessment based on the procedures discussed
below must be clearly stated in the risk
assessment report. This documentation, and its
possible defense at a later date, could be fairly
resource-intensive. If a continuing need to
justify this step is expected, then any plans to
eliminate chemicals should be reconsidered.
Historical information. Chemicals reliably
associated with site activities based on historical
information generally should not be eliminated
from the quantitative risk assessment, even if the
results of the procedures given in this section
indicate that such an elimination is possible.
Concentration and toxicity. Certain aspects of
concentration and toxicity of the chemicals also
must be considered prior to eliminating
chemicals based on the results of these
procedures. For example, before eliminating
potentially carcinogenic chemicals, the weight-
of-evidence classification should be considered
in conjunction with the concentrations detected
at the site. It may be practical and conservative
to retain a chemical that was detected at low
concentrations if that chemical is a Group A
carcinogen. (As discussed in detail in Chapter 7,
the weight-of-evidence classification is an
indication of the quality and quantity of data
underlying a chemical's designation as a
potential human carcinogen.)
Mobility, persistence, and bioaccumulation.
Three factors that must be considered when
implementing these procedures are the mobility,
persistence, and bioaccumulation of the
chemicals. For example, a highly volatile (i.e.,
mobile) chemical such as benzene, a long-lived
(i.e., persistent) chemical such as dioxin, or a
readily taken-up and concentrated (i.e.,
bioaccumulated) chemical such as DDT,
Page 5-21
probably should remain in the risk assessment.
These procedures do not explicitly include a
mobility, persistence, or bioaccumulation
component, and therefore the risk assessor must
pay special attention to these factors.
Special exposure routes. For some chemicals,
certain exposure routes need to be considered
carefully before using these procedures. For
example, some chemicals are highly volatile and
may pose a significant inhalation risk due to the
home use of contaminated water, particularly for
showering. The procedures described in this
section may not account for exposure routes
such as this.
Treatability. Some chemicals are more
difficult to treat than others and as a result
should remain as chemicals of potential concern
because of their importance during the selection
of remedial alternatives.
ARARs. Chemicals with ARARs (including
those relevant to land ban compliance) usually
are not appropriate for exclusion from the
quantitative risk assessment based on the
procedures in this section. This may, however,
depend in part on how the chemicals' site
concentrations in specific media compare with
their ARAR concentrations for these media.
Need for procedures. Quantitative evaluation
of all
chemicals of potential concern is the most
thorough approach in a risk assessment. In
addition, the time required to implement and
defend the selection procedures discussed in this
section may exceed the time needed to simply
carry all the chemicals of potential concern
through the risk assessment. Usually, carrying
all chemicals of potential concern through the
risk assessment will not be a difficult task,
particularly given the widespread use of
computer spreadsheets to calculate exposure
concentrations of chemicals and their associated
risks. Although the tables that result may indeed
be large, computer spreadsheets significantly
increase the ability to evaluate a number of
chemicals in a relatively short period of time.
For these reasons, the procedures discussed here
may be needed only in rare instances. As
previously stated, the approval of these
procedures by the RPM must be obtained prior

Page 5-22
to implementing any of these optional screening
procedures at a particular site.
5.9.2 GROUP CHEMICALS BY CLASS
At times, toxicity values to be used in
characterizing risks are available only for certain
chemicals within a chemical class. For example,
of the polycyclic aromatic hydrocarbons (PAHs)
considered to be potential carcinogens, a slope
factor currently is available (i.e., as this manual
went to press) for benz(a)pyrene only. In these
cases, rather than eliminating the other
chemicals within the class from quantitative
evaluation because of a lack of toxicity values, it
may be useful to group data for such a class of
chemicals (e.g., according to structure-activity
relationships or other similarities) for
consideration in later sections of the risk
assessment. For example, the concentrations of
only one group of chemicals (e.g., carcinogenic
PAHs) would be considered rather than
concentrations of each of the seven carcinogenic
PAHs currently on the TCL.
To group chemicals by class,
concentrations of chemicals within each class
are summed according to procedures discussed
in Chapter 6 of this guidance. Later in the risk
assessment, this chemical class concentration
would be used to characterize risk using toxicity
values (i.e., RfDs or slope factors) associated
with one of the chemicals in the particular class.
Three notes of caution when grouping
chemicals should be considered: (1) do not
group solely by toxicity characteristics; (2) do
not group all
carcinogenic chemicals or all
noncarcinogenic chemicals without regard to
structure-activity or other chemical similarities;
and (3) discuss in the risk assessment report that
grouping can produce either over- or under-
estimates of the true risk.
5.9.3 EVALUATE FREQUENCY OF
DETECTION
Chemicals that are infrequently detected
may be artifacts in the data due to sampling,
analytical, or other problems, and therefore may
not be related to site operations or disposal
practices. Consider the chemical as a candidate
for elimination from the quantitative risk
assessment if: (1) it is detected infrequently in
one or perhaps two environmental media, (2) it
is not detected in any other sampled media or at
high concentrations, and (3) there is no reason to
believe that the chemical may be present.
Available modeling results may indicate whether
monitoring data that show infrequently detected
chemicals are representative of only their
sampling locations or of broader areas. Because
chemical concentrations at a site are spatially
variable, the risk assessor can use modeling
results to project infrequently detected chemical
concentrations over broader areas when
determining whether the subject chemicals are
relevant to the overall risk assessment. Judicious
use of modeling to supplement available
monitoring data often can minimize the need for
the RPM to resort to arbitrarily setting limits on
inclusion of infrequently detected chemicals in
the risk assessment. Any detection frequency
limit to be used (e.g., five percent) should be
approved by the RPM prior to using this screen.
If, for example, a frequency of detection limit of
five percent is used, then at least 20 samples of a
medium would be needed (i.e., one detect in 20
samples equals a five percent frequency of
detection).
In addition to available monitoring data
and modeling results, the risk assessor will need
to consider other relevant factors (e.g., presence
of sensitive subpopulations) in recommending
appropriate site-specific limits on inclusion of
infrequently detected chemicals in the
quantitative risk assessment. For example, the
risk assessor should consider whether the
chemical is expected to be present based on
historical data or any other relevant information
(e.g., known degradation products of chemicals
present at the site, modeling results). Chemicals
expected to be present should not be eliminated.
(See the example of chemicals with similar
transport and fate characteristics in Section
5.3.5.)
The reported or modeled concentrations
and locations of chemicals should be examined
to check for hotspots, which may be especially
important for short-term exposures and which
therefore should not be eliminated from the risk
assessment. Always consider detection of

particular chemicals in all sampled media
because some media may be sources of
contamination for other media. For example, a
chemical that is infrequently detected in soil (a
potential ground-water contamination source)
probably should not be eliminated as a site
contaminant if the same chemical is frequently
detected in ground water. In addition,
infrequently detected chemicals with
concentrations that greatly exceed reference
concentrations should not be eliminated.
5.9.4 EVALUATE ESSENTIAL
NUTRIENTS
Chemicals that are (1) essential human
nutrients, (2) present at low concentrations (i.e.,
only slightly elevated above naturally occurring
levels), and (3) toxic only at very high doses
(i.e., much higher than those that could be
associated with contact at the site) need not be
considered further in the quantitative risk
assessment. Examples of such chemicals are
iron, magnesium, calcium, potassium, and
sodium.
Prior to eliminating such chemicals from
the risk assessment, they must be shown to be
present at levels that are not associated with
adverse health effects. The determination of
acceptable dietary levels for essential nutrients,
however, often is very difficult. Literature
values concerning acceptable dietary levels may
conflict and may change fairly often as new
studies are conducted. For example, arsenic -- a
potential carcinogen -- is considered by some
scientists to be an essential nutrient based on
animal experiments; however, acceptable dietary
levels are not well known (EPA 1988f).
Therefore, arsenic should be retained in the risk
assessment, even though it may be an essential
nutrient at undefined dietary levels. Another
example of a nutrient that is difficult to
characterize is sodium. Although an essential
element in the diet, certain levels of sodium may
be associated with blood pressure effects in
some sensitive individuals (although data
indicating an association between sodium in
drinking water and hypertension are inadequate
[EPA 1987]).
Page 5-23
Another problem with determining
acceptable dietary levels for essential nutrients is
that nutrient levels often are presented in the
literature as concentrations within the human
body (e.g., blood levels). To identify an essential
nutrient concentration to be used for comparison
with concentrations in a particular medium at a
site, blood (or other tissue) levels of the
chemical from the literature must be converted
to concentrations in the media of concern for the
site (e.g., soil, drinking water).
For these reasons, it may not be possible
to compare essential nutrient concentrations with
site concentrations in order to eliminate essential
nutrient chemicals. In general, only essential
nutrients present at low concentrations (i.e., only
slightly elevated above background) should be
eliminated to help ensure that chemicals present
at potentially toxic concentrations are evaluated
in the quantitative risk assessment.
5.9.5 USE A CONCENTRATION-
TOXICITY SCREEN
The objective of this screening procedure
is to identify the chemicals in a particular
medium that – based on concentration and
toxicity – are most likely to contribute
significantly to risks calculated for exposure
scenarios involving that medium, so that the risk
assessment is focused on the "most significant"
chemicals.
Calculate individual chemical scores.
Two of the most important factors when
determining the potential effect of including a
chemical in the risk assessment are its measured
INDIVIDUAL CHEMICAL SCORES
R
ij
= (C
ij
)(T
ij
)
where:
R
ij
= risk factor for chemical i in medium j;
C
ij
= concentration of chemical i in medium j;
and
T
ij
= toxicity value for chemical i in medium j
(i.e., either the slope factor or 1/RfD).
concentrations at the site and its toxicity.
Therefore, in this screening procedure, each

Page 5-24
chemical in a medium is first scored according
to its concentration and toxicity to obtain a risk
factor (see the box below). Separate scores are
calculated for each medium being evaluated.
The units for the risk factor R
ij
depend on
the medium being screened. In general, the
absolute units do not matter, as long as units
among chemicals in a medium are the same. To
be conservative, the concentration used in the
above equation should be the maximum detected
concentration determined according to
procedures discussed in Chapter 6, and toxicity
values should be obtained in accordance with the
procedures discussed in Chapter 7.
Chemicals without toxicity values cannot
be screened using this procedure. Such
chemicals should always be discussed in the risk
assessment as chemicals of potential concern;
they should not be eliminated from the risk
assessment. Guidance concerning chemicals
without toxicity values is provided in Chapter 7.
For some chemicals, both oral and
inhalation toxicity values are available. In these
cases, the more conservative toxicity values (i.e.,
ones yielding the larger risk factor when used in
the above equation) usually should be used. If
only one exposure route is likely for the medium
being evaluated, then the toxicity values
corresponding to that exposure route should be
used.
Calculate total chemical scores (per
medium). Chemical-specific risk factors are
summed to obtain the total risk factor for all
chemicals of potential concern in a medium (see
the box on this page). A separate R
j
will be
calculated for carcinogenic and noncarcinogenic
effects. The ratio of the risk factor for each
chemical to the total risk factor (i.e., R
ij
/R
j
)
approximates the relative risk for each chemical
in medium j.
Eliminate chemicals. After carefully
considering the factors discussed previously in
this subsection, eliminate from the risk
assessment chemicals with R
ij
/R
j
ratios that are
very low compared with the ratios of other
chemicals in the medium. The RPM may wish to
TOTAL CHEMICAL SCORES
R = R
1j
+ R
2j
+ R
3j
+ . . . + R
ij
where
Rj = total risk factor for medium j; and
R
1j
+ . . . + R
ij
= risk factors for chemicals 1 through i
in medium j.
specify a limit for this ratio (e.g., 0.01; a lower
fraction would be needed if site risks are
expected to be high). A chemical that
contributes less than the specified fraction of the
total risk factor for each medium would not be
considered further in the risk assessment for that
medium. Chemicals exceeding the limit would
be considered likely to contribute significantly
to risks, as calculated in subsequent stages of the
risk assessment. This screening procedure could
greatly reduce the number of chemicals carried
through a risk assessment, because in many
cases only a few chemicals contribute
significantly to the total risk for a particular
medium.
The risk factors developed in this
screening procedure are to be used only for
potential reduction of the number of chemicals
carried through the risk assessment and have no
meaning outside of the context of the screening
procedure. They should not be considered as a
quantitative measure of a chemical's toxicity or
risk or as a substitute for the risk assessment
procedures discussed in Chapters 6, 7, and 8 of
this guidance.
5.10 SUMMARY AND PRESENTATION
OF DATA
The section of the risk assessment report
summarizing the results of the data collection
and evaluation should be titled "Identification of
Chemicals of Potential Concern" (see Chapter
9). Information in this section should be
presented in ways that readily support the
calculation of exposure concentrations in the
exposure assessment portion of the risk
assessment. Exhibits 5-6 and 5-7 present
examples of tables to be included in this section
of the risk assessment report.
Comment [A23]: EPA’s Risk Assessment
Guidance for Superfund Volume I: Human Health
Evaluation Manual (Part D, Standardized Planning,
Reporting, and Review of Superfund Risk
Assessments) provides planning tables for use during
the risk assessment process, including the data
evaluation stages. See Part D, Section 3.1.1 (page 3-
4) for an overview of using Planning Table 2:
Occurrence, Distribution, and Selection of COPCs.
Also see Appendix A for the downloadable Planning
Table 2 template and instructions for completing
Table 2. RAGS, Part D may be found at:
http://www.epa.gov/oswer/riskassessment/ragsd/inde
x.htm.

Page 5-25
EXHIBIT 5-6
EXAMPLE OF TABLE FORMAT FOR PRESENTING
CHEMICALS SAMPLED IN SPECIFIC MEDIA
Table X
Chemicals Sampled in Medium Y
(and in Operable Unit Z, if appropriate)
Name of Site, Location of Site
Range of Sample Range of Detected
Frequency of
Quantitation Concentrations Background
Chemical Detection
a
Limits (units) (units) Levels
Chemical A 3/25 5 – 50 320 – 4600 100 – 140
* Chemical B 25/25 1 – 32 16 – 72 –
– = Not available.
* Identified as a chemical of potential concern based on evaluation of data according to procedures
described in text of report.
a
Number of samples in which the chemical was positively detected over the number of samples available.

Page 5-26
EXHIBIT 5-7
EXAMPLE OF TABLE FORMAT FOR SUMMARIZING
CHEMICALS OF POTENTIAL CONCERN IN
ALL MEDIA SAMPLED
Table W
Summary of Chemicals of
Potential Concern at Site X, Location Y
(and in Operable Unit Z, if appropriate)
Concentration
Soils Ground Water Surface Water Sediments Air
Chemical (mg/kg) (μg/L) (μg/L) (μg/kg) (μg/m
3
)
Chemical A 5 – 1,100 – 2 – 30 – –
Chemical B 0.5 – 64 5 – 92 – 100 – 45,000 –
Chemical C – 15 – 890 50 – 11,000 – –
Chemical D 2 – 12 – – – 0.1 – 940
– = Not available.

5.10.1 SUMMARIZE DATA COLLECTION
AND EVALUATION RESULTS IN TEXT
In the introduction for this section of the
risk assessment report, clearly discuss in bullet
form the steps involved in data evaluation. If the
optional screening procedure described in
Section 5.9 was used in determining chemicals
of potential concern, these steps should be
included in the introduction. If both historical
data and current data were used in the data
evaluation, state this in the introduction. Any
special site-specific considerations in collecting
and evaluating the data should be mentioned.
General uncertainties concerning the quality
associated with either the collection or the
analysis of samples should be discussed so that
the potential effects of these uncertainties on
later sections of the risk assessment can be
determined.
In the next part of the report, discuss the
samples from each medium selected for use in
quantitative risk assessment. Provide
information concerning the sample collection
methods used (e.g., grab, composite) as well as
the number and location of samples. If this
information is provided in the RI report, simply
refer to the appropriate sections. If any samples
(e.g., field screening/analytical samples) were
excluded specifically from the quantitative risk
assessment prior to evaluating the data,
document this along with reasons for the
exclusion. Again, remember that such samples,
while not used in the quantitative risk
assessment, may be useful for qualitative
discussions and therefore should not be entirely
excluded from the risk assessment.
Discuss the data evaluation either by
medium, by medium within each operable unit
(if the site is sufficiently large to be divided into
specific operable units), or by discrete areas
within each medium in an operable unit. For
each medium, if several source areas with
different types and concentrations of chemicals
exist, then the medium-specific discussion for
each source area may be separate. Begin the
discussion with those media (e.g., wastes, soils)
that are potential sources of contamination for
other media (e.g., ground water, surface
water/sediments). If no samples or data were
available for a particular medium, discuss this in
Page 5-27
the text. For soils data, discuss surface soil
results separately from those of subsurface soils.
Present ground-water results by aquifer if more
than one aquifer was sampled. Discuss surface
water/sediment results by the specific surface
water body sampled.
For each medium, identify in the report
the chemicals for which samples were analyzed,
and list the analytes that were detected in at least
one sample. If any detected chemicals were
eliminated from the quantitative risk assessment
based on evaluation of data (i.e., based on
evaluation of data quality, background
comparisons, and the optional screening
procedures, if used), provide reasons for the
elimination in the text (e.g., chemical was
detected in blanks at similar concentrations to
those detected in samples or chemical was
infrequently detected).
The final subsection of the text is a
discussion of general trends in the data results.
For example, the text may mention (1) whether
concentrations of chemicals of potential concern
in most media were close to the detection limits
or (2) trends concerning chemicals detected in
more than one medium or in more than one
operable unit at the site. In addition, the location
of hot spots should be discussed, as well as any
noticeable trends apparent from sampling results
at different times.
5.10.2 SUMMARIZE DATA COLLECTION
AND EVALUATION RESULTS IN
TABLES AND GRAPHICS
As shown in Exhibit 5-6, a separate table
that includes all chemicals detected in a medium
can be provided for each medium sampled at a
hazardous waste site or for each medium within
an operable unit at a site. Chemicals that have
been determined to be of potential concern based
on the data evaluation should be designated in
the table with an asterisk to the left of the
chemical name.
For each chemical, present the frequency
of detection in a certain medium (i.e., the
number of times a chemical was detected over
the total number of samples considered) and the
range of detected or quantified values in the
samples. Do not present the QL or similar

Page 5-28
indicator of a minimum level (e.g., <10 mg/L,
ND) as the lower end of the range; instead, the
lower and upper bound of the range should be
the minimum and maximum detected values,
respectively.
The range of reported QLs obtained for
each chemical in various samples should be
provided in a separate column. Note that these
QLs should be sample-specific; CRQLs, MDLs,
or other types of non-sample-specific values
should be provided only when SQLs are not
available. Note that the range of QLs would not
include any limit values (e.g., unusually high
QLs) eliminated based on the guidance in
Section 5.3. Finally, naturally occurring
concentrations of chemicals used in comparing
sample concentrations may be provided in a
separate column. The source of these naturally
occurring levels should be provided in a
footnote. List the identity of the samples used in
determining concentrations presented in the
table in an appropriate footnote.
The final table in this section is a list of
the chemicals of potential concern presented by
medium at the site or by medium within each
operable unit at the site. A sample table format
is presented in Exhibit 5-7.
Another useful type of presentation of
chemical concentration data is the isopleth (not
shown). This graphic characterizes the
monitored or modeled concentrations of
chemicals at a site and illustrates the spatial
pattern of contamination.

Page 5-29
ENDNOTE FOR CHAPTER 5
1. Note that the values in this example are for illustration purposes only. Many CRQLs and CRDLs are in the process of being lowered, and the
RfDs and slope factors may have changed.

Page 5-30
REFERENCES FOR CHAPTER 5
Environmental Protection Agency (EPA). 1984. Methods for Organic Chemical Analysis of Municipal and Industrial Wastewater (EPA 600
Methods) as presented in 40 CFR Part 136, Guidelines Establishing Test Procedures for the Analysis of Pollutants Under the Clean Water Act.
Used to determine chemicals present in municipal and industrial wastewater as provided under the Clean Water Act. Analytical
methods for priority pollutants, including sample preparation, reagents, calibration procedures, QA/QC analytical procedures, and
calculations.
Environmental Protection Agency (EPA). 1986. Test Methods for Evaluating Solid Waste (SW-846): Physical/Chemical Methods. Office of
Solid Waste.
Provides analytical procedures to test solid waste to determine if it is a hazardous waste as defined under RCRA. Contains information
for collecting solid waste samples and for determining reactivity, corrosivity, ignitability, composition of waste, and mobility of waste
components.
Environmental Protection Agency (EPA). 1987. Drinking Water; Proposed Substitution of Contaminants and Proposed List of Additional
Substances Which May Require Regulation Under the Safe Drinking Water Act. 52 Federal Register 25720 (July 8, 1987).
Environmental Protection Agency (EPA). 1988a. User's Guide to the Contract Laboratory Program. Office of Emergency and Remedial
Response.
Provides requirements and analytical procedures of the CLP protocols developed from technical caucus recommendations for both
organic and inorganic analysis. Contains information on CLP objectives and orientation, CLP structure, description of analytical
services, utilization of analytical services, auxiliary support services, and program quality assurance.
Environmental Protection Agency (EPA). 1988b. Contract Laboratory Program Statement of Work for Inorganics Analysis: Multi-media, Multi-
concentration. Office of Emergency and Remedial Response. SOW No. 788.
Provides procedures required by EPA for analyzing hazardous waste disposal site samples (aqueous and solid) for inorganic chemicals
(25 elements plus cyanide). Contains analytical, document control, and quality assurance/quality control procedures.
Environmental Protection Agency (EPA). 1988c. Contract Laboratory Program Statement of Work for Organics Analysis: Multi-media, Multi-
concentration. Office of Emergency and Remedial Response. SOW No. 288.
Provides procedures required by EPA for analyzing aqueous and solid hazardous waste samples for 126 volatile, semi-volatile,
pesticide, and PCB chemicals. Contains analytical, document control, and quality assurance/quality control procedures.
Environmental Protection Agency (EPA). 1988d. Laboratory Data Validation Functional Guidelines for Evaluating Inorganics Analysis. Office of
Emergency and Remedial Response.
Provides guidance in laboratory data evaluation and validation for hazardous waste site samples analyzed under the EPA CLP
program. Aids in determining data problems and shortcomings and potential actions to be taken.
Environmental Protection Agency (EPA). 1988e. Laboratory Data Validation Functional Guidelines for Evaluating Organics Analysis
(Functional Guidelines for Organics). Office of Emergency and Remedial Response.
Provides guidance in laboratory data evaluation and validation for hazardous waste site samples analyzed under the EPA CLP
program. Aids in determining data problems and shortcomings and potential actions to be taken.
Environmental Protection Agency (EPA). 1988f. Special Report on Ingested Inorganic Arsenic; Skin Cancer; Nutritional Essentiality. Risk
Assessment Forum. EPA 625/3-87/013.
Technical report concerning the health effects of exposure to ingested arsenic. Includes epidemiologic studies suitable for dose-
response evaluation from Taiwan, Mexico, and Germany. Also includes discussions on pathological characteristics and significance of
arsenic-induced skin lesions, genotoxicity of arsenic, metabolism and distribution, dose-response estimates for arsenic ingestion and
arsenic as an essential nutrient.

Page 5-31

CHAPTER 6
EXPOSURE ASSESSMENT
Comment [A24]: EPA has developed additional
information concerning exposure and risk
assessment for lead and asbestos to supplement the
information presented in RAGS Part A. This
information is needed because there are a number of
unique scientific and technical issues associated with
the investigation of human exposure and risk from
these contaminants. This information on lead and
asbestos at Superfund sites may be found at:
http://www.epa.gov/superfund/health/contaminants/a
sbestos/
http://www.epa.gov/superfund/health/contaminants/l
ead/
This chapter describes the procedures for
conducting an exposure assessment as part of the
baseline risk assessment process at Superfund
sites. The objective of the exposure assessment
is to estimate the type and magnitude of
exposures to the chemicals of potential concern
that are present at or migrating from a site. The
results of the exposure assessment are combined
with chemical-specific toxicity information to
characterize potential risks.
The procedures and information presented
in this chapter represent some new approaches to
exposure assessment as well as a synthesis of
currently available exposure assessment
guidance and information published by EPA.
Throughout this chapter, relevant exposure
assessment documents are referenced as sources
of more detailed information supporting the
exposure assessment process.
6.1 BACKGROUND
Exposure is defined as the contact of an
organism (humans in the case of health risk
assessment) with a chemical or physical agent
(EPA 1988a). The magnitude of exposure is
determined by measuring or estimating the
amount of an agent available at the exchange
boundaries (i.e., the lungs, gut, skin) during a
specified time period. Exposure assessment is
the determination or estimation (qualitative or
quantitative) of the magnitude, frequency,
duration, and route of exposure. Exposure
assessments may consider past, present, and
future exposures, using varying assessment
techniques for each phase. Estimates of current
exposures can be based on measurements or
models of existing conditions, those of future
exposures can be based on models of future
conditions, and those of past exposures can be
based on measured or modeled past
concentrations or measured chemical
concentrations in tissues. Generally, Superfund
exposure assessments are concerned with current
and future exposures. If human monitoring is
planned to assess current or past exposures, the
Agency for Toxic Substances and Disease
Registry (ATSDR) should be consulted to take
the lead in conducting these studies and in
assessing the current health status of the people
near the site based on the monitoring results.
6.1.1 COMPONENTS OF AN EXPOSURE
ASSESSMENT
The general procedure for conducting an
exposure assessment is illustrated in Exhibit 6-1.
This procedure is based on EPA's published
Guidelines for Exposure Assessment (EPA
1986a) and on other related guidance (EPA
1988a, 1988b). It is an adaptation of the
generalized exposure assessment process to the
particular needs of Superfund site risk
assessments. Although some exposure
assessment activities may have been started
earlier (e.g., during RI/FS scoping or even
before the RI/FS process began), the detailed
exposure assessment process begins after the
chemical data have been collected and validated
and the chemicals of potential concern have
been selected (see Chapter 5, Section 5.3.3). The
exposure assessment proceeds with the
following steps.
ACRONYMS FOR CHAPTER 6
ATSDR = Agency for Toxic Substances and Disease
Registry
BCF = Bioconcentration Factor
CDI = Chronic Daily Intake
CEAM = Center for Exposure Assessment Modeling
NOAA = National Oceanographic and Atmospheric
Administration
NTGS = National Technical Guidance Studies
OAQPS = Office of Air Quality Planning and
Standards
RME = Reasonable Maximum Exposure
SDI = Subchronic Daily Intake
SEAM = Superfund Exposure Assessment Manual
USGS = U.S. Geological Survey

Page 6-2
Absorbed Dose. The a mount of a substance penetrating the exchange boundaries of a
is calculated from the intake and the absorption efficiency. It usually is exp
into the body per unit body weight per unit time (e.g., mg/kg-day).
Administered Dose. The
mass of
a
substance given to
an
organism and in contact wit
gastrointestinal tract) per unit body weight per unit time (e.g., m
g/kg-day).
n organism after contact. Absorbed dose
ressed as mass of a substance absorbed
h an exchange boundary (e.g.,
Applied Dose. The amount of a substance given to an organism, especially through d
Chronic Daily Intake (CDI). Exposure expressed as mass of a substance contacted pe
averaged over a long period of time (as aSuperfund program guideline, sev
Contact Rate. Amount of medium (e.g., ground water, soil) contacted per unit time or
day).
Exposure. Contact of an organism with a chemical or physical agent. Exposure is qua
available at the exchange boundaries of the organism (e.g., skin, lungs, gut)
Exposure Assessment. The determination or estimation (qualitative or quantitative) o
and route of exposure.
ermal contact.
r unit body weight per unit time,
en years to a lifetime).
event (e.g. liters of water ingested per
ntified as the amount of the agent
and available for absorption.
f the magnitude, frequency, duration,
Exposure Event. An incident of contact with a chemical or physical agent. An exposure event can be defined by time (e.g.,
day, hour) or by the incident (e.g., eating a single meal of contaminated fish).
Exposure Pathway. The course a chemical or physical agent takes from a source to an exposed organism. An exposure
pathway describes a unique mechanism by which an individual or population is exposed to chemicals or physical
agents at or originating from a site. Each exposure pathway includes a source or release from a source, an exposure
point, and an exposure route. If the exposure point differs from the source, a transport/exposure medium (e.g., air)
or media (in cases of intermedia transfer) also is included.
Exposure Point. A location of potential contact between an organism and a chemical or physical agent.
Exposure Route. The way a chemical or physical agent comes in contact with an organism (e.g., by ingestion, inhalation,
dermal contact).
Intake. A measure of exposure expressed as the mass of a substance in contact with the exchange boundary per unit body
weight per unit time (e.g., mg chemical/kg body weight-day). Also termed the normalized exposure rate equivalent
to administered dose.
Lifetime Average Daily Intake. Exposure expressed as mass of a substance contacted per unit body weight per unit time,
averaged over a lifetime.
Subchronic Daily Intake (SDI). Exposure expressed as mass of a
substance contacted per unit body weight per unit time,
averaged over a portion of a lifetime (as aSuperfund program
guideline, two weeks to seven years).
DEFINITIONS FOR CHAPTER 6
Step 1 -- Characterization of exposure
setting (Section 6.2). In this step, the
assessor characterizes the expo sure
setting with respect to the general
physical characteristics of the site and
the characteristics of the populations on
and near the site. Basic site
characteristics such as climate,
vegetation, ground-water hydrology, and
the presence and location of surface
water are identified in this step.
Populations also are identified and are
described with respect to those
characteristics that influence exposure,
such as location relative to the site,
activity patterns, and the presence of
sensitive subpopulations. This step
considers the characteristics of the
current population, as well as those of
any potential future populations that
may differ under an alternate land use.

EXHIBIT 6-1
THE EXPOSURE ASSESSMENT PROCESS

Page 6-4
Step 2 -- Identification of exposure
pathways (Section 6.3) . In this step,
the exposure assessor identifies those
pathways by which the previously
identified populations may be exposed.
Each exposure pathway describes a
unique mechanism by which a
population may be exposed to the
chemicals at or originating from the site.
Exposure pathways are identified based
on consideration of the sources, releases,
types, and locations of chemicals at the
site; the likely environmental fate
(including persistence, partitioning,
transport, and intermedia transfer) of
these chemicals; and the location and
activities of the potentially exposed
populations. Exposure points (points of
potential contact with the chemical) and
routes of exposure (e.g., ingestion,
inhalation) are identified for each
exposure pathway.
Step 3 -- Quantification of exposure
(Section 6.4). In this step, the assessor
quantifies the magnitude, frequency and
duration of exposure for each pathway
identified in Step 2. This step is most
often conducted in two stages:
estimation of exposure concentrations
and calculation of intakes.
Estimation of exposure concentrations
(Section 6.5). In this part of step 3, the
exposure assessor determines the
concentration of chemicals that will be
contacted over the exposure period.
Exposure concentrations are estimated
using monitoring data and/or chemical
transport and environmental fate
models. Modeling may be used to
estimate future chemical concentrations
in media that are currently contaminated
or that may become contaminated, and
current concentrations in media and/or
at locations for which there are no
monitoring data.
Calculation of intakes (Section 6.6). In
this part of step 3, the exposure assessor
calculates chemical-specific exposures
for each exposure pathway identified in
Step 2. Exposure estimates are
expressed in terms of the mass of
substance in contact with the body per
unit body weight per unit time (e.g., mg
chemical per kg body weight per day,
also expressed as mg/kg-day). These
exposure estimates are termed "intakes"
(for the purposes of this manual) and
represent the normalized exposure rate.
Several terms common in other EPA
documents and the literature are
equivalent or related to intake (see box
on this page and definitions box on page
6-2). Chemical intakes are calculated
using equations that include variables
for exposure concentration, contact rate,
exposure frequency, exposure duration,
body weight, and exposure averaging
time. The values of some of these
variables depend on site conditions and
the characteristics of the potentially
exposed population.
After intakes have been estimated, they are
organized by population, as appropriate (Section
6.7). Then, the sources of uncertainty (e.g.,
variability in analytical data, modeling results,
parameter assumptions) and their effect on the
exposure estimates are evaluated and
summarized (Section 6.8). This information on
TERMS EQUIVALENT OR
RELATED TO INTAKE
Normalized Exposure Rate. Equivalent to intake
Administered Dose. Equivalent to intake
Applied Dose. Equivalent to intake
Absorbed Dose. Equivalent to intake multiplied by an
absorption factor
uncertainty is important to site decision-makers
who must evaluate the results of the exposure
and risk assessment and make decisions
regarding the degree of remediation required at a
site. The exposure assessment concludes with a
summary of the estimated intakes for each
pathway evaluated (Section 6.9).

6.1.2 REASONABLE MAXIMUM
EXPOSURE
Actions at Superfund sites should be based
on an estimate of the reasonable maximum
exposure (RME) expected to occur under both
current and future land-use conditions. The
reasonable maximum exposure is defined here
as the highest exposure that is reasonably
expected to occur at a site. RMEs are estimated
for individual pathways. If a population is
exposed via more than one pathway, the
combination of exposures across pathways also
must represent an RME.
Estimates of the reasonable maximum
exposure necessarily involve the use of
professional judgment. This chapter provides
guidance for determining the RME at a site and
identifies some exposure variable values
appropriate for use in this determination. The
specific values identified should be regarded as
general recommendations, and could change
based on site-specific information and the
particular needs of the EPA remedial project
manager (RPM). Therefore, these
recommendations should be used in conjunction
with input from the RPM responsible for the
site.
In the past, exposures generally were
estimated for an average and an upper-bound
exposure case, instead of a single exposure case
(for both current and future land use) as
recommended here. The advantage of the two
case approach is that the resulting range of
exposures provides some measure of the
uncertainty surrounding these estimates. The
disadvantage of this approach is that the upper-
bound estimate of exposure may be above the
range of possible exposures, whereas the
average estimate is lower than exposures
potentially experienced by much of the
population. The intent of the RME is to estimate
a conservative exposure case (i.e., well above
the average case) that is still within the range of
possible exposures. Uncertainty is still evaluated
under this approach. However, instead of
combining many sources of uncertainty into
average and upper-bound exposure estimates,
the variation in individual exposure variables is
used to evaluate uncertainty (See Section 6.8). In
this way, the variables contributing most to
Page 6-5
uncertainty in the exposure estimate are more
easily identified.
6.2 STEP 1: CHARACTERIZATION OF
EXPOSURE SETTING
The first step in evaluating exposure at
Superfund sites is to characterize the site with
respect to its physical characteristics as well as
those of the human populations on and near the
site. The output of this step is a qualitative
evaluation of the site and surrounding
populations with respect to those characteristics
that influence exposure. All information
gathered during this step will support the
identification of exposure pathways in Step 2. In
addition, the information on the potentially
exposed populations will be used in Step 3 to
determine the values of some intake variables.
6.2.1 CHARACTERIZE PHYSICAL
SETTING
Characterize the exposure setting with
respect to the general physical characteristics of
the site. Important site characteristics include the
following:
climate (e.g., temperature,
precipitation);
meteorology (e.g., wind speed and
direction);
geologic setting (e.g., location and
characterization of underlying strata);
vegetation (e.g., unvegetated, forested,
grassy);
soil type (e.g., sandy, organic, acid,
basic);
ground-water hydrology (e.g., depth,
direction and type of flow); and
location and description of surface water
(e.g., type, flow rates, salinity).
Sources of this information include site
descriptions and data from the preliminary
assessment (PA), site inspection (SI), and
remedial investigation (RI) reports. Other
sources include county soil surveys, wetlands

Page 6-6
maps, aerial photographs, and reports by the
National Oceanographic and Atmospheric
Association (NOAA) and the U.S. Geological
Survey (USGS). The assessor also should
consult with appropriate technical experts (e.g.,
hydrogeologists, air modelers) as needed to
characterize the site.
6.2.2 CHARACTERIZE POTENTIALLY
EXPOSED POPULATIONS
Characterize the populations on or near
the site with respect to location relative to the
site, activity patterns, and the presence of
sensitive subgroups.
Determine location of current
populations relative to the site . Determine the
distance and direction of potentially exposed
populations from the site. Identify those
populations that are closest to or actually living
on the site and that, therefore, may have the
greatest potential for exposure. Be sure to
include potentially exposed distant populations,
such as public water supply consumers and
distant consumers of fish or shellfish or
agricultural products from the site area. Also
include populations that could be exposed in the
future to chemicals that have migrated from the
site. Potential sources of this information
include:
site visit;
other information gathered as part of the
SI or during the initial stages of the RI;
population surveys conducted near the
site;
topographic, land use, housing or other
maps; and
recreational and commercial fisheries
data.
Determine current land use .
Characterize the activities and activity patterns
of the potentially exposed population. The
following land use categories will be applicable
most often at Superfund sites:
residential;
commercial/industrial; and
recreational.
Determine the current
land use or uses of
the site and surrounding area. The best source of
this information is a site visit. Look for homes,
playgrounds, parks, businesses, industries, or
other land uses on or in the vicinity of the site.
Other sources on local land use include:
zoning maps;
state or local zoning or other land use-
related laws and regulations;
data from the U.S. Bureau of the
Census;
topographic, land use, housing or other
maps; and
aerial photographs.
Some land uses at a site may not fit neatly
into one of the three land use categories and
other land use classifications may be more
appropriate (e.g., agricultural land use). At some
sites it may be most appropriate to have more
than one land use category.
After defining the land use(s) for a site,
identify human activities and activity patterns
associated with each land use. This is basically a
"common sense" evaluation and is not based on
any specific data sources, but rather on a general
understanding of what activities occur in
residential, business, or recreational areas.
Characterize activity patterns by doing the
following.
Determine the percent of time that the
potentially exposed population(s) spend
in the potentially contaminated area. For
example, if the potentially exposed
population is commercial or industrial, a
reasonable maximum daily exposure
period is likely to be 8 hours (a typical
work day). Conversely, if the population
is residential, a maximum daily
exposure period of 24 hours is possible.
Determine if activities occur primarily
indoors, outdoors, or both. For example,
office workers may spend all their time

indoors, whereas construction workers
may spend all their time outdoors.
Determine how activities change with
the seasons. For example, some outdoor,
summertime recreational activities (e.g.,
swimming, fishing) will occur less
frequently or not at all during the winter
months. Similarly, children are likely to
play outdoors less frequently and with
more clothing during the winter months.
Determine if the site itself may be used
by local populations, particularly if
access to the site is not restricted or
otherwise limited (e.g., by distance). For
example, children living in the area
could play onsite, and local residents
could hunt or hike onsite.
Identify any site-specific population
characteristics that might influence
exposure. For example, if the site is
located near major commercial or
recreational fisheries or shellfisheries,
the potentially exposed population is
likely to eat more locally-caught fish
and shellfish than populations located
inland.
Determine future land use. Determine if
any activities associated with a current land use
are likely to be different under an alternate
future land use. For example, if ground water is
not currently used in the area of the site as a
source of drinking water but is of potable
quality, future use of ground water as drinking
water would be possible. Also determine if land
use of the site itself could change in the future.
For example, if a site is currently classified as
industrial, determine if it could possibly be used
for residential or recreational purposes in the
future.
Because residential land use is most often
associated with the greatest exposures, it is
generally the most conservative choice to make
when deciding what type of alternate land use
may occur in the future. However, an
assumption of future residential land use may
not be justifiable if the probability that the site
will support residential use in the future is
exceedingly small.
Page 6-7
Therefore, determine possible alternate
future land uses based on available information
and professional judgment. Evaluate pertinent
information sources, including (as available):
master plans (city or county projections
of future land use);
Bureau of the Census projections; and
established land use trends in the
general area and the area immediately
surrounding the site (use Census Bureau
or state or local reports, or use general
historical accounts of the area).
Note that while these sources provide potentially
useful information, they should not be
interpreted as providing proof that a certain land
use will or will not occur.
Assume future residential land use if it
seems possible based on the evaluation of the
available information. For example, if the site is
currently industrial but is located near residential
areas in an urban area, future residential land use
may be a reasonable possibility. If the site is
industrial and is located in a very rural area with
a low population density and projected low
growth, future residential use would probably be
unlikely. In this case, a more likely alternate
future land use may be recreational. At some
sites, it may be most reasonable to assume that
the land use will not change in the future.
There are no hard-and-fast rules by which
to determine alternate future land use. The use of
professional judgment in this step is critical. Be
sure to consult with the RPM about any
decision regarding alternate future land use.
Support the selection of any alternate land use
with a logical, reasonable argument in the
exposure assessment chapter of the risk
assessment report. Also include a qualitative
statement of the likelihood of the future land use
occurring.
Identify subpopulations of potential
concern. Review information on the site area to
determine if any subpopulations may be at
increased risk from chemical exposures due to
increased sensitivity, behavior patterns that may
result in high exposure, and/or current or past
exposures from other sources. Subpopulations

Page 6-8
that may be more sensitive to chemical
exposures include infants and children, elderly
people, pregnant and nursing women, and
people with chronic illnesses. Those potentially
at higher risk due to behavior patterns include
children, who are more likely to contact soil, and
persons who may eat large amounts of locally
caught fish or locally grown produce (e.g.,
home-grown vegetables). Subpopulations at
higher risk due to exposures from other sources
include individuals exposed to chemicals during
occupational activities and individuals living in
industrial areas.
To identify subpopulations of potential
concern in the site area, determine locations of
schools, day care centers, hospitals, nursing
homes, retirement communities, residential areas
with children, important commercial or
recreational fisheries near the site, and major
industries potentially involving chemical
exposures. Use local census data and
information from local public health officials for
this determination.
6.3 STEP 2: IDENTIFICATION OF
EXPOSURE PATHWAYS
This section describes an approach for
identifying potential human exposure pathways
at a Superfund site.
An exposure pathway describes the course a
chemical or physical agent takes from the source
to the exposed individual. An exposure pathway
analysis links the sources, locations, and types of
environmental releases with population locations
and activity patterns to determine the significant
pathways of human exposure.
An exposure pathway generally consists
of four elements: (1) a source and mechanism of
chemical release, (2) a retention or transport
medium (or media in cases involving media
transfer of chemicals), (3) a point of potential
human contact with the contaminated medium
(referred to as the exposure point), and (4) an
exposure route (e.g., ingestion) at the contact
point. A medium contaminated as a result of a
past release can be a contaminant source for
other media (e.g., soil contaminated from a
previous spill could be a contaminant source for
ground water or surface water). In some cases,
the source itself (i.e., a tank, contaminated soil)
is the exposure point, without a release to any
other medium. In these latter cases, an exposure
pathway consists of (1) a source, (2) an exposure
point, and (3) an exposure route. Exhibit 6-2
illustrates the basic elements of each type of
exposure pathway.
The following sections describe the basic
analytical process for identifying exposure
pathways at Superfund sites and for selecting
pathways for quantitative analysis. The pathway
analysis described below is meant to be a
qualitative evaluation of pertinent site and
chemical information, and not a rigorous
quantitative evaluation of factors such as source
strength, release rates, and chemical fate and
transport. Such factors are considered later in the
exposure assessment during the quantitative
determination of exposure concentrations
(Section 6.5).
6.3.1 IDENTIFY SOURCES AND
RECEIVING MEDIA
To determine possible release sources for
a site in the absence of remedial action, use all
available site descriptions and data from the PA,
SI, and RI reports. Identify potential release
mechanisms and receiving media for past,
current, and future releases. Exhibit 6-3 lists
some typical release sources, release
mechanisms, and receiving media at Superfund
sites. Use monitoring data in conjunction with
information on source locations to support the
analysis of past, continuing, or threatened
releases. For example, soil contamination near
an old tank would suggest the tank (source)
ruptured or leaked (release mechanism) to the
ground (receiving media). Be sure to note any
source that could be an exposure point in
addition to a release source (e.g., open barrels or
tanks, surface waste piles or lagoons,
contaminated soil).
Map the suspected source areas and the
extent of contamination using the available
information and monitoring data. As an aid in
evaluating air sources and releases, Volumes I
and II of the National Technical Guidance
Studies (NTGS; EPA 1989a,b) should be
consulted.

Page 6-9
EXHIBIT 6-2
ILLUSTRATION OF EXPOSURE PATHWAYS
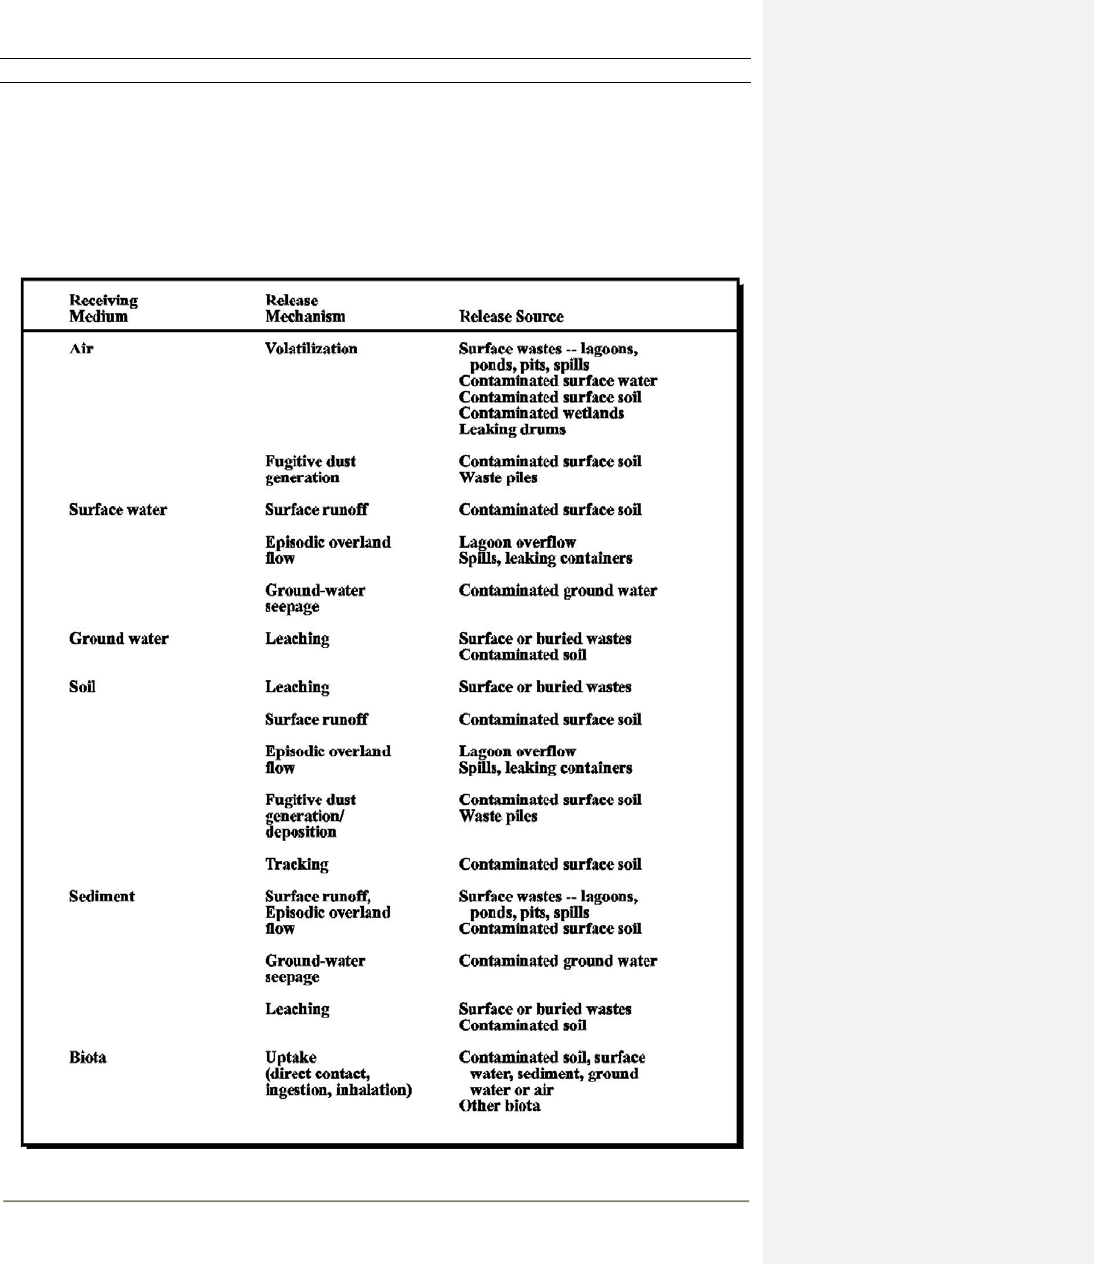
Page 6-10
EXHIBIT 6-3
COMMON CHEMICAL RELEASE SOURCES AT
SITES IN THE ABSENCE OF REMEDIAL ACTION

6.3.2 EVALUATE FATE AND TRANSPORT
IN RELEASE MEDIA
Evaluate the fate and transport of the
chemicals to predict future exposures and to help
link sources with currently contaminated media.
The fate and transport analysis conducted at this
stage of the exposure assessment is not meant to
result in a quantitative evaluation of media-
specific chemical concentrations. Rather, the
intent is to identify media that are receiving or
may receive site-related chemicals. At this stage,
the assessor should answer the questions: What
chemicals occur in the sources at the site and in
the environment? In what media (onsite and
offsite) do they occur now? In what media and at
what location may they occur in the future?
Screening-level analyses using available data
and simplified calculations or analytical models
may assist in this qualitative evaluation.
After a chemical is released to the
environment it may be:
transported (e.g., convected downstream
in water or on suspended sediment or
through the atmosphere);
physically transformed (e.g.,
volatilization, precipitation);
chemically transformed (e.g., photolysis,
hydrolysis, oxidation, reduction, etc.);
biologically transformed (e.g,
biodegradation); and/or
accumulated in one or more media
(including the receiving medium).
To determine the fate of the chemicals of
potential concern at a particular site, obtain information
on their physical/chemical and environmental fate
properties. Use computer data bases (e.g., SRC's
Environmental Fate, CHEMFATE, and BIODEG
data bases; BIOSIS; AQUIRE) and the open literature
as necessary as sources for up-to-date information on
the physical/chemical and fate properties of the
chemicals of potential concern. Exhibit 6-4 lists some
important chemical-specific fate parameters and
briefly describes how these can be used to evaluate a
chemical's environmental fate.
Also consider site-specific characteristics
(identified in Section 6.2.1) that may influence
Page 6-11
fate and transport. For example, soil
characteristics such as moisture content, organic
carbon content, and cation exchange capacity
can greatly influence the movement of many
chemicals. A high water table may increase the
probability of leaching of chemicals in soil to
ground water.
Use all applicable chemical and site-
specific information to evaluate transport within
and between media and retention or
accumulation within a single medium. Use
monitoring data to identify media that are
contaminated now and the fate pathway analysis
to identify media that may be contaminated now
(for media not sampled) or in the future. Exhibit
6-5 presents some important questions to
consider when developing these pathways.
Exhibit 6-6 presents a series of flow charts
useful when evaluating the fate and transport of
chemicals at a site.
6.3.3 IDENTIFY EXPOSURE POINTS AND
EXPOSURE ROUTES
After contaminated or potentially
contaminated media have been identified,
identify exposure points by determining if and
where any of the potentially exposed
populations (identified in Step 1) can contact
these media. Consider population locations and
activity patterns in the area, including those of
subgroups that may be of particular concern.
Any point of potential contact with a
contaminated medium is an exposure point. Try
to identify those exposure points where the
concentration that will be contacted is the
greatest. Therefore, consider including any
contaminated media or sources onsite as a
potential exposure point if the site is currently
used, if access to the site under current
conditions is not restricted or otherwise limited
(e.g., by distance), or if contact is possible under
an alternate future land use. For potential offsite
exposures, the highest exposure concentrations
often will be at the points closest to and
downgradient or downwind of the site. In some
cases, highest concentrations may be
encountered at points distant from the site. For
example, site-related chemicals may be
transported and deposited in a distant water body
where they may be subsequently
bioconcentrated by aquatic organisms.

Page 6-12
EXHIBIT 6-4
IMPORTANT PHYSICAL/CHEMICAL
AND ENVIRONMENTAL FATE PARAMETERS
K
oc
provides a measure of the extent of chemical partitioning between organic carbon and water
at equilibrium. The higher the K
oc
, the more likely a chemical is to bind to sailor sediment
than to remain in water.
K
d
provides a soil or sediment-specific measure of the extent of chemical partitioning between
soil or sediment and water, nnadjnsted for dependence upon organic carbon. To adjust for
the fracti(m of organic carh(m present in soil or sediment (f
oc
), use K
d
= K
oc
x f
oc
. The
higher the K
d
, the more likely a chemical is to bind to soil or sediment than to remain in
water.
K
ow
provides a measure of the extent of chemical partitioning between water and octanol at
equilibrinm. The greater the K
ow
the more likely a chemical is to partition to octanol than to
remain in water. Octanol is used as a surrogate for lipids (fat), and K
ow
can be used to
predict bioconcentration in aquatic organisms.
Solubility is an upper limit on a chemical's dissolved concentration in water at a specified
temperature. Aqueous concentrations in excess of solubility may indicate sorption onto
sediments, the presence of solubilizing chemicals such as solvents, or the presence of a non-
aqueous phase liquid.
Henry's Law Constant provides a measure of the cxtent of chemical partitioning between aIr and
water at equilibrinm. The higher the Henry's Law constant, the more likely a chemical is to
volatize than to remain in water.
Vapor Pressure is the pressure exerted by a chemical vapor in equilibrium with its solid or liquid
form at any given temperature. It is used to calculate the rate of volatilization of a pure
substance from a surface or in estimating a Henry's Law constant for chemicals with low
water solubility. The higher the vapor pressure, the more likely a chemical is to exist in a
gaseous state.
Diffusivity describes the movement of a molecule in a liquid or gas medium as a result of
differences in concentration. It is used to calculate the dispersive component of chemical
transport. The higher the diffusivity, the more likely a chemical is to move in response to
concentration gradients.
Bioconcentration Factor (BCF) provides a measure of the extent of chemical partitioning at
equilibrium between a biological medium such as fish tissue or plant tissue and an external
medium such as water. The higher the ReF, the greater the accumulation in living tissue is
likely to be.
Media-specific Half-life provides a relative measure of the persistence of a chemical in a given
medium, although actual values can vary greatly depending on site-specific conditions. The
greater the half-life, the more persistent a chemical is likely to be.

Page 6-13
EXHIBIT 6-5
IMPORTANT CONSIDERATIONS FOR DETERMINING
THE ENVIRONMENTAL F ATE AND T RANSPORT
OF THE CHEMICALS OF POTENTIAL CONCERN
AT A SUPERFUND SITE
What are the principal mechanisms for change or removal in each of the
environmental media?
How does the chemical behave in air, water, soil, and biological media? Does it
bioaccumulate or biodegrade? Is it absorbed or taken up by plants?
Does the agent react with other compounds in the environment?
Is there intermedia transfer'? What are the mechanisms for intermedia transfer?
What are the r ates of the intermedia transfer or reaction mechanism'?
How long might the che mical remain in each environmental medium? How does
its concentration change wi th time in each medium?
What are the products into which the agent might degrade or change in the
environment? Are these products potentially of concern?
Is a steady-state concentration distribution in the environment or in specific
segments of the environment achieved?

Page 6-14
EXHIBIT 6-6
FLOW CHART FOR
FATE AND TRANSPORT ASSESSMENTS
(continued)

Page 6-15

Page 6-16

After determining exposure points,
identify probable exposure routes (i.e., ingestion,
inhalation, dermal contact) based on the media
contaminated and the anticipated activities at the
exposure points. In some instances, an exposure
point may exist but an exposure route may not
(e.g., a person touches contaminated soil but is
wearing gloves). Exhibit 6-7 presents a
population/exposure route matrix that can be
used in determining potential exposure routes at
a site.
6.3.4 INTEGRATE INFORMATION ON
SOURCES, RELEASES, FATE AND
TRANSPORT, EXPOSURE POINTS,
AND EXPOSURE ROUTES INTO
EXPOSURE PATHWAYS
Assemble the information developed in
the previous three steps and determine the
complete exposure pathways that exist for the
site. A pathway is complete if there is (1) a
source or chemical release from a source, (2) an
exposure point where contact can occur, and (3)
an exposure route by which contact can occur.
Otherwise, the pathway is incomplete, such as
the situation where there is a source releasing to
air but there are no nearby people. If available
from ATSDR, human monitoring data indicating
chemical accumulation or chemical-related
effects in the site area can be used as evidence to
support conclusions about which exposure
pathways are complete; however, negative data
from such studies should not be used to
conclude that a pathway is incomplete.
From all complete exposure pathways at a
site, select those pathways that will be evaluated
further in the exposure assessment. If exposure
to a sensitive subpopulation is possible, select
that pathway for quantitative evaluation. All
pathways should be selected for further
evaluation unless there is sound justification
(e.g., based on the results of a screening
analysis) to eliminate a pathway from detailed
analysis. Such a justification could be based on
one of the following:
the exposure resulting from the pathway
is much less than that from another
pathway involving the same medium at
the same exposure point;
the potential magnitude of exposure
from a pathway is low; or
Page 6-17
the probability of the exposure occurring
is very low and the risks associated with
the occurrence are not high (if a
pathway has catastrophic consequences,
it should be selected for evaluation even
if its probability of occurrence is very
low).
Use professional judgment and experience
to make these decisions. Before deciding to
exclude a pathway from quantitative analysis,
consult with the RPM. If a pathway is excluded
from further analysis, clearly document the
reasons for the decision in the exposure
assessment section of the risk assessment report.
For some complete pathways it may not
be possible to quantify exposures in the
subsequent steps of the analysis because of a
lack of data on which to base estimates of
chemical release, environmental concentration,
or human intake. Available modeling results
should complement and supplement the
available monitoring data to minimize such
problems. However, uncertainties associated
with the modeling results may be too large to
justify quantitative exposure assessment in the
absence of monitoring data to validate the
modeling results. These pathways should
nevertheless be carried through the exposure
assessment so that risks can be qualitatively
evaluated or so that this information can be
considered during the uncertainty analysis of the
results of the exposure assessment (see Section
6.8) and the risk assessment (see Chapter 8).
6.3.5 SUMMARIZE INFORMATION ON ALL
COMPLETE EXPOSURE PATHWAYS
Summarize pertinent information on all
complete exposure pathways at the site by
identifying potentially exposed populations,
exposure media, exposure points, and exposure
routes. Also note if the pathway has been
selected for quantitative evaluation; summarize
the justification if a pathway has been excluded.
Summarize pathways for current land use and
any alternate future land use separately. This
summary information is useful for defining the
scope of the next step (quantification of
exposure) and also is useful as documentation of
the exposure pathway analysis. Exhibit 6-8
provides a sample format for presenting this
information.

EXHIBIT 6-7
MATRIX OF POTENTIAL EXPOSURE ROUTES

6.4 STEP 3: QUANTIFICATION OF
EXPOSURE: GENERAL
CONSIDERATIONS
The next step in the exposure assessment
process is to quantify the magnitude, frequency
and duration of exposure for the populations and
exposure pathways selected for quantitative
evaluation. This step is most often conducted in
two stages: first, exposure concentrations are
estimated, then, pathway-specific intakes are
quantified. The specific methodology for
calculating exposure concentrations and pathway-
specific exposures are presented in Sections 6.5
and 6.6, respectively. This section describes
some of the basic concepts behind these
processes.
6.4.1 QUANTIFYING THE REASONABLE
MAXIMUM EXPOSURE
Exposure is defined as the contact of an
organism with a chemical or physical agent. If
exposure occurs over time, the total exposure
can be divided by a time period of interest to
obtain an average exposure rate per unit time.
This average exposure rate also can be expressed
as a function of body weight. For the purposes
of this manual, exposure normalized for time
and body weight is termed "intake", and is
expressed in units of mg chemical/kg body
weight-day.
Exhibit 6-9 presents a generic equation for
calculating chemical intakes and defines the
intake variables. There are three categories of
variables that are used to estimate intake:
(1) chemical-related variable --exposure
concentration;
(2) variables that describe the exposed
population -- contact rate, exposure
frequency and duration, and body
weight; and
assessment-determined variable --
averaging time.
Each intake variable in the equation has a
range of values. For Superfund exposure
assessments, intake variable values for a given
pathway should be selected so that the
combination of all intake variables results in an
estimate of the reasonable maximum exposure
for that pathway. As defined previously, the
Page 6-19
reasonable maximum exposure (RME) is the
maximum exposure that is reasonably expected
to occur at a site. Under this approach, some
intake variables may not be at their individual
maximum values but when in combination with
other variables will result in estimates of the
RME.
Some recommendations for determining the
values of the individual intake variables are
discussed below. These recommendations are
based on EPA's determination of what would
result in an estimate of the RME. As discussed
previously, a determination of "reasonable"
cannot be based solely on quantitative
information, but also requires the use of
professional judgment. Accordingly, the
recommendations below are based on a
combination of quantitative information and
professional judgment. These are general
recommendations, however, and could change
based on site-specific information or the
particular needs of the risk manager. Consult
with the RPM before varying from these
recommendations.
Exposure concentration. The
concentration term in the intake equation is the
arithmetic average of the concentration that is
contacted over the exposure period. Although
this concentration does not reflect the maximum
concentration that could be contacted at any one
time, it is regarded as a reasonable estimate of
the concentration likely to be contacted over
time. This is because in most situations,
assuming long-term contact with the maximum
concentration is not reasonable. (For exceptions
to this generalization, see discussion of hot spots
in Section 6.5.3.)
Because of the uncertainty associated with
any estimate of exposure concentration, the
upper confidence limit (i.e., the 95 percent upper
confidence limit) on the arithmetic average will
be used for this variable. There are standard
statistical methods which can be used to
calculate the upper confidence limit on the
arithmetic mean. Gilbert (1987, particularly
sections 11.6 and 13.2) discusses methods that
can be applied to data that are distributed
normally or log normally. Kriging is another
method that potentially can be used (Clark 1979
is one of several reference books on kriging). A
statistician should be consulted for more details
or for assistance with specific methods.
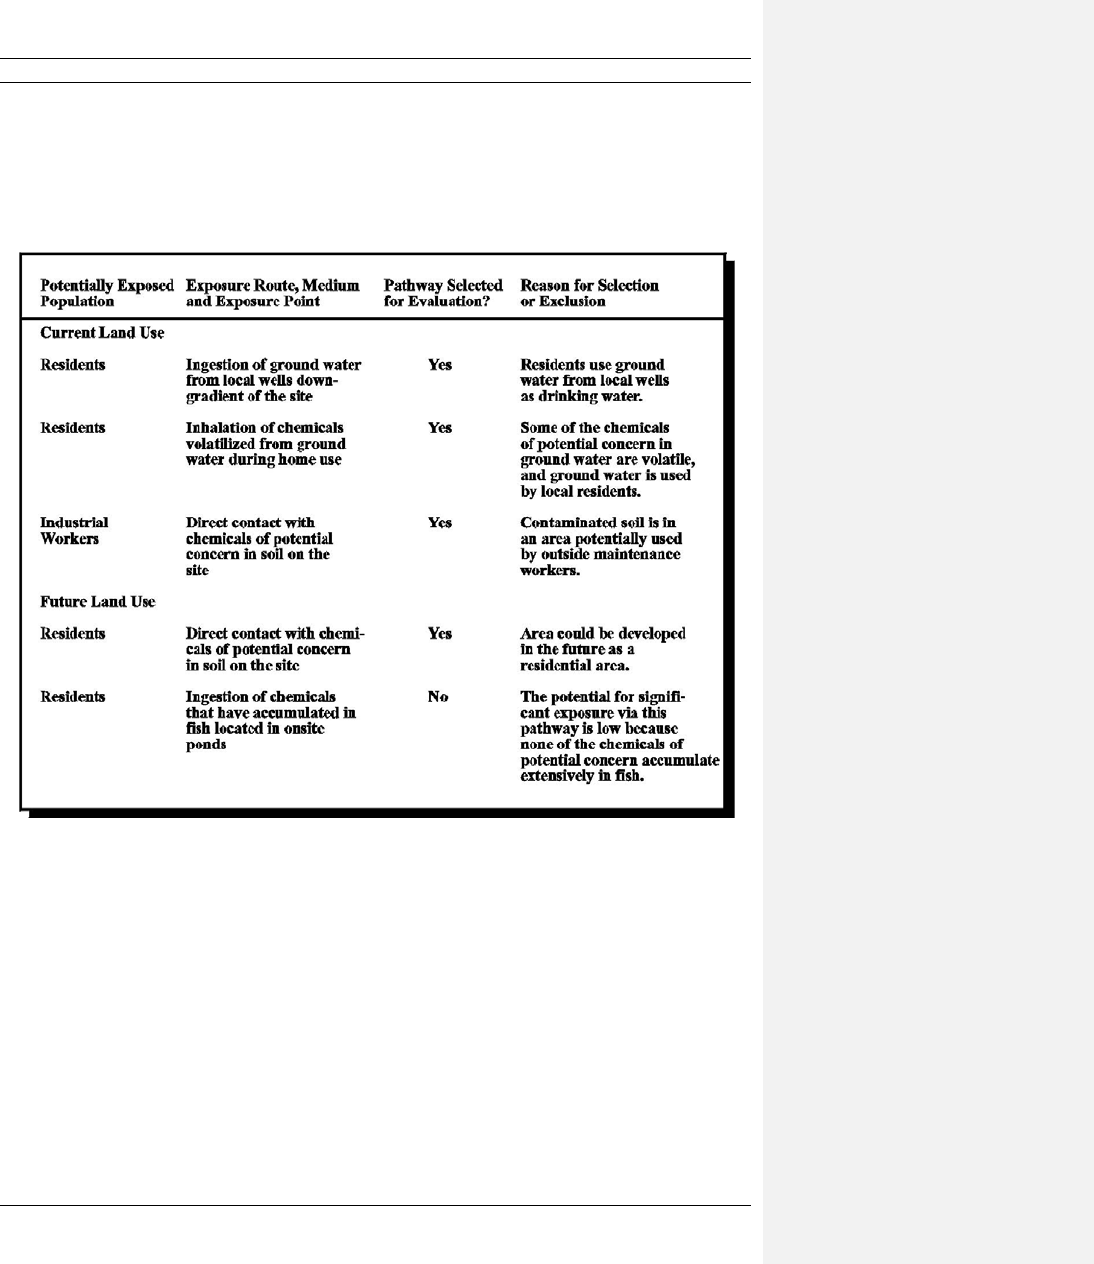
EXHIBIT 6-8
EXAMPLE OF TABLE FORMAT FOR SUMMARIZING
COMPLETE EXPOSURE PATHWAYS AT A SITE
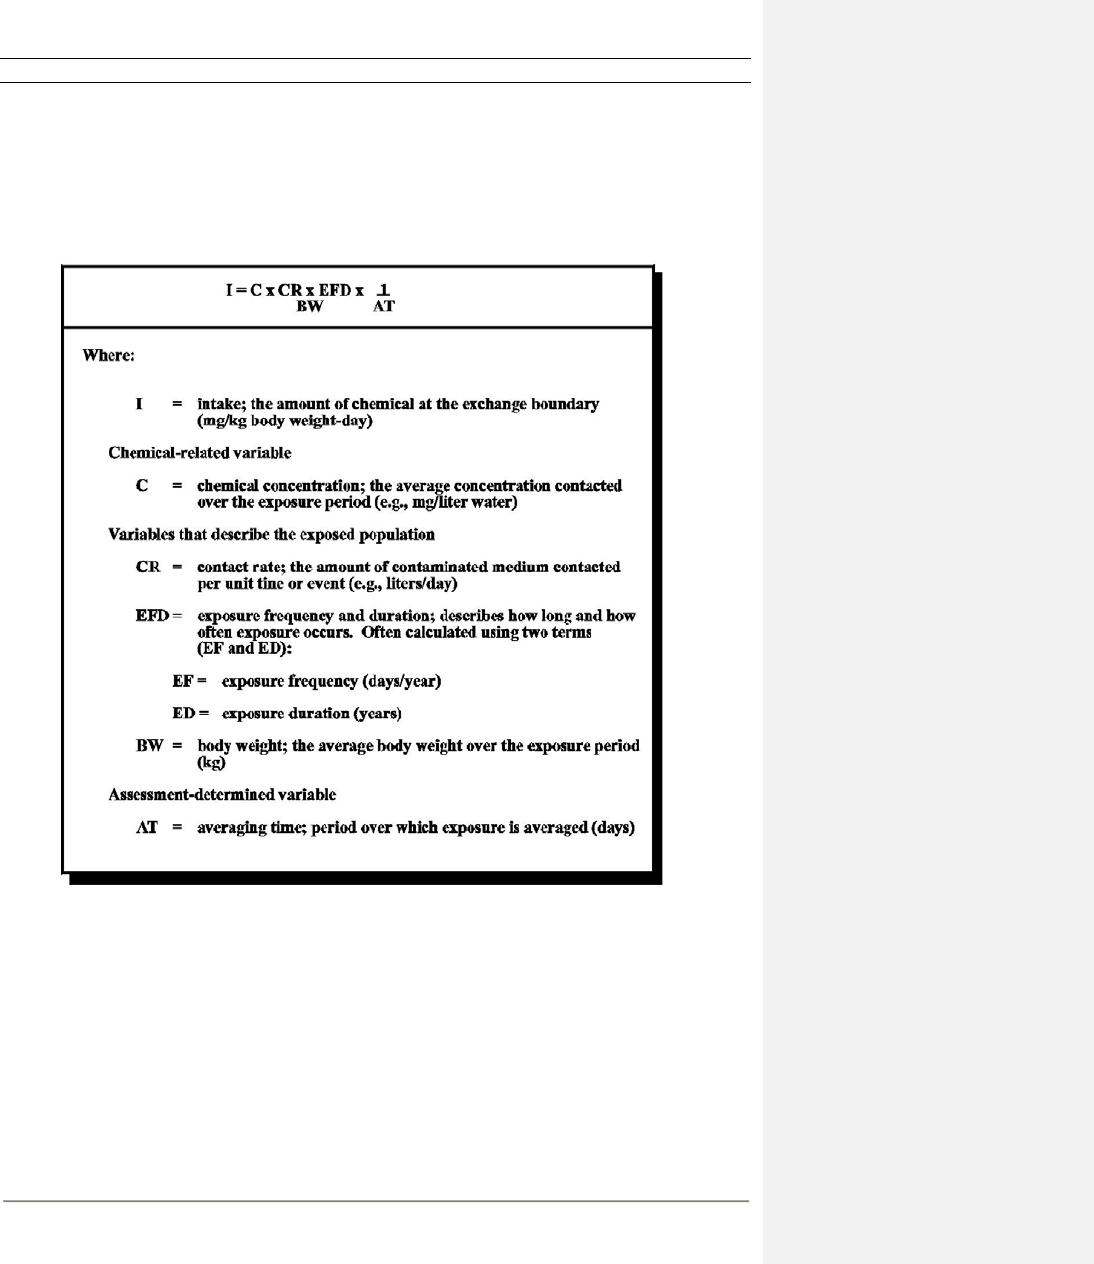
Page 6-21
EXHIBIT 6-9
GENERIC EQUATION FOR CALCULATING CHEMICAL INTAKES

Page 6-22
If there is great variability in measured or
modeled concentration values (such as when too
few samples are taken or when model inputs are
uncertain), the upper confidence limit on the
average concentration will be high, and
conceivably could be above the maximum
detected or modeled value. In these cases, the
maximum detected or modeled value should be
used to estimate exposure concentrations. This
could be regarded by some as too conservative
an estimate, but given the uncertainty in the data
in these situations, this approach is regarded as
reasonable.
For some sites, where a screening level
analysis is regarded as sufficient to characterize
potential exposures, calculation of the upper
confidence limit on the arithmetic average is not
required. In these cases, the maximum detected
or modeled concentration should be used as the
exposure concentration.
Contact rate. Contact rate reflects the
amount of contaminated medium contacted per
unit time or event. If statistical data are available
for a contact rate, use the 95th percentile value
for this variable. (In this case and throughout
this chapter, the 90th percentile value can be
used if the 95th percentile value is not
available.) If statistical data are not available,
professional judgment should be used to
estimate a value which approximates the 95th
percentile value. (It is recognized that such
estimates will not be precise. They should,
however, reflect a reasonable estimate of an
upper-bound value.)
Sometimes several separate terms are used
to derive an estimate of contact rate. For
example, for dermal contact with chemicals in
water, contact rate is estimated by combining
information on exposed skin surface area,
dermal permeability of a chemical, and exposure
time. In such instances, the combination of
variables used to estimate intake should result in
an estimate approximating the 95th percentile
value. Professional judgment will be needed to
determine the appropriate combinations of
variables. (More specific guidance for
determining contact rate for various pathways is
given in Section 6.6.)
Exposure frequency and duration.
Exposure frequency and duration are used to
estimate the total time of exposure. These terms
are determined on a site-specific basis. If
statistical data are available, use the 95th
percentile value for exposure time. In the
absence of statistical data (which is usually the
case), use reasonable conservative estimates of
exposure time. National statistics are available
on the upper-bound (90th percentile) and
average (50th percentile) number of years spent
by individuals at one residence (EPA 1989d).
Because of the data on which they are based,
these values may underestimate the actual time
that someone might live in one residence.
Nevertheless, the upper-bound value of 30 years
can be used for exposure duration when
calculating reasonable maximum residential
exposures. In some cases, however, lifetime
exposure (70 years by convention) may be a
more appropriate assumption. Consult with the
RPM regarding the appropriate exposure
duration for residential exposures. The exposure
frequency and duration selected must be
appropriate for the contact rate selected. If a
long-term average contact rate (e.g., daily fish
ingestion rate averaged over a year) is used, then
a daily exposure frequency (i.e., 365 days/year)
should be assumed.
Body weight. The value for body weight
is the average body weight over the exposure
period. If exposure occurs only during childhood
years, the average child body weight during the
exposure period should be used to estimate
intake. For some pathways, such as soil
ingestion, exposure can occur throughout the
lifetime but the majority of exposure occurs
during childhood (because of higher contact
rates). In these cases, exposures should be
calculated separately for age groups with similar
contact rate to body weight ratios; the body
weight used in the intake calculation for each
age group is the average body weight for that
age group. Lifetime exposure is then calculated
by taking the time-weighted average of exposure
estimates over all age groups. For pathways
where contact rate to body weight ratios are
fairly constant over a lifetime (e.g., drinking
water ingestion), a body weight of 70 kg is used.
A constant body weight over the period of
exposure is used primarily by convention, but
also because body weight is not always
independent of the other variables in the
exposure equation (most notably, intake). By
keeping body weight constant, error from this

Page 6-23
dependence is minimized. The average body
weight is used because, when combined with the
other variable values in the intake equation, it is
believed to result in the best estimate of the
RME. For example, combining a 95th percentile
contact rate with a 5th percentile body weight is
not considered reasonable because it is unlikely
that smallest person would have the highest
intake. Alternatively, combining a 95th
percentile intake with a 95th percentile body
weight is not considered a maximum because a
smaller person could have a higher contact rate
to body weight ratio.
Averaging time. The averaging time
selected depends on the type of toxic effect
being assessed. When evaluating exposures to
developmental toxicants, intakes are calculated
by averaging over the exposure event (e.g., a day
or a single exposure incident). For acute
toxicants, intakes are calculated by averaging
over the shortest exposure period that could
produce an effect, usually an exposure event or a
day. When evaluating longer-term exposure to
noncarcinogenic toxicants, intakes are calculated
by averaging intakes over the period of exposure
(i.e., subchronic or chronic daily intakes). For
carcinogens, intakes are calculated by prorating
the total cumulative dose over a lifetime (i.e.,
chronic daily intakes, also called lifetime
average daily intake). This distinction relates to
the currently held scientific opinion that the
mechanism of action for each category is
different (see Chapter 7 for a discussion). The
approach for carcinogens is based on the
assumption that a high dose received over a
short period of time is equivalent to a
corresponding low dose spread over a lifetime
(EPA 1986b). This approach becomes
problematic as the exposures in question become
more intense but less frequent, especially when
there is evidence that the agent has shown dose-
rate related carcinogenic effects. In some cases,
therefore, it may be necessary to consult a
toxicologist to assess the level of uncertainty
associated with the exposure assessment for
carcinogens. The discussion of uncertainty
should be included in both the exposure
assessment and risk characterization chapters of
the risk assessment report.
6.4.2 TIMING CONSIDERATIONS
At many Superfund sites, long-term
exposure to relatively low chemical
concentrations (i.e., chronic daily intakes) are of
greatest concern. In some situations, however,
shorter-term exposures (e.g., subchronic daily
intakes) also may be important. When deciding
whether to evaluate short-term exposure, the
following factors should be considered:
the toxicological characteristics of the
chemicals of potential concern;
the occurrence of high chemical
concentrations or the potential for a large
release;
persistence of the chemical in the
environment; and
the characteristics of the population that
influence the duration of exposure.
Toxicity considerations. Some chemicals
can produce an effect after a single or very
short-term exposure to relatively low
concentrations. These chemicals include acute
toxicants such as skin irritants and neurological
poisons, and developmental toxicants. At sites
where these types of chemicals are present, it is
important to assess exposure for the shortest
time period that could result in an effect. For
acute toxicants this is usually a single exposure
event or a day, although multiple exposures over
several days also could result in an effect. For
developmental toxicants, the time period of
concern is the exposure event. This is based on
the assumption that a single exposure at the
critical time in development is sufficient to
produce an adverse effect. It should be noted
that the critical time referred to can occur in
almost any segment of the human population
(i.e., fertile men and women, the conceptus, and
the child up to the age of sexual maturation
[EPA 1989e]).
Concentration considerations. Many
chemicals can produce an effect after a single or
very short-term exposure, but only if exposure is
to a relatively high concentration. Therefore, it is
important that the assessor identify possible
situations where a short-term exposure to a high
concentration could occur. Examples of such a

Page 6-24
situation include sites where contact with a
small, but highly contaminated area is possible
(e.g., a source or a hot spot), or sites where there
is a potential for a large chemical release (e.g.,
explosions, ruptured drums, breached lagoon
dikes). Exposure should be determined for the
shortest period of time that could produce an
effect.
Persistence considerations. Some
chemicals may degrade rapidly in the
environment. In these cases, exposures should
be assessed only for that period of time in which
the chemical will be present at the site. Exposure
assessments in these situations may need to
include evaluations of exposure to the
breakdown products, if they are persistent or
toxic at the levels predicted to occur at the site.
Population considerations. At some
sites, population activities are such that exposure
would occur only for a short time period (a few
weeks or months), infrequently, or
intermittently. Examples of this would be
seasonal exposures such as during vacations or
other recreational activities. The period of time
over which exposures are averaged in these
instances depends on the type of toxic effect
being assessed (see previous discussion on
averaging time, Section 6.4.1).
6.5 QUANTIFICATION OF EXPOSURE:
DETERMINATION OF EXPOSURE
CONCENTRATIONS
This section describes the basic
approaches and methodology for determining
exposure concentrations of the chemicals of
potential concern in different environmental
media using available monitoring data and
appropriate models. As discussed in Section
6.4.1, the concentration term in the exposure
equation is the average concentration contacted
at the exposure point or points over the exposure
period. When estimating exposure
concentrations, the objective is to provide a
conservative estimate of this average
concentration (e.g., the 95 percent upper
confidence limit on the arithmetic mean
chemical concentration).
This section provides an overview of the
basic concepts and approaches for estimating
exposure concentrations. It identifies what type
of information is needed to estimate
concentrations, where to find it, and how to
interpret and use it. This section is not designed
to provide all the information necessary to
derive exposure concentrations and, therefore,
does not detail the specifics of potentially
applicable models nor provide the data
necessary to run the models or support
concentration estimates. However, sources of
such information, including the Superfund
Exposure Assessment Manual (SEAM; EPA
1988b) are referenced throughout the discussion.
6.5.1 GENERAL CONSIDERATIONS FOR
ESTIMATING EXPOSURE
CONCENTRATIONS
In general, a great deal of professional
judgment is required to estimate exposure
concentrations. Exposure concentrations may be
estimated by (1) using monitoring data alone, or
(2) using a combination of monitoring data and
environmental fate and transport models. In
most exposure assessments, some combination
of monitoring data and environmental modeling
will be required to estimate exposure
concentrations.
Direct use of monitoring data . Use of
monitoring data to estimate exposure
concentrations is normally applicable where
exposure involves direct contact with the
monitored medium (e.g., direct contact with
chemicals in soil or sediment), or in cases where
monitoring has occurred directly at an exposure
point (e.g., a residential drinking water well or
public water supply). For these exposure
pathways, monitoring data generally provide the
best estimate of current exposure concentrations.
As the first step in estimating exposure
concentrations, summarize available monitoring
data. The manner in which the data are
summarized depends upon the site
characteristics and the pathways being
evaluated. It may be necessary to divide
chemical data from a particular medium into
subgroups based on the location of sample
points and the potential exposure pathways. In
other instances, as when the sampling point is an
exposure point (e.g., when the sample is from an
existing drinking water well) it may not be
appropriate to group samples at all, but may be
most appropriate to treat the sample data

separately when estimating intakes. Still, in
other instances, the assessor may wish to use the
maximum concentration from a medium as the
exposure concentration for a given pathway as a
screening approach to place an upper bound on
exposure. In these cases it is important to
remember that if a screening level approach
suggests a potential health concern, the estimates
of exposure should be modified to reflect more
probable exposure conditions.
In those instances where it is appropriate
to group sampling data from a particular
medium, calculate for each exposure medium
and each chemical the 95 percent upper
confidence limit on the arithmetic average
chemical concentration. See Chapter 5 for
guidance on how to treat sample concentrations
below the quantitation limit.
Modeling approaches . In some
instances, it may not be appropriate to use
monitoring data alone, and fate and transport
models may be required to estimate exposure
concentrations. Specific instances where
monitoring data alone may not be adequate are
as follows.
Where exposure points are spatially separate
from monitoring points. Models may be
required when exposure points are remote
from sources of contamination if
mechanisms for release and transport to
exposure points exist (e.g., ground-water
transport, air dispersion).
Where temporal distribution of data is
lacking. Typically, data from Superfund
investigations are collected over a relatively
short period of time. This generally will give
a clear indication of current site conditions,
but both long-term and short-term exposure
estimates usually are required in Superfund
exposure assessments. Although there may
be situations where it is reasonable to
assume that concentrations will remain
constant over a long period of time, in many
cases the time span of the monitoring data is
not adequate to predict future exposure
concentrations. Environmental models may
be required to make these predictions.
Where monitoring data are restricted by the
limit of quantitation. Environmental models
Page 6-25
may be needed to predict concentrations of
contaminants that may be present at
concentrations that are below the
quantitation limit but that may still cause
toxic effects (even at such low
concentrations). For example, in the case of
a ground-water plume discharging into a
river, the dilution afforded by the river may
be sufficient to reduce the concentration of
the chemical to a level that could not be
detected by direct monitoring. However, as
discussed in Section 5.3.1, the chemical may
be sufficiently toxic or bioaccumulative that
it could present a health risk at
concentrations below the limit of
quantitation. Models may be required to
make exposure estimates in these types of
situations.
A wide variety of models are available for
use in exposure assessments. SEAM (EPA
1988b) and the Exposure Assessment Methods
Handbook (EPA 1989f) describe some of the
models available and provide guidance in
selecting appropriate modeling techniques. Also,
the Center for Exposure Assessment Modeling
(CEAM -- Environmental Research Laboratory
(ERL) Athens), the Source Receptor Analysis
Branch (Office of Air Quality Planning and
Standards, or OAQPS), and modelers in EPA
regional offices can provide assistance in
selecting appropriate models. Finally, Volume
IV of the NTGS (EPA 1989c) provides guidance
for air and atmospheric dispersion modeling for
Superfund sites. Be sure to discuss the fate and
transport models to be used in the exposure
assessment with the RPM.
The level of effort to be expended in
estimating exposure concentrations will depend
on the type and quantity of data available, the
level of detail required in the assessment, and
the resources available for the assessment. In
general, estimating exposure concentrations will
involve analysis of site monitoring data and
application of simple, screening-level analytical
models. The most important factor in
determining the level of effort will be the
quantity and quality of the available data. In
general, larger data sets will support the use of
more sophisticated models.
Other considerations. When evaluating
chemical contamination at a site, it is important

Page 6-26
to review the spatial distribution of the data and
evaluate it in ways that have the most relevance
to the pathway being assessed. In short, consider
where the contamination is with respect to
known or anticipated population activity
patterns. Maps of both concentration distribution
and activity patterns will be useful for the
exposure assessment. It is the intersection of
activity patterns and contamination that defines
an exposure area. Data from random sampling or
from systematic grid pattern sampling may be
more representative of a given exposure
pathway than data collected only from hot spots.
Generally, verified GC/MS laboratory
data with adequate quality control will be
required to support quantitative exposure
assessment. Field screening data generally
cannot be incorporated when estimating
exposure concentrations because they are
derived using less sensitive analytical methods
and are subject to less stringent quality control.
Other areas to be considered in estimating
exposure concentrations are as follows.
Steady-state vs. non-steady-state conditions.
Frequently, it may be necessary to assume
steady-state conditions because the
information required to estimate non-steady-
state conditions (such as source depletion
rate) is not readily available. This is likely to
overestimate long-term exposure
concentrations for certain pathways.
Number and type of exposure parameters
that must be assumed. In developing
exposure models, values for site-specific
parameters such as hydraulic conductivity,
organic carbon content of soil, wind speed
and direction, and soil type may be required.
These values may be generated as part of the
RI. In cases where these values are not
available, literature values may be
substituted. In the absence of applicable
literature values, the assessor must consider
if a reliable exposure concentration estimate
can be made.
Number and type of fate processes to be
considered. In some cases, exposure
modeling may be limited to considerations
of mass balance, dilution, dispersion, and
equilibrium partitioning. In other cases,
models of more complex fate processes,
such as chemical reaction, biodegradation,
and photolysis may be needed. However,
prediction of such fate processes requires
significantly larger quantities of model
calibration and validation data than required
for less complex fate processes. For those
sites where these more complex fate
processes need to be modeled, be sure to
consult with the RPM regarding the added
data requirements.
6.5.2 ESTIMATE EXPOSURE
CONCENTRATIONS IN GROUND
WATER
Exposure concentrations in ground water
can be based on monitoring data alone or on a
combination of monitoring and modeling. In
some cases, the exposure assessor may favor the
use of monitoring data over the use of complex
models to develop exposure concentrations. It is
most appropriate to use groundwater sampling
data as estimates of exposure concentrations
when the sampling points correspond to
exposure points, such as samples taken from a
drinking water tap. However, samples taken
directly from a domestic well or drinking water
tap should be interpreted cautiously. For
example, where the water is acidic, inorganic
chemicals such as lead or copper may leach
from the distribution system. Organic chemicals
such as phthalates may migrate into water from
plastic piping. Therefore, interpretations of these
data should consider the type and operation of
the pumping, storage, and distribution system
involved.
Most of the time, data from monitoring
wells will be used to estimate chemical
concentrations at the exposure point. Several
issues should be considered when using
monitoring well data to estimate these
concentrations. First, determine if the aquifer
has sufficient production capacity and is of
sufficient quality to support drinking water or
other uses. If so, it generally should be assumed
that water could be drawn from anywhere in the
aquifer, regardless of the location of existing
wells relative to the contaminant plume. In a few
situations, however, it may not be reasonable to
assume that water will be drawn from directly
beneath a specific source (e.g., a waste
management unit such as a landfill) in the future.

In these cases, it should be assumed that water
could be drawn from directly adjacent to the
source. Selection of the location(s) used to
evaluate future ground-water exposures should
be made in consultation with the RPM. Second,
compare the construction of wells (e.g., drinking
water wells) in the area with the construction of
the monitoring wells. For example, drinking
water wells may draw water from more than one
aquifer, whereas individual monitoring wells are
usually screened in a specific aquifer. In some
cases it may be appropriate to separate data from
two aquifers that have very limited hydraulic
connection if drinking water wells in the area
draw water from only one of them. Consult a
hydrogeologist for assistance in the above
considerations.
Another issue to consider is filtration of
water samples. While filtration of ground-water
samples provides useful information for
understanding chemical transport within an
aquifer (see Section 4.5.3 for more details), the
use of filtered samples for estimating exposure is
very controversial because these data may
underestimate chemical concentrations in water
from an unfiltered tap. Therefore, data from
unfiltered samples should be used to estimate
exposure concentrations. Consult with the RPM
before using data from filtered samples.
Ground-water monitoring data are often of
limited use for evaluating long-term exposure
concentrations because they are generally
representative of current site conditions and not
long-term trends. Therefore, groundwater
models may be needed to estimate exposure
concentrations. Monitoring data should be used
when possible to calibrate the models.
Estimating exposure concentrations in
ground water using models can be a complex
task because of the many physical and chemical
processes that may affect transport and
transformation in ground water. Among the
important mechanisms that should be considered
when estimating exposure concentrations in
ground water are leaching from the surface,
advection (including infiltration, flow through
the unsaturated zone, and flow with ground
water), dispersion, sorption (including
adsorption, desorption, and ion exchange), and
transformation (including biological degradation,
hydrolysis, oxidation, reduction, complexation,
Page 6-27
dissolution, and precipitation). Another
consideration is that not all chemicals may be
dissolved in water, but may be present instead in
nonaqueous phases that float on top of ground
water or sink to the bottom of the aquifer.
The proper selection and application of
soil and ground-water models requires a
thorough understanding of the physical,
chemical, and hydrogeologic characteristics of
the site. SEAM (EPA 1988b) provides a
discussion of the factors controlling soil and
groundwater contaminant migration as well as
descriptions of various soil and ground-water
models. For more in-depth guidance on the
selection and application of appropriate ground-
water models, consult Selection Criteria for
Mathematical Models Used in Exposure
Assessments: Ground-water Models (EPA
1988c). As with all modeling, the assessor
should carefully evaluate the applicability of the
model to the site being evaluated, and should
consult with a hydrogeologist as necessary.
If ground-water modeling is not used,
current concentrations can be used to represent
future concentrations in ground water assuming
steady-state conditions. This assumption should
be noted in the exposure assessment chapter and
in the uncertainties and conclusions of the risk
assessment.
6.5.3 ESTIMATE EXPOSURE
CONCENTRATIONS IN SOIL
Estimates of current exposure
concentrations in soil can be based directly on
summarized monitoring data if it is assumed that
concentrations remain constant over time. Such
an assumption may not be appropriate for some
chemicals and some sites where leaching,
volatilization, photolysis, biodegradation, wind
erosion, and surface runoff will reduce chemical
concentrations over time. Soil monitoring data
and site conditions should be carefully screened
to identify situations where source depletion is
likely to be important. SEAM (EPA 1988b)
gives steady-state equations for estimating many
of these processes. However, incorporating these
processes into the calculation of exposure
concentrations for soil involves considerable
effort. If a modeling approach is not adopted in
these situations, assume a constant concentration
over time and base exposure concentrations on

Page 6-28
monitoring data. This assumption should be
clearly documented.
In evaluating monitoring data for the
assessment of soil contact exposures, the spatial
distribution of the data is a critical factor. The
spatial distribution of soil contamination can be
used as a basis for estimating the average
concentrations contacted over time if it is
assumed that contact with soil is spatially
random (i.e., if contact with soil in all areas of
the site is equally probable). Data from random
sampling programs or samples from evenly
spaced grid networks generally can be
considered as representative of concentrations
across the site. At many sites however, sampling
programs are designed to characterize only
obviously contaminated soils or hot spot areas.
Care must be taken in evaluating such data sets
for estimating exposure concentrations. Samples
from areas where direct contact is not realistic
(such as where a steep slope or thick vegetation
prevents current access) should not be
considered when estimating current exposure
concentrations for direct contact pathways.
Similarly, the depth of the sample should be
considered; surface soil samples should be
evaluated separately from subsurface samples if
direct contact with surface soil or inhalation of
wind blown dust are potential exposure
pathways at the site.
In some cases, contamination may be
unevenly distributed across a site, resulting in
hot spots (areas of high contamination relative to
other areas of the site). If a hot spot is located
near an area which, because of site or population
characteristics, is visited or used more
frequently, exposure to the hot spot should be
assessed separately. The area over which the
activity is expected to occur should be
considered when averaging the monitoring data
for a hot spot. For example, averaging soil data
over an area the size of a residential backyard
(e.g., an eighth of an acre) may be most
appropriate for evaluating residential soil
pathways.
6.5.4 ESTIMATE EXPOSURE
CONCENTRATIONS IN AIR
There are three general approaches to
estimating exposure concentrations in air: (1)
ambient air monitoring, (2) emission
measurements coupled with dispersion
modeling, and (3) emission modeling coupled
with dispersion modeling. Whichever approach
is used, the resulting exposure concentrations
should be as representative as possible of the
specific exposure pathways being evaluated. If
long-term exposures are being evaluated, the
exposure concentrations should be
representative of long-term averages. If short-
term exposures are of interest, measured or
modeled peak concentrations may be most
representative.
If monitoring data have been collected at a
site, their adequacy for use in a risk assessment
should be evaluated by considering how
appropriate they are for the exposures being
addressed. Volume II of the NTGS (EPA 1989b)
provides guidance for measuring emissions and
should be consulted when evaluating the
appropriateness of emission data. See Chapter 4
(Section 4.5.5) for factors to consider when
evaluating the appropriateness of ambient air
monitoring data. As long as there are no
significant analytical problems affecting air
sampling data, background levels are not
significantly higher than potential site-related
levels, and site-related levels are not below the
instrument detection limit, air monitoring data
can be used to derive exposure concentrations.
There still will be uncertainties inherent in using
these data because they usually are not
representative of actual long-term average air
concentrations. This may be because there were
only a few sample collection periods, samples
were collected during only one type of
meteorological or climatic condition, or because
the source of the chemicals will change over
time. These uncertainties should be mentioned in
the risk assessment.
In the absence of monitoring data,
exposure concentrations often can be estimated
using models. Two kinds of models are used to
estimate air concentrations: emission models
that predict the rate at which chemicals may be
released into the air from a source, and
dispersion models that predict associated
concentrations in air at potential receptor points.
Outdoor air modeling. Emissions may
occur as a result of the volatilization of
chemicals from contaminated media or as a
result of the suspension of onsite soils. Models

Page
6-29
that predict emission rates for volatile chemicals
or dust require numerous input parameters,
many of which are site-specific. For volatile
chemicals, emission models for surface water
and soil are available in SEAM (EPA 1988b).
Volume IV of the NTGS (EPA 1989c) also
provides guidance for evaluating volatile
emissions at Superfund sites. Emissions due to
suspension of soils may result from wind
erosion of exposed soil particles and from
vehicular disturbances of the soil. To predict soil
or dust emissions, EPA's fugitive dust models
provided in AP42 (EPA 1985b) or models
described in SEAM (1988b) may be used.
Volume IV of the NTGS (EPA 1989c) also will
be useful in evaluating fugitive dust emissions at
Superfund sites. Be sure to critically review all
models before use to determine their
applicability to the situation and site being
evaluated. If necessary, consult with air
modelers in EPA regional offices, the Exposure
Assessment Group in EPA headquarters or the
Source Receptor Analysis Branch in OAQPS.
After emissions have been estimated or
measured, air dispersion models can be applied
to estimate air concentrations at receptor points.
In choosing a dispersion model, factors that
must be considered include the type of source
and the location of the receptor relative to the
source. For area or point sources, EPA's
Industrial Source Complex model (EPA 1987a)
or the simple Gaussian dispersion models
discussed in SEAM (EPA 1988b) can provide
air concentrations around the source. Other
models can be found in Volume IV of the NTGS
(EPA 1989c). The Source Receptor Analysis
Branch of OAQPS also can be contacted for
assistance. Again, critically review all models
for their applicability.
Indoor air modeling. Indoor emissions
may occur as a result of transport of outdoor-
generated dust or vapors indoors, or as a result
of volatilization of chemicals indoors during use
of contaminated water (e.g., during showering,
cooking, washing). Few models are available for
estimating indoor air concentrations from
outside sources. For dust transport indoors, it
can generally be assumed that indoor
concentrations are less than those outdoors. For
vapor transport indoors, concentrations indoors
and outdoors can be assumed to be equivalent in
most cases. However, at sites where subsurface
soil gas or ground-water seepage are entering
indoors, vapor concentrations inside could
exceed those outdoors. Vapor concentrations
resulting from indoor use of water may be
greater than those outdoors, depending on the
emission source characteristics, dispersion
indoors, and indoor-outdoor air exchange rates.
Use models discussed in the Exposure
Assessment Methods Handbook (EPA 1989f) to
evaluate volatilization of chemicals from indoor
use of water.
6.5.5 E STIMATE EXPOSURE
CONCENTRATIONS IN SURFACE
WATER
Data from surface water sampling and
analysis may be used alone or in conjunction
with fate and transport m odels to estimate
exposure concentrations. Where the sampling
points correspond to exposure points, such as at
locations where fishing or recreational activities
take place, or at the intake to a drinking water
supply,
the monitoring data can be used alone to
estimate exposure concentrations. However, the
data must
be
carefully screened. The complexity
of surface water processes m
ay lead to
certain
limitations in monitoring data
. Among these
are
the following.
Temporal representativeness. Surface
water bodies are subject to
seasonal changes
in flow, temperature, and depth
that may
significantly
affect the fate and transport of
contaminants. Releases t
o surface water
bodies often de
pend on storm conditions to
produce surface runoff
and
soil erosion.
Lakes are subject to seasonal stratification
and changes in biological activity. Unless
the surface water
monitoring program has
been designed to
account for these
phenomena, the data may not represent
long-term average concentrations or short-
term concentrations
that may occur after
storm events.
Spatial representativeness. Considerable
variation in concentration can occur
with
respect to depth
and lateral location in
surface water bodies. Sample locations
should be examined
relative to surface water
mixing zones. Concentrations within the
mixing zo
ne may be significantly higher
Comment [A25]: For more information on
conducting screening evaluations of the
transport of vapors indoors see EPA’s
Draft
Guidance for Evaluating the Vapor Intrusion
Pathway form Groundwater and Soils
(Subsurface Vapor Intrusion Guidance)
. This
guidance may be found at:
http://www.epa.gov/osw/hazard/correctiveaction
/
eis/vapor/complete.pdf

Page 6-30
than at downstream points where complete
mixing has taken place.
Quantitation limit limitations. Where large
surface water bodies are involved,
contaminants that enter as a result of
groundwater discharge or runoff from
relatively small areas may be significantly
diluted. Although standard analytical
methods may not be able to detect chemicals
at these levels, the toxic effects of the
chemicals and/or their potential to
bioaccumulate may nevertheless require that
such concentrations be assessed.
Contributions from other sources. Surface
water bodies are normally subject to
contamination from many sources (e.g.,
pesticide runoff, stormwater, wastewater
discharges, acid mine drainage). Many of
the chemicals associated with these sources
may be difficult to distinguish from site-
related chemicals. In many cases
background samples will be useful in
assessing site-related contaminants from
other contaminants (see Section 4.4).
However, there may be other cases where a
release and transport model may be required
to make the distinction.
Many analytical and numerical models are
available to estimate the release of contaminants
to surface water and to predict the fate of
contaminants once released. The models range
from simple mass balance relationships to
numerical codes that contain terms for chemical
and biological reactions and interactions with
sediments. In general, the level of information
collected during the RI will tend to limit the use
of the more complex models.
There are several documents that can be
consulted when selecting models to estimate
surface water exposure concentrations, including
SEAM (EPA 1988b), the Exposure Assessment
Methods Handbook (EPA 1989f), and Selection
Criteria for Mathematical Models Used in
Exposure Assessments: Surface Water Models
(EPA 1987b). SEAM lists equations for surface
water runoff and soil erosion and presents the
basic mass balance relationships for estimating
the effects of dilution. A list of available
numerical codes for more complex modeling
also is provided. The selection criteria document
(EPA 1987b) provides a more in-depth
discussion of numerical codes and other models.
In addition, it provides guidelines and
procedures for evaluating the appropriate level
of complexity required for various applications.
The document lists criteria to consider when
selecting a surface water model, including: (1)
type of water body, (2) presence of steady-state
or transient conditions, (3) point versus non-
point sources of contamination, (4) whether 1, 2,
or 3 spatial dimensions should be considered, (5)
the degree of mixing, (6) sediment interactions,
and (7) chemical processes. Each of the
referenced documents should be consulted prior
to any surface water modeling.
6.5.6 ESTIMATE EXPOSURE
CONCENTRATIONS IN SEDIMENTS
In general, use sediment monitoring data
to estimate exposure concentrations. Sediment
monitoring data can be expected to provide
better temporal representativeness than surface
water concentrations. This will especially be true
in the case of contaminants such as PCBs,
PAHs, and some inorganic chemicals, which are
likely to remain bound to the sediments. When
using monitoring data to represent exposure
concentrations for direct contact exposures, data
from surficial, near-shore sediments should be
used.
If modeling is needed to estimate sediment
exposure concentrations, consult SEAM (EPA
1988b). SEAM treats surface water and
sediment together for the purpose of listing
available models for the release and transport of
contaminants. Models for soil erosion releases
are equally applicable for estimating exposure
concentrations for surface water and sediment.
Many of the numerical models listed in SEAM
and the surface water selection criteria document
(EPA 1987b) contain sections devoted to
sediment fate and transport.
6.5.7 ESTIMATE CHEMICAL
CONCENTRATIONS IN FOOD
Fish and shellfish. Chemical concentrations
in fish and shellfish may be measured or
estimated. Site-specific measured values are
preferable to estimated values, but before using
such values, evaluate the sampling plan to
determine if it was adequate to characterize the

Page 6-31
population and species of concern (see Section
4.5.6 for some sampling considerations). Also
examine analytical procedures to determine if
the quantitation limits were low enough to detect
the lowest concentration potentially harmful to
humans. Inadequate sampling or high levels of
quantitation may lead to erroneous conclusions.
In the absence of adequate tissue
measurements, first consider whether the
chemical bioconcentrates (i.e., is taken up from
water) or bioaccumulates (i.e., is taken up from
food, sediment, and water). For example, low
molecular weight volatile organic chemicals do
not bioaccumulate in aquatic organisms to a
great extent. Other chemicals accumulate in
some species but not in others. For example,
PAHs tend to accumulate in mollusk species but
not in fish, which rapidly metabolize the
chemicals. For those chemicals that
bioconcentrate in aquatic species of concern, use
the organism/water partition coefficient (i.e.,
bioconcentration factor, or BCF) approach to
estimate steady-state concentrations. BCFs that
estimate concentrations in edible tissue (muscle)
are generally more appropriate for assessing
human exposures from fish or shellfish ingestion
than those that estimate concentrations in the
whole body, although this is not true for all
aquatic species or applicable to all human
populations consuming fish or shellfish. When
data from multiple experiments are available,
select the BCF from a test that used a species
most similar to the species of concern at the site,
and multiply the BCF directly by the dissolved
chemical concentration in water to obtain
estimates of tissue concentrations. Be aware that
the study from which the BCF is obtained
should reflect a steady state or equilibrium
condition, generally achieved over long-term
exposures (although some chemicals may reach
steady state rapidly in certain species). For some
chemicals, BCFs may overestimate tissue levels
in fish that may be exposed only for a short
period of time.
When no BCF is available, estimate the
BCF with a regression equation based on
octanol/water partition coefficients (Kow).
Several equations are available in the literature.
Those developed for chemicals with structural
similarities to the chemical of concern should be
used in preference to general equations because
of better statistical correlations.
The regression equation approach to
estimating BCFs can overestimate or
underestimate concentrations in fish tissue
depending upon the chemical of concern and the
studies used to develop the regression equations.
For example, high molecular weight PAHs (such
as benz(a)pyrene) with high Kow values lead to
the prediction of high fish tissue residues.
However, PAHs are rapidly metabolized in the
liver, and do not appear to accumulate
significantly in fish. Regression equations using
Kow cannot take into account such
pharmacokinetics, and thus may overestimate
bioconcentration. On the other hand, studies
used to develop regression equations which were
not representative of steady-state conditions will
tend to underestimate BCFs.
Typical methods for estimating fish tissue
concentrations are based on dissolved chemical
concentrations in water. While chemicals
present in sediment and biota may also
bioaccumulate in fish, there are only limited data
available to estimate contributions to fish from
these sources. However, chemicals that readily
adsorb to sediments, such as PCBs, can be
present in surface water at concentrations below
detection limits and still significantly
bioaccumulate. Some models are available to
assess the contribution of chemical
concentrations in sediment to chemical
concentrations in aquatic biota. CEAM (ERL
Athens) may be of assistance in choosing and
applying an appropriate model.
Plants. Site-related chemicals may be
present in plants as a result of direct deposition
onto plant surfaces, uptake from the soil, and
uptake from the air. When possible, samples of
plants or plant products should be used to
estimate exposure concentrations. In the absence
of monitoring data, several modeling approaches
are available for estimating exposure
concentrations in plants. Use of these models,
however, can introduce substantial uncertainty
into an exposure assessment.
If deposition onto plants is the source of
the chemical, air deposition modeling can be used
in conjunction with plant interception fractions to
estimate uptake. The plant interception fraction
can be estimated by methods published in the
literature or can be developed for a specific crop

Page 6-32
by considering crop yield and the area of the
plant available for deposition.
If soil contamination is the source of the
chemical, calculate the concentration in plants
by multiplying soil to plant partition coefficients
by soil concentrations. Use the open literature or
computerized data bases to obtain these
coefficients from field, microcosm, or laboratory
experiments that are applicable to the type of
vegetation or crop of concern (see EPA 1985c
sludge documents for some). In the absence of
more specific information, use general BCFs
published in the literature that are not crop-
specific (see Baes et al. 1984 for some). When
using these parameters, it is important to
consider that many site-specific factors affect
the extent of uptake. These factors include pH,
the amount of organic material present in soil,
and the presence of other chemicals.
When literature values are not available,
consider equations published in the literature for
estimating uptake into the whole plant, into the
root, and translocation from the root into above
ground parts (see Calamari et al. 1987). Such
methods require physical/chemical parameters
such as Kow or molecular weight and were
developed using a limited data base. Scientific
judgment must always be applied in the
development and application of any partition
coefficient, and caution must be applied in using
these values in risk assessment.
Terrestrial animals. Use tissue
monitoring data when available and appropriate
for estimating human exposure to chemicals in
the terrestrial food chain. In the absence of tissue
monitoring data, use transfer coefficients
together with the total chemical mass ingested
by an animal per day to estimate contaminant
concentrations in meat, eggs, or milk. Data to
support modeling of uptake by terrestrial
animals generally are not available for birds, but
are available for some mammalian species.
Terrestrial mammals such as cattle are
simultaneously exposed to chemicals from
several sources such as water, soil, corn silage,
pasture grass, and hay. Cattle ingest varying
amounts of these sources per day, each of which
will contain a different contaminant
concentration. Because all sources can be
important with regard to total body burden, an
approach based upon the daily mass of chemical
ingested per day is recommended because it can
be applied to input from many sources.
Obtain transfer coefficients from the
literature (see Ng et al. 1977, 1979, 1982; Baes
et al. 1984 for some), or calculate them directly
from feeding studies (see Jensen et al. 1981;
Jensen and Hummel 1982; Fries et al. 1973; Van
Bruwaene et al. 1984). In the absence of this
information, use regression equations in the
literature for the estimation of transfer
coefficients (see Travis and Arms 1988). It is
important to be aware that regression equations
that use feeding study results from short-term
exposures may underestimate meat or milk
concentrations. In addition, regression equations
which rely on Kow values may overestimate
exposures for chemicals such as benz(a)pyrene
that are rapidly metabolized. Information on the
amount of feed, soil and water ingested by dairy
and beef cows is available in the literature and
should be combined with chemical
concentrations in these media to estimate a daily
dose to the animal.
6.5.8 SUMMARIZE EXPOSURE
CONCENTRATIONS FOR EACH
PATHWAY
Summarize the exposure concentrations
derived for each pathway. Exhibit 6-10 presents
a sample format.
6.6 QUANTIFICATION OF EXPOSURE:
ESTIMATION OF CHEMICAL
INTAKE
This section describes the methodology
for calculating chemical-specific intakes for the
populations and exposure pathways selected for
quantitative evaluation. The general equation for
estimating intake was shown in Exhibit 6-9.
Remember that the intakes calculated in this step
are expressed as the amount of chemical at the
exchange boundary (e.g., skin, lungs, gut) and
available for absorption. Intake, therefore, is not
equivalent to absorbed dose, which is the
amount of a chemical absorbed into the blood
stream.

Page 6-33
EXHIBIT 6-10
EXAMPLE OF TABLE FORMAT FOR SUMMARIZING EXPOSURE CONCENTRATIONS

Page 6-34
The sections that follow give standard
equations for estimating human intakes for all
possible exposure routes at a site. Values for
equation variables are presented for use in
evaluating residential exposures. Considerations
for deriving pathway-specific variable values for
populations other than residential (i.e.,
commercial/industrial or recreational) also are
given. In general, both upper-bound (e.g., 95th
percentile or maximum values) and average
(mean or median) values are presented. These
values can be used to calculate the RME or to
evaluate uncertainty. A general discussion of
which variable values should be used to
calculate the RME was provided in Section
6.4.1; more specific guidance follows. A
discussion of the uncertainty analysis is
presented in Section 6.8.
The information presented below is
organized by exposure medium and exposure
route.
6.6.1 CALCULATE GROUND-WATER AND
SURFACE WATER INTAKES
Individuals may be exposed to chemicals
of potential concern in ground water and surface
water by the following routes:
(1) ingestion of ground water or
surface water used as drinking
water;
(2) incidental ingestion of surface
water while swimming; and
(3) dermal contact with ground water
or surface water.
Inhalation exposures to chemicals that
have volatilized from surface or ground water
are covered in Section 6.6.3.
Intake from drinking water. Calculate
residential intakes from ingestion of ground
water or surface water used as drinking water,
using the equation and variable values presented
in Exhibit 6-11. As discussed in section 6.5.3,
chemical concentration in water (CW) should be
based on data from unfiltered samples. Develop
pathway-specific variable values as necessary.
Ingestion rates (IR) could be lower for residents
who spend a portion of their day outside the
home (e.g., at work). Also, exposure frequency
(EF) may vary with land use. Recreational users
and workers generally would be exposed less
frequently than residents.
Intake from ingestion of surface water
while swimming. Calculate intakes from
incidental ingestion of surface water while
swimming. Use the equation and variable values
presented in Exhibit 6-12. Chemical
concentration in water (CW) should represent
unfiltered concentrations. Incidental ingestion
rates (IR) while swimming have not been found
in the available literature. SEAM (EPA 1988b)
recommends using an incidental ingestion rate
of 50 ml/hour of swimming. Exposure duration
(ED) will generally be less for recreational users
of a surface water compared to residents living
near the surface water. Workers are not expected
to be exposed via this pathway.
Intake from dermal contact. Calculate
intakes from dermal contact with water while
swimming, wading, etc., or during household
use (e.g., bathing).
Use the equation and variable values
presented in Exhibit 6-13. In this case, the
calculated exposure is actually the absorbed
dose, not the amount of chemical that comes in
contact with the skin (i.e., intake). This is
because permeability constants (PC) reflect the
movement of the chemical across the skin to the
stratum corneum and into the bloodstream. Be
sure to record this information in the summary
of exposure assessment results so that the
calculated intake is compared to an appropriate
toxicity reference value in the risk
characterization chapter. Note that PC are based
on an equilibrium partitioning and likely result
in an over-estimation of absorbed dose over
short exposure periods (e.g., < 1 hr). The open
literature should be consulted for chemical-
specific PC values. The values in SEAM (EPA
1988b) are currently being reviewed and should
not be used at this time. If chemical-specific PC
values are not available, the permeability of
water can be used to derive a default value. (See
Blank et al. [1984] for some values [e.g., 8.4x10
-
4
cm/hr].) Note that this approach may
underestimate dermal permeability for some
organic chemicals.
Comment [A26]: EPA has supplemented the
general guidance for evaluating dermal exposure
provided in RAGS Part A with procedures for
estimating permeability coefficients of toxic
chemicals and for evaluating the dermal absorbed
dose. These procedures may be found in Risk
Assessment Guide for Superfund Part E,
Supplemental Guidance for dermal Risk Assessment.
Please consult Section 3.1 for a description of these
procedures and specific equations for estimating
dermal exposures to chemicals in water. RAGS Part
E may be found at:
http://epa.gov/oswer/riskassessment/ragse/index.htm

Page 6-35
EXHIBIT 6-11
RESIDENTIAL EXPOSURE: INGESTION OF
CHEMICALS IN DRINKING WATER
A
(AND BEVERAGES MADE USING DRINKING WATER)

Page 6-36
EXHIBIT 6-12
RESIDENTIAL EXPOSURE:
INGESTION OF CHEMICALS IN SURFACE WATER
WHILE SWIMMING
A

Page 6-37
EXHIBIT 6-13
Comment [A
27]: EPA’
s
Risk Assessment
Guidan ce for Superfund Volume I: Human
Healt
h Evaluation Manual (Part B, Developmen
t
of Risk-based Preliminary Remediati
on Go
als)
provides inst ructions for evaluating the
inhalation of volatiles from a range of
household water uses (e.g., s howering,
laundering, dish washi
ng) -- see
Section 3.1.1.
RAGS Part B may be found at:
http://www.epa.gov/oswer/riskassessment/ragsb
Comment [A28]: EPA has supplemented the
general guidance for evaluating dermal
exposure provided in RAGS Part A. Updated
procedures and equations for evaluating the
dermal absorbed dose for chemicals in water
may be found in found in
Risk Assessment
Guide for Superfund Part E, Supplemental
Guidance for Dermal Risk Assessment.
Please
consult Section 3.1, Equation 3.1 for a
description of these procedures and the specific
equation f or estimating dermal exposures to
chemicals in water. RAGS Part E may be found
at: http://epa.gov/oswer/riskassessment/ragse/in
dex.htm
RESIDENTIAL EXPOSURE:
DERMAL CONTACT WITH CHEMICALS IN WATER
A

Page 6-38

To calculate the reasonable maximum
exposure for this pathway, 50th percentile
values, instead of 95th percentile values, are
used for the area of exposed skin (SA). This is
because surface area and body weight are
strongly correlated and 50th percentile values
are most representative of the surface area of
individuals of average weight (e.g., 70 kg)
which is assumed for this and all other exposure
pathways. Estimates of exposure for this
pathway are still regarded as conservative
because generally conservative assumptions are
used to estimate dermal absorption (PC) and
exposure frequency and duration.
Consider pathway-specific variations for
the intake variables. SA will vary with activity
and the extent of clothing worn. For example, a
greater skin surface area would be in contact
with water during bathing or swimming than
when wading. Worker exposure via this pathway
will depend on the type of work performed at the
site, protective clothing worn, and the extent of
water use and contact.
6.6.2 CALCULATE SOIL, SEDIMENT, OR
DUST INTAKES
Individuals may be exposed to chemicals
of potential concern in soil, sediment, or dust by
the following routes:
(1) incidental ingestion; and
(2) dermal contact.
Comment [A29]: EPA has supplemented the
general guidance for evaluating dermal
exposure provided in RAGS Part A with
procedures for estimating permeability
coefficients of toxic chemicals and for
evaluating the dermal absorbed dose. These
procedures can be found in
Risk Assessment
Guide for Superfund (Part E, Supplemental
Guidance for Dermal Risk Assessment).
Please
consult Section 3.2 for a description of these
procedures and specific equations for
estimating dermal exposures to chemicals in
soil. RAGS Part E may be found at:
http://epa.gov/oswer/riskassessment/ragse/ind
ex.htm
Inhalation exposures to airborne soil or dust are
discussed in Section 6.6.3.
Incidental ingestion. Calculate intakes
from incidental ingestion of chemicals in soil by
residents using the equation and variable values
presented in Exhibit 6-14. Consider population
characteristics that might influence variable
values. Exposure duration (ED) may be less for
workers and recreational users.
The value suggested for ingestion rate (IR)
for children 6 years old and younger are based
primarily on fecal tracer studies and account for
ingestion of indoor dust as well as outdoor soil.
These values should be viewed as representative
of long-term average daily ingestion rates for
Page 6-39
children and should be used in conjunction with
an exposure frequency of 365 days/year. A term
can be used to account for the fraction of soil or
dust contacted that is presumed to be
contaminated (FI). In some cases, concentrations
in indoor dust can be equal to those in outdoor
soil. Conceivably, in these cases, FI could be
equal to 1.0.
For ingestion of chemicals in sediment,
use the same equation as that used for ingestion
of soil. Unless more pathway-specific values can
be found in the open literature, use as default
variable values the same values as those used for
ingestion of soil. In most instances, contact and
ingestion of sediments is not a relevant pathway
for industrial/commercial land use (a notable
exception to this could be workers repairing
docks).
Dermal contact. Calculate exposure from
dermal contact with chemicals in soil by
residents using the equation and variable values
presented in Exhibit 6-15. As was the case with
exposure to chemicals in water, calculation of
exposure for this pathway results in an estimate
of the absorbed dose, not the amount of
chemical in contact with the skin (i.e., intake).
Absorption factors (ABS) are used to reflect the
desorption of the chemical from soil and the
absorption of the chemical across the skin and
into the blood stream. Consult the open literature
for information on chemical-specific absorption
factors. In the absence of chemical-specific
information, use conservative assumptions to
estimate ABS.
Again, as with dermal exposure to water,
50th percentile body surface area (SA) values
are used to estimate contact rates. These values
are used along with average body weight
because of the strong correlation between
surface area and body weight. Contact rates may
vary with time of year and may be greater for
individuals contacting soils in the warmer
months of the year when less clothing is worn
(and hence, more skin is available for contact).
Adherence factors (AF) are available for few
soil types and body parts. The literature should
be reviewed to derive AF values for other soil
types and other body parts. Exposure frequency
(EF) is generally determined using site-specific
information and professional judgment.

Page 6-40
EXHIBIT 6-14
RESIDENTIAL EXPOSURE:
INGESTION OF CHEMICALS IN SOIL
A
Comment [A30]: EPA’s
Supplemental
Guidance for Developing Soil Screening Levels
for Superfund Sites
provides updated equations
for residential exposure that combine ingestion
and dermal absorption. It also presents new
methods for evaluating non-residential
exposure. This guidance may be found at:
http://www.epa.gov/superfund/health/conmedi
a/soil/index.htm
Comment [A31]: EPA’s
Supplemental
Guidance for Developing Soil Screening Levels
for Superfund Sites
provides equations for
exposure through dermal contact in a non-
residential scenario. This guidance may be
found at:
http://www.epa.gov/superfund/health/conmedi
a/soil/index.htm
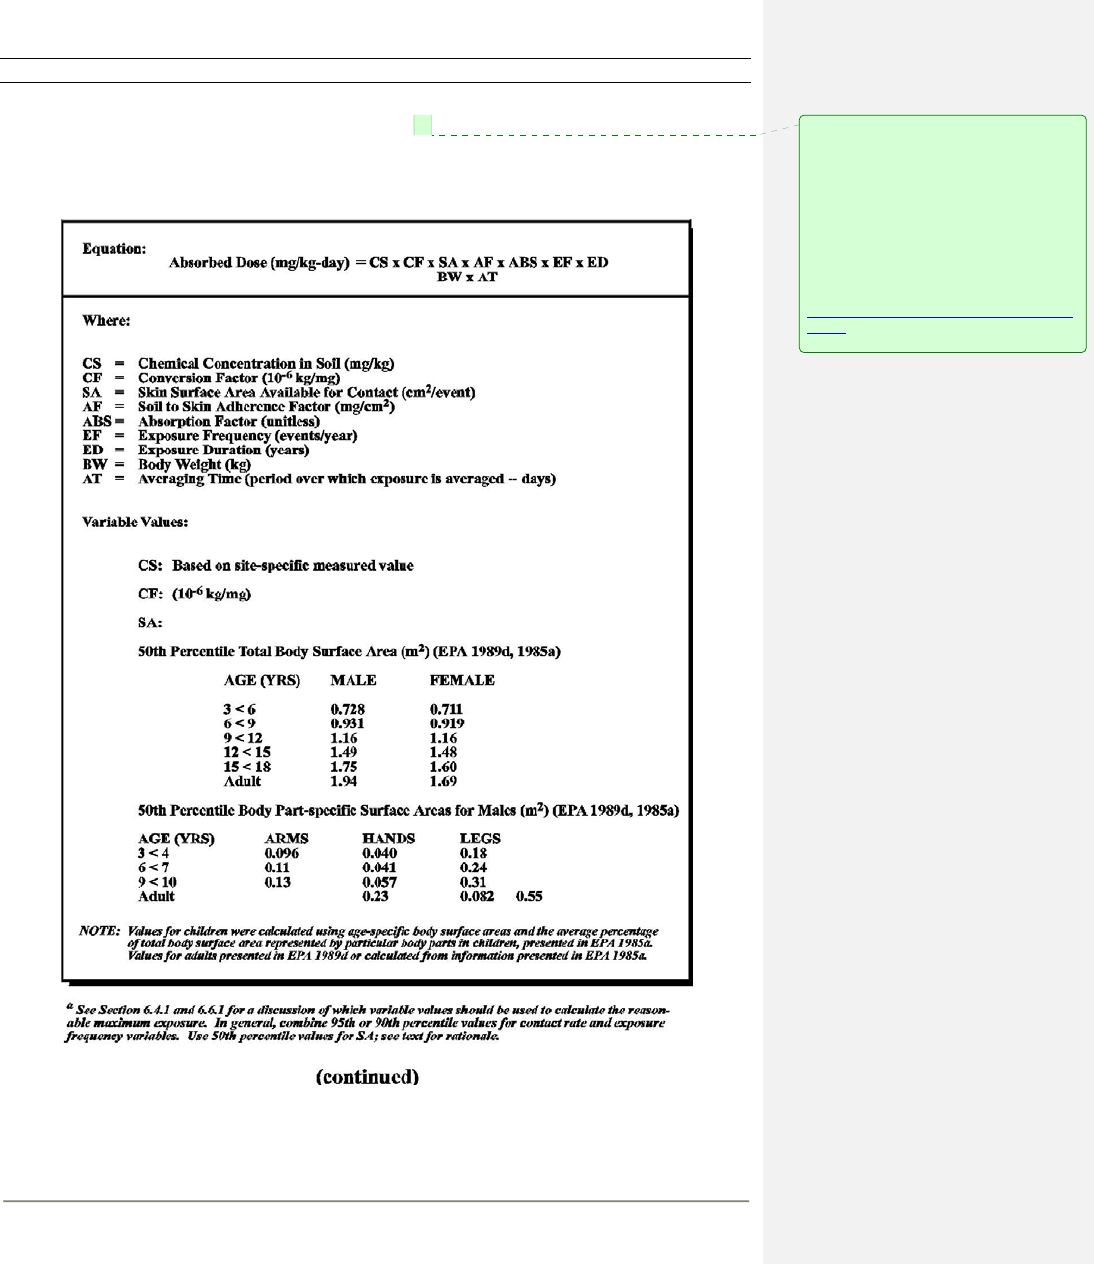
Page 6-41
EXHIBIT 6-15
RESIDENTIAL EXPOSURE:
DERMAL CONTACT WITH CHEMICALS IN SOIL
A
Comment [A32]: EPA has supplemented the
general guidance for evaluating dermal
exposure provided in RAGS Part A. Updated
procedures and equations for evaluating the
dermal absorbed dose for chemicals in soil may
be found in found in
Risk Assessment Guide for
Superfund Part E, Supplemental Guidance for
Dermal Risk Assessment.
Please consult
Sections 3.2 and Equation 3.12 for a description
of these procedures and the specific equation
for estimating dermal exposures to chemicals in
soil. RAGS Part E may be found at:
http://epa.gov/oswer/riskassessment/ragse/ind
ex.htm

Page 6-42

"Best guess" values for children potentially
useful in risk assessments are 3 times/week for
fall and spring days (>32
o
F) and 5 times/week
for summer days when children are not attending
school. As discussed previously, in some cases,
concentrations in indoor dust could be equal to
that in outdoor environments. Therefore, at some
sites, EF could be 365 days/year. Worker and
recreational user contact rates are dependent on
the type of activity at the site. Exposure duration
(ED) and exposure frequency (EF) may be lower
for workers and recreational users.
For dermal contact with sediment or dust,
use the same equation as that for dermal contact
with soil. As default values, also use the variable
values given for dermal contact with soil unless
more pathway-specific values can be found in
the open literature. Adherence factors for some
sediments (particularly sandy sediments) are
likely to be much less than for soils because
contact with water may wash the sediment off
the skin. Exposure frequency for sediments also
is probably lower than that for soils at many
sites.
6.6.3 CALCULATE AIR INTAKES
Comment [A33]: The Superfund Program has
updated its inhalation risk paradigm and no
longer recommends the approach described in
this section. Please consult Chapter 3 of EPA’s
Risk Assessment Guidance for Superfund
Volume I: Human Health Evaluation Manual
(Part F, Supplemental Guidance for Inhalation
Risk Assessment)
for current recommendations
regarding exposure assessments for inhaled
contaminants. RAGS, Part F may be found at:
http://www.epa.gov/oswer/riskassessment/rags
f/index.htm.
Individuals may be exposed to chemicals
of potential concern in air by inhalation of
chemicals in the vapor phase or adsorbed to
particulates. Dermal absorption of vapor phase
chemicals is considered to be lower than
inhalation intakes in many instances and
generally is not considered in Superfund
exposure assessments.
As with other pathways, the inhalation
intakes are expressed in units of mg/kg-day. The
combination of inhalation intakes with inhalation
RfDs (expressed in concentration units of
mg/m
3
) will be discussed in Chapters 7 and 8.
Inhalation of vapor-phase chemicals .
Calculate intakes from inhalation of vapor phase
chemicals using the equation and variable values
presented in Exhibit 6-16. Consider variations
with land use. Exposure time (ET) will generally
be less for workers and recreational users. For
exposure times less than 24 hours per day, an
hourly inhalation rate (IR) based on activity,
age, and sex should be used instead of the daily
IR values. Exposure duration (ED) may also be
less for workers and recreational users.
Page 6-43
Inhalation of particulate phase
chemicals. Calculate intakes from inhalation of
particulate phase chemicals by modifying the
equations and variable values presented in
Exhibit 6-16 for vapor-phase exposures. Derive
inhalation estimates using the particulate
concentration in air, the fraction of the
particulate that is respirable (i.e., particles 10 um
or less in size) and the concentration of the
chemical in the respirable fraction.
Note that it may be necessary to adjust
intakes of particulate phase chemicals if they are
to be combined with toxicity values that are
based on exposure to the chemical in the vapor
phase. This adjustment is done in the risk
characterization step.
6.6.4 CALCULATE FOOD INTAKES
Individuals may be exposed by ingestion
of chemicals of potential concern that have
accumulated in food. The primary food items of
concern are:
(1) fish and shellfish;
(2) vegetables and other produce; and
(3) meat, eggs, and dairy products (domestic
and game species).
Comment [A34]: EPA has developed guidance
for assessing health risks associated with the
consumption of chemically contaminated non-
commercial fish. This document,
Guidance for
Assessing Chemical Contaminant Data for Use
in Fish Advisories
, includes volumes on "Fish
Sampling and Analysis" and "Risk Assessment
and Fish Consumption Limits". It may be found
at:
http://www.epa.gov/fishadvisories/technical/gui
dance.html
Ingestion of fish and shellfish. Calculate
intakes from ingestion of fish and shellfish
using the equation and variable values given in
Exhibit 6-17. Exposure will depend in part on
the availability of suitable fishing areas. The
chemical concentration in fish or shellfish (CF)
should be the concentration in the edible tissues
(when available). The edible tissues will vary
with aquatic species and with population eating
habits. Residents near major commercial or
recreational fisheries or shell fisheries are likely
to ingest larger quantities of locally caught fish
and shellfish than inland residents. In most
instances, workers are not likely to be exposed
via this pathway, although at some sites this may
be possible.
Ingestion of vegetables or other
produce. Calculate intakes from ingestion of
contaminated vegetables or other produce using
the equation and variable values given in Exhibit
6-18.

EXHIBIT 6-16
RESIDENTIAL EXPOSURE:
INHALATION OF AIRBORNE (VAPOR PHASE) CHEMICALS
A B
Comment [A35]: The Superfund Program has
updated its inhalation risk paradigm and no longer
recommends use of the equation described in Exhibit
6-16. Please consult Chapter 3 of EPA’s Risk
Assessment Guidance for Superfund Volume I:
Human Health Evaluation Manual (Part F,
Supplemental Guidance for Inhalation Risk
Assessment) for current recommendations regarding
exposure assessments for inhaled contaminants.
RAGS, Part F may be found at:
http://www.epa.gov/oswer/riskassessment/ragsf/inde
x.htm
Page 6-44

Page 6-45
EXHIBIT 6-17
RESIDENTIAL EXPOSURE: FOOD PATHWAY – INGESTION
OF CONTAMINATED FISH AND SHELLFISH
α
Comment [A36]: EPA has developed guidance
for assessing health risks associated with the
consumption of chemically contaminated non-
commercial fish.
Guidance for Assessing
Chemical Contaminant Data for Use in Fish
Advisories
, includes volumes on "Fish Sampling
and Analysis" and "Risk Assessment and Fish
Consumption Limits". It may be found at:
http://www.epa.gov/fishadvisories/technical/gui
dance.html

Page 6-46
EXHIBIT 6-18
RESIDENTIAL EXPOSURE: FOOD PATHWAY – INGESTION
OF CONTAMINATE FRUITS AND VEGETABLES
a
D

This pathway will be most significant for
farmers and for rural and urban residents
consuming homegrown fruits and vegetables.
For contaminated backyard gardens, the fraction
of food ingested that is contaminated (FI) can be
estimated using information on the fraction of
fruits or vegetables consumed daily that is home
grown (HF). EPA (1989d) provides HF values
for fruit (0.20, average; 0.30 worst-case) and
vegetables (0.25, average; 0.40, worst-case).
(Worst-case values can be used as estimates of
the 95th percentile value.) Pao et al. (1982)
provides specific values for a variety of fruits
and vegetables.
Workers are not likely to be exposed via
this pathway. Recreational users could be
exposed from consuming wild fruits or
vegetables from the site, although such
exposures are likely to be negligible.
Ingestion of meat, eggs, and dairy
products. Calculate intakes from ingestion of
contaminated meat and dairy products using the
equation and variable values given in Exhibit 6-
19. Derive pathway-specific values as necessary.
Rural residents may consume poultry as well as
livestock and wild game that have been exposed
to contaminants at the site. The fraction of food
ingested daily that is contaminated (FI) can be
estimated for beef and dairy products using
information provided in EPA (1989d) on the
fraction of these foods that is homegrown (HF).
HF for beef is estimated to be 0.44 (average) and
0.75 (worst-case). HF for dairy products is
estimated to be 0.40 (average) and 0.75 (worst-
case). (Worst-case values can be used as
estimates of the 95th percentile value.) Consider
land-use variations. Workers are not likely to be
exposed via this pathway. Exposure duration
(ED) and exposure frequency (EF) will likely be
less for recreational users (e.g., hunters).
6.7 COMBINING CHEMICAL INTAKES
ACROSS PATHWAYS
As discussed previously, the RME at a site
reflects the RME for a pathway as well as the
RME across pathways. A given population may
be exposed to a chemical from several exposure
routes. For example, residents may be exposed
to chemicals in ground water via ingestion of
drinking water and via inhalation of chemicals
that have volatilized from ground water during
its use. They also could be exposed to chemicals
Page 6-47
in vapors or dust that have migrated from the
site. To calculate an exposure that is a
reasonable maximum across pathways, it may be
necessary to combine the RME for one pathway
with an estimate of more typical exposure for
another pathway (see Section 8.3.1). The
average variable values identified in the
previous sections can be used to calculate
intakes for these more typical exposures. At this
point in the assessment, estimated intakes are
not summed across pathways; this is addressed
in the risk characterization chapter. However,
the assessor should organize the results of the
previous exposure analyses (including any
estimates of typical exposure) by grouping all
applicable exposure pathway for each exposed
population. This organization will allow risks
from appropriate exposures to be combined in
the risk characterization chapter (see Exhibit 6-
22 for a sample summary format).
6.8 EVALUATING UNCERTAINTY
The discussion of uncertainty is a very
important component of the exposure
assessment. Based on the sources and degree of
uncertainty associated with estimates of
exposure, the decision-maker will evaluate
whether the exposure estimates are the
maximum exposures that can be reasonably
expected to occur. Section 8.4 provides a
discussion of how the exposure uncertainty
analysis is incorporated into the uncertainty
analysis for the entire risk assessment.
The discussion of uncertainty in the
exposure assessment chapter should be separated
into two parts. The first part is a tabular
summary of the values used to estimate exposure
and the range of these values. The table should
include the variables that appear in the exposure
equation as well as those used to estimate
exposure concentrations (e.g., model variables).
A simple example of this table is shown in
Exhibit 6-20. For each variable, the table should
include the range of possible values, the
midpoint of the range (useful values for this part
are given in Exhibits 6-11 through 6-19), and the
value used to estimate exposure. In addition, a
brief description of the selection rationale should
be included. The discussion that accompanies
the table in the exposure assessment chapter
should identify which variables have the greatest
range and provide additional justification for the
use of values that may be less certain.

Page 6-48
EXHIBIT 6-19
RESIDENTIAL EXPOSURE: FOOD PATHWAY –
INGESTION OF CONTAMINATED MEAT, EGGS,
AND DAIRY PRODUCTS
a

Page 6-49
EXHIBIT 6-20
EXAMPLE OF TABLE FORMAT FOR SUMMARIZING
VALUES USED TO ESTIMATE EXPOSURE

Page 6-50
The second part of the uncertainty
discussion is to summarize the major
assumptions of the exposure assessment, to
discuss the uncertainty associated with each, and
to describe how this uncertainty is expected to
affect the estimate of exposure. Sources of
uncertainty that should be addressed include 1)
the monitoring data, which may or may not be
representative of actual conditions at the site; 2)
the exposure models, assumptions and input
variables used to estimate exposure
concentrations; and 3) the values of the intake
variables used to calculate intakes. Each of these
sources should be discussed in the summary
section of the exposure assessment. A table may
be useful in summarizing this information.
Exhibit 6-21 presents a sample format.
A supplemental approach to uncertainty
analysis is to use analytical methods (e.g., first-
order uncertainty analysis) or numerical methods
(e.g., Monte Carlo analysis). These methods and
their limitations are described in greater detail in
Section 8.4 It is recommended that these
analyses be used only after approval of the EPA
project manager, and then, only as a part of the
uncertainty analysis (and not as a basis for the
reasonable maximum exposure).
6.9 SUMMARIZING AND PRESENTING
THE EXPOSURE ASSESSMENT RESULTS
At this point, the exposure assessor should
summarize the results of the exposure
assessment. The summary information should be
presented in table format and should list the
estimated chemical-specific intakes for each
pathway. The pathways should be grouped by
population so that risks can be combined across
pathways as appropriate. The summary
information should be further grouped by
current and future use categories. Within these
categories, subchronic and chronic daily intakes
should be summarized separately. Exhibit 6-22
presents a sample format for this summary
information. In addition to the summary table,
provide sample calculations for each pathway, to
aid in the review of the calculations.
Comment [A37]: EPA’s Risk Assessment
Guidance for Superfund Volume I: Human
Health Evaluation Manual (Part D, Standardized
Planning, Reporting, and Review of Superfund
Risk Assessments) provides planning tables for
use during the risk assessment process,
including the exposure assessment
. See
Part D,
Section 3.1.1, page 3-5, for an overview of
using Planning Table 3: Exposure Point
Concentration Summary
. See
page 3-6 for an
overview of using Planning Table 4: Values
Used for Daily Intake Calculations. Also see
Appendix 1 for the downloadable Planning
Table templates and instructions for completing
the tables. RAGS Part D may be found at:
http://www.epa.gov/oswer/riskassessment/rags
d/index.htm

Page 6-51
EXHIBIT 6-21
EXAMPLE OF AN UNCERTAINTY TABLE FOR
EXPOSURE ASSESSMENT

Page 6-52
EXHIBIT 6-22
EXAMPLE OF TABLE FORMAT FOR SUMMARIZING
THE RESULTS OF THE EXPOSURE ASSESSMENT –
CURRENT LAND USE
Α

Page 6-53
REFERENCES FOR CHAPTER 6
Baes, C.F., III, Sharp, R.D., Sjoreen, A.L., and Shore, R. W. 1984. A Review and Analysis of Parameters for Assessing Transport of
Environmentally Released Radionuclides through Agriculture. Oak Ridge National Laboratory. Prepared for U.S. Department
of Energy.ORNL-5786.
Blank, I.H., Moloney, J., Alfred, B.S., Simon, I., and Apt, C. 1984. The Diffusion of Water Across the Stratum Corneum as a Function of
its Water Content. J. Invest. Derm. 82:188-194.
Calamari, D., Vighi, M., and Bacci, E. 1987. The Use of Terrestrial Plant Biomass as a Parameter in the Fugacity Model. Chemosphere.
16:2539-2364.
Clark, I. 1979. Practical Geostatistics. Applied Science Publishers, Ltd. London.
Environmental Protection Agency (EPA). 1985a. Development of Statistical Distributions or Ranges of Standard Factors Used in
Exposure Assessments. Office of Health and Environmental Assessment.
Environmental Protection Agency (EPA). 1985b.Compilation of Air Pollutant Emission Factors.Volume 1. Stationary Point and Area
Sources. Fourth Edition. Office of Research and Development. Research Triangle Park, NC.
Environmental Protection Agency (EPA). 1985c.Environmental Profiles and Hazard Indices for Constituents of Municipal SludgeOffice
of Water.. (Individual documents are available for a number of substances).
Environmental Protection Agency (EPA). 1986a.Guidelines for Exposure Assessmen.t51 Federal Register34042 (September 24, 1986).
Environmental Protection Agency (EPA). 1986b.Guidelines for Carcinogen Risk Assessmen.t 51 Federal Register33992 (September 24,
1986).
Environmental Protection Agency (EPA). 1987a.Industrial Source Complex (ISC) Dispersion Model User's Guide. Volume. IOffice of
Air Quality Planning and Standards. Research Triangle Park, NC.EPA/450/4-88/002a.
Environmental Protection Agency (EPA). 1987b.Selection Criteria for Mathematical Models Used in Exposure Assessments: Surface
Water Models. Office of Health and Environmental Assessment.EPA/600/8-87/042.
Environmental Protection Agency (EPA). 1988a.Proposed Guidelines for Exposure-related Measurements. 53 Federal Register48830
(December 2, 1988).
Environmental Protection Agency (EPA). 1988b.Superfund Exposure Assessment Manua.lOffice of Emergency and Remedial
Response.EPA/540/188/001. (OSWER Directive 9285.5-1).
Environmental Protection Agency (EPA). 1988c.Selection Criteria for Mathematical Models Used in Exposure Assessments: Ground-
water Models. Office of Health and Environmental Assessment.EPA/600/8-88/075.
Environmental Protection Agency (EPA). 1989a.Air Superfund National Technical Guidance Series. Volume I: Application of Air
Pathway Analyses for Superfund Activities. Interim Final. Office of Air Quality Planning and Standards. Research Triangle
Park, NC.EPA/450/1-89/001.
Environmental Protection Agency (EPA). 1989b.Air Superfund National Technical Guidance Series. Volume II: Estimation of Baseline
Air Emissions at Superfund Sites. Interim Final. Office of Air Quality Planning and Standards. Research Triangle Park,
NC.EPA/450/1-89/002.
Environmental Protection Agency (EPA). 1989c.Air Superfund National Technical Guidance Series. Volume IV: Procedures for
Dispersion Modeling and Air Monitoring for Superfund Air Pathway Analysis. Interim Final. Office of Air Quality Planning
and Standards. Research Triangle Park, NC. EPA/450/1-89/004.
Environmental Protection Agency (EPA). 1989d.Exposure Factors Handbook. Office of Health and Environmental
Assessment.EPA/600/8-89/043.
Environmental Protection Agency (EPA). 1989e.Proposed Amendments to the Guidelines for the Health Assessment of Suspect
Developmental Toxicants. 54 Federal Register9386 (March 6, 1989).
Environmental Protection Agency (EPA). 1989f.Exposure Assessment Methods Handbook. Draft. Office of Health and Environmental
Assessment. Environmental Protection Agency (EPA). 1989g.Interim Final Guidance for Soil Ingestion Rate.sOffice of Solid
Waste and Emergency Response. (OSWER Directive 9850.4).
Environmental Protection Agency (EPA). 1989h. Guidance Manual for Assessing Human Health Risks From Chemically Contaminated
Fish and Shellfish. Office of Marine and Estuarine Protection.EPA/503/8-89/002.

Page 6-54
Fries, G.F., Marrow, G.S., and Gordon, C.H. 1973. Long-term Studies of Residue Retention and Excretion by Cows Fed a
Polychlorinated Biphenyl (Aroclor 1254). J. Agric. Food Chem. 21:117-121.
Gilbert, R.O. 1987. Statistical Methods for Environmental Pollution Monitorin.gVan Nostrand Reinhold. New York. Jensen, D.J.,
Hummel, R.A., Mahle, N.H., Kocher, C.W., and Higgins, H.S. 1981. A Residue Study on Beef Cattle Consuming 2,3,7,8-
Tetrachlorodibenzo-p-dioxin. J. Agric. Food Chem. 29:265-268.
Jensen, D.J. and Hummel, R.A. 1982. Secretion of TCDD in Milk and Cream Following the Feeding of TCDD to Lactating Dairy Cows.
Bull. Env. Contam. Toxicol. 29:440-446.
Ng, Y.C., Colsher, C.S., Quinn, D.J. and Thompson, S.E. 1977. Transfer Coefficients for the Prediction of the Dose to Man Via the
Forage-Cow-Milk Pathway from Radionuclides Released to the Biosphere. Lawrence Livermore National Laboratory, Univ.
California. Prepared for U.S. Dept. of Energy. UCRL-5139.
Ng, Y.C., Colsher, C.S., and Thompson, S.E. 1979. Transfer Factors for Assessing the Dose from Radionuclides in Agricultural
Products. Biological Implications of Radionuclides Released From Nuclear Industries. In: Proceedings of an International
Symposium on Biological Implications of Radionuclides Released from Nuclear Industrie.sVienna. March 26-30, 1979.
IAEA-SM-237/54. Vol. II.
Ng, Y.C., Colsher, C.S., and Thompson, S.E. 1982. Transfer Coefficients for Assessing the Dose from Radionuclides in Meat and Eggs.
Lawrence Livermore National Laboratory. NUREG/CR-2976.
Pao, E.M., Fleming, K.H., Gueuther, P.M., and Mickle, S.J. 1982. Food Commonly Eaten by Individuals: Amount Per Day and Per
Eating Occasion. U.S. Department of Agriculture.
Schaum, J.L. 1984. Risk Analysis of TCDD Contaminated Soil. Office of Health and Environmental Assessment, U.S. Environmental
Protection Agency. EPA/600/8-84/031.
Travis, C.C. and Arms, A.D. 1988. Bioconcentration of Organics in Beef, Milk, and Vegetation. Environ. Sci. Technol. 22:271-274.
51 54 59 60
Van Bruwaene, R., Gerber, G.B., Kerchmann, R., Colard, J. and Van Kerkom, J. 1984. Metabolism of Cr, Mn, Fe and Co in
Lactating Dairy Cows. Health Physics46:1069-1082.


CHAPTER 7
TOXICITY ASSESSMENT
The purpose of the toxicity assessment is
to weigh available evidence regarding the
potential for particular contaminants to cause
adverse effects in exposed individuals and to
provide, where possible, an estimate of the
relationship between the extent of exposure to a
contaminant and the increased likelihood and/or
severity of adverse effects.
Toxicity assessment for contaminants found
at Superfund sites is generally accomplished in
two steps: hazard identification and dose-
response assessment. These two steps were first
discussed in the National Academy of Sciences'
publication entitled Risk Assessment in the
Federal Government - Managing the Process
and more recently in EPA's Guidelines for
Carcinogen Risk Assessment (NAS 1983, EPA
1986). The first step, hazard identification, is the
process of determining whether exposure to an
agent can cause an increase in the incidence of a
particular adverse health effect (e.g., cancer,
birth defect) and whether the adverse health
effect is likely to occur in humans. Hazard
identification involves characterizing the nature
and strength of the evidence of causation. The
second step, dose-response evaluation, is the
process of quantitatively evaluating the toxicity
information and characterizing the relationship
between the dose of the contaminant
administered or received and the incidence of
adverse health effects in the exposed population.
From this quantitative dose-response
relationship, toxicity values (e.g., reference
doses and slope factors) are derived that can be
used to estimate the incidence or potential for
adverse effects as a function of human exposure
to the agent. These toxicity values are used in
the risk characterization step to estimate the
likelihood of adverse effects occurring in
humans at different exposure levels.
Toxicity assessment is an integral part of
the overall Superfund site risk assessment.
Although toxicity information is critical to the
risk assessment, the amount of new toxicological
evaluation of primary data required to complete
this step is limited in most cases. EPA has
performed the toxicity assessment step for
numerous chemicals and has made available the
resulting toxicity information and toxicity
values, which have undergone extensive peer
review. At some sites, however, there will be
significant data analysis and interpretation issues
that should be addressed by an experienced
toxicologist. This chapter provides step-by-step
guidance for locating EPA toxicity assessments
and accompanying values, and advises how to
determine which values are most appropriate
when multiple values exist. Prior to this
procedural discussion, background information
regarding EPA's methods for toxicity assessment
is provided to assist the risk assessor in
understanding the basis of the toxicity values
and the limitations of their use. The steps of the
toxicity assessment are illustrated in Exhibit 7-1.
ACRONYMS FOR CHAPTER 7
ADI = Acceptable Daily Intake
AIC = Acceptable Intake for Chronic Exposure
AIS = Acceptable Intake for Subchronic Exposure
CRAVE = Carcinogen Risk Assessment
Verification Endeavor
ECAO = Environmental Criteria and Assessment
Office
HAD = Health Assessment Document
HEA = Health Effects Assessment
HEAST = Health Effects Assessment Summary
Tables
HEED = Health and Environmental Effects
Document
HEEP = Health and Environmental Effects
Profile
IRIS = Integrated Risk Information System
LOAEL = Lowest-Observed-Adverse-Effect-Level
NOAEL = No-Observed-Adverse-Effect-Level
NOEL = No-Observed-Effect-Level
RfD = Reference Dose (when used without other
modifiers, RfD generally refers to chronic
reference dose)
RfDdt = Developmental Reference Dose
RfD = Subchronic Reference Dose

Page 7-2
DEFINITIONS FOR CHAPTER 7
Acceptable Daily Intake (ADI). An estimate similar in concept to the RfD, but derived using a less strictly defined
methodology. RfDs have replaced ADIs as the Agency's preferred values for use in evaluating potential
noncarcinogenic health effects resulting from exposure to a chemical.
Acceptable Intake for Chronic Exposure (AIC). An estimate similar in concept to the RfD, but derived using a less strictly
defined methodology. Chronic RfDs have replaced AICs as the Agency's preferred values for use in evaluating
potential noncarcinogenic health effects resulting from chronic exposure to a chemical.
Acceptable Intake for Subchronic Exposure (AIS). An estimate similar in concept to the subchronic RfD, but derived
using a less strictly defined methodology. Subchronic RfDs have replaced AISs as the Agency's preferred values for
use in evaluating potential noncarcinogenic health effects resulting from subchronic exposure to a chemical.
Chronic Reference Dose (RfD). An estimate (with uncertainty spanning perhaps an order of magnitude or greater) of a
daily exposure level for the human population, including sensitive subpopulations, that is likely to be without an
appreciable risk of deleterious effects during a lifetime. Chronic RfDs are specifically developed to be protective for
long-term exposure to a compound (as a Superfund program guideline, seven years to lifetime).
Developmental Reference Dose (RfD dt). An estimate (with uncertainty spanning perhaps an order of magnitude or
greater) of an exposure level for the human population, including sensitive subpopulations, that is likely to be without
an appreciable risk of developmental effects. Developmental RfDs are used to evaluate the effects of a single
exposure event.
Dose-response Evaluation. The process of quantitatively evaluating toxicity information and characterizing the
relationship between the dose of a contaminant administered or received and the incidence of adverse health effects in
the exposed population. From the quantitative dose-response relationship, toxicity values are derived that are used in
the risk characterization step to estimate the likelihood of adverse effects occurring in humans at different exposure
levels.
Hazard Identification. The process of determining whether exposure to an agent can cause an increase in the incidence of
a particular adverse health effect (e.g., cancer, birth defect) and whether the adverse health effect is likely to occur in
humans.
Integrated Risk Information System (IRIS). An EPA data base containing verified RfDs and slope factors and up-to-date
health risk and EPA regulatory information for numerous chemicals. IRIS is EPA's preferred source for toxicity
information for Superfund.
Lowest-Observed-Adverse-Effect-Level (LOAEL). In dose-response experiments, the lowest exposure level at which
there are statistically or biologically significant increases in frequency or severity of adverse effects between the
exposed population and its appropriate control group.
No-Observed-Adverse-Effect-Level (NOAEL). In dose-response experiments, an exposure level at which there are no
statistically or biologically significant increases in the frequency or severity of adverse effects between the exposed
population and its appropriate control; some effects may be produced at this level, but they are not considered to be
adverse, nor precursors to specific adverse effects. In an experiment with more than one NOAEL, the regulatory focus
is primarily on the highest one, leading to the common usage of the term NOAEL to mean the highest exposure level
without adverse effect.
No-Observed-Effect-Level (NOEL). In dose-response experiments, an exposure level at which there are no statistically or
biologically significant increases in the frequency or severity of any effect between the exposed population and its
appropriate control.
Reference Dose (RfD). The Agency's preferred toxicity value for evaluating noncarcinogenic effects resulting from
exposures at Superfund sites. See specific entries for chronic RfD, subchronic RfD, and developmental RfD. The
acronym RfD, when used without other modifiers, either refers generically to all types of RfDs or specifically to
chronic RfDs; it never refers specifically to subchronic or developmental RfDs.

Page 7-3
DEFINITIONS FOR CHAPTER 7
(continued)
Slope Factor. A plausible upper-bound estimate of the probability of a response per unit intake of a chemical over a
lifetime. The slope factor is used to estimate an upper-bound probability of an individual developing cancer as a result
of a lifetime of exposure to a particular level of a potential carcinogen.
Subchronic Reference Dose (RfDs). An estimate (with uncertainty spanning perhaps an order of magnitude or greater) of
a daily exposure level for the human population, including sensitive subpopulations, that is likely to be without an
appreciable risk of deleterious effects during a portion of a lifetime (as a Superfund program guideline, two weeks to
seven years).
Toxicity Value. A numerical expression of a substance's dose-response relationship that is used in risk assessments. The
most common toxicity values used in Superfund program risk assessments are reference doses (for noncarcinogenic
effects) and slope factors (for carcinogenic effects).
Weight of Evidence Classification. An EPA classification system for characterizing the extent to which the available data
indicate that an agent is a human carcinogen. Recently, EPA has developed weight-of-evidence classification systems
for some other kinds of toxic effects, such as developmental effects.
Derivation and interpretation of toxicity
values requires toxicological expertise and
should not be undertaken by those without
training and experience. Detailed guidance for
deriving toxicity values is beyond the scope of
this document. For those persons interested in
obtaining additional information about EPA's
methods for toxicity assessment, references to
appropriate guidance documents are given
throughout this chapter.
7.1 TYPES OF TOXICOLOGICAL
INFORMATION CONSIDERED IN
TOXICITY ASSESSMENT
This section summarizes information from
several EPA documents (especially EPA 1989a,
f) on the basic types of data used in toxicity
assessment. As part of the hazard identification
step of the toxicity assessment, EPA gathers
evidence from a variety of sources regarding the
potential for a contaminant to cause adverse
health effects (carcinogenic and noncarcinogenic)
in humans. These sources may include
controlled epidemiologic investigations, clinical
studies, and experimental animal studies.
Supporting information may be obtained from
sources such as in vitro test results and
comparisons of structure-activity relationships.
7.1.1 HUMAN DATA
Well-conducted epidemiologic studies that
show a positive association between an agent
and a disease are accepted as the most
convincing evidence about human risk. At
present, however, human data adequate to serve
as the sole basis of a dose-response assessment
are available for only a few chemicals. Humans
are generally exposed in the workplace or by
accident, and because these types of exposures
are not intentional, the circumstances of the
exposures (concentration and time) may not be
well known. Often the incidence of effects is
low, the number of exposed individuals is small,
the latent period between exposure and disease
is long, and exposures are to mixed and multiple
substances. Exposed populations may be
heterogeneous, varying in age, sex, genetic
constitution, diet, occupational and home
environment, activity patterns, and other cultural
factors affecting susceptibility. For these
reasons, epidemiologic data require careful
interpretation. If adequate human studies
(confirmed for validity and applicability) exist,
these studies are given first priority in the dose-
response assessment, and animal toxicity studies
are used as supportive evidence.

Page 7-4
EXHIBIT 7-1
STEPS IN TOXICITY ASSESSMENT

Page 7-5
Human studies having inadequate
exposure-response information for a quantitative
assessment are often used as supporting data.
Such studies may establish a qualitative
relationship between environmental exposures
and the presence of an adverse effect in exposed
human populations. For example, case reports of
exposures resulting in effects similar to the types
of effects observed in animals provide support
for the conclusions drawn from the animal data.
7.1.2 ANIMAL DATA
The toxicity data base for most chemicals
lacks sufficient information on toxic effects in
humans. In such cases, EPA may infer the
potential for the substance to cause an adverse
effect in humans from toxicity information
drawn from experiments conducted on non-
human mammals, such as the rat, mouse, rabbit,
guinea pig, hamster, dog, or monkey. The
inference that humans and animals (mammals)
are similar, on average, in intrinsic susceptibility
to toxic chemicals and that data from animals
can in many cases be used as a surrogate for data
from humans is the basic premise of modern
toxicology. This concept is particularly
important in the regulation of toxic chemicals.
There are occasions, however, in which
observations in animals may be of uncertain
relevance to humans. EPA considers the
likelihood that the agent will have adverse
effects in humans to increase as similar results
are observed across sexes, strains, species, and
routes of exposure in animal studies.
7.1.3 SUPPORTING DATA
Several other types of studies used to
support conclusions about the likelihood of
occurrence of adverse health effects in humans
are described below. At the present time, EPA
considers all of these types of data to be
supportive, not definitive, in assessing the
potential for adverse health effects in humans.
Metabolic and other pharmacokinetic studies
may be used to provide insights into the
mechanism of action of a particular compound.
By comparing the metabolism of a compound
exhibiting a toxic effect in an animal with the
corresponding metabolism in humans, evidence
for the potential of the compound to have toxic
effects in humans may be obtained.
Studies using cell cultures or
microorganisms may be used to provide insights
into a compound's potential for biological activity.
For example, tests for point mutations, numerical
and structural chromosome aberrations, DNA
damage/repair, and cell transformation may
provide supportive evidence of carcinogenicity
and may give information on potential
mechanisms of carcinogenicity. It should be
noted, however, that lack of positive results in
short-term tests for genotoxicity is not
considered a basis for discounting positive
results in long-term carcinogenicity studies in
animals.
Structure-activity studies (i.e., predictions
of toxicologic activity based on analysis of
chemical structure) are another potential source
of supporting data. Under certain circumstances,
the known activity of one compound may be
used to estimate the activity of another
structurally related compound for which specific
data are lacking.
7.2 TOXICITY ASSESSMENT FOR
NONCARCINOGENIC EFFECTS
This section summarizes how the types of
toxicity information presented in Section 7.1 are
considered in the toxicity assessment for
noncarcinogenic effects. A reference dose, or
RfD, is the toxicity value used most often in
evaluating noncarcinogenic effects resulting
from exposures at Superfund sites. Additionally,
One-day or Ten-day Health Advisories (HAs)
may be used to evaluate short-term oral
exposures. The methods EPA uses for
developing RfDs and HAs are described below.
Various types of RfDs are available depending
on the exposure route (oral or inhalation), the
critical effect (developmental or other), and the
length of exposure being evaluated (chronic,
subchronic, or single event). This section is
intended to be a summary description only; for
additional details, refer to the appropriate
guidelines and other sources listed as references
for this chapter (especially EPA 1986b, EPA
1989b-f).
Comment [A38]: The Superfund Program has
updated its inhalation risk paradigm to be
compatible with the Agency's current
methodology for inhalation dosimetry and
derivation of inhalation toxicity values. EPA no
longer recommends the use of inhalation RfDs.
Please consult Chapter 2 of EPA’s
Risk
Assessment Guidance for Superfund Volume I:
Human Health Evaluation Manual Part F,
Supplemental Guidance for Inhalation Risk
Assessment
for current background on
derivation of the inhalation toxicity values used
in risk assessments of inhaled contaminants.
RAGS Part F may be found at:
http://www.epa.gov/oswer/riskassessment/rags
f/index.htm.

Page 7-6
A chronic RfD is defined as an estimate
(with uncertainty spanning perhaps an order of
magnitude or greater) of a daily exposure level
for the human population, including sensitive
subpopulations, that is likely to be without an
appreciable risk of deleterious effects during a
lifetime. Chronic RfDs are specifically
developed to be protective for long-term
exposure to a compound. As a guideline for
Superfund program risk assessments, chronic
RfDs generally should be used to evaluate the
potential noncarcinogenic effects associated
with exposure periods between 7 years
(approximately 10 percent of a human lifetime)
and a lifetime. Many chronic RfDs have been
reviewed and verified by an intra-Agency RfD
Workgroup and entered into the Agency's
Integrated Risk Information System (IRIS).
FORMER TERMINOLOGY
Prior to the development of RfDs,
noncarcinogenic effects of chronic exposures were
evaluated using values called acceptable daily intakes
(ADIs) or acceptable intakes for chronic exposure
(AICs). While ADIs and AICs are similar in concept to
RfDs, RfDs have been derived using a more strictly
defined methodology and represent the Agency's
preferred toxicity values. Furthermore, many chronic
RfDs have been reviewed and verified by an intra-
Agency RfD Workgroup; these verified RfDs represent
an Agency consensus and are preferred over other
RfDs that have not undergone such review (see Section
7.2.7, Verification of RfDs). Similarly, acceptable
intakes for subchronic exposures (AISs) have been
superseded by the more strictly defined subchronic
RfD values. Therefore, the former terminology (ADI,
AIC, AIS) should no longer be used in Superfund
program risk assessments.
More recently, EPA has begun developing
subchronic RfDs (RfD ss), which are useful for
characterizing potential noncarcinogenic effects
associated with shorter-term exposures, and
developmental RfDs (RfD dts), which are useful
specifically for assessing potential
developmental effects resulting from exposure to
a compound. As a guideline for Superfund
program risk assessments, subchronic RfDs
should be used to evaluate the potential
noncarcinogenic effects of exposure periods
between two weeks and seven years. Such short-
term exposures can result when a particular
activity is performed for a limited number of
years or when a chemical with a short half-life
degrades to negligible concentrations within
several months. Developmental RfDs are used to
evaluate the potential effects on a developing
organism following a single exposure event.
7.2.1 CONCEPT OF THRESHOLD
For many noncarcinogenic effects,
protective mechanisms are believed to exist that
must be overcome before the adverse effect is
manifested. For example, where a large number
of cells perform the same or similar function, the
cell population may have to be significantly
depleted before the effect is seen. As a result, a
range of exposures exists from zero to some
finite value that can be tolerated by the organism
with essentially no chance of expression of
adverse effects. In developing a toxicity value
for evaluating noncarcinogenic effects (i.e., an
RfD), the approach is to identify the upper
bound of this tolerance range (i.e., the maximum
subthreshold level). Because variability exists in
the human population, attempts are made to
identify a subthreshold level protective of
sensitive individuals in the population. For most
chemicals, this level can only be estimated; the
RfD incorporates uncertainty factors indicating
the degree or extrapolation used to derive the
estimated value. RfD summaries in IRIS also
contain a statement expressing the overall
confidence that the evaluators have in the RfD
(high, medium, or low). The RfD is generally
considered to have uncertainty spanning an
order of magnitude or more, and therefore the
RfD should not be viewed as a strict scientific
demarcation between what level is toxic and
nontoxic.
7.2.2 DERIVATION OF AN ORAL RFD
(RFD
O
)
Identifying the critical study and
determining the NOAEL. In the development
of oral RfDs, all available studies examining the
toxicity of a chemical following exposure by the
oral route are gathered and judged for scientific
merit. Occasionally, studies based on other
exposure routes (e.g., inhalation) are considered,
and the data are adjusted for application to the
oral route. Any differences between studies are
reconciled and an overall evaluation is reached.
If adequate human data are available, this
information is used as the basis of the RfD.
Otherwise, animal study data are used; in these
cases, a series of professional judgments are

made that involve, among other considerations,
an assessment of the relevance and scientific
quality of the experimental studies. If data from
several animal studies are being evaluated, EPA
first seeks to identify the animal model that is
most relevant to humans based on a defensible
biological rationale, for instance, using
comparative metabolic and pharmacokinetic
data. In the absence of a species that is clearly
the most relevant, EPA assumes that humans are
at least as sensitive to the substance as the most
sensitive animal species tested. Therefore, as a
matter of science policy, the study on the most
sensitive species (the species showing a toxic
effect at the lowest administered dose) is
selected as the critical study for the basis of the
RfD. The effect characterized by the "lowest-
observed- adverse-effect-level" (LOAEL) after
dosimetric conversions to adjust for species
differences is referred to as the critical toxic
effect.
After the critical study and toxic effect
have been selected, EPA identifies the
experimental exposure level representing the
highest level tested at which no adverse effects
(including the critical toxic effect) were
demonstrated. This highest "no-observed-
adverse-effect level" (NOAEL) is the key datum
obtained from the study of the dose-response
relationship. A NOAEL observed in an animal
study in which the exposure was intermittent
(such as five days per week) is adjusted to
reflect continuous exposure.
The NOAEL is selected based in part on the
assumption that if the critical toxic effect is
prevented, then all toxic effects are prevented.
The NOAEL for the critical toxic effect should
not be confused with the "no-observed-effect
level" (NOEL). The NOEL corresponds to the
exposure level at which no effect at all has been
observed; frequently, effects are observed that
MULTIPLE TOXIC EFFECTS AND RfDs
The RfD is developed from a NOAEL for the most
sensitive, or critical, toxic effect based in part on
the assumption that if the critical toxic effect is
prevented, then all toxic effects are prevented. It
should be remembered during the risk
characterization step of the risk assessment that if
exposure levels exceed the RfD, then adverse
effects in addition to the critical toxic effect may
begin to appear.
Page 7-7
are not considered to be of toxicological
significance. In some studies, only LOAEL
rather than a NOAEL is available. The use of a
LOAEL, however, requires the use of an
additional uncertainty factor (see below).
Applying uncertainty factors. The RfD is
derived from the NOAEL (or LOAEL) for the
critical toxic effect by consistent application of
uncertainty factors (UFs) and a modifying factor
(MF). The uncertainty factors generally consist
of multiples of 10 (although values less than 10
are sometimes used), with each factor
representing a specific area of uncertainty
inherent in the extrapolation from the available
data. The bases for application of different
uncertainty factors are explained below.
A UF of 10 is used to account for variation in
the general population and is intended to protect
sensitive subpopulations (e.g., elderly, children).
A UF of 10 is used when extrapolating from
animals to humans. This factor is intended to
account for the interspecies variability
between humans and other mammals.
A UF of 10 is used when a NOAEL derived
from a subchronic instead of a chronic study
is used as the basis for a chronic RfD.
A UF of 10 is used when a LOAEL is used
instead of a NOAEL. This factor is intended
to account for the uncertainty associated
with extrapolating from LOAELs to
NOAELs.
In addition to the UFs listed above, a modifying
factor (MF) is applied.
An MF ranging from >0 to 10 is included to
reflect a qualitative professional assessment
of additional uncertainties in the critical
study and in the entire data base for the
chemical not explicitly addressed by the
preceding uncertainty factors. The default
value for the MF is 1.
1
To calculate the RfD, the appropriate
NOAEL (or the LOAEL if a suitable NOAEL is
not available) is divided by the product of all of
the applicable uncertainty factors and the
modifying factor. That is:
RfD = NOAEL or LOAEL/(UF
1
x UF
2
... x MF)

Page 7-8
Oral RfDs typically are expressed as one
significant figure in units of mg/kg-day. These
concepts are shown graphically in EPA (1989g).
To date, most RfDs developed by EPA and
included in the sources listed in Section 7.4 are
based on administered doses, not absorbed doses
(see box on page 7-10).
7.2.3 DERIVATION OF AN INHALATION
RFD (RFD
I
)
The methods EPA uses in the derivation
of inhalation RfDs are similar in concept to
those used for oral RfDs; however, the actual
analysis of inhalation exposures is more
complex than oral exposures due to (1) the
dynamics of the respiratory system and its
diversity across species and (2) differences in
the physicochemical properties of contaminants.
Additional information can be found in EPA's
Interim Methods for Development of Inhalation
Reference Doses (EPA 1989d).
Identifying the critical study and determining
the NOAEL. Although in theory the
identification of the critical study and the
determination of the NOAEL is similar for oral
and inhalation exposures, several important
differences should be noted. In selecting the
most appropriate study, EPA considers
differences in respiratory anatomy and
physiology, as well as differences in the
physicochemical characteristics of the
contaminant. Differences in respiratory anatomy
and physiology may affect the pattern of
contaminant deposition in the respiratory tract,
and the clearance and redistribution of the agent.
Consequently, the different species may not
receive the same dose of the contaminant at the
same locations within the respiratory tract even
though both species were exposed to the same
particle or gas concentration. Differences in the
physicochemical characteristics of the
contaminants, such as the size and shape of a
particle or whether the contaminant is an aerosol
or a gas, also influence deposition, clearance,
and redistribution.
In inhalation exposures, the target tissue
may be a portion of the respiratory tract or, if the
contaminant can be absorbed and distributed
through the body, some extrarespiratory organ.
Because the pattern of deposition may influence
concentrations at the alveolar exchange
boundary or different tissues of the lung, the
toxic health effect observed may be more
directly related to the pattern of deposition than
to the exposure concentration. Consequently,
EPA considers the deposition, clearance
mechanisms, and the physicochemical properties
of the inhaled agent in determining the effective
dose delivered to the target organ.
Doses calculated in animals are converted to
equivalent doses in humans on the basis of
comparative physiological considerations (e.g.,
ventilatory parameters, regional lung surface
areas). Additionally, if the exposure period was
discontinuous, it is adjusted to reflect continuous
exposure.
Applying uncertainty factors. The
inhalation RfD is derived from the NOAEL by
applying uncertainty factors similar to those
listed above for oral RfDs. The UF of 10 is used
when extrapolating from animals to humans, in
addition to calculation of the human equivalent
dose, to account for interspecific variability in
sensitivity to the toxicant. The resulting RfD
value for inhalation exposure is generally
reported as a concentration in air (in mg/m
3
for
continuous, 24 hour/day exposure), although it
may be reported as a corresponding inhaled
intake (in mg/kg-day). A human body weight of
70 kg and an inhalation rate of 20 m
3
/day are
used to convert between an inhaled intake
expressed in units of mg/kg-day and a
concentration in air expressed in mg/m
3
.
7.2.4 DERIVATION OF A SUBCHRONIC RFD
(RFD
S
)
The chronic RfDs described above pertain
to lifetime or other long-term exposures and may
be overly protective if used to evaluate the
potential for adverse health effects resulting
from substantially less-than-lifetime exposures.
For such situations, EPA has begun calculating
toxicity values specifically for subchronic
exposure durations, using a method similar to
that outlined above for chronic RfDs. EPA's
Environmental Criteria and Assessment Office
develops subchronic RfDs and, although they
have been peer-reviewed by Agency and outside
reviewers, RfDs values have not undergone
verification by an intra-Agency workgroup (see
Comment [A39]: The Superfund Program has
updated its inhalation risk paradigm to be
compatible with the Agency's current
methodology for inhalation dosimetry and
derivation of inhalation toxicity values. EPA no
longer recommends the use of inhalation RfDs.
Please consult Chapter 2, Section 2.3 of EPA’s
Risk Assessment Guidance for Superfund
Volume I: Human Health Evaluation Manual
Part F, Supplemental Guidance for Inhalation
Risk Assessment
for current background on
derivation of the non-cancer inhalation toxicity
values used in risk assessments of inhaled
contaminants. RAGS Part F may be found at:
http://www.epa.gov/oswer/riskassessment/rags
f/index.htm.

Page 7-9
Section 7.2.7). As a result, subchronic RfDs are
considered interim rather than verified toxicity
values and are not placed in IRIS.
Development of subchronic reference
doses parallels the development of chronic
reference doses in concept; the distinction is one
of exposure duration. Appropriate studies are
evaluated and a subchronic NOAEL is
identified. The RfD
s is derived from the NOAEL
by the application of UFs and MF as outlined
above. When experimental data are available
only for shorter exposure durations than desired,
an additional uncertainty factor is applied. This
is similar to the application of the uncertainty
factor for duration differences when a chronic
RfD is estimated from subchronic animal data.
On the other hand, if subchronic data are
missing and a chronic oral RfD derived from
chronic data exists, the chronic oral RfD is
adopted as the subchronic oral RfD. There is no
application of an uncertainty factor to account
for differences in exposure duration in this
instance.
7.2.5 DERIVATION OF DEVELOPMENTAL
TOXICANT RFD (RFD
DT
)
In developing an RfD
dt
, evidence is
gathered regarding the potential of a substance
to cause adverse effects in a developing
organism as a result of exposure prior to
conception (either parent), during prenatal
development, or postnatally to the time of sexual
maturation. Adverse effects can include death,
structural abnormality, altered growth, and
functional deficiencies. Maternal toxicity also is
considered. The evidence is assessed, and the
substance is assigned a weight-of-evidence
designation according to the scheme outlined
below and summarized in the box in the
opposite column. In this scheme, three levels are
used to indicate the assessor's degree of
confidence in the data: definitive evidence,
adequate evidence, and inadequate evidence.
The definitive and adequate evidence categories
are subdivided as to whether the evidence
demonstrates the occurrence or the absence of
adverse effects.
WEIGHT-OF-EVIDENCE SCHEME FOR
DEVELOPMENTAL TOXICITY
Definitive Evidence for:
- Human Developmental Toxicity
- No Apparent Human
Developmental Toxicity
Adequate Evidence for:
- Potential Human Developmental
Toxicity
- No Apparent Potential Human
Developmental Toxicity
After the weight-of-evidence designation
is assigned, a study is selected for the
identification of a NOAEL. The NOAEL is
converted to an equivalent human dose, if
necessary, and divided by uncertainty factors
similar to those used in the development of an
oral RfD. It should be remembered that the
RfDdt is based on a short duration of exposure
because even a single exposure at a critical time
(e.g., during gestation) may be sufficient to
produce adverse developmental effects and that
chronic exposure is not a prerequisite for
developmental toxicity to be manifested.
Therefore, RfDdt values are appropriate for
evaluating single event exposures, which usually
are not adjusted based on the duration of
exposure. Additional information on the
derivation of RfDdt values is available in EPA's
Proposed Amendments to the Guidelines for the
Health Assessment of Suspect Developmental
Toxicants (EPA 1989e).
7.2.6 ONE-DAY AND TEN-DAY HEALTH
ADVISORIES
Reference values that may be useful for
evaluating potential adverse effects associated
with oral exposures of shorter duration have
been developed by the Office of Drinking
Water. These values are known as One-day and
Ten-day Health Advisories, which are issued as
nonregulatory guidance. Health Advisory values
are concentrations of contaminants in drinking
water at which adverse health effects would not

Page 7-10
be expected to occur for an exposure of the
specified duration. The Health Advisory values
are based on data describing noncarcinogenic
effects and are derived by dividing a NOAEL or
LOAEL by the appropriate uncertainty and
modifying factors. They are based on a 10-kg
child assumed to drink 1 liter of water per day,
and a margin of safety is included to protect
sensitive members of the population. One-day
and Ten-day Health Advisories do not consider
any carcinogenic risk associated with the
exposure even if the compound is a potential
carcinogen. For additional information on the
derivation of Health Advisory values, refer to
the Agency's guidance document (EPA 1989c).
7.2.7 VERIFICATION OF RfD
S
EPA has formed an RfD Workgroup
composed of members from many EPA offices
to verify existing Agency RfDs and to resolve
conflicting toxicity assessments and toxicity
values within the Agency. The Workgroup
reviews the information regarding the derivation
of an RfD for a substance and summarizes its
evaluations, conclusions, and reservations
regarding the RfD in a standardized summary
form from one to several pages in length. This
form contains information regarding the
development of the RfD, such as the chosen
effect levels and uncertainty factors, as well as a
statement on the confidence that the evaluators
ABSORBED VERSUS
ADMINISTERED DOSE
Toxicity values -- for both noncarcinogenic
and carcinogenic effects -- are generally
calculated from critical effect levels based on
administered rather than absorbed doses. It is
important, therefore, to compare such toxicity
values to exposure estimates expressed as intakes
(corresponding to administered doses), not as
absorbed doses. For the few toxicity values that
have been based on absorbed doses, either the
exposure estimate or the toxicity value should be
adjusted to make the values comparable (i.e.,
compare exposures estimated as absorbed doses to
toxicity values expressed as absorbed doses, and
exposures estimated as intakes to toxicity values
expressed as administered doses). See Appendix
A for guidance on making adjustments for
absorption efficiency.
have in the RfD itself, the critical study, and the
overall data base (high, medium, or low). Once
verified, these data evaluation summaries are
entered into IRIS and are available for public
access.
Workgroup-approved RfDs are referred to
as verified RfDs. Those RfDs awaiting
workgroup approval are referred to as interim
RfDs. At the time of this manual's publication,
only chronic RfDs are being verified. No
workgroup has been established to verify
subchronic RfDs or developmental RfDs.
7.3 TOXICITY ASSESSMENT FOR
CARCINOGENIC EFFECTS
This section describes how the types of
toxicity information presented in Section 7.1 are
considered in the toxicity assessment for
carcinogenic effects. A slope factor and the
accompanying weight-of evidence determination
are the toxicity data most commonly used to
evaluate potential human carcinogenic risks. The
methods EPA uses to derive these values are
outlined below. Additional information can be
obtained by consulting EPA's Guidelines for
Carcinogen Risk Assessment (EPA 1986a) and
Appendix B to IRIS (EPA 1989a).
7.3.1 CONCEPT OF NONTHRESHOLD
EFFECTS
Carcinogenesis, unlike many
noncarcinogenic health effects, is generally
thought to be a phenomenon for which risk
evaluation based on presumption of a threshold
isinappropriate.
Comment [A40]: ABSORBED VERSUS
ADMINISTERED DOSE
Toxicity values -- for both noncarcinogenic and
carcinogenic effects -- are generally calculated from
critical effect levels based on administered rather
than absorbed doses. It is important, therefore, to
compare such toxicity values to exposure estimates
expressed as intakes (corresponding to administered
doses), not as absorbed doses. For the few toxicity
values that have been based on absorbed doses,
either the exposure estimate or the toxicity value
should be adjusted to make the values comparable
(i.e., compare exposures estimated as absorbed doses
to toxicity values expressed as absorbed doses, and
exposures estimated as intakes to toxicity values
expressed as administered doses). See Appendix A
for guidance on making adjustments for absorption
efficiency.

Page 7-11
For carcinogens, EPA assumes that a
small number of molecular events can evoke
changes in a single cell that can lead to
uncontrolled cellular proliferation and
eventually to a clinical state of disease. This
hypothesized mechanism for carcinogenesis is
referred to as "nonthreshold" because there is
believed to be essentially no level of exposure to
such a chemical that does not pose a finite
probability, however small, of generating a
carcinogenic response. That is, no dose is
thought to be risk-free. Therefore, in evaluating
cancer risks, an effect threshold cannot be
estimated. For carcinogenic effects, EPA uses a
two-part evaluation in which the substance first
is assigned a weight-of-evidence classification,
and then a slope factor is calculated.
7.3.2 ASSIGNING A WEIGHT OF EVIDENCE
In the first step of the evaluation, the
available data are evaluated to determine the
likelihood that the agent is a human carcinogen.
The evidence is characterized separately for
human studies and animal studies as sufficient,
limited, inadequate, no data, or evidence of no
effect. The characterizations of these two types
of data are combined, and based on the extent to
which the agent has been shown to be a
carcinogen in experimental animals or humans,
or both, the agent is given a provisional weight-
of-evidence classification. EPA scientists then
adjust the provisional classification upward or
downward, based on other supporting evidence
of carcinogenicity (see Section 7.1.3). For a
further description of the role of supporting
evidence, see the EPA guidelines (EPA 1986a).
The EPA classification system
for
weight
of evidence is shown in the box in
the opposite
column. This system is
adapted from
the
approach taken by
the International Agency
for
Research on Cancer (IARC 1982).
7.3.3 GENERATING A SLOPE FACTOR
2
Comment [A41]: THE SUPERFUND PROGRAM
HAS UPDATED ITS INHALATION RISK
PARADIGM TO BE COMPATIBLE WITH THE
AGENCY'S CURRENT METHODOLOGY FOR
INHALATION DOSIMETRY AND DERIVATION OF
INHALATION TOXICITY VALUES. FOR
UPDATED INFORMATION ON THE DERIVATION
OF INHALATION UNIT RISKS, PLEASE
CONSULT CHAPTER 2 OF EPA’S
Risk
Assessment Guidance for Superfund Volume I:
Human Health Evaluation Manual (Part F,
Supplemental Guidance for Inhalation Risk
Assessment)
for current background on
derivation of the inhalation toxicity values used
in risk assessments of inhaled contaminants.
RAGS, Part F may be found at:
http://www.epa.gov/oswer/riskassessment/rags
f/index.htm.
Comment [A42]: EPA has developed
additional information to consider in selecting
cancer toxicity factors addressing a number of
issues pertaining to cancer risks associated with
early-life exposures, including specific guidance
on potency adjustments for carcinogens acting
through a mutagenic mode of action. This
Information is available in EPA’s
Handbook for
Implementing the Supplemental Guidance at
Waste and Cleanup Sites
:
http://epa.gov/oswer/riskassessment/sghandbo
ok/chemicals.htm
In the second part of the evaluation,
based on the evaluation that the chemical is a
known or probable human carcinogen, a toxicity
value that defines quantitatively the relationship
between dose and response (i.e., the slope
factor) is calculated. Slope factors are typically
calculated for potential carcinogens in classes A,
B1, and B2. Quantitative estimation of slope
factors for the chemicals in class C proceeds on
a case-by-case basis.
Generally, the slope factor is a plausible
upper-bound estimate of the probability of a
response per unit intake of a chemical over a
lifetime. The slope factor is used in risk
assessments to estimate an upper-bound lifetime
probability of an individual developing cancer as
a result of exposure to a particular level of a
potential carcinogen. Slope factors should
always be accompanied by the weight-of-
evidence classification to indicate the strength of
the evidence that the agent is a human
carcinogen.
Identifying the appropriate data set. In
deriving slope factors, the available information
about a chemical is evaluated and an appropriate
EPA WEIGHT-OF-EVIDENCE
CLASSIFICATION SYSTEM FOR
CARCINOGENICITY
Group Description
A Human carcinogen
B1 or Probable human carcinogen
B2
B1 indicates that limited human data are
available.
B2 indicates sufficient evidence in animals
and
inadequate or no evidence in humans.
C Possible human carcinogen
D Not classifiable as to human carcinogenicity
E Evidence of noncarcinogenicity for humans
data set is selected. In choosing appropriate data
sets, human data of high quality are preferable to
animal data. If animal data are used, the species
that responds most similarly to humans (with
respect to factors such as metabolism,
physiology, and pharmacokinetics) is preferred.
Comment [A43]: In its 2005
Guidelines for
Carcinogen Risk Assessment
, EPA has replaced
the Alphanumeric Classification shown in this
text box with a weight of evidence that lays out
a summary of the key evidence, describes the
agent's mode of action, characterizes the
conditions of hazard expression, and
recommends appropriate dose response
approach(es). The overall conclusion as to the
likelihood of human carcinogenicity is presented
according to the following five recommended
standard hazard descriptors: “
Carcinogenic to
Humans
,” “
Likely to Be Carcinogenic to
Humans
,” “
Suggestive Evidence of Carcinogenic
Potential
,” “
Inadequate Information to Assess
Carcinogenic Potential
,” and “
Not Likely to Be
Carcinogenic to Humans
.” The
Guidelines for
Carcinogen Risk Assessment
may be found at:
http://cfpub.epa.gov/ncea/cfm/recordisplay.cfm
?deid=116283

Page 7-12
When no clear choice is possible, the most
sensitive species is given the greatest emphasis.
Occasionally, in situations where no single study
is judged most appropriate, yet several studies
collectively support the estimate, the geometric
mean of estimates from all studies may be
adopted as the slope. This practice ensures the
inclusion of all relevant data.
Extrapolating to lower doses. Because
risk at low exposure levels is difficult to
measure directly either by animal experiments or
by epidemiologic studies, the development of a
slope factor generally entails applying a model
to the available data set and using the model to
extrapolate from the relatively high doses
administered to experimental animals (or the
exposures noted in epidemiologic studies) to the
lower exposure levels expected for human
contact in the environment.
A number of mathematical models and
procedures have been developed to extrapolate
from carcinogenic responses observed at high
doses to responses expected at low doses.
Different extrapolation methods may provide a
reasonable fit to the observed data but may lead
to large differences in the projected risk at low
doses. In keeping with EPA's Guidelines for
Carcinogen Risk Assessment (EPA 1986a) and
the principles outlined in Chemical
Carcinogens: A Review of the Science and Its
Associated Principles (OSTP 1985), the choice
of a low-dose extrapolation model is governed
by consistency with current understanding of the
mechanism of carcinogenesis, and not solely on
goodness-of-fit to the observed tumor data.
When data are limited and when uncertainty
exists regarding the mechanisms of carcinogenic
action, the EPA guidelines and OSTP principles
suggest that models or procedures that
incorporate low-dose linearity are preferred
when compatible with the limited information
available. EPA's guidelines recommend that the
linearized multistage model be employed in the
absence of adequate information to the contrary.
Among the other models available are the
Weibull, probit, logit, one-hit, and gamma
multihit models, as well as various time-to-
tumor models. Most of these models are less
conservative (i.e., predict lower cancer potency)
than the linearized multistage model. These
concepts and models are shown graphically in
EPA (1989g) and OTA (1981).
In general, after the data are fit to the
appropriate model, the upper 95th percent
confidence limit of the slope of the resulting
dose-response curve is calculated. This value is
known as the slope factor and represents an
upper 95th percent confidence limit on the
probability of a response per unit intake of a
chemical over a lifetime (i.e., there is only a 5
percent chance that the probability of a response
could be greater than the estimated value on the
basis of the experimental data and model used).
In some cases, slope factors based on human
dose-response data are based on the "best"
estimate instead of the upper 95th percent
confidence limits. Because the dose-response
curve generally is linear only in the low-dose
region, the slope factor estimate only holds true
for low doses. Information concerning the
limitations on use of slope factors can be found
in IRIS.
Determining equivalent human doses.
When animal data are used as a basis for
extrapolation, the human dose that is equivalent
to the dose in the animal study is calculated
using the assumption that different species are
equally sensitive to the effects of a toxicant if
they absorb the same amount of the agent (in
milligrams) per unit of body surface area. This
assumption is made only in the absence of
specific information about the equivalent doses
for the chemical in question. Because surface
area is approximately proportional to the 2/3
power of body weight, the equivalent human
dose (in mg/day, or other units of mass per unit
time) is calculated by multiplying the animal
dose (in identical units) by the ratio of human to
animal body weights raised to the 2/3 power.
(For animal doses expressed as mg/kgday, the
equivalent human dose, in the same units, is
calculated by multiplying the animal dose by the
ratio of animal to human body weights raised to
the 1/3 power.)
When using animal inhalation experiments to
estimate lifetime human risks for partially
soluble vapors or gases, the air concentration
(ppm) is generally considered to be the
equivalent dose between species based on
equivalent exposure times (measured as
fractions of a lifetime). For inhalation of
particulates or completely absorbed gases, the
amount absorbed per unit of body surface area is
Comment [A44]: The Superfund Program has
updated its inhalation risk paradigm to be
compatible with the Agency's current
methodology for inhalation dosimetry and
derivation of inhalation toxicity values. For
updated information on the derivation of
inhalation unit risks, please consult Chapter 2,
Section 2.1 of EPA’s
Risk Assessment Guidance
for Superfund Volume I: Human Health
Evaluation Manual Part F, Supplemental
Guidance for Inhalation Risk Assessment
for
current background on determining equivalent
human doses for use in deriving toxicity values
used in risk assessments of inhaled
contaminants. RAGS, Part F may be found at:
http://www.epa.gov/oswer/riskassessment/rags
f/index.htm.

Page 7-13
considered to be the equivalent dose between
species.
Summary of dose-response parameters.
Toxicity values for carcinogenic effects can be
expressed in several ways. The slope factor is
usually, but not always, the upper 95th percent
confidence limit of the slope of the dose-
response curve and is expressed as (mg/kg-day)
-
1
. If the extrapolation model selected is the
linearized multistage model, this value is also
known as the q1
*
. That is:
Slope factor = risk per unit dose
= risk per mg/kg-day
Where data permit, slope factors listed in IRIS
are based on absorbed doses, although to date
many of them have been based on administered
doses. (The qualifiers related to absorbed versus
administered dose given in the box on page 7-10
apply to assessment of cancer risk as well as to
assessment of potential noncarcinogenic effects.)
also can
be expressed in terms of risk per unit
concentration of the substance in the medium
where human contact occurs. These measures,
called unit risks, are calculated by dividing the
slope factor by 70 kg and multiplying by the
inhalation rate (20 m
3
/day) or the water
consumption rate (2 liters/day), respectively, for
risk associated with unit concentration in air or
water. Where an absorption fraction less than 1.0
has been applied in deriving the slope factor, an
additional conversion factor is necessary in the
calculation of unit risk so that the unit risk will
be on an administered dose basis. The
standardized duration assumption for unit risks
is understood to be continuous lifetime
exposure. Hence, when there is no absorption
conversion required:
air unit risk = risk per μg/m
3
= slope factor x 1/70 kg x
20m
3
/day x 10
–3
water unit risk = risk per μg/L
= slope factor x 1/70 kg x
2L/day x 10
-3
The multiplication by 10
-3
is necessary
to convert from mg (the slope factor, or q1
*
, is
given in (mg/kg day)
–1
) to μg (the unit risk is
given in (μg/m
3
)
–1
or (μg/L)
–1
).
Comment [A45]: The Superfund Program has
updated its inhalation risk paradigm to be
compatible with the Agency's current
methodology for inhalation dosimetry and
derivation of inhalation toxicity values. For
updated information on the derivation of
inhalation unit risks, please consult Chapter 2,
Section 2.2 of EPA’s
Risk Assessment Guidance
for Superfund Volume I: Human Health
Evaluation Manual Part F, Supplemental
Guidance for Inhalation Risk Assessment
for
current background on derivation of the
inhalation unit risk values used in risk
assessments of inhaled contaminants. RAGS,
Part F may be found at
http://www.epa.gov/oswer/riskassessment/rags
f/index.htm.
7.3.4 VERIFICATION OF SLOPE FACTORS
EPA formed the Carcinogen Risk
Assessment Verification Endeavor (CRAVE)
Workgroup to validate Agency carcinogen risk
assessments and resolve conflicting toxicity
values developed by various program offices.
Workgroup members represent many different
EPA offices and are scientists experienced in
issues related to both the qualitative and
quantitative risk assessment of carcinogenic
agents. Slope factors verified by CRAVE have
undergone extensive peer review and represent
an Agency consensus. CRAVE-verified review
summaries (similar to RfD Workgroup
summaries) are entered into the IRIS data base.
7.4 IDENTIFYING APPROPRIATE
TOXICITY VALUES FOR SITE RISK
ASSESSMENT
Toxicity values for carcinogenic effects
Comment [A46]: The Superfund Program has
updated the toxicity value source hierarchy
presented in Section 7.4 of RAGS Part A. The
current recommended hierarchy is described in
a December 5, 2003 policy memorandum titled
“Human Health Toxicity Values in Superfund
Risk Assessments,” (OSWER Directive 9285.7-
53). For additional details, please consult the
memorandum at:
http://www.epa.gov/oswer/riskassessment/pdf/
hhmemo.pdf
Using the methods outlined above, EPA
has performed toxicity assessments for many
chemicals found at Superfund sites and has
made the results available for use. This section
provides step-by-step methods for locating
appropriate toxicity information, including
numerical toxicity values, to be used in
Superfund risk assessments. Because one's
confidence in toxicity values depends heavily on
the data base and the methods of extrapolation
used in their development, guidance is also
included for identifying the important
information on which these values are based.
7.4.1 GATHER TOXICITY INFORMATION
FOR CHEMICALS BEING
EVALUATED
In the first step of the toxicity assessment,
information is collected regarding the toxic
effects that occur following exposure to the
chemical being evaluated. Particular attention
should be paid to the route of exposure, the
frequency and length of exposure, and the doses
at which the adverse effects are expected to
occur. Chemicals having potential reproductive
or developmental effects should be flagged.
Later in the evaluation, special reference doses

Page 7-14
for developmental effects can be sought for
these chemicals.
Several sources may provide useful
toxicity information and references to primary
literature, although only some of them should be
used as sources for slope factors and reference
doses (as explained below).
Integrated Risk Information System
(IRIS).
3
IRIS is an EPA data base containing up-
to-date health risk and EPA regulatory
information for numerous chemicals. IRIS
contains only those RfDs and slope factors that
have been verified by the RfD or CRAVE
Workgroups and consequently, is considered to
be the preferred source of toxicity information.
Information in IRIS supersedes all other sources.
Only if information is not available in IRIS for
the chemical being evaluated should the sources
below be consulted. IRIS consists of a collection
of computer files on individual chemicals.
Existing information on the chemicals is updated
as new scientific data are reviewed. New files
and new chemicals are added as information
becomes available. These chemical files contain
descriptive and quantitative information in the
following categories:
oral and inhalation chronic reference
doses;
oral and inhalation slope factors and unit
risks for chronic exposure to
carcinogens;
Health Advisories from EPA's Office of
Drinking Water;
EPA regulatory action summaries; and
supplemental data on acute health
hazards and physical/chemical
properties.
To ensure access to the most up-to-date
chemical information, IRIS is only available on-
line. For information on how to access this data
base, call IRIS User Support at 513-569-7254 or
see the Federal Register notice regarding the
availability of IRIS (EPA 1988a).
Should EPA regional staff have specific
technical or scientific questions about any
verification workgroup's analysis of particular
data cited in IRIS, the Agency contact for a
particular chemical (identified at the end of each
IRIS file) should be consulted. If new data are
identified suggesting that existing IRIS
information may be outdated, or if there is
concern or disagreement about the overall
findings of particular files, the Agency IRIS
coordinator should be consulted. The IRIS
coordinator can assist in making arrangements
should discussions with a verification
workgroup be needed.
Health Effects Assessment Summary Tables
(HEAST). Formerly "The Quarterly" and
associated references, HEAST is a tabular
presentation of toxicity information and values
for chemicals for which Health Effects
Assessments (HEAs), Health and Environmental
Effects Documents (HEEDs), Health and
Environmental Effects Profiles (HEEPs), Health
Assessment Documents (HADs), or Ambient
Air Quality Criteria Documents (AAQCDs)
have been prepared. HEAST summarizes
interim (and some verified) RfDs and slope
factors as well as other toxicity information for
specific chemicals. In addition, HEAST directs
readers to the most current sources of supporting
toxicity information through an extensive
reference section. Therefore, HEAST is
especially helpful when verified information for
a chemical is not in IRIS. HEAST, which is
updated quarterly, also provides a valuable
pointer system for identifying current references
on chemicals that are not in IRIS.
HEAST can be obtained upon request from the
Superfund Docket (FTS or 202-382-3046). The
Docket will mail copies of HEAST to callers
and place requestors on a mailing list to receive
an updated version quarterly. HEAs, HEEDs,
HEEPs, HADs, and AAQCDs referenced in
HEAST are available through EPA's Center for
Environmental Research Information (CERI) in
Cincinnati, OH (513569-7562 or FTS 684-7562)
or the National Technical Information Service
(NTIS), 5285 Port Royal Road, Springfield, VA
22161 (703-487-4650 or 800-3364700).
EPA criteria documents. These documents
include drinking water criteria documents,
Comment [A47]: The Superfund Program has
updated the toxicity value source hierarchy
presented in Section 7.4 of RAGS Part A. The
current recommended hierarchy is described in
a December 5, 2003 policy memorandum titled
“Human Health Toxicity Values in Superfund
Risk Assessments,” (OSWER Directive 9285.7-
53). For additional details, please consult the
memorandum at:
http://www.epa.gov/oswer/riskassessment/pdf/
hhmemo.pdf
Comment [A48]: The Superfund Program has
updated the toxicity value source hierarchy
presented in RAGS Part A. The current
recommended hierarchy is described in a
December 5, 2003 policy memorandum titled
“Human Health Toxicity Values in Superfund
Risk Assessments,” (OSWER Directive 9285.7-
53). For additional details, please consult the
memorandum at:
http://www.epa.gov/oswer/riskassessment/pdf/
hhmemo.pdf

Page 7-15
Because toxicity information may change rapidly and quickly become outdated, care should be taken to
find the most recent information available. IRIS is updated monthly, provides verified RfDs and slope factors, and
is the Agency's preferred source of toxicity information. Only if values are unavailable in IRIS should other
information sources be consulted.
HEAST is the second most current source of toxicity information of importance
to Superfund. Unlike IRIS,
HEAST provides informatio
n regarding interim as well as verified RfDs and slope factors. Readers are directed to
supporting toxicity information for interim and verified values in an extensive reference section of HEAST.
HEAST information should only be sought for those chemicals not listed in IRIS.
Toxicity information, RfDs, and slope factors also can be found in other EPA documents. Although these
values w
ere developed by offi
ces within the
Agency,
they have not necessarily been verified by the RfD or
CRAVE Workgroups. The use of up-t
o-date verified information is preferred to the use of interim information and,
therefore,
toxicity information should be obtained from other EPA references only if information could not be
found in IRIS or HEAST. Before using references other than those cited in IRIS or HEAST,
check with
ECAO at
513-569-7300 (FTS 684-7300) to see if more current information is available.
HIERARCHY OF TOXICITY INFORMATION
drinking water Health Advisory summaries,
ambient water quality criteria d ocuments, and air
quality criteria documents, and contain general
toxicity information that can be used if
information for a chemical is not available
through IRIS or the HEAST references. Criteria
documents are available through NTIS at the
address given above.
Information on drin
king
water criteria documents can be obtained
through the Safe
Drinking Water Hotline (800-
426-4791).
Agency for Toxic Substances and Disease
Registry (ATSDR) toxicological profiles.
ATSDR is developing
toxicological profiles for
275 hazardous substances found at Superfund
sites. The first 200 substances to be addressed
have been id
entified in
Federal Register notices
(EPA 1987, 1988b). These profiles contain
general toxicity information and levels of
exposure
associated with lethality, cancer,
genotoxicity, neurotoxicity, developmental and
reproductive toxicity, immunotoxicity, and
systemic toxicity (i.e., hepatic, renal, respiratory,
cardiovascular, gastrointestinal, hematological,
musculoskeletal, and dermal/ocular effects).
Health
effects i
n humans and animals are
discussed by exposure
route
(i.e., oral,
inhalation, and dermal) and duration (i.e., acute,
intermediate,
and chronic).
Also included in the
profiles are chapters on physicochemical
properties,
environmental fate, potential for
human exposure, analytical
methods, and
regulatory and advisory status. Contact NTIS at
the address given on the previous page
for
Comment [A49]: The Superfund Program has
updated the toxicity value source hierarchy
presented in Section 7.4 of RAGS Part A. The
current recommended hierarchy is described in
a December 5, 2003 policy memorandum titled
“Human Health Toxicity Values in Superfund
Risk Assessments,” (OSWER Directive 9285.7-
53). For additional details, please consult the
memorandum at:
http://www.epa.gov/oswer/riskassessment/pdf/
hhmemo.pdf
For further assistance in
selecting appropriate
toxicity values,
contact the Superfund Health
Risk Technical Support Center.
further inf
ormation on the status or availability
of a particular profile.
EPA's Environmental Criteria
and
Assessment Office (ECAO). ECAO may be
contacted at 513569-7300 (FTS 684-7300) for
general toxicological information as well as
for
technical guidance concerning route-to-route
extrapolations, toxicity values
for de
rmal
exposures, and the evaluation of
chemicals
without toxicity
values. The requestor should
identify their need for a "rapid response
request"
(within 48 hours) for interim guidance on
Superfund health-related issues. Contractors
must give the name an
d address of their RPM or
regional risk assessment contact before ECAO
will respond. RPMs and
regional contacts will
be sent a copy of
ECAO's response to the
contractor.
Open literature. A primary literature search
may be valuable for determining whether new data
are available
that may affect IRIS information.
7.4.2 DETERMINE TOXICITY VALUES FOR
NONCARCINOGENIC EFFECTS
(RFDS)
After general toxicity information for the
chemicals of concern has been lo cated, the next
step is t o identify the appropriate toxicity values
to be used in evaluating n oncarcinogenic effects
associated with the specific exposures being
assessed. First, by referring to the exposure
information generated in Chapter 6, the
exposure

Page 7-16
periods for which toxicity values are necessary
and the exposure rou te for each chemical being
evaluated should be determined. The a ppropriate
toxicity values for the chemical for each
exposure duration and route of exposure can
then be identi fied using the sources listed above.
For Superfund risk assessments, chronic
RfDs should be iden
tified for evaluating
exposure
periods between seven
years and
a
lifetime, subchronic RfDs
for exposure
periods
between two weeks and seven years, and One-
or Ten-day
Health Advisories for oral exposure
periods of less than two weeks. According to
EPA (1988c), One-day Health Adviso
ries are
applicable to exposure periods as long as two
weeks. Developmental RfDs should be
identified for evaluating single exposure events
and other very short exposures (e.g., one day).
Note that for some substances a nd some
exposure situations, more than one of the
toxicity values listed above may be needed to
adequately
assess potential noncarcinogenic
effects.
Because carcinogens also commonly
evoke noncarcinogenic effects, RfDs should be
sought for all chemicals being carried through
the risk assessment, including carcinogens. The
RfDs derived for
carcinogens,
however, are
based on noncancer effects and should not be
assumed
to be
protective against
carcinogenicity. A sample format for
summarizing RfDs and other toxicity values is
shown in Exhibit 7-2.
This
information will be
needed in the risk characterization step (see
Exhibits 8-3 and 8-4).
7.4.3 DETERMINE TOXICITY VALUES FOR
CARCINOGENIC EFFECTS (SLOPE
FACTORS)
Comment [A50]: The Superfund Program has
updated the toxicity value source hierarchy presented
in Section 7.4 of RAGS Part A. The current
recommended hierarchy is described in a December
5, 2003 policy memorandum titled “Human Health
Toxicity Values in Superfund Risk Assessments,”
(OSWER Directive 9285.7-53). For additional
details, please consult the memorandum at:
http://www.epa.gov/oswer/riskassessment/pdf/hhme
mo.pdf
For further assistance in selecting appropriate
toxicity values, contact the Superfund Health Risk
Technical Support Center.
In this step of the toxicity assessment,
appropriate toxicity values f or evaluating the
carcinogenic risks associated with exposure are
identified. First, by referring to the exposure
information generated in Chapter 6, the route of
exposure for the potential carcinogens being
evaluated should be identified. Slope factors for
these chemicals can then
be identified using
the
hierarchy of
sources
listed in the box on page
7-15. Slope factors for all potential carcinogens
having a weight-of-evidence classification of A,
B, or C should b
e sought. A notation o
f the EPA
weight-of-evidence
classification should always
be included
with the slope factor. A sample
format for summarizing the required toxicity
values is shown in Exhibit 7-3. This information
will be needed in the risk characterization step
(see Exhibit 8-2).
7.5 EVALUATING CHEMICALS FOR
WHICH NO TOXICITY VALUES
ARE AVAILABLE
If EPA-derived RfDs and slope factors are
available for the chemicals being examined,
these values should always be u
sed in the risk
assessment. Use of EPA-derived toxicity
values
prevents duplication of effort and ensures
consistency
among risk assessments. If EPA-
derived toxicity values are not available, the
following measures
are recommended.
7.5.1 ROUTE-TO-ROUTE EXTRAPOLATION
Comment [A51]: The Superfund Program has
updated its inhalation risk paradigm and
provides revised information concerning how to
address inhaled contaminants that lack
inhalation-based toxicity values. Please consult
Chapter 4, Section 4.2 of EPA’s
Risk Assessment
Guidance for Superfund Volume I: Human
Health Evaluation Manual Part F, Supplemental
Guidance for Inhalation Risk Assessment
for
current recommendations regarding exposure
assessments for inhaled contaminants. RAGS,
Part F may be found at:
http://www.epa.gov/oswer/riskassessment/rags
f/index.htm
For cases in which EPA-derived toxicity
values are not available for the route of exposure
being considered but are availa ble for another
route, EPA recommends contacting ECAO for
guidance on route-to-route extrapolation. If
toxicity information is not available from
ECAO, a qualitative rather
than quantitative
evaluation
of the chemical is recommended.
The
implications of
the absence of this chemical
from the risk estimate should be d
iscussed in the
uncertainty section.
7.5.2 DERMAL EXPOSURE
Comment [A52]: EPA has supplemented the
general guidance for evaluating dermal
exposure provided in RAGS Part A . Updated
procedures for deriving toxicity factors to
characterize risk from the dermal exposure
pathway may be found in found in
Risk
Assessment Guide for Superfund, Part E
Supplemental Guidance for Dermal Risk
Assessment.
Please consult Sections 4.2 and
4.3 for a description of these procedures for
adjusting oral toxicity factors by calculating
absorbed toxicity values that can be used to
characterize risk from the dermal exposure
pathway. RAGS Part E may be found at:
http://epa.gov/oswer/riskassessment/ragse/ind
ex.htm
No RfDs or slope factors are available for
the dermal route of exposure. In some cases,
however, noncarcinogenic or carcinogenic risks
associated with dermal exposure can be
evaluated using an oral RfD or oral slope factor,
respectively. EPA recommends contacting
ECAO for guidance on appropriate methods f
or
evaluating
dermal exposure for specific
chemicals; some general guidance for
calculating intakes via the dermal route and
making appropriate comparisons with oral RfD
values is given in Appendix A. In brief,
exposures via the dermal route generally are
calculated and expressed as absorbed doses.
These ab
sorbed doses are compared to an oral
toxicity value
that has been
adjusted, if

Page
7-17
necessary, so that it too is expressed as an
absorbed dose.
It is inappropriate to use the oral slope
factor to evaluate the risks associated with
dermal exposure to carcinogens such as
benz(a)pyrene, which cause skin cancer through
a direct action at the point of application. These
types of skin carcinogens and other locally
active compounds must be evaluated separately
from the above method; consult ECAO for
guidance. Generally only a qualitative
assessment of risks from dermal exposure to
these chemicals is possible. This does not apply
to carcinogens such as arsenic, which are
believed to cause skin cancer through a systemic
rather than local action.
If information is not available from
ECAO, the assessor should describe the effects
of the chemical qualitatively and discuss the
implications of the absence of the chemical from
the risk estimate in the uncertainty section of the
risk assessment.
7.5.3 GENERATION OF TOXICITY VALUES
Comment [A53]: The Superfund Program has
updated the toxicity value source hierarchy
presented in Section 7.4 of RAGS Part A. The
current recommended hierarchy is described in
a December 5, 2003 policy memorandum titled
“Human Health Toxicity Values in Superfund
Risk Assessments,” (OSWER Directive 9285.7-
53). For additional details, please consult the
memorandum at:
http://www.epa.gov/oswer/riskassessment/pdf/
hhmemo.pdf
For further assistance in selecting appropriate
toxicity values, contact the Superfund Health
Risk Technical Support Center.
If EPA-derived toxicity values are
unavailable but adequate toxicity studies are
available, one may derive toxicity values using
Agency methodology. Any such derivation
should be done in conjunction with the regional
risk assessment contact, who will submit the
derivation to ECAO for approval. Contact with
ECAO should be established early in the process
to eliminate any duplication of effort because
ECAO may have information on the chemical
being evaluated.
7.6 UNCERTAINTIES RELATED TO
TOXICITY INFORMATION
Toxicity information for many of the
chemicals found at Superfund sites is often
limited. Consequently, there are varying degrees
of uncertainty associated with the toxicity values
calculated. Sources of uncertainty associated
with toxicity values may include:
using dose-response information from
effects observed at high doses to predict the
adverse health effects that may occur
following exposure to the low levels
expected from human contact with the
agent in the environment;
using dose-response information from
short-term exposure studies to predict the
effects of long-term exposures, and vice-
versa;
using dose-response information from
animal studies to predict effects in humans;
and
using dose-response information from
homogeneous animal populations or
healthy human populations to predict the
effects likely to be observed in the general
population consisting of individuals with a
wide range of sensitivities.
An understanding of the degree of
uncertainty associated with toxicity values is an
important part of interpreting and using those
values. Therefore, as part of the toxicity
assessment for Superfund sites, a discussion of
the strength of the evidence of the entire range
of principal and supporting studies should be
included. The degree of confidence ascribed to a
toxicity value is a function of both the quality of
the individual study from which it was derived
and the completeness of the supporting data
base. EPA-verified RfDs found in IRIS are
accompanied by a statement of the confidence
that the evaluators have in the RfD itself, the
critical study, and the overall data base. All
EPA-verified slope factors are accompanied by a
weight-ofevidence classification, which
indicates the likelihood that the agent is a human
carcinogen. The weight-of-evidence
classification is based on the completeness of the
evidence that the agent causes cancer in
experimental animals and humans. These
designations should be used as one basis for the
discussion of uncertainty.

Page 7-18
EXHIBIT 7-2
EXAMPLE OF TABLE FORMAT FOR
TOXICITY VALUES: POTENTIAL NONCARCINOGENIC EFFECTS
Comment [A54]: EPA’s
Risk Assessment
Guidance for Superfund Volume I: Human
Health Evaluation Manual (Part D, Standardized
Planning, Reporting, and Review of Superfund
Risk Assessments)
provides planning tables for
use during the risk assessment process
. See
Part D, Section 3.1.1 (page 3-8) for an overview
of using Planning Tables 5: Non-cancer Toxicity
Values. Also see Appendix A for the
downloadable Planning Table 5 templates and
instructions for completing these templates.
RAGS, Part D may be found at:
http://www.epa.gov/oswer/riskassessment/rags
d/index.htm

Page 7-19
EXHIBIT 7-3
EXAMPLE OF TABLE FORMAT FOR
TOXICITY VALUES: POTENTIAL CARCINOGENIC EFFECTS
Comment [A55]:
EPA’s Risk Assessment
Guidance for Superfund Volume I: Human
Health Evaluation Manual (Part D, Standardized
Planning, Reporting, and Review of Superfund
Risk Assessments)
provides planning tables for
use during the risk assessment process
. See
Part D, Section 3.1.1 (page 3-8) for an overview
of using Planning Table 6: Cancer Toxicity
Values. Also see Appendix A for the
downloadable Planning Table 6 templates and
instructions for completing these templates.
RAGS, Part D may be found at:
http://www.epa.gov/oswer/riskassessment/rags
d/index.htm

Page 7-20
The discussion of uncertainty also should
include an indication of the extent to which an
analysis of the results f rom different studies give
a consistent, plausible picture of toxicity. The
greater the strength of the evidence, the greater
one's confidence in the conclusions drawn. The
following factors add to the strength of the
evidence that the chemical poses a hazard to
humans and should be considered:
similar effects across species, strains,
sex, and ro
utes of exposure;
clear evidence of a dose-response
relationship;
a plausible relationship among d
ata on
metabolism, postulated
mechanism of
action, and the effect of concern (see
Section 7.1.3);
similar toxicity
exhibited by structurally
related compounds (see Section 7.1.3);
and
some link between the chemical and
evidence of the effect of concern in
humans (see Section 7.1.1).
High uncertainty (low confidence; low
strength of evidence) indicates t hat the toxicity
value might change if additional chronic toxicity
data become available. Low uncertainty (high
confidence) is an indication that a value is less
likely to change as more data become available,
because there is consistency among the toxic
responses observed in different species, sexes,
study designs, or in dose-response relationships.
The lower the uncertainty about toxicity values,
the more confidence a decision-maker can have
in the risk assessment results. Often, high
confidence is associated with values that
are
based on human
data for the exposure
route of
concern.
7.7 SUMMARIZATION AND
PRESENTATION OF THE
TOXICITY INFORMATION
Comment [A56]: EPA’s Risk Assessment
Guidance for Superfund Volume I: Human
Health Evaluation Manual (Part D, Standardized
Planning, Reporting, and Review of Superfund
Risk Assessments) provides planning tables for
use during the risk assessment process,
including the toxicity assessment
. See
Part D,
Section 3.1.1 (page 3-7) for an overview of
using Planning Tables 5 and 6: Non-Cancer and
Cancer Toxicity Data. Also see Appendix 1 for
the downloadable Planning Table templates and
instructions for completing the tables. RAGS,
Part D may be found at:
http://www.epa.gov/oswer/riskassessment/rags
d/index.htm
This
section discusses methods for
presenting toxicity
information in the risk
assessment document for the chemicals being
evaluated.
7.7.1 TOXICITY INFORMATION FOR THE
MAIN BODY OF THE TEXT
A short description of the toxic effects of
each chemical carried through the assessment in
nontechnical language should be prepared for
inclusion in the main body of the risk
assessment. Included in this description should
be information on the effects associated with
exposure
to the chemical and the
concentrations
at which the adverse effects are expected to
occur in humans. Toxicity values should be
accompanied
by a brief
description of the overall
data base and the particular study
from
which
the value was
derived. In addition, a
notation
should be
made of the
critical effect and any
uncertainty
factors used in the ca
lculation. For
any RfD
value
obtained from IRIS, a notation of
the degree of
confidence associated with the
determination should
also
be included.
To aid in
the risk characterization, it should be indicated if
absorption
efficiency was considered
and also
what
exposure averaging periods are appropriate
for
comparison with the value.
Summary tables of toxicity values for all
chemicals should be prepared for inclusion in
the main body of the risk assessment report.
RfDs in the
table should
be accompanied with
the uncertainty factors used in their derivation,
the confidence rating given in IRIS (if
applicable), and a notation of
the critical effect.
Slope factors should always be accompanied b
y
EPA's weight-of-evidence classification.
7.7.2 TOXICITY INFORMATION FOR
INCLUSION IN AN APPENDIX
If toxicity values were derived in
conjunction with the regional risk assessment
contact and ECAO for chemicals lacking EPA-
derived values, a technical
documentation/justification of the method o f
derivation should be prepared and included in

the appendix of the risk assessment report.
Included in this explanation should be a
description of the toxic effects of the chemical
such as information regarding the
noncarcinogenic, carcinogenic, mutagenic,
reproductive, and developmental effects of the
compound. Also presented should be brief
Page 7-21
descriptions (species, route of administration,
dosages, frequency of exposure, length of
exposure, and critical effect) of the studies from
which the values were derived as well as the
actual method of derivation. References for the
studies cited in the discussion should be
included.

Page 7-22
ENDNOTES FOR CHAPTER 7
1. The MF is set less than one for a small number of substances to account for nutritional essentiality.
2. The slope factor is occasionally referred to as a cancer potency factor; however, use of this terminology is not recommended.
3. The quantitative risk values and supporting information found in IRIS represent a consensus judgement of EPA's Reference
Dose Workgroup or Carcinogen Risk Assessment V erification Endeavor (CRAVE) Workgroup. These workgroups are
composed of scientists from EPA's program offices and the Office o f Research and Development. The concept of Agency-wide
consensus is one of the most valuable aspects of IRIS.

Page 7-23
REFERENCES FOR CHAPTER 7
Environmental Protection Agency (EPA). 1986a. Guidelines for Carcinogen Risk Assessment. 51 Federal Register 33992 (September 24,
1986).
Environmental Protection Agency (EPA). 1986b. Guidelines for the Health Assessment of Suspect Developmental Toxicants. 51 Federal
Register 34028 (September 24, 1986).
Environmental Protection Agency (EPA). 1987. First Priority List of Hazardous Substances That Will Be the Subject of Toxicological
Profiles. 52 Federal Register 12866 (April 17, 1987).
Environmental Protection Agency (EPA). 1988a. Availability of the Integrated Risk Information System (IRIS). 53 Federal Register
20162 (June 2, 1988).
Environmental Protection Agency (EPA). 1988b. Hazardous Substances Priority List, Toxicological Profiles; Second List. 53 Federal
Register 41280 (October 20, 1988).
Environmental Protection Agency (EPA). 1988c. Office of Drinking Water Health Advisories. Reviews of Environmental Contamination
and Toxicology 104.
Environmental Protection Agency (EPA). 1989a. EPA Approach for Assessing the Risk Associated with Exposure to Environmental
Carcinogens. Appendix B to the Integrated Risk Information System (IRIS).
Environmental Protection Agency (EPA). 1989b. General Quantitative Risk Assessment Guidelines for Noncancer Health Effects.
External Review Draft. Risk Assessment Forum Technical Panel on Risk Assessment Guidelines for Noncancer Health Effects.
ECAO-CIN 538.
Environmental Protection Agency (EPA). 1989c. Guidelines for Authors of EPA Office of Water Health Advisories for Drinking Water
Contaminants. Office of Drinking Water.
Environmental Protection Agency (EPA). 1989d. Interim Methods for Development of Inhalation Reference Doses. Environmental
Criteria and Assessment Office. EPA/600/8-88/066F.
Environmental Protection Agency (EPA). 1989e. Proposed Amendments to the Guidelines for the Health Assessment of Suspect
Developmental Toxicants. 54 Federal Register 9386 (March 6, 1989).
Environmental Protection Agency (EPA). 1989f. Reference Dose (RfD): Description and Use in Health Risk Assessments. Appendix A
to the Integrated Risk Information System (IRIS).
Environmental Protection Agency (EPA). 1989g. Guidance Manual for Assessing Human Health Risks from Chemically Contaminated
Fish and Shellfish. Office of Marine and Estuarine Protection. EPA/503/8-89/002.
International Agency for Research on Cancer (IARC). 1982. IARC Monographs on the Evaluation of the Carcinogenic Risk of
Chemicals to Humans. Supplement 4. Lyon, France.
National Academy of Sciences (NAS). 1983. Risk Assessment in the Federal Government: Managing the Process. National Academy
Press. Washington, D.C.
Office of Science and Technology Policy (OSTP). 1985. Chemical Carcinogens: A Review of the Science and Its Associated Principles.
50 Federal Register 10372 (March 14, 1985).
Office of Technology Assessment (OTA). 1981. Assessment of Technologies for Determining Cancer Risks from the Environment.
Congress of the United States. Washington, D.C.
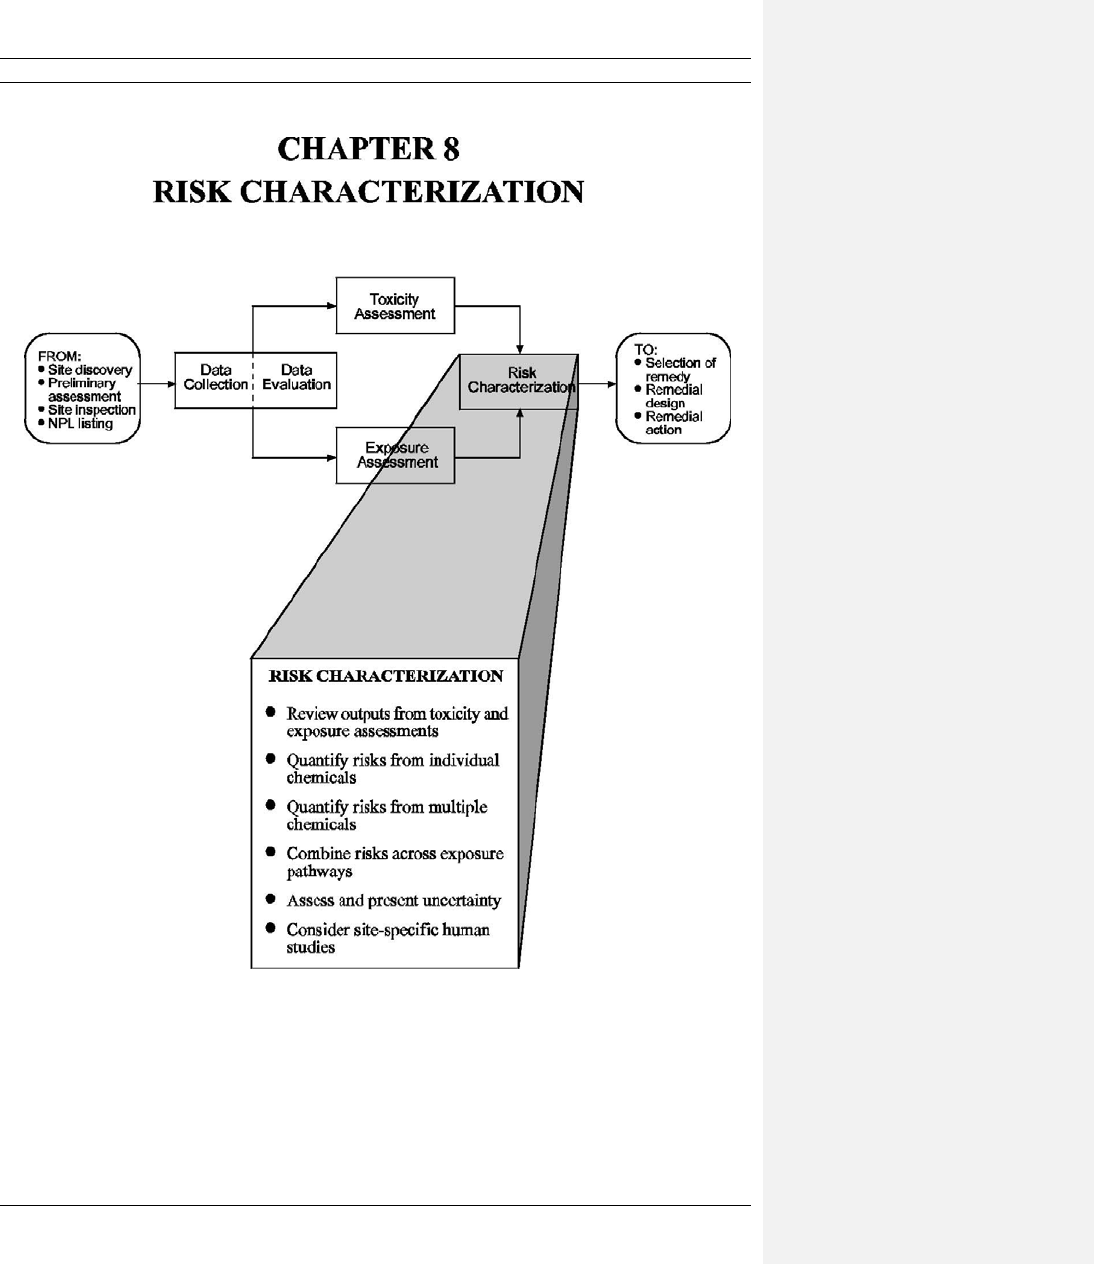

CHAPTER 8
RISK CHARACTERIZATION
Comment [A57]: EPA has developed
additional information concerning exposure and
risk assessment for lead and asbestos to
supplement the information presented in RAGS
Part A. This information is needed because
there are a number of unique scientific and
technical issues associated with the
investigation of human exposure and risk from
these contaminants. This information on lead
and asbestos at Superfund sites may be found
at:
http://www.epa.gov/superfund/health/contamin
ants/asbestos/
http://www.epa.gov/superfund/health/contamin
ants/lead/
This chapter describes the final step of the
baseline health risk assessment process, risk
characterization. In this step, the toxicity and
exposure assessments are summarized and
integrated into quantitative and qualitative
expressions of risk. To characterize potential
noncarcinogenic effects, comparisons are made
between projected intakes of substances and
toxicity values; to characterize potential
carcinogenic effects, probabilities that an
individual will develop cancer over a lifetime of
exposure are estimated from projected intakes
and chemical-specific dose-response information.
Major assumptions, scientific judgments, and to
the extent possible, estimates of the uncertainties
embodied in the assessment are also presented.
Risk characterization also serves as the
bridge between risk assessment and risk
management and is therefore a key step in the
ultimate site decision-making process. This step
assimilates risk assessment information for the
risk manager (RPM or regional upper
management involved in site decision-making)
to be considered alongside other factors
important for decision-making such as
economics, technical feasibility, and regulatory
context. The risk characterization methods
described in this chapter are consistent with
EPA's published risk assessment guidelines.
Exhibit 8-1 is an overview of risk
characterization, and illustrates how it relates to
the preceding toxicity and exposure assessments
and to the following development of preliminary
remediation goals.
In the following sections, the risk
characterization methodology is described.
There are separate discussions for carcinogenic
and noncarcinogenic effects because the
methodology differs for these two modes of
chemical toxicity. In addition to giving
instructions for calculating numerical estimates
of risk, this chapter provides guidance for
interpreting, presenting, and qualifying the results.
A risk characterization cannot be considered
complete unless the numerical expressions of risk
are accompanied by explanatory text interpreting
and qualifying the results.
8.1 REVIEW OF OUTPUTS FROM THE
TOXICITY AND EXPOSURE
ASSESSMENTS
Most sites being assessed will involve the
evaluation of more than one chemical of concern
and might include both carcinogenic and
noncarcinogenic substances. The first step in
risk characterization is to gather, review,
compare, and organize the results of the
exposure assessment (e.g., intakes for all
exposure pathways and land-uses and for all
relevant substances) and toxicity assessment
(e.g., toxicity values for all exposure routes and
relevant substances).
ACRONYMS FOR CHAPTER 8
ARAR = Applicable or Relevant and Appropriate
Requirement
ATSDR= Agency for Toxic Substances and
Disease Registry
CDI = Chronic Daily Intake
ECAO = Environmental Criteria and Assessment Office
E = Exposure Level
HI = Hazard Index
IRIS = Integrated Risk Information System
LOAEL= Lowest-Observed-Adverse-Effect Level
NOAEL = No-Observed-Adverse-Effect-Level
NRC = Nuclear Regulatory Commission
RfD = Reference Dose (when used without other
modifiers, RfD generally refers to chronic
reference dose)
RfD
dt
= Developmental Reference Dose
RfD
s
= Subchronic Reference Dose
RI/FS = Remedial Investigation/Feasibility Study
RME = Reasonable Maximum Exposure
SDI = Subchronic Daily Intake
SF = Slope Factor

Page 8-2
DEFINITIONS FOR CHAPTER 8
Absorbed Dose. The amount of a substance penetrating the exchange boundaries of an organism after contact. Absorbed dose is
calculated from the intake and the absorption efficiency. It usually is expressed as mass of a substance absorbed into the body per
unit body weight per unit time (e.g., mg/kg-day).
Administered Dose. The mass of substance given to an organism and in contact with an exchange boundary (e.g., gastrointestinal
tract) per unit body weight per unit time (e.g., mg/kg-day).
Chronic Reference Dose (RfD). An estimate (with uncertainty spanning perhaps an order of magnitude or greater) of a daily
exposure level for the human population, including sensitive subpopulations, that is likely to be without an appreciable risk of
deleterious effects during a lifetime. Chronic RfDs are specifically developed to be protective for long-term exposure to a
compound (as a Superfund program guideline, seven years to lifetime).
Developmental Reference Dose (RfD dt). An estimate (with uncertainty spanning perhaps an order of magnitude or greater) of an
exposure level for the human population, including sensitive subpopulations, that is likely to be without an appreciable risk of
development effects. Developmental RfDs are used to evaluate the effects of a single exposure event.
Exposure. Contact of an organism with a chemical or physical agent. Exposure is quantified as the amount of the agent available
at the exchange boundaries of the organism (e.g., skin, lungs, gut) and available for absorption.
Exposure Assessment. The determination or estimation (qualitative or quantitative) of the magnitude, frequency, duration, and
route of exposure.
Exposure Pathway. The course a chemical or physical agent takes from a source to an exposed organism. An exposure pathway
describes a unique mechanism by which an individual or population is exposed to chemicals or physical agents at or originating
from a site. Each exposure pathway includes a source or release from a source, an exposure point, and an exposure route. If the
exposure point differs from the source, a transport/exposure medium (e.g., air) or media (in cases of intermedia transfer) also is
included.
Exposure Route. The way a chemical or physical agent comes in contact with an organism (e.g., by ingestion, inhalation, dermal
contact).
Hazard Index (HI). The sum of more than one hazard quotient for multiple substances and/or multiple exposure pathways. The
HI is calculated separately for chronic, subchronic, and shorter-duration exposures.
Hazard Quotient. The ratio of a single substance exposure level over a specified time period (e.g., subchronic) to a reference dose
for that substance derived from a similar exposure period.
Intake. A measure of exposure expressed as the mass of a substance in contact with the exchange boundary per unit body weight
per unit time (e.g., mg chemical/kg body weight-day). Also termed the normalized exposure rate; equivalent to administered
dose.
Integrated Risk Information System (IRIS). An EPA data base containing verified RfDs and slope factors and up-to-date health
risk and EPA regulatory information for numerous chemicals. IRIS is EPA's preferred source for toxicity information for
Superfund.
Reference Dose (RfD). The Agency's preferred toxicity value for evaluating noncarcinogenic effects result from exposures at
Superfund sites. See specific entries for chronic RfD, subchronic RfD, and developmental RfD. The acronym RfD, when used
without other modifiers, either refers generically to all types of RfDs or specifically to chronic RfDs; it never refers specifically
to subchronic or developmental RfDs.
Slope Factor. A plausible upper-bound estimate of the probability of a response per unit intake of a chemical over a lifetime. The
slope factor is used to estimate an upper-bound probability of an individual developing cancer as a result of a lifetime of exposure
to a particular level of a potential carcinogen.
Subchronic Reference Dose (RfD s). An estimate (with uncertainty spanning perhaps an order of magnitude or greater) of a daily
exposure level for the human population, including sensitive subpopulations, that is likely to be without an appreciable risk of
deleterious effects during a portion of a lifetime (as a Superfund program guideline, two weeks to seven years).
Weight-of-Evidence Classification. An EPA classification system for characterizing the extent to which the available data
indicate that an agent is a human carcinogen. Recently, EPA has developed weight-of-evidence classification systems for some
other kinds of toxic effects, such as developmental effects.

Page 8-3
EXHIBIT 8-1
STEPS IN RISK CHARACTERIZATION

Page 8-4
The following two subsections describe how to
organize the outputs from the exposure and
toxicity assessments and how to check for the
consistency and validity of the information from
the preceding exposure and toxicity assessments.
8.1.1 GATHER AND ORGANIZE
INFORMATION
For each exposure pathway and land-use
evaluated in the exposure assessment, check that
all information needed to characterize risk is
available. The necessary exposure information is
outlined in the box below.
EXPOSURE INFORMATION NEEDED
FOR RISK CHARACTERIZATION
Estimated intakes (chronic, subchronic, and
shorter-term, as appropriate) for chemicals.
Important exposure modeling assumptions,
including:
o chemical concentration at the exposure points;
o frequency and duration of exposure;
o absorption assumptions; and
o characterization of uncertainties.
List of which exposure pathways can reasonably
contribute to the exposure of the same individuals
over the same time period.
For each chemical or substance evaluated
in the toxicity assessment, use the checklist
provided in the box below to ensure that all
information needed to characterize risk is
available.
8.1.2 MAKE FINAL CONSISTENCY AND
VALIDITY CHECK
Check the consistency and validity of key
assumptions common to the exposure outputs
and the toxicity outputs for each contaminant
and exposure pathway of concern. These
assumptions include the averaging period for
exposure, the exposure route, and the absorption
adjustments. The
basic principle is to ensure that
the exposure estimates correspond as closely as
possible with the assumptions used in developing
the toxicity values.
TOXICITY INFORMATION NEEDED
FOR RISK CHARACTERIZATION
Slope factors for all carcinogenic
chemicals.
Discussion of weight of evidence and
classifications for all carcinogenic
chemicals.
Type of cancer for Class A carcinogens.
Chronic and subchronic RfDs and shorter-
term toxicity values (if appropriate) for all
chemicals (including carcinogens and
developmental toxicants).
Critical effect associated with each RfD.
Discussion of uncertainties, uncertainty
factors, and modifying factor used in
deriving each RfD and "degree of
confidence" in RfD (i.e., high, medium,
low).
Whether the toxicity values are expressed
as absorbed or administered doses.
Pharmacokinetic data that may affect the
extrapolation from animals to humans for
both the RfD and slope factor.
Uncertainties in any route-to-route
extrapolations.
Averaging period for exposure. If the
toxicity value is based on average lifetime
exposure (e.g., slope factors), then the exposure
duration must also be expressed in those terms.
For estimating cancer risks, always use average
lifetime exposure; i.e., convert less-than-lifetime
exposures to equivalent lifetime values (see EPA
1986a, Guidelines for Carcinogen Risk
Assessment). On the other hand, for evaluating
potential noncarcinogenic effects of less-than-
lifetime exposures, do not compare chronic
RfDs to short-term exposure estimates, and do
not convert short-term exposures to equivalent
lifetime values to compare with the chronic
RfDs. Instead, use subchronic or shorter-term
toxicity values to evaluate short-term exposures.
Check that the estimated exposure duration is
sufficiently similar to the duration of the
exposure in the study used to identify the
toxicity value to be protective of human health
(particularly for subchronic and shorter-term

Page 8-5
effects). A toxicologist should review the
comparisons. In the absence of short-term
toxicity values, the chronic RfD may be used as
an initial screening value; i.e., if the ratio of the
short-term exposure value to the chronic RfD is
less than one, concern for potential adverse
health effects is low. If this ratio exceeds unity,
however, more appropriate short-term toxicity
values are needed to confirm the existence of a
significant health threat. ECAO may be
consulted for assistance in finding short-term
toxicity values.
Exposure route. Check that all toxicity
values used for each exposure pathway being
evaluated at the site are consistent with the route
of exposure (e.g., oral to oral, inhalation to
inhalation). It is not possible to extrapolate
between exposure routes for some substances
that produce localized effects dependent upon
the route of exposure. For example, a toxicity
value based on localized lung tumors that result
only from inhalation exposure to a substance
would not be appropriate for estimating risks
associated with dermal exposure to the
substance. At this time, EPA considers it
appropriate only to extrapolate dermal toxicity
values from values derived for oral exposure. It
is not recommended that oral toxicity reference
values be extrapolated casually from inhalation
toxicity values, although this extrapolation may
be performed on a case-bycase basis in
consultation with ECAO. In general, inhalation
values should not be extrapolated from oral
values. See Section 7.5.1 for additional
information.
EPA ENVIRONMENTAL CRITERIA
AND ASSESSMENT OFFICE (
ECAO)
TECHNICAL ASSISTANCE
FTS 684-7300
513-569-7300
Inhalation RfD values obtained from IRIS
will usually be expressed as ambient air
concentrations (i.e., mg/m
3
), instead of as
administered doses (i.e., mg/kg-day). It may be
necessary, therefore, to calculate the RfD
i
in
units of mg/kg-day for comparison with the
intake estimated in the exposure assessment. The
RfD expressed in mg/kg-day would be equal to
the RfD in mg/m
3
multiplied by 20 m
3
air
inhaled per person per day divided by 70 kg per
person.
Absorption adjustment. Check that the
exposure estimates and the toxicity values are
either both expressed as absorbed doses or both
expressed as intakes (i.e., administered doses).
Except for the dermal route of exposure, the
exposure estimates developed using the methods
provided in Chapter 6 should be in the form of
intakes, with no adjustments made for
absorption. However, there are three types of
absorption adjustments that might be necessary
or appropriate depending on the available
toxicity information. These are described below.
Sample calculations for these absorption
adjustments are provided in Appendix A.
(1) Dermal exposures. The output of the
exposure assessment for dermal exposure
is expressed as the amount of substance
absorbed per kg body weight per day. It
therefore may be necessary to derive an
absorbed-dose toxicity value from an
administered-dose toxicity value to
compare with the exposure estimate. See
Appendix A for sample calculations.
(2) Absorbed-dose toxicity value. For the
substances for which the toxicity value is
expressed as an absorbed rather than
administered dose (e.g., inhalation slope
factor in IRIS for trichloroethylene and
several other substances), one should
express exposure as an absorbed dose
rather than as an intake. See Appendix A.
(3) Adjustment for medium of exposure.
Adjusting for different
absorption
efficiencies
based on the medium of
exposure
(e.g., food, soil, or
water for oral
exposure, water or particulates for inhalation
exposure)
is occasionally appropriate, but
not generally recommended unless there are
strong
arguments for doing so. Many
oral
RfD and slope factor values assume
ingestion in
water even
when based on
studies that employed administration in
corn oil by gavage or in feed. Thus, in
most cases, the unadjusted toxicity value

Page 8-6
will provide a reasonable or conservative
estimate of risk. See Appendix A.
8.2 QUANTIFYING RISKS
This section describes steps for
quantifying risk or hazard indices for both
carcinogenic and noncarcinogenic effects t o be
applied to each exposure pathway analyzed. The
first subsection covers procedures for individual
substances, and is followed by a subsection on
procedures for quantifying risks associated with
simultaneous
exposures to several substances.
Sample table formats
for
recording the results of
these calculations as well
as recording
associated information related to
uncertainty and
absorption adjustments are provided in Exh
ibits
8-2 through 8-4.
8.2.1 CALCULATE RISKS FOR INDIVIDUAL
SUBSTANCES
Carcinogenic effects. For carcinogens,
risks are estimated as the incremental probability
of an individual developing cancer over a
lifetime as a result of exposure to the potential
carcinogen (i.e., incremental or excess
individual lifetime cancer risk). The guidelines
provided in this section are consistent with
EPA's (1986a) Guidelines for Carcinogen Risk
Assessment. For some carcinogens, there may
be sufficient information on mechanism of
action that a modification of the approach
outlined below is warranted. Alternative
approaches may be considered in consultation
with ECAO on a case-by-case
basis.
The slope factor (SF) converts estimated
daily intakes
averaged over a
lifetime of
exposure directly to incremental risk of an
individual developing cancer. Because
relatively
low intakes (compared to those experienced by
test animals) are most likely
from environmental
exposures at
Superfund sites, it generally can be
assumed that the dose-response
relationship will
be linear in the low-dose portion of
the
multistage model dose-response
curve. (See the
Background Document
2 of IRIS for a
discussion of the multistage model). Under this
assumption, the slope factor is a constant, and
risk will be directly related to intake. Thus, the
linear form of the carcinogenic risk equation is
usually applicable for estimating Superfund site
risks. This linear low-dose equation is described
in the box below.
LINEAR LOW-DOSE CANCER
RISK EQUATION
Risk = CDI x SF
where:
Risk = a unitless probability (e.g., 2×10
-5
) of an
individual developing cancer;
CDI = chronic daily intake averaged over 70 years
(mg/kg-day); and
SF = slope factor, expressed in (mg/kg-day)
-1
.
The CDI is identified in Exhibits 6-11 through 6-19
and 6-22 and the SF is identified in Exhibit 7-3.
However, this linear equation is valid only
at low risk levels (i.e., below estimated risks of
0.01). For sites where chemical intakes might be
high (i.e., risk above 0.01), an alternate
calculation equation should be used. The one-hit
equation, which is consistent with the linear
low-dose model given above and described in
the box on page 8-11, should be used instead.
Because the slope factor is often an upper
95
th
percentile confidence limit of the
probability of response based on experimental
animal data used in the multistage model, the
carcinogenic risk estimate will generally be an
upper-bound estimate. This means that EPA is
reasonably confident that the "true risk" will not
exceed the risk estimate derived through use of
this model and is likely to be less than that
predicted.
Noncarcinogenic effects. The measure used
to describe the potential for noncarcinogenic
toxicity to occur in an individual is not expressed
as the probability of an individual suffering an
adverse effect.
Comment [A58]: The Superfund Program has
updated its inhalation risk paradigm and
provides updated information concerning how
to quantify risk or hazard indices for both
carcinogenic and non-carcinogenic effects of
inhaled contaminants. Please consult Chapter 5
of EPA’s
Risk Assessment Guidance for
Superfund Volume I: Human Health Evaluation
Manual Part F, Supplemental Guidance for
Inhalation Risk Assessment
for current
recommendations regarding exposure
assessments for inhaled contaminants. RAGS,
Part F may be found at:
http://www.epa.gov/oswer/riskassessment/rags
f/index.htm

Page 8-7
EXHIBIT 8-2
EXAMPLE OF TABLE FORMAT FOR CANCER RISK ESTIMATES
Comment [A59]:
EPA’
s
Risk Assessment
Guidance for Superfund Volume I: Human
Health Evaluation Manual (Part D, Standardized
Planning, Reporting, and Review of Superfund
Risk Assessments)
provides planning tables for
use during the risk assessment process
. See
Part D, Section 3.1.1 (page 3-10) for an
overview of using Planning Table 7: Calculation
of Chemical Cancer and Non-cancer Hazards
Risk. Also see Appendix A for the downloadable
Planning Table 7 templates and instructions for
completing these templates. RAGS, Part D may
be found at:
http://www.epa.gov/oswer/riskassessment/rags
d/index.htm

Page 8-8
EXHIBIT 8-3
EXAMPLE OF TABLE FORMAT FOR CHRONIC HAZARD INDEX ESTIMATES
Comment [A60]:
EPA’s Risk Assessment
Guidance for Superfund Volume I: Human
Health Evaluation Manual (Part D, Standardized
Planning, Reporting, and Review of Superfund
Risk Assessments)
provides planning tables for
use during the risk assessment process
. See
Part D, Section 3.1.1 (page 3-10) for an
overview of using Planning Table 7: Calculation
of Chemical Cancer and Non-cancer Hazards
Risk. Also see Appendix A for the downloadable
Planning Table 7 templates and instructions for
completing these templates. RAGS, Part D may
be found at:
http://www.epa.gov/oswer/riskassessment/rags
d/index.htm

Page 8-9
EXHIBIT 8-4
EXAMPLE OF TABLE FORMAT FOR SUBCHRONIC HAZARD INDEX ESTIMATES
Comment [A61]:
EPA’s Risk Assessment
Guidance for Superfund Volume I: Human
Health Evaluation Manual (Part D, Standardized
Planning, Reporting, and Review of Superfund
Risk Assessments)
provides planning tables for
use during the risk assessment process
. See
Part D, Section 3.1.1 (page 3-10) for an
overview of using Planning Table 7: Calculation
of Chemical Cancer and Non-cancer Hazards
Risk. Also see Appendix A for the downloadable
Planning Table 7 templates and instructions for
completing these templates. RAGS, Part D may
be found at:
http://www.epa.gov/oswer/riskassessment/rags
d/index.htm

Page 8-10
EXPLANATION OF SAMPLE TABLE FORMAT
FOR CANCER RISK ESTIMATES
A sample table format for summarizing cancer risk estimates is provided in Exhibit 8-2. For each baseline risk
assessment, at least two summary tables generally would be required: one for current land uses and one for future land uses. In
the example provided in Exhibit 8-2, two exposure pathways were determined to contribute to exposure of a nearby residential
population under current land use: ingestion of private well water contaminated with benzene and chlordane and ingestion of fish
contaminated with chlordane. Moreover, a subset of the population in Area Y was exposed to the maximal well water
contamination and consumed more locally caught fish than the remainder of the nearby population.
Values for the chronic daily intake (CDI), averaged over a lifetime, of each contaminant by each exposure pathway would
be obtained from a table such as that shown in Exhibit 6-22. The CDI via well water was not adjusted for absorption efficiency
because the slope factors for these substances assume ingestion in water and an absorption fraction of 1.0. The CDI for chlordane
in fish was not adjusted for vehicle of exposure (i.e., food versus water) because absorption efficiency data were limited, and an
absorption fraction of 1.0 was used as a conservative assumption. If, for example, available data had indicated that only 10
percent of chlordane ingested with fish is absorbed, the CDI could have been adjusted downward to 0.000008 mg/kg-day (i.e.,
0.00008 mg/kg-day × 0.10 absorption fraction).
Values for the slope factors (SF), weight-of-evidence classification, type of cancer (for Class A carcinogens), reference
source of the SF, and basis of the SF (vehicle of administration and absorption efficiency) would be obtained from a table such as
that shown in Exhibit 7-3. The chemical-specific risks were calculated from the CDI and SF using the linear low-dose cancer risk
equation (risk = CDI × SF). The total pathway risk for ingestion of private well water is the sum of the two chemical-specific
risks for that pathway. The total risk estimate for the nearby residential population in area Y is the sum of the cancer risks for the
two pathways. Note that it is important to summarize the weight of evidence for the carcinogens contributing most to the total
cancer risk estimate; in this example, chlordane, a Class B2 carcinogen, accounted for most of the risk.
Comment [A62]: The Superfund Program has
updated its inhalation risk paradigm and no
longer uses the chronic daily intake to assess
inhalation exposures. Please consult Chapter 3
of EPA’s
Risk Assessment Guidance for
Superfund Volume I: Human Health Evaluation
Manual (Part F, Supplemental Guidance for
Inhalation Risk Assessment)
for current
recommendations regarding exposure
assessments for inhaled contaminants. RAGS,
Part F may be found at:
http://www.epa.gov/oswer/riskassessment/rags
f/index.htm
EXPLANATION OF SAMPLE TABLE FORMAT
FOR CHRONIC HAZARD INDEX ESTIMATES
A sample table format for summarizing chronic hazard index estimates is provided in Exhibit 8-3. For each baseline risk
assessment, at least two summary tables generally would be required: one for current land uses and one for future land uses. In
the example provided in Exhibit 8-3, two exposure pathways were determined to contribute to exposure of a nearby residential
population under current land use: ingestion of private well water contaminated with phenol, nitrobenzene, and cyanide and
ingestion of fish contaminated with phenol and methyl ethyl ketone (MEK). Moreover, a subset of the population in Area Y was
exposed to the maximal well water contamination and consumed more locally caught fish than the remainder of the nearby
population.
Values for the chronic daily intake (CDI), averaged over the period of exposure, of each contaminant by each exposure
pathway would be obtained from a table such as that shown in Exhibit 6-22. The CDI via well water was not adjusted for
absorption efficiency because the RfDs for these substances are based on ingestion in water and an absorption fraction of 1.0. The
CDI for phenol and MEK in fish was not adjusted for vehicle of exposure (i.e., food versus water) because absorption efficiency
data were limited, and an absorption fraction of 1.0 was used as a conservative assumption. If, for example, available data had
indicated that only 20 percent of MEK ingested with fish is absorbed, the CDI for MEK could have been adjusted downward to
0.001 mg/kg-day (i.e., 0.005 mg/kg-day x 0.20 absorption efficiency).
Values for the RfDs, confidence level in the RfD, critical effect, source of the value, and basis of the RfD (vehicle of
administration and absorption efficiency) would be obtained from a table such as that shown in Exhibit 7-2. The chemical-
specific hazard quotients are equal to the CDI divided by the RfD. The total pathway hazard index for ingestion of private well
water is the sum of the three chemical-specific hazard quotients for that pathway. The total hazard index estimate for the nearby
residential population in area Y is the sum of the hazard indices for the two exposure pathways.
Note that it is important to include the noncarcinogenic effects of carcinogenic substances when appropriate reference
doses are available. For example, in an actual risk assessment of the chemicals summarized in Exhibit 6-22, the potential
noncarcinogenic effects of chlordane should be evaluated and appropriate entries made in tables such as those shown in Exhibits
7-2 and 8-3.
Comment [A63]: The Superfund Program has
updated its inhalation risk paradigm and no
longer uses the chronic daily intake to assess
inhalation exposures. Please consult Chapter 3
of EPA’s
Risk Assessment Guidance for
Superfund Volume I: Human Health Evaluation
Manual (Part F, Supplemental Guidance for
Inhalation Risk Assessment)
for current
recommendations regarding exposure
assessments for inhaled contaminants. RAGS,
Part F may be found at:
http://www.epa.gov/oswer/riskassessment/rags
f/index.htm

Page 8-11
ONE-HIT EQUATION FOR HIGH
CARCINOGENIC RISK LEVELS
Risk = 1 - exp(-CDI x SF)
where:
Risk = a unitless probability (e.g., 2 ×10
-5
) of an
individual developing cancer;
exp = the exponential;
CDI = chronic daily intake averaged over 70 years
(mg/kg-day); and
EPA does not at the present time use a
probabilistic approach to estimating the potential
for noncarcinogenic health effects. Instead, the
potential for noncarcinogenic effects is
evaluated by comparing an exposure level over a
specified time period (e.g., lifetime) with a
reference dose derived for a similar exposure
period. This ratio of exposure to toxicity is
called a hazard quotient and is described in the
box in the opposite column.
The noncancer hazard quotient assumes that
there is a level of exposure (i.e., RfD) below
which it is unlikely for even sensitive
populations to experience adverse health effects.
If the exposure level (E) exceeds this threshold
(i.e., if E/RfD exceeds unity), there may be
concern for potential noncancer effects. As a
rule, the greater the value of E/RfD above unity,
the greater the level of concern. Be sure,
however, not to interpret ratios of E/RfD as
statistical probabilities; a ratio of 0.001 does not
mean that there is a one in one thousand chance
of the effect occurring. Further, it is important to
emphasize that the level of concern does not
increase linearly as the RfD is approached or
exceeded because RfDs do not have equal
accuracy or precision and are not based on the
same severity of toxic effects. Thus, the slopes
of the dose-response curve in excess of the RfD
can range widely depending on the substance.
Three exposure durations that will need
separate consideration for the possibility of
adverse noncarcinogenic health effects are
chronic, subchronic, and shorter-term exposures.
As guidance for Superfund, chronic exposures
for humans range in duration from seven years
NONCANCER HAZARD QUOTIENT
Noncancer Hazard Quotient = E/RfD
where:
E = exposure level (or intake);
RfD = reference dose; and
E and RfD are expressed in the same
to a lifetime; such long-term exposures are
almost always of concern for Superfund sites
(e.g., inhabitants of nearby residences, year-
round users of specified drinking water sources).
Subchronic human exposures typically range in
duration from two weeks to seven years and are
often of concern at Superfund sites. For
example, children might attend a junior high
school near the site for no more than two or
three years. Exposures less than two weeks in
duration are occasionally of concern at
Superfund sites. For example, if chemicals
known to be developmental toxicants are present
at a site, short-term exposures of only a day or
two can be of concern.
8.2.2 AGGREGATE RISKS FOR MULTIPLE
SUBSTANCES
At most Superfund sites, one must assess
potential health effects of more than one
chemical (both carcinogens and other toxicants).
Estimating risk or hazard potential by
considering one chemical at a time might
significantly underestimate the risks associated
with simultaneous exposures to several
substances. To assess the overall potential for
cancer and noncancer effects posed by multiple
chemicals, EPA (1986b) has developed
Guidelines for the Health Risk Assessment of
Chemical Mixtures that can also be applied to
the case of simultaneous exposures to several
chemicals from a variety of sources by more
than one exposure pathway. Although the
calculation procedures differ for carcinogenic
and noncarcinogenic effects, both sets of
procedures assume dose additivity in the
absence of information on specific mixtures.
Comment [A64]: EPA has developed guidance
for assessing health risks form exposures to multiple
chemical or mixtures that supplements the
information presented in RAGS Part A. In August
2000, EPA published Supplementary Guidance for
Conducting Health Risk Assessment of Chemical
Mixtures, which describes details for several
procedures for chemical mixture assessment,
including methods for using whole-mixture data on a
toxicologically similar mixture, methods for
incorporating information on toxicologic interactions
to modify a Hazard Index (HI), and generalized
procedures for mixtures involving classes of similar
chemicals. This guidance document may be found at:
http://cfpub.epa.gov/ncea/cfm/recordisplay.cfm?deid
=20533

Page 8-12
Information on specific mixtures found at
Superfund sites is rarely available. Even if such
data exist, they are often difficult to use.
Monitoring for "mixtures" or modeling the
movement of mixtures across space and time
present technical problems given the likelihood
that individual components will behave
differently in the environment (i.e., fate and
transport). If data are available on the mixtures
present at the site, but are not adequate to
support a quantitative evaluation, note the
information in the "assumptions"
documentation.
Carcinogenic effects. The cancer risk
equation described in the box below estimates
the incremental individual lifetime cancer risk
for simultaneous exposure to several
carcinogens and is based on EPA's (1986a,b)
risk assessment guidelines. This equation
represents an approximation of the precise
equation for combining risks which accounts for
the joint probabilities of the same individual
developing cancer as a consequence of exposure
to two or more carcinogens.
1
The difference
between the precise equation and the
approximation described in the box is negligible
for total cancer risks less than 0.1. Thus, the
simple additive equation is appropriate for most
Superfund risk assessments.
CANCER RISK EQUATION FOR
MULTIPLE SUBSTANCES
RiskT = ∑ Risk
i
where:
Risk
T
= the total cancer risk,
expressed as a unitless
probability; and
Risk
i
=
the risk estimate for the i
th
substance.
The risk summation techniques described
in the box on this page and in the footnote
assume that intakes of individual substances are
small. They also assume independence of action
by the compounds involved (i.e., that there are
no synergistic or antagonistic chemical
interactions and that all chemicals produce the
same effect, i.e., cancer). If these assumptions
are incorrect, over-or underestimation of the
actual multiple-substance risk could result.
Calculate a separate total cancer risk for
each exposure pathway by summing the
substance-specific cancer risks. Resulting cancer
risk estimates should be expressed using one
significant figure only. Obviously, the total
cancer risk for each pathway should not exceed
1. Exhibit 8-2 provides a sample table format for
presenting estimated cancer risks for specified
exposure pathways in the "Total Pathway Risk"
column.
There are several limitations to this
approach that must be acknowledged. First,
because each slope factor is an upper 95th
percentile estimate of potency, and because
upper 95th percentiles of probability
distributions are not strictly additive, the total
cancer risk estimate might become artificially
more conservative as risks from a number of
different carcinogens are summed. If one or two
carcinogens drive the risk, however, this
problem is not of concern. Second, it often will
be the case that substances with different
weights of evidence for human carcinogenicity
are included. The cancer risk equation for
multiple substances sums all carcinogens
equally, giving as much weight to class B or C
as to class A carcinogens. In addition, slope
factors derived from animal data will be given
the same weight as slope factors derived from
human data. Finally, the action of two different
carcinogens might not be independent. New
tools for assessing carcinogen interactions are
becoming available, and should be considered in
consultation with the RPM (e.g., Arcos et al.
1988). The significance of these concerns given
the circumstances at a particular site should be
discussed and presented with the other
information described in Section 8.6.
Noncarcinogenic effects. To assess the
overall potential for noncarcinogenic effects
posed by more than one chemical, a hazard
index (HI) approach has been developed based
on EPA's (1986b) Guidelines for Health Risk

Assessment of Chemical Mixtures. This
approach assumes that simultaneous
subthreshold exposures to several chemicals
could result in an adverse health effect. It also
assumes that the magnitude of the adverse effect
will be proportional to the sum of the ratios of
the subthreshold exposures to acceptable
exposures. The hazard index is equal to the sum
of the hazard quotients, as described in the box
below, where E and the RfD represent the same
exposure period (e.g., subchronic, chronic, or
shorter-term). When the hazard index exceeds
unity, there may be concern for potential health
effects. While any single chemical with an
exposure level greater than the toxicity value
will cause the hazard index to exceed unity, for
multiple chemical exposures, the hazard index
can also exceed unity even if no single chemical
exposure exceeds its RfD.
NONCANCER HAZARD INDEX
Hazard Index = E
1
/RfD
1
+ E
2
/RfD
2
+ ...
+ E
i
/RfD
i
where:
th
E
i
= exposure level (or intake) for the i
toxicant;
th
RfD
i
= reference dose for the i toxicant;
and
E and RfD are expressed in the same
units and represent the same exposure
period (i.e., chronic, subchronic, or
shorter-term).
It is important to calculate the hazard
index separately for chronic, subchronic, and
shorter-term exposure periods as described
below. It is also important to remember to
include RfDs for the noncancer effects of
carcinogenic substances.
(1) Noncarcinogenic effects -- chronic
exposures. For each chronic exposure
pathway (i.e., seven year to lifetime
exposure), calculate a separate chronic
hazard index from the ratios of the chronic
daily intake (CDI) to the chronic reference
Page 8-13
CHRONIC NONCANCER HAZARD INDEX
Chronic
Hazard Index = CDI 1/RfD1 + CDI 2 /RfD2
+ ...
+ CDI /RfDi i
where:
CDIi = chronic daily intake for the i
th
toxicant in mg/kg-day, and
RfDi = chronic reference dose for
the i
th
toxicant in mg/kg-day.
dose (RfD) for individual chemicals as
described in the box below. Exhibit 8-3
provides a sample table format for
recording these results in the "Pathway
Hazard Index" column.
(2) Noncarcinogenic effects--subchronic
exposures. For each subchronic exposure
pathway (i.e., two week to seven year
exposure), calculate a separate subchronic
hazard index from the ratios of subchronic
daily intake (SDI) to the subchronic
reference dose (RfD
s
) for individual
chemicals as described in the box on the
next page. Exhibit 8-4 provides a sample
table format for recording these results in
the "Pathway Hazard Index" column. Add
only those ratios corresponding to
subchronic exposures that will be occurring
simultaneously.
(3) Noncarcinogenic effects --less than two
week exposures. The same procedure may
be applied for simultaneous shorter-term
exposures to several chemicals. For
drinking water exposures, 1-and 10-day
Health Advisories can be used as reference
toxicity values. Depending on available
data, a separate hazard index might also be
calculated for developmental toxicants
(using RfD
dt
s), which might cause adverse
effects following exposures of only a few
days. See Guidelines for the Health
Assessment of Suspect Developmental
Toxicants (EPA 1986c; EPA 1989) for
further guidance.

Page 8-14
SUBCHRONIC NONCANCER
HAZARD INDEX
Subchronic
Hazard Index = SDI
1
/RfD
s1
+SDI
2
/RfD
s2
+ ... + SDI
i
/RfD
si
where:
th
SDIi = subchronic daily intake for the i
toxicant in mg/kg-day; and
th
RfDsi = subchronic reference dose for the i
toxicant in mg/kg-day.
There are several limitations to this
approach that must be acknowledged. As
mentioned earlier, the level of concern does not
increase linearly as the reference dose is
approached or exceeded because the RfDs do
not have equal accuracy or precision and are not
based on the same severity of effect. Moreover,
hazard quotients are combined for substances
with RfDs based on critical effects of varying
toxicological significance. Also, it will often be
the case that RfDs of varying levels of
confidence that include different uncertainty
adjustments and modifying factors will be
combined (e.g., extrapolation from animals to
humans, from LOAELs to NOAELs, from one
exposure duration to another).
Another limitation with the hazard index
approach is that the assumption of dose
additivity is most properly applied to
compounds that induce the same effect by the
same mechanism of action. Consequently,
application of the hazard index equation to a
number of compounds that are not expected to
induce the same type of effects or that do not act
by the same mechanism could overestimate the
potential for effects, although such an approach
is appropriate at a screening level. This
possibility is generally not of concern if only
one or two substances are responsible for driving
the HI above unity. If the HI is greater than unity
as a consequence of summing several hazard
quotients of similar value, it would be
appropriate to segregate the compounds by
effect and by mechanism of action and to derive
separate hazard indices for each group.
Segregation of hazard indices.
Segregation of hazard indices by effect and
mechanism of action can be complex and time-
consuming because it is necessary to identify all
of the major effects and target organs for each
chemical and then to classify the chemicals
according to target organ(s) or mechanism of
action. This analysis is not simple and should be
performed by a toxicologist. If the segregation is
not carefully done, an underestimate of true
hazard could result. Agency review of
particularly complex or controversial cases can
be requested of ECAO through the regional risk
assessment support staff.
The procedure for recalculating the hazard
index by effect and by mechanism of action is
briefly described in the box on the next page. If
one of the effect-specific hazard indices exceeds
unity, consideration of the mechanism of action
might be warranted. A strong case is required,
however, to indicate that two compounds which
produce adverse effects on the same organ
system (e.g., liver), although by different
mechanisms, should not be treated as dose
additive. Any such determination should be
reviewed by ECAO.
If there are specific data germane to the
assumption of dose-additivity (e.g., if two
compounds are present at the same site and it is
known that the combination is five times more
toxic than the sum of toxicities for the two
compounds), then modify the development of
the hazard index accordingly. Refer to the EPA
(1986b) mixtures guidelines for discussion of a
hazard index equation that incorporates
quantitative interaction data. If data on chemical
interactions are available, but are not adequate to
support a quantitative assessment, note the
information in the "assumptions" being
documented for the site risk assessment.
PROCEDURE FOR SEGREGATION OF HAZARD
INDICES BY EFFECT
Segregation of hazard indices requires identification
of the major effects of each chemical, including those seen
at higher doses than the critical effect (e.g., the chemical

may cause liver damage at a dose of 100 mg/kg-day and
neurotoxicity at a dose of 250 mg/kg-day). Major effect
categories include neurotoxicity, developmental toxicity,
reproductive toxicity, immunotoxicity, and adverse effects
by target organ (i.e., hepatic, renal, respiratory,
cardiovascular, gastrointestinal, hematological,
musculoskeletal, and dermal/ocular effects). Although
higher exposure levels may be required to produce adverse
health effects other than the critical effect, the RfD can be
used as the toxicity value for each effect category as a
conservative and simplifying step.
INFORMATION SOURCES FOR
SEGREGATION OF HAZARD INDICES
Of the available information sources, the ATSDR
Toxicological Profiles are well suited in format and content
to allow a rapid determination of additional health effects
that may occur at exposure levels higher than those that
produce the critical effect. Readers should be aware that the
ATSDR definitions of exposure durations are somewhat
different than EPA's and are independent of species; acute -
- up to 14 days; intermediate -- more than 14 days to 1
year; chronic -- greater than one year. IRIS contains only
limited information on health effects beyond the critical
effect, and EPA criteria documents and HEAs, HEEPs, and
HEEDs may not systematically cover all health effects
observed at doses higher those associated with the most
sensitive effects.
8.3 COMBINING RISKS ACROSS
EXPOSURE PATHWAYS
This section gives directions for
combining the multi-chemical risk estimates
across exposure pathways and provides guidance
for determining when such aggregation is
appropriate.
In some Superfund site situations, an
individual might be exposed to a substance or
combination of substances through several
pathways. For example, a single individual
might be exposed to substance(s) from a
hazardous waste site by consuming
contaminated drinking water from a well, eating
contaminated fish caught near the site, and
through inhalation of dust originating from the
site. The total exposure to various chemicals will
equal the sum of the exposures by all pathways.
One should not automatically sum risks from all
exposure pathways evaluated for a site,
Page 8-15
however. The following subsections describe
how to identify exposure pathways that should
be combined and, for these, how to sum cancer
risks and noncancer hazard indices across
multiple exposure pathways.
8.3.1 IDENTIFY REASONABLE EXPOSURE
PATHWAY COMBINATIONS
There are two steps required to determine
whether risks or hazard indices for two or more
pathways should be combined for a single
exposed individual or group of individuals. The
first is to identify reasonable exposure pathway
combinations. The second is to examine whether
it is likely that the same individuals would
consistently face the "reasonable maximum
exposure" (RME) by more than one pathway.
Identify exposure pathways that have the
potential to expose the same individual or
subpopulation at the key exposure areas
evaluated in the exposure assessment, making
sure to consider areas of highest exposure for
each pathway for both current and future land-
uses (e.g., nearest downgradient well, nearest
downwind receptor). For each pathway, the risk
estimates and hazard indices have been
developed for a particular exposure area and
time period; they do not necessarily apply to
other locations or time periods. Hence, if two
pathways do not affect the same individual or
subpopulation, neither pathway's individual risk
estimate or hazard index affects the other, and
risks should not be combined.
Once reasonable exposure pathway
combinations have been identified, it is
necessary to examine whether it is likely that the
same individuals would consistently face the
RME as estimated by the methods described in
Chapter 6. Remember that the RME estimate for
each exposure pathway includes many
conservative and upper-bound parameter values
and assumptions (e.g., upper 95th confidence
limit on amount of water ingested, upper-bound
duration of occupancy of a single residence).
Also, some of the exposure parameters are not
predictable in either space or time (e.g.,
maximum downwind concentration may shift
compass direction, maximum ground-water
plume concentration may move past a well). For
real world situations in which contaminant

Page 8-16
concentrations vary over time and space, the
same individual may or may not experience the
RME for more than one pathway over the same
period of time. One individual might face the
RME through one pathway, and a different
individual face the RME through a different
pathway. Only if you can explain why the key
RME assumptions for more than one pathway
apply to the same individual or subpopulation
should the RME risks for more than one
pathway be combined.
In some situations, it may be appropriate
to combine one pathway's RME risks with other
pathways' risk estimates that have been derived
from more typical exposure parameter values. In
this way, resulting estimates of combined
pathway risks may better relate to RME
conditions.
If it is deemed appropriate to sum risks
and hazard indices across pathways, the risk
assessor should clearly identify those exposure
pathway combinations for which a total risk
estimate or hazard index is being developed. The
rationale supporting such combinations should
also be clearly stated. Then, using the methods
described in Sections 8.3.2 and 8.3.3, total
cancer risk estimates and hazard indices should
be developed for the relevant exposure areas and
individuals (or subpopulations). For example,
Exhibits 8-2 and 8-3 illustrate the combination
of cancer risk estimates and chronic noncancer
hazard indices, respectively, for a hypothetical
nearby residential population exposed to
contaminants from a site by two exposure
pathways: drinking contaminated ground water
from private wells and ingestion of
contaminated fish caught in the local river. In
this hypothetical example, it is "known" that the
few families living next to the site consume
more locally caught fish than the remaining
community and have the most highly
contaminated wells of the area.
The following two subsections describe
how to sum risks and hazard indices for multiple
exposure pathways for carcinogenic and
noncarcinogenic substances, respectively.
8.3.2 SUM CANCER RISKS
First, sum the cancer risks for each
exposure pathway contributing to exposure of
the same individual or subpopulation. For
Superfund risk assessments, cancer risks from
various exposure pathways are assumed to be
additive, as long as the risks are for the same
individuals and time period (i.e., less-than-
lifetime exposures have all been converted to
equivalent lifetime exposures). This summation
is described in the box below. The sample table
format given in Exhibit 8-2 provides a place to
record the total cancer risk estimate.
CANCER RISK EQUATION FOR
MULTIPLE PATHWAYS
Total Exposure Cancer Risk =
Risk(exposure pathway
1
) +
Risk(exposure pathway
2
) + ...... +
As described in Section 8.2.2, although
the exact equation for combining risk
probabilities includes terms for joint risks, the
difference between the exact equation and the
approximation described above is negligible for
total cancer risks of less than 0.1.
8.3.3 SUM NONCANCER HAZARD INDICES
To assess the overall potential for
noncarcinogenic effects posed by several
exposure pathways, the total hazard index for
each exposure duration (i.e., chronic,
subchronic, and shorter-term) should be
calculated separately. This equation is described
in the box on the next page. The sample table
format given in Exhibit 8-3 provides a place to
record the total exposure hazard index for
chronic exposure durations.
When the total hazard index for an
exposed individual or group of individuals
exceeds unity, there may be concern for
potential noncancer health effects. For multiple
exposure pathways, the hazard index can exceed
unity even if no single exposure pathway hazard
index exceeds unity. If the total hazard index
exceeds unity and if combining exposure
pathways has resulted in combining hazard
indices based on different chemicals, one may

HAZARD INDEX EQUATION FOR
MULTIPLE PATHWAYS
Total Exposure Hazard Index =
Hazard Index(exposure pathway
1
) +
Hazard Index(exposure pathway
2
) + ...... +
Hazard Index(exposure pathway
i
)
where:
Total Exposure Hazard Index is calculated separately
for chronic, subchronic, and shorter-term exposure
periods.
need
to consider segregating the contributions of
the different chemicals according to major effect
(see Section 8.2.2.).
8.4 ASSESSMENT AND PRESENTATION
OF UNCERTAINTY
This section discusses practical
approaches to assessing uncertainty in
Superfund site risk assessments and describes
ways to present key information bearing on the
level of confidence in quantitative risk estimates
for a site. The risk measures used in Superfund
site risk assessments usually are not fully
probabilistic estimates of risk, but conditional
estimates given a considerable number of
assumptions about exposure and toxicity (e.g.,
risk given a particular future land-use). Thus, it
is important to fully specify the assumptions and
uncertainties inherent in the risk assessment to
place the risk estimates in proper perspective.
Another use of uncertainty characterization can
be to identify areas where a moderate amount of
additional data collection might significantly
improve the basis for selection of a remedial
alternative.
Highly quantitative statistical uncertainty
analysis is usually not practical or necessary for
Superfund site risk assessments for a number of
reasons, not the least of which are the resource
requirements to collect and analyze site data in
such a way that the results can be presented as
valid probability distributions. As in all
environmental risk assessments, it already is
known that uncertainty about the numerical
results is generally large (i.e., on the range of at
least an order of magnitude or greater).
Consequently, it is more important to identify
Page 8-17
the key site-related variables and assumptions
that contribute most to the uncertainty than to
precisely quantify the degree of uncertainty in
the risk assessment. Thus, the focus of this
section is on qualitative/semiquantitative
approaches that can yield useful information to
decision-makers for a limited resource
investment.
There are several categories of
uncertainties associated with site risk
assessments. One is the initial selection of
substances used to characterize exposures and
risk on the basis of the sampling data and
available toxicity information. Other sources of
uncertainty are inherent in the toxicity values for
each substance used to characterize risk.
Additional uncertainties are inherent in the
exposure assessment for individual substances
and individual exposures. These uncertainties
are usually driven by uncertainty in the chemical
monitoring data and the models used to estimate
exposure concentrations in the absence of
monitoring data, but can also be driven by
population intake parameters. Finally, additional
uncertainties are incorporated in the risk
assessment when exposures to several
substances across multiple pathways are
summed.
The following subsections describe how to
summarize and discuss important site-specific
exposure uncertainties and the more general
toxicity assessment uncertainties.
8.4.1 IDENTIFY AND EVALUATE
IMPORTANT SITE-SPECIFIC
UNCERTAINTY FACTORS
Uncertainties in the exposure assessment
typically include most of the site-specific
uncertainties inherent in risk characterization,
and thus are particularly important to summarize
for each site. In risk assessments in general, and
in the exposure assessment in particular, several
sources of uncertainty need to be addressed: (1)
definition of the physical setting, (2) model
applicability and assumptions, (3) transport, fate,
and exposure parameter values, and (4) tracking
uncertainty, or how uncertainties are magnified
through the various steps of the assessment.
Some of these sources of uncertainty can be
quantified while others are best addressed
qualitatively.

Page 8-18
Definition of the physical setting. The
initial characterization of the physical setting
that defines the risk assessment for a Superfund
site involves many professional judgments and
assumptions. These include definition of the
current and future land uses, identification of
possible exposure pathways now and in the
future, and selection of substances detected at
the site to include in the quantitative risk
assessment. In Superfund risk assessments,
particular attention should be given to the
following aspects of the definition of the
physical setting.
Likelihood of exposure pathways and land
uses actually occurring. A large part of the
risk assessment is the estimation of cancer
risks or hazard indices that are conditional
on the existence of the exposure conditions
analyzed; e.g., if a residential development
is built on the site 10 years from now, the
health risks associated with contaminants
from the site would be X. It is important to
provide the RPM or other risk manager with
information related to the likelihood that the
assumed conditions will occur to allow
interpretation of a conditional risk estimate
in the proper context. For example, if the
probability that a residential development
would be built on the site 10 or 50 years
from now is very small, different risk
management decisions might be made than
if the probability is high. Present the
information collected during scoping and for
the exposure assessment that will help the
RPM to identify the relative likelihood of
occurrence of each exposure pathway and
land-uses, at least qualitatively (e.g.,
institutional land-use controls, zoning,
regional development plans).
The chemicals not included in the
quantitative risk estimate as a consequence
of missing information on health effects or
lack of quantitation in the chemical analysis
may represent a significant source of
uncertainty in the final risk estimates. If
chemicals with known health effects were
eliminated from the risk assessment on the
basis of concentration or frequency of
detection, one should now review and
confirm whether or not any of the chemicals
previously eliminated should actually be
included. For substances detected at the site,
but not included in the quantitative risk
assessment because of data limitations,
discuss possible consequences of the
exclusion on the risk assessment.
A checklist of uncertainty factors related
to the definition of the physical setting is
described in the box below.
LIST PHYSICAL SETTING DEFINITION
UNCERTAINTIES
For chemicals not included in the quantitative
risk assessment, describe briefly: -reason for
exclusion (e.g., quality control), and -possible
consequences of exclusion on risk assessment
(e.g., because of widespread contamination,
underestimate of risk).
For the current land uses describe: -sources and
quality of information, and. -qualitative
confidence level.
For the future land uses describe: -sources and
quality of information, and -information related
to the likelihood of occurrence.
For each exposure pathway, describe why
pathway was selected or not selected for
evaluation (i.e., sample table format from Exhibit
6-8).
For each combination of pathways, describe any
qualifications regarding the selection of exposure
pathways considered to contribute to exposure of
the same individual or group of individuals over
the same period of time.
Model applicability and assumptions.
There is always some doubt as to how well an
exposure model or its mathematical expression
(e.g., ground-water transport model)
approximates the true relationships between site-
specific environmental conditions. Ideally, one
would like to use a fully validated model that
accounts for all the known complexities in the
parameter interrelationships for each assessment.
At present, however, only simple, partially
validated models are available and commonly
used. As a consequence, it is important to
identify key model assumptions (e.g., linearity,
homogeneity, steady-state conditions,
equilibrium) and their potential impact on the
risk estimates. In the absence of field data for
model validation, one could perform a limited
sensitivity analysis (i.e., vary assumptions about

functional relationships) to indicate the
magnitude of uncertainty that might be
associated with model form. At a minimum, one
should list key model assumptions and indicate
potential impact of each on risk with respect to
both direction and magnitude, as shown in the
box below. A sample table format is presented in
Exhibit 6-21 of Chapter 6.
CHARACTERIZE MODEL
UNCERTAINTIES
List/summarize the key model assumptions.
Indicate the potential impact of each on risk:
o direction (i.e., may over- or underestimate
risk); and
o magnitude (e.g., order of magnitude).
Parameter value uncertainty. During the
course of a risk assessment, numerous parameter
values are included in the calculations of
chemical fate and transport and human intake. A
first step in characterizing parameter value
uncertainty in the baseline risk assessment is to
identify the key parameters influencing risk.
This usually can be accomplished by expert
opinion or by an explicit sensitivity analysis. In
a sensitivity analysis, the values of parameters
suspected of driving the risks are varied and the
degree to which changes in the input variables
result in changes in the risk estimates are
summarized and compared (e.g., the ratio of the
change in output to the change in input). It is
important to summarize the uncertainty
associated with key parameters, as described
below.
Significant site data gaps might have
required that certain parameter values be
assumed for the risk assessment. For
example, no information on the frequency
with which individuals swim in a nearby
stream might be available for a site, and an
assumed frequency and duration of
swimming events based on a national
average could have driven the exposure
estimate for this pathway.
Significant data uncertainties might exist for
other parameters, for example, whether or
not the available soil concentration
Page 8-19
measurements are representative of the true
distribution of soil contaminant
concentrations.
Tracking uncertainty. Ideally, one would
like to carry through the risk assessment the
uncertainty associated with each parameter in
order to characterize the uncertainty associated
with the final risk estimates. A more practical
approach for Superfund risk assessments is to
describe qualitatively how the uncertainties
might be magnified or biased through the risk
models used. General quantitative, semi-
quantitative, and qualitative approaches to
uncertainty analysis are described below.
Quantitative approach. Only on the rare
occasions that an RPM may indicate the need for
a quantitative uncertainty analysis should one be
undertaken. As mentioned earlier, a highly
quantitative statistical uncertainty analysis is
usually not practical or necessary for Superfund
sites.
If a quantitative analysis is undertaken for
a site, it is necessary to involve a statistician in
the design and interpretation of that analysis. A
quantitative approach to characterizing
uncertainty might be appropriate if the exposure
models are simple and the values for the key
input parameters are well known. In this case,
the first step would be to characterize the
probability distributions for key input parameter
values (either using measured or assumed
distributions). The second step would be to
propagate parameter value uncertainties through
the analysis using analytic (e.g., first-order
Taylor series approximation) or numerical (e.g.,
Monte Carlo simulation) methods, as
appropriate. Analytic methods might be feasible
if there are a few parameters with known
distributions and linear relationships. Numerical
methods (e.g., Monte Carlo simulation) can be
suitable for more complex relationships, but
must be done on a computer and can be resource
intensive even with time-saving techniques (e.g.,
Latin Hypercube sampling).
Two common techniques of propagating
uncertainty are first-order analyses and Monte
Carlo simulations. First-order analysis is based
on the assumption that the total variance of a
model output variable is a function of the
variances of the individual model input variables

Page 8-20
and the sensitivity of the output variable to
changes in input variables. The sensitivity of the
output variable is defined by the first derivative
of the function or model, which can be generated
analytically or numerically. A Monte Carlo
simulation estimates a distribution of exposures
or risk by repeatedly solving the model
equation(s). The probability distribution for each
variable in the model must be defined. The
computer selects randomly from each
distribution every time the equation is solved.
From the resulting output distribution of
exposures or risk, the assessor can identify the
value corresponding to any specified percentile
(e.g., the 95th percentile in the exposure
distribution).
These quantitative techniques require
definition of the distribution of all input
parameters and knowledge of the degree of
dependence (i.e., covariance) among parameters.
The value of first-order analyses or Monte Carlo
simulations in estimating exposure or risk
probability distributions diminishes sharply if
one or more parameter value distributions are
poorly defined or must be assumed. These
techniques also become difficult to document
and to review as the number of model
parameters increases. Moreover, estimating a
probability distribution for exposures and risks
can lead one into a false sense of certainty about
the analysis. Even in the most comprehensive
analyses, it will generally be true that not all of
the sources of uncertainty can be accounted for or
all of the parameter codependencies recognized.
Therefore, in addition to documenting all input
distributions and covariances, it is very
important to identify all of the assumptions and
incomplete information that have not been
accounted for in the quantitative uncertainty
analysis (e.g., likelihood that a particular land
use will occur) when presenting the results.
References describing numerical methods
of propagating uncertainty through a risk
analysis include Burmaster and von Stackelberg
(1988), Hoffman and Gardner (1983), Iman and
Helton (1988), and NRC (1983). References
describing analytic methods of tracking
uncertainty include Hoffman and Gardner
(1983), NRC (1983), Downing et al. (1985), and
Benjamin and Cornell (1970).
Semi-quantitative approach. Often
available data are insufficient to fully describe
parameter distributions, but are sufficient to
describe the potential range of values the
parameters might assume. In this situation,
sensitivity analyses can be used to identify
influential model input variables and to develop
bounds on the distribution of exposure or risk. A
sensitivity analysis can estimate the range of
exposures or risk that result from combinations
of minimum and maximum values for some
parameters and mid-range values for others. The
uncertainty for an assessment of this type could
be characterized by presenting the ranges of
exposure or risk generated by the sensitivity
analysis and by describing the limitations of the
data used to estimate plausible ranges of model
input variables (EPA 1985).
Qualitative approach. Sometimes, a
qualitative approach is the most practical
approach to describing uncertainty in Superfund
site risk assessments given the use of the
information (e.g., identifying areas where the
results may be misleading). Often the most
practical approach to characterizing parameter
uncertainty will be to develop a quantitative or
qualitative description of the uncertainty for
each parameter and to simply indicate the
possible influence of these uncertainties on the
final risk estimates given knowledge of the
models used (e.g., a specific ground-water
transport model). A checklist of uncertainty
factors related to the definition of parameters is
described in the box on page 8-22. A sample
table format is provided in Exhibit 6-21 of
Chapter 6.
Consider presentation of information on
key parameter uncertainties in graphic form to
illustrate clearly to the RPM or other risk
managers the significance of various
assumptions. For example, Exhibit 8-5 plots
assumptions regarding contaminated fish
ingestion and resulting impacts on the cancer
risk estimate for this exposure pathway. Exhibit
8-6 illustrates the significance of these same
assumptions for the hazard index estimates for
contaminated fish consumption. Additionally,
maps showing isopleths of risks resulting from
modeled air exposures such as emissions near
the site may assist the RPM or risk manager in
visualizing the significance of current or future
site risks for a community.

Page 8-21
EXHIBIT 8-5
EXAMPLE OF PRESENTATION OF IMPACT OF EXPOSURE ASSUMPTIONS
ON CANCER RISK ESTIMATE
a
The risk of developing cancer is plotted on a log scale, A risk of 10
-4
indicates a probability of 1
chance In 10,000 and a risk of 10
-5
Indicates a probability of 1 chance In 100,000 of an individual
developing cancer.

Page 8-22
CHARACTERIZE FATE AND
TRANSPORT AND EXPOSURE
PARAMETER UNCERTAINTIES
List all key exposure assessment parameters (e.g.,
infiltration rate, exposure duration,
bioconcentration factors, body weight).
List the value used for each parameter and
rationale for its selection.
Describe the measured or assumed parameter
value distributions, if possible, considering:
o total range;
o shape of distribution, if known (e.g.,
lognormal);
o mean (geometric or arithmetic) + standard
deviation; and/or
o specific percentiles (e.g., median, 95th).
Quantify the uncertainty of statistical values used
in the risk assessment (e.g., standard error of the
mean) or data gaps and qualifiers.
Describe potential direction and magnitude of bias
in risk estimate resulting from assumptions or data
gaps (see Exhibit 6-21).
8.4.2 IDENTIFY/EVALUATE TOXICITY
ASSESSMENT UNCERTAINTY
FACTORS
For substances that contribute most to the
estimates of cancer risk and noncancer hazard
indices, summarize the uncertainty inherent in
the toxicity values for the durations of exposure
assessed. Some of the information (e.g., weight
of evidence for potential human carcinogens,
uncertainty adjustments for noncancer toxicity
values) has already been recorded in the sample
table formats provided in Exhibits 8-2
through 8-4. Other information will be
developed during the toxicity assessment itself
(see Chapter 7). The box on page 8-24 provides
a checklist of uncertainties that apply to most
toxicity assessments.
Multiple substance exposure
uncertainties. Uncertainties associated with
summing risks or hazard indices for several
substances are of particular concern in the risk
characterization step. The assumption of dose
additivity ignores possible synergisms or
antagonisms among chemicals, and assumes
similarity in mechanisms of action and
metabolism. Unfortunately, the data available to
assess interactions quantitatively are generally
lacking. In the absence of adequate information,
EPA guidelines indicate that carcinogenic risks
should be treated as additive and that noncancer
hazard indices should also be treated as additive.
These assumptions are made to help prevent an
underestimation of cancer risk or potential
noncancer health effects at a site.
Be sure to discuss the availability of
information concerning potential antagonistic or
synergistic effects of chemicals for which cancer
risks or hazard indices have been summed for
the same exposed individual or subpopulations.
On the basis of available information concerning
target organ specificity and mechanism of
action, indicate the degree to which treating the
cancer risks as additive may over- or under-
estimate risk. If only qualitative information is
available concerning potential interactions or
dose-additivity for the noncarcinogenic
substances, discuss whether the information
indicates that hazard indices may have been
over- or under-estimated. This discussion is
particularly important if the total hazard index
for an exposure point is slightly below or
slightly above unity, or if the total hazard index
exceeds unity and the effect-specific hazard
indices are less than unity, and if the uncertainty
is likely to significantly influence the risk
management decision at the site.
8.5 CONSIDERATION OF
SITESPECIFIC HUMAN STUDIES
This section describes how to compare the
results of the risk characterization step with
ATSDR health assessments and other site-
specific human studies that might be available.
The first subsection outlines how to compare an
ATSDR health assessment for the site with the
risk results summarized in the previous sections
(Sections 8.2, 8.3, and 8.4). The second
subsection discusses when epidemiological or
health studies might provide useful information
for assessing exposures and health risks
associated with contaminants from a site.

Page 8-23
EXHIBIT 8-6
EXAMPLE OF PRESENTATION OF IMPACT OF EXPOSURE ASSUMPTIONS
ON HAZARD INDEX ESTIMATE

Page 8-24
CHARACTERIZE TOXICITY
ASSESSMENT UNCERTAINTIES
For each substance carried through the
quantitative risk assessment, list uncertainties
related to:
qualitative hazard findings (i.e.,
potential for human toxicity);
derivation of toxicity values, e.g., -
human or animal data, -duration of
study (e.g., chronic study used to set
subchronic RfD), and -any special
considerations;
the potential for synergistic or
antagonistic interactions with other
substances affecting the same
individuals; and
calculation of lifetime cancer risks
on the basis of less-than-lifetime
exposures.
For each substance not included in the
quantitative risk assessment because of
inadequate toxicity information, list:
possible health effects; and
possible consequences of exclusion
on final risk estimates.
8.5.1 COMPARE WITH ATSDR HEALTH
ASSESSMENT
ATSDR health assessments were defined
and compared to the RI/FS risk assessment in
Section 2.2.2. As of 1989, preliminary ATSDR
health assessments should be completed before
the RI/FS risk assessment is initiated and
therefore should be available to the risk assessor
as early as "scoping." The steps for comparing
the preliminary ATSDR health assessment with
the baseline risk assessment are outlined below.
Review again the ATSDR health
assessment findings and conclusions. These will
be largely qualitative in nature. If the ATSDR
health assessment identifies exposure pathways
or chemicals of concern that have not been
included in the RI/FS baseline risk assessment,
describe the information supporting the decision
not to include these parameters. If there are
differences in the qualitative conclusions of the
health assessment and the quantitative
conclusions of the baseline risk assessment,
explain the differences, if possible, and discuss
their implications.
8.5.2 COMPARE WITH OTHER AVAILABLE
SITE-SPECIFIC EPIDEMIOLOGICAL
OR HEALTH STUDIES
For most Superfund sites, studies of
human exposure or health effects in the
surrounding population will not be available.
However, if controlled epidemiological or other
health studies have been conducted, perhaps as a
consequence of the preliminary ATSDR health
assessment or other community involvement, it
is important to include this information in the
baseline risk assessment as appropriate.
However, not all such studies provide
meaningful information in the context of
Superfund risk assessments.
One can determine the availability of other
epidemiological or health studies for populations
potentially exposed to contaminants from the
site by contacting the ATSDR Regional
Representative, the Centers for Disease Control
in Atlanta, Georgia, and state and local health
agencies as early in the risk assessment process
as possible. It is important to avoid use of
anecdotal information or data from studies that
might include a significant bias or confounding
factor, however. Isolated reports of high body
levels of substances that are known to be present
at the site in a few individuals living near the
site are not sufficient evidence to confirm the
hypothesis that these individuals have received
significant exposures from the site. Nor can
isolated reports of disease or symptoms in a few
individuals living near the site be used to
confirm the hypothesis that the cause of the
health effects in these individuals was exposure
to contamination from the site. A trained
epidemiologist should review any available
studies in order to identify possible study

Page 8-25
limitations and implications for site risk
findings. The small populations and variable
exposures predominating at most Superfund
sites will make it extremely difficult to detect
site-related effects using epidemiological
techniques.
If site-specific health or exposure studies
have been identified and evaluated as adequate,
one should incorporate the study findings into
the overall risk characterization to strengthen the
conclusions of the risk assessment (e.g., the risk
assessment predicts elevated blood lead levels
and the human exposure study documented
elevated blood lead levels only among those
exposed to ground water contaminated by the
site). Because of the generally large and
different types of uncertainties associated with
the risk assessment and actual health studies, a
qualitative, not quantitative, comparison
between the two types of studies is generally
warranted. Areas of agreement and disagreement
between the health study(ies) and the risk
assessment should be described and factors that
might contribute to any disagreement discussed.
8.6 SUMMARIZATION AND
PRESENTATION OF THE
BASELINE RISK
CHARACTERIZATION RESULTS
This section provides guidance on
interpreting and presenting the risk
characterization results. The results of the
baseline evaluation should not be taken as a
characterization of absolute risk. An important
use of the risk and hazard index estimates is to
highlight potential sources of risk at a site so that
they may be dealt with effectively in the
remedial process. It is the responsibility of the
risk assessment team to develop conclusions
about the magnitude and kinds of risk at the site
and the major uncertainties affecting the risk
estimates. It is not the responsibility of the risk
assessment team to evaluate the significance of
the risk in a program context, or whether and
how the risk should be addressed, which are risk
management decisions.
The ultimate user of the risk
characterization results will be the RPM or other
risk manager for the site. This section therefore
outlines a presentation of material that is
designed to assist the risk manager in using risk
information to reach site-specific decisions.
8.6.1 SUMMARIZE RISK INFORMATION IN
TEXT
The final discussion of the risk
characterization population is a key component
of the risk characterization. The discussion
provides a means of placing the numerical
estimates of risk and hazard in the context of
what is known and what is not known about the
site and in the context of decisions to be made
about selection of remedies. At a minimum, the
discussion should include:
confidence that the key site-related
contaminants were identified and
discussion of contaminant
concentrations relative to background
concentration ranges;
a description of the various types of
cancer and other health risks present at
the site (e.g., liver toxicity,
neurotoxicity), distinguishing between
known effects in humans and those that
are predicted to occur based on animal
experiments;
level of confidence in the quantitative
toxicity information used to estimate
risks and presentation of qualitative
information on the toxicity of substances
not included in the quantitative
assessment;
level of confidence in the exposure
estimates for key exposure pathways
and related exposure parameter
assumptions;
the magnitude of the cancer risks and
noncancer hazard indices relative to the
Superfund site remediation goals in the
NCP (e.g., the cancer risk range of 10
-4
to 10
-7
and noncancer hazard index of
1.0);
Comment [A65]: EPA’s Risk Assessment
Guidance for Superfund Volume I: Human
Health Evaluation Manual (Part D, Standardized
Planning, Reporting, and Review of Superfund
Risk Assessments) provides planning tables for
use during the risk assessment process,
including risk characterization
. See
Part D,
Section 3.1.1 (page 3-9) for an overview of
using Planning Tables 7, 9 and 10: Calculation
of Chemical Cancer Risks and Non-Cancer
Hazards, Summary of Receptor Risk and
Hazards for COPCs, and Risk Summary,
respectively. Also See Appendix 1 for the
downloadable Planning Tables and instructions
for completing the tables. RAGS, Part D may be
found at:
http://www.epa.gov/oswer/riskassessment/rags
d/index.htm

Page 8-26
the major factors driving the site risks
(e.g., substances, pathways, and pathway
combinations);
the major factors reducing the certainty in
the results and the significance of these
uncertainties (e.g., adding risks over
several substances and pathways);
exposed population characteristics; and
comparison with site-specific health
studies, when available.
In addition, if the size of the potentially
exposed population is large, the presentation of
population results may be of assistance to the
RPM, especially characterization. in evaluating
risks in the context of current land use.
Individual
risk estimates based on the reasonable maximum
exposure (RME) should not be presented as
representative of a broadly defined population,
however.
8.6.2 SUMMARIZE RISK INFORMATION IN
TABLES
A tabular summary of the cancer risks and
noncancer hazard indices should be prepared for
all exposure pathways and land uses analyzed
and for all substances carried through the risk
assessment. These tables must be accompanied
by explanatory text, as described in the previous
section, and should not be allowed to stand alone
as the entire risk characterization. The sample
table formats presented in Chapter 6 and in
Exhibits 8-2 to 8-6 provide basic summary
formats. Exhibits 8-7 and 8-8 provide examples
of optional presentations that might assist in
visualization of the risk assessment results.
These bar graphs present the baseline cancer
risk estimates and noncancer hazard indices,
respectively, by pathway for an identified
subpopulation near the site. The stacked bars in
Exhibit 8-8 allow the reader to immediately
identify the pathway(s) contributing most to the
total hazard index as well as identify the
substances driving the indices in each pathway.
Reference levels are also provided (e.g., hazard
index of 1.0). Exhibits 8-5 and 8-6 introduced in
Section 8.4.1 provide examples of figures that
could help the RPM or other risk manager
visualize the impact of various assumptions and
uncertainties on the final risk or hazard index
estimate. In addition, graphics relating risk level
(or magnitude of hazard index) to concentrations
of substances in environmental media and cost
of "treatment" could allow the RPM or other risk
manager to weigh the benefits of various
remedial alternatives more easily. Examples of
the last type of graphics are presented in Part C
of this manual.
In a few succinct concluding paragraphs,
summarize the results of the risk
characterization step. It is the responsibility of
the risk assessment team members, who are
familiar with all steps in the site risk assessment,
to highlight the major conclusions of the risk
assessment. The discussion should summarize
both the qualitative and the quantitative findings
of cancer risks and noncancer hazards, and
properly qualify these by mention of major
assumptions and uncertainties in the assessment.

Page 8-27
EXHIBIT 8-7
EXAMPLE OF PRESENTATION OF RELATIVE CONTRIBUTION OF INDIVIDUAL
CHEMICALS TO EXPOSURE PATHWAY AND TOTAL CANCER RISK ESTIMATES
a
The risk of developing cancer is plotted on a log scale. A risk of 10
-4
indicates a probability of 1
chance in 10,000 of an individual developing cancar. Risks of 10
-5
and 10
-6
corre.pond to
probabilities of 1 chance in 100,000 and 1 chance in 1,000,000 respectively. Values in
parentheses represent EPA’s weight-of-evidence classification of the agent as a potential human
carcinogen: A = human carcinogen; and 82 = probable human carcinogen (with sufficient
evidence in animals and inadequate or no evidence in humans).

Page 8-28
EXHIBIT 8-8
EXAMPLE OF PRESENTATION OF RELATIVE CONTRIBUTION OF INDIVIDUAL
CHEMICALS TO EXPOSURE PATHWAY AND TOTAL HAZARD INDEX ESTIMATES
a
The hazard index is equal to the sum of the hazard quotients (i.e., exposure
leve/RfD for each chemical. It is not a probability; a hazard index or quotient of ~
1.0 indicates that it is unlikely for even sensitive populations to experience adverse
health effects.

Page 8-29
ENDNOTE FOR CHAPTER 8
1. The probability of an individual developing cancer following exposure to more than one carcinogen is the probability of developing
cancer from at least one of the carcinogens. For two carcinogens, the precise equation for estimating this probability is risk
1
+ risk
2
-
probability (risk
1
, risk
2
) where the latter term is the joint probability of the two risks occurring in the same individual. If the risk to agent
1 is distributed in the population independently of the risk to agent 2, the latter term would equal (risk
1
)(risk
2
). This equation can be
expanded to evaluate risks from more than two substances.

Page 8-30
REFERENCES FOR CHAPTER 8
Arcos, J., Woo, Y.T., and Lai, D. 1988. Data Base on Binary Combination Effects of Chemical Carcinogens. Environ. Carcino. Revs. [J.
Environ. Sci. Health Pt. C] 6:1-150.
Benjamin, J.R. and C.A. Cornell. 1970. Probability, Statistics, and Decision-making for Civil Engineers. McGraw Hill. New York.
Burmaster, D.E. and K. von Stackelberg. 1988. A New Method for Uncertainty and Sensitivity Analysis in Public Health Risk
Assessments at Hazardous Waste Sites Using Monte Carlo Techniques in a Spreadsheet. Pages 550-556 in Superfund '88,
Proceedings of the 9th National Conference. Washington, D.C. Sponsored by the Hazardous Materials Control Research Institute.
Downing, D. J., Gardner, R. H., and Hoffman, F. O. 1985. Response Surface Methodologies for Uncertainty Analysis in Assessment
Models. Technometrics 27:151-163.
Environmental Protection Agency (EPA). 1985. Methodology for Characterization of Uncertainty in Exposure Assessments. Prepared by
Research Triangle Institute. NTIS: PB85-240455.
Environmental Protection Agency (EPA). 1986a. Guidelines for Carcinogen Risk Assessment. 51 Federal Register 33992 (September 24,
1986).
Environmental Protection Agency (EPA). 1986b. Guidelines for the Health Risk Assessment of Chemical Mixtures. 51 Federal Register
34014 (September 24, 1986).
Environmental Protection Agency (EPA). 1986c. Guidelines for the Health Assessment of Suspect Developmental Toxicants. 51 Federal
Register 34028 (September 24, 1986).
Environmental Protection Agency (EPA). 1989. Proposed Amendments to the Guidelines for the Health Assessment of Suspect
Developmental Toxicants. 54 Federal Register 9386 (March 6, 1989).
Hoffman, F. O. and R. H. Gardner. 1983. Evaluation of Uncertainties in Radiological Assessment Models. In: Radiological Assessment,
A Textbook on Environmental Dose Analysis. Till, J. E., and H.R. Meyer, (eds.). Prepared for Office of Nuclear Reactor Regulation,
U.S. Nuclear Regulatory Commission. Washington, DC. NRC FIN B0766. NUREG/CR-3332.
Iman, R. L. and J. C. Helton. 1988. An Investigation of Uncertainty and Sensitivity Analysis Techniques for Computer Models. Risk
Analysis 8:71-90.
IRIS. Integrated Risk Information System (data base). 1989. U.S. Environmental Protection Agency, Office of Research and
Development.
Metcalf, D.R. and J.W. Pegram. 1981. Uncertainty Propagation in Probabilistic Risk Assessment: A Comparative Study. Transactions of
the American Nuclear Society 38:483-484.
Nuclear Regulatory Commission (NRC). 1983. PRA Procedures Guide - A Guide to the Performance of Probabilistic Risk Assessments
for Nuclear Power Plants. Office of Nuclear Regulatory Research, Washington, D.C. NUREG/CR-2300. Vol. 2.
Vesely, W. E. and D. M. Rasmuson. Uncertainties in Nuclear Probabilistic Risk Analysis. Risk Analysis 4:313-322.

CHAPTER 9
DOCUMENTATION, REVIEW, AND
MANAGEMENT TOOLS FOR THE ASSESOR,
REVIEWER, AND MANAGER
This chapter provides tools for the
documentation, review, and management of the
baseline risk assessment. These tools will help
ensure completeness and consistency throughout
the risk assessment and in the reporting of
assessment results. Section 9.1 provides
documentation tools (for risk assessors), Section
9.2 provides review tools (for risk assessment
reviewers), and Section 9.3 provides
management tools (for remedial project
managers [RPMs] and other decision-makers
concerned with the site).
9.1 DOCUMENTATION TOOLS
Throughout Chapters 4 to 8 of this
manual, guidance is provided to the risk assessor
on how to summarize and document many
beginning, intermediate, and final steps of the
risk assessment. The purpose of this section is to
consolidate that guidance, provide a final check
to ensure that all appropriate documentation has
been completed, and provide additional
information that should be helpful. This section
addresses (1) basic principles of documenting a
Superfund site risk assessment (e.g., key “dos”
and “don'ts,” the rationale for consistency), (2) a
suggested outline and guidance for the risk
assessment report, and (3) guidance for
providing risk assessment summaries in other
key reports.
9.1.1 BASIC PRINCIPLES
There are three basic principles for
documenting a baseline risk assessment:
(1) address the main objectives of the risk
assessment;
(2) communicate using clear, concise, and
relevant text, graphics, and tables; and
(3) use a consistent format.
Addressing the objectives. The
objectives of the baseline risk assessment -- to
help determine whether additional response
action is necessary at the site, to provide a basis
for determining residual chemical levels that are
adequately protective of public health, to
provide a basis for comparing potential health
impacts of various remedial alternatives, and to
help support selection of the "no-action"
remedial alternative (where appropriate) --
should be considered carefully during the
documentation of the risk assessment.
Recognizing these objectives early and
presenting the results of the risk assessment with
them in mind will assist the RPM and other
decision-makers at the site with readily
obtaining and using the necessary information to
evaluate the objectives. Failing to recognize the
importance of the objectives could result in a
risk assessment report that appears misdirected
and/or unnecessary.
Communicating. Clearly and concisely
communicating the relevant results of the risk
assessment can be one of the most important
aspects of the entire RI/FS. If done correctly, a
useful instrument for mitigating public health
threats will have been developed. If done
incorrectly, however, risks could be
underemphasized, possibly leading to the
occurrence of adverse health effects, or they
could be overemphasized, possibly leading to
the unnecessary expenditure of limited

Page 9-2
HELPFUL HINTS: COMMUNICATING THE
BASELINE RISK ASSESSMENT
Try to:
use a mix of well written text, illustrative
graphics, and summary tables;
explain the major steps and the results of the risk
assessment in terms easily understood by the
general public (and especially by members of
exposed or potentially exposed populations);
define highly technical terms early (e.g., in a
glossary); and
use a standard quantitative system -- preferably
the metric system -- throughout and units that are
the same where possible (e.g., ug/L for all water
concentrations).
Avoid:
the use of large blocks of text unbroken by any
headings, graphics, tables, lists, or other "visual
dividers";
the presentation of much quantitative information
within the text (rather than in tables); and
the drawing of "risk management" conclusions
(e.g., stating that the total or largest risk is
insignificant).
resources. See the box below for some helpful
hints on communicating the baseline risk
assessment.
Many skills for communicating the baseline risk
assessment also can be learned by reviewing the
literature on risk communication. The following
box lists just some of the literature that is
available. Courses on the subject also exist.
Using a consistent format. A consistent
format for all Superfund risk assessments is
strongly recommended for four important
reasons:
(1) it encourages consistency and
completeness in the assessment itself;
(2) it allows for easier review of the risk
assessments;
(3) it encourages consistent use of the
RISK COMMUNICATION GUIDANCE
Explaining Environmental Risk (EPA 1986)
Tools for Environmental Professionals Involved
in Risk Communication At Hazardous Waste
Facilities Undergoing Siting, Permitting, or
Remediation (Bean 1987)
Improving Dialogue with Communities: A Short
Guide for Government Risk Communication
(NJDEP 1987)
Seven Cardinal Rules of Risk Communication
(EPA 1988a)
results by RPMs and other decision-
makers; and
(4) it helps demonstrate to the public and
others that risk assessments are
conducted using the same framework
(if not the same specific procedures).
Using other formats can lead to slower
review times, different interpretations of similar
results, and the charge that risk assessments are
inappropriately being conducted differently from
one site to another. The following subsections
provide guidance on the use of consistent
formats.
9.1.2 BASELINE RISK ASSESSMENT
REPORT
The baseline risk assessment report
references and supports the RI/FS report.
Depending on the site, the risk assessment report
can range from a small, simple document with
no appendices that can simply be added to the
RI/FS report as a chapter, to a large, complex
document with many appendices that can "stand
alone." This subsection provides general
guidance on how to organize the baseline risk
assessment report and which information should
be included in the report. More detailed
guidance, however, is found by following the
guidance in previous chapters of this manual.
Careful use of that guidance will ensure a well-
documented baseline risk assessment report.

Page 9-3
Exhibit 9-1 provides a suggested outline
for the full baseline risk assessment report. This
outline generally follows the flow of the risk
assessment and the organization of this manual.
The "bulleted" items are not necessarily section
headings, but rather are often items that should
be considered when writing the report. Note that,
as with the manual, not all components of the
outline are applicable to all sites. This is
especially true if the risk assessment report will
be a chapter in the RI/FS report. At some sites,
and especially when the risk assessment report
will be a stand-alone document, more site-
specific items could be added to the report.
Examples of tables and graphics that
should be included in the report are presented as
exhibits in previous chapters of this manual.
Note, however, that additional tables and
graphics may be useful.
This suggested outline may be used as a
review guide by risk assessors (and risk
assessment reviewers) to ensure that all
appropriate components of the assessment have
been addressed. Section 9.2 addresses review
tools in greater detail.
9.1.3 OTHER KEY REPORTS
Two important reports that must include
summaries of the baseline risk assessment are
(1) the remedial investigation/feasibility study
(RI/FS) report and (2) the record of decision
(ROD) report.
Summary for the RI/FS report. One of
the chapters of the RI/FS typically is devoted to
a summary of the baseline risk assessment. Part
of this summary should address the human
health evaluation (the other part should address
the environmental evaluation). The human
health summary should follow the same outline
as the full baseline risk assessment report, with
almost each section of the summary being a
distillation of each full report chapter. The risk
characterization chapter is an exception,
however, in that it could be included in the
RI/FS report essentially unchanged. Most tables
and graphics should be included unchanged as
well. For more information, see Guidance for
Conducting Remedial Investigations and
Feasibility Studies Under CERCLA (EPA
1988b).
Summary for the ROD report. The
ROD documents the remedial action selected for
a site. It consists of three basic components: (1)
a Declaration; (2) a Decision Summary; and (3)
a Responsiveness Summary. The second
component, a Decision Summary, provides an
overview of the site-specific factors and
analyses that led to the selection of the remedy.
Included in this component is a summary of site
risks. As with the risk assessment summary for
the RI/FS report, the summary for the ROD
report should follow the same outline as the full
risk assessment. This summary, however, should
be much more abbreviated than the RI/FS
summary, although care must be taken to
address all of the relevant site-specific results.
For more information, see Interim Final
Guidance on Preparing Superfund Decision
Documents: The Proposed Plan, the Record of
Decision, Explanation of Significant
Differences, and the Record of Decision
Amendment (EPA 1989).
9.2 REVIEW TOOLS
This section provides guidelines on
reviewing a risk assessment report. A checklist
of many essential criteria that should be
adequately addressed in any good risk
assessment is provided (Exhibit 9-2). The
checklist touches upon issues that are often
problematic and lead to difficulty and delay in
the review of risk assessments. Principal
questions are presented in the checklist with
qualifying statements or follow-up questions, as
well as references to appropriate chapters and
sections of this manual. The checklist is
intended as a guide to assist the preliminary
reviewer by ensuring that critical issues
concerning the quality and adequacy of
information are not overlooked at the screening
level review of risk assessments. Experience has
shown that reviewers should pay particular
attention to the following concerns.
Were all appropriate media sampled?
Were any site-related chemicals (e.g.,
human carcinogens) eliminated from
analysis without appropriate
justification?

Page 9-4
EXHIBIT 9-1
SUGGESTED OUTLINE FOR A BASELINE RISK ASSESSMENT REPORT
1.0 INTRODUCTION
1.1 Overview
General problem at site
Site-specific objectives of risk assessment
1.2 Site Background
Site description
Map of site
General history
— Ownership
— Operations
— Contamination
Significant site reference points
Geographic location relative to offsite areas of interest
General sampling locations and media
1.3 Scope of Risk Assessment
Complexity of assessment and rationale
Overview of study design
1.4
Organization of Risk Assessment Report
2.0 IDENTIFICATION OF CHEMICALS OF POTENTIAL CONCERN
2.1 General Site-specific Data Collection Considerations
Detailed historical information relevant to data collection
Preliminary identification of potential human exposure
Modeling parameter needs
Background sampling
Sampling locations and media
Sampling methods
QA/QC methods
Special analytical services (SAS)
2.2 General Site-specific Data Evaluation Considerations
Steps used (including optional screening procedure steps, if used)
QA/QC methods during evaluation
General data uncertainty
2.3 Environmental Area or Operable Unit 1 (Complete for All Media)
Area- and media-specific sample collection strategy (e.g., sample size, sampling locations)
Data from site investigations
(continued)

Page 9-5
EXHIBIT 9-1 (CONTINUED)
SUGGESTED OUTLINE FOR A BASELINE RISK ASSESSMENT REPORT
Evaluation of analytical methods
Evaluation of quantitation limits
Evaluation of qualified and coded data
Chemicals in blanks
Tentatively identified compounds
Comparison of chemical concentrations with background
Further limitation of number of chemicals
Uncertainties, limitations, gaps in quality of collection or analysis
2.4 Environmental Area or Operable Unit 2 (Repeat for All Areas or Operable Units, As
Appropriate)
2.X Summary of Chemicals of Potential Concern
3.0
EXPOSURE ASSESSMENT
3.1
Characterization of Exposure Setting
Physical Setting
—
Climate
—
Vegetation
—
Soil type
—
Surface hydrology
—
Ground-water hydrology
Potentially Exposed Populations
—
Relative locations of populations with respect to site
—
Current land use
—
Potential alternate future land uses
—
Subpopulations of potential
concern
3.2 Identification of Exposure Pathways
Sources and receiving media
Fate and transport in release media
Exposure points and exposure routes
Integration of sources, releases, fate and transport mechanisms, exposure points, and exposure
routes into complete exposure pathways
Summary of exposure pathways to be quantified in this assessment
3.3 Quantification of Exposure
Exposure concentrations
Estimation of chemical intakes for individual pathways
(continued)

Page 9-6
EXHIBIT 9-1 (CONTINUED)
SUGGESTED OUTLINE FOR A BASELINE RISK ASSESSMENT REPORT
3.4 Identification of Uncertainties
Current and future land-use
Environmental sampling and analysis
Exposure pathways evaluated
Fate and transport modeling
Parameter values
3.5 Summary of Exposure Assessment
4.0 TOXICITY ASSESSMENT
4.1 Toxicity Information for Noncarcinogenic Effects
Appropriate exposure periods for toxicity values
Up-to-date RfDs for all chemicals
One- and ten-day health advisories for shorter-term oral exposures
Overall data base and the critical study on which the toxicity value is based (including the
critical effect and the uncertainty and modifying factors used in the calculation)
Effects that may appear at doses higher than those required to elicit the critical effect
Absorption efficiency considered
4.2 Toxicity Information for Carcinogenic Effects
Exposure averaged over a lifetime
Up-to-date slope factors for all carcinogens
Weight-of-evidence classification for all carcinogens
Type of cancer for Class A carcinogens
Concentration above which the dose-response curve is no longer linear
4.3 Chemicals for Which No EPA Toxicity Values Are Available
Review by ECAO
Qualitative evaluation
Documentation/justification of any new toxicity values developed
4.4 Uncertainties Related to Toxicity Information
Quality of the individual studies
Completeness of the overall data base
4.5 Summary of Toxicity Information
5.0 RISK CHARACTERIZATION
5.1 Current Land-use Conditions
Carcinogenic risk of individual substances
Chronic hazard quotient calculation (individual substances)
Subchronic hazard quotient calculation (individual substances)
(continued)

Page 9-7
EXHIBIT 9-1 (CONTINUED)
SUGGESTED OUTLINE FOR A BASELINE RISK ASSESSMENT REPORT
Shorter-term hazard quotient calculation (individual substances)
Carcinogenic risk (multiple substances)
Chronic hazard index (multiple substances)
Subchronic hazard index (multiple substances)
Shorter-term hazard index calculation (multiple substances)
Segregation of hazard indices
Justification for combining risks across pathways
Noncarcinogenic hazard index (multiple pathways)
Carcinogenic risk (multiple pathways)
5.2 Future Land-use Conditions
Carcinogenic risk of individual substances
Chronic hazard quotient calculation (individual substances)
Subchronic hazard quotient calculation (individual substances)
Carcinogenic risk (multiple substances)
Chronic hazard index (multiple substances)
Subchronic hazard index (multiple substances)
Segregation of hazard indices
Justification for combining risks across pathways
Noncarcinogenic hazard index (multiple pathways)
Carcinogenic risk (multiple pathways)
5.3
Uncertainties
Site-specific uncertainty
factors
—
Definition of physical setting
—
Model applicability and assumptions
—
Parameter values
for fate/transport and exposure calculations
—
Summary of toxicity assessment
uncertainty
—
Identification of potential health
effects
—
Derivation of toxicity value
—
Potential for synergistic or ant
agonistic interactions
—
Uncertainty in
evaluating less-than-lifetime exposures
5.4 Comparison of Risk Characterization Results to Human Studies
ATSDR health assessment
Site-specific health studies (pilot studies or epidemiological studies)
Incorporation of studies into the overall risk characterization
5.5 Summary Discussion and Tabulation of the Risk Characterization
Key site-related contaminants and key exposure pathways identified
Types of health risk of concern
Level of confidence in the quantitative information used to estimate risk
Presentation of qualitative information on toxicity
(continued)

Page 9-8
EXHIBIT 9-1 (CONTINUED)
SUGGESTED OUTLINE FOR A BASELINE RISK ASSESSMENT REPORT
Confidence in the key exposure estimates for the key exposure pathways
Magnitude of the carcinogenic and noncarcinogenic risk estimates
Major factors driving risk
Major factors contributing to uncertainty
Exposed population characteristics
Comparison with site-specific health studies
6.0 SUMMARY
6.1 Chemicals of Potential Concern
6.2 6.2 Exposure Assessment
6.3 6.3 Toxicity Assessment
6.4 6.4 Risk Characterization

Page 9-9
EXHIBIT 9-2
REVIEWER CHECKLIST
1.0 GENERAL CONCERNS
Were the site-specific objective(s) of the risk assessment stated? (HHEM - 1)
Was the scope of the assessment described (e.g., in terms of the complexity of the assessment and
rationale, data needs, and overview of the study design)? (HHEM - 1.1.1, 3.5)
Was an adequate history of site activities provided, including a chronology of land use (e.g.,
specifying agriculture, industry, recreation, waste deposition, and residential development at the
site)? (HHEM - 2.1.4, 9.1)
Was an initial qualitative overview of the nature of contamination included (e.g., specifying in a
general manner the kinds of contaminants, media potentially contaminated)? (HHEM - 2.1.4,
9.1)
Was a general map of the site depicting boundaries and surface topography included, which
illustrates site features, such as fences, ponds, structures, as well as geographical relationships
between specific potential receptors and the site? (HHEM - 2.1.4, 9.1)
2.0 CONCERNS IN REVIEWING DATA COLLECTION AND EVALUATION
2.1 Data Collection
Was an adequate "conceptual model" of the site discussed? (HHEM - 4.2)
— a qualitative discussion of potential or suspected sources of contamination, types and
concentrations of contaminants detected at the site, potentially contaminated media, as
well as potential exposure pathways and receptors
Was an adequate Data Quality Objectives (DQO) statement provided? (HHEM - 4.1.4)
— a statement specifying both the qualitative and quantitative nature of the sampling data, in
terms of relative quality and intent for use, issued prior to data collection, which helps to
ensure that the data collected will be appropriate for the intended objectives of the study
Were key site characteristics documented? (HHEM - 4.3, 4.5)
— soil/sediment parameters (e.g., particle size, redox potential, mineral class, organic
carbon and clay content, bulk density, and porosity)
— hydrogeological parameters (e.g., hydraulic gradient, pH/Eh, hydraulic conductivity,
location, saturated thickness, direction, and rate of flow of aquifers, relative location of
bedrock layer)
(continued)

Page 9-10
EXHIBIT 9-2 (CONTINUED)
REVIEWER CHECKLIST
— hydrological parameters (e.g., hardness, pH, dissolved oxygen, salinity, temperature, total
suspended solids, flow rates, and depths of rivers or streams; estuary and embayment
parameters such as tidal cycle, range, and area; as well as lake parameters such as area,
volume, depth, and depth to thermocline)
— meteorological parameters (e.g., direction of prevailing wind, average wind speed,
temperature, humidity, annual average and 24 hour maximum rainfall)
Were all appropriate media sampled? (HHEM - 4.4, 4.5, 4.6)
— was there adequate justification for any omissions?
— were literature estimates employed for omissions in background sampling and were they
referenced properly?
Were all key areas sampled, based on all available information (e.g., preliminary assessment,
field screening)? (HHEM - 4.4, 4.5, 4.6)
Did sampling include media along potential routes of migration (e.g., between the contaminant
source and potential future exposure points)? (HHEM - 4.5, 4.6)
Were sampling locations consistent with nature of contamination (e.g., at the appropriate
depth)? (HHEM - 4.5, 4.6)
Were sampling efforts consistent with field screening and visual observations in locating "hot
spots"? (HHEM - 4.5, 4.6)
Were detailed sampling maps provided, indicating the location, type (e.g., grab, composite,
duplicate), and numerical code of each sample? (HHEM - 5.10)
Did sampling include appropriate QA/QC measures (e.g., replicates, split samples, trip and
field blanks)? (HHEM - 4.7, 5.4)
Were background samples collected from appropriate areas (e.g., areas proximate to the site,
free of potential contamination by site chemicals or anthropogenic sources, and similar to the
site in topography, geology, meteorology, and other physical characteristics)? (HHEM - 4.4,
5.7)
2.2 Data Evaluation
Were any site-related chemicals (e.g., human carcinogens) eliminated from analysis without
appropriate justification? (HHEM - 5.9)
(continued)

Page 9-11
EXHIBIT 9-2 (CONTINUED)
REVIEWER CHECKLIST
— as infrequently detected chemicals (HHEM - 5.3.3, 5.9.3)
— as non-detects in a specific medium without employing a "proxy" concentration (HHEM
5.3)
— as common laboratory contaminants even though sample concentrations were significantly
higher than that found in blanks? (HHEM - 5.5)
— as present at a "ubiquitous level"? (HHEM - 5.7)
Were inappropriate "proxy concentrations" assigned to site-related chemicals? (HHEM - 5.3)
— was a value of zero or the instrument detection limit (IDL) assigned?
— was an erroneous sample-specific quantitation limit employed?
Were appropriate analytical methods employed for collection of data upon which risk estimates
are based? (HHEM - 5.2)
— were the methods consistent with the requisite level of sensitivity?
— were established procedures with adequate QA/QC measures employed?
Did the data meet the Data Quality Objectives (DQO)? (HHEM - 4.1.4)
— were the sampling methods consistent with the intended uses of data?
Were appropriate data qualifiers employed? (HHEM - 5.4)
Were special analytical services (SAS) employed when appropriate? (HHEM - 5.3)
— was SAS employed as an adjunct to routine analysis in cases where certain contaminants
were suspected at low levels, as non-TCL chemicals, in non-standard matrices, or in
situations requiring a quick turnaround time?
3.0 CONCERNS IN REVIEWING THE EXPOSURE ASSESSMENT
Were "reasonable maximum exposures" considered (i.e., the highest exposures that are
reasonably expected to occur)? (HHEM - 6.1.2, 6.4.1, 6.6)
Were current and future land uses considered? (HHEM - 6.1.2, 6.2)
(continued)

Page 9-12
EXHIBIT 9-2 (CONTINUED)
REVIEWER CHECKLIST
Was residential land use considered as an alternative future land use? (HHEM - 6.2.2)
— if not, was a valid rationale provided?
Were all potential sensitive subpopulations considered (e.g., elderly people, pregnant or nursing
women, infants and children, and people with chronic illnesses)? (HHEM - 6.2.2)
Were all significant contaminant sources considered? (HHEM - 6.3.1)
Were all potential contaminant release mechanisms considered, such as volatilization, fugitive
dust emission, surface runoff/overland flow, leaching to ground water, tracking by
humans/animals, and soil gas generation? (HHEM - 6.3.1)
Were all potential contaminant transport pathways considered, such as direct air transport
downwind, diffusion in surface water, surface water flow, ground-water flow, and soil gas
migration? (HHEM 6.3)
Were all relevant cross-media transfer effects considered, such as volatilization to air, wet
deposition, dry deposition, ground-water discharge to surface, and ground-water recharge from
surface water? (HHEM - 6.3)
Were all media potentially associated with exposure considered? (HHEM - 6.2, 6.3)
Were all relevant site-specific characteristics considered, including topographical,
hydrogeological, hydrological, and meteorological parameters? (HHEM - 6.1, 6.3)
Were all possible exposure pathways considered? (HHEM - 6.3)
— was a valid rationale offered for exclusion of any potential pathways from quantitative
evaluation?
Were all "spatial relationships" adequately considered as factors that could affect the level of
exposure (e.g., hot spots in an area that is frequented by children, exposure to ground water
from two aquifers that are not hydraulically connected and that differ in the type and extent of
contamination)? (HHEM - 6.2, 6.3)
Were appropriate approaches employed for calculating average exposure concentrations?
(HHEM 6.4, 6.5)
— was a valid rationale provided for using geometric or arithmetic means?
Were appropriate or standard default values used in exposure calculations (e.g., age-specific
body weights, appropriate exposure frequency and duration values)? (HHEM - 6.4, 6.5, 6.6)
(continued)

Page 9-13
EXHIBIT 9-2 (CONTINUED)
REVIEWER CHECKLIST
4.0 CONCERNS IN REVIEWING THE TOXICITY ASSESSMENT
Was the exclusion of any carcinogen from analysis adequately justified (e.g., were "weight-
ofevidence" classifications and completeness of exposure pathways considered in this
decision)? (HHEM - 5.9, 7.3)
Were appropriate "route-to-route" extrapolations performed in cases where a toxicity value was
applied across differing routes of exposure? (HHEM - 7.5.1, 8.1.2)
— were the extrapolations based on appropriate guidance?
Were appropriate toxicity values employed based on the nature of exposure? (HHEM - 7.4, 7.5)
— were subchronic vs. chronic RfDs applied correctly based on the duration of exposure?
— were all sensitive subpopulations, such as pregnant or nursing women potentially requiring
developmental RfDs (RfDdt s), considered in the selection of the toxicity values used?
Were the toxicity values that were used consistent with the values contained within the
Integrated Risk Information System (IRIS) or other EPA documents? (HHEM - 7.4, 7.5)
5.0 CONCERNS IN REVIEWING THE RISK CHARACTERIZATION
Were exposure estimates and toxicity values consistently expressed as either intakes or
absorbed doses for each chemical taken through risk characterization? (HHEM - 8.1.2)
— was a valid rationale given for employing values based on absorbed dose?
Were all site-related chemicals that were analyzed in the exposure assessment considered in
risk characterization? (HHEM - 8.1.2)
— were inconsistencies explained?
Were risks appropriately summed only across exposure pathways that affect the same
individual or population subgroup, and in which the same individual or population subgroup
faces the "reasonable maximum exposure," based on the assumptions employed in the exposure
assessment? (HHEM 8.3)
Were sources of uncertainty adequately characterized? (HHEM - 8.4)

Page 9-14
Were current and future land uses
considered?
Were all significant contaminant sources
considered?
Were appropriate or standard default
values used in exposure calculations?
Were the toxicity values that were used
consistent with the values contained
within the Integrated Risk Information
System (IRIS) or other EPA documents?
Although the checklist addresses many
pertinent issues, it is not a complete listing of all
potential concerns, since this objective is beyond
the scope of a preliminary review tool. In
addition, some of the concerns listed are not
necessarily appropriate for all risk assessment
reports.
The recommended steps in reviewing a
risk assessment report are as follows:
(1) compare the risk assessment report
outline to the suggested outline in
Section 9.1 of this chapter (i.e., Exhibit
9-1);
(2) use the checklist in this section (i.e.,
Exhibit 9-2); and
(3) conduct a comprehensive review.
The outline (Exhibit 9-1) and the checklist
(Exhibit 9-2) are intended only as tools to assist
in a preliminary review of a risk assessment, and
are not designed to replace the good judgment
needed during the comprehensive review. These
two tools should provide a framework, however,
for the timely screening of risk assessments by
reviewers with a moderate level of experience in
the area. If these steps are followed in order,
then some of the major problems with a risk
assessment report (if any) can be identified
before significant resources are expended during
the comprehensive review.
9.3 MANAGEMENT TOOLS
This section provides a concise checklist
for the RPM to use in carrying out their role in
the risk assessment process (see Exhibit 9-3).
Other decision-makers at the site also may find
this checklist useful. Specific points at which the
managers should be involved, or may be called
upon to become involved, during the risk
assessment are discussed in Chapters 4 through
8 of the manual. This checklist extracts
information from those chapters, and also
includes pointers on planning and involvement
for the manager. The purpose of the checklist is
to involve managers in the direction and
development of the risk assessment and thereby
avoid serious mistakes or costly misdirections in
focus or level of effort.
Although the checklist is shaped to
suggest when and how the manager should
become involved in the risk assessment process,
it is assumed that part of the manager's
involvement will require consultation with
technical resources available in the region or
state. The checklist advises consulting the
"regional risk assessment support staff" at a
number of points in the process. This contact
may not be one person, but could be a number of
different technical people in the region, such as a
toxicologist, hydrogeologist, or other technical
reviewer. The manager should become aware of
the resources available to him or her, and use
them when appropriate to ensure that the risk
assessment developed is useful and accurate.

Page 9-15
EXHIBIT 9-3
CHECKLIST FOR MANAGER INVOLVEMENT
1. GETTING ORGANIZED
Ensure that the workpl
an for the risk assessment contractor support is
in place (if
needed).
Identify EPA risk assessment support personnel (to be used throughout the risk assessment
process).
Gather relevant information, such as appropriate risk assessment guidances and site-specific data
and reports.
Identify
available state, county, and other non-EPA resources.
2. BEFORE
THE SCOPING MEETING
Make initial co
ntact with risk assessor.
Provide risk assessor with available
guidances and site data.
Determine
(or review) data collection needs for risk assessment, considering:
-- modeling parameter needs;
-- type and location of background
samples;
-- the preliminary identification
of pot
ential human exposure;
-- strategies for sample collection appropriate to site/risk assessment data needs;
-- statistical methods;
-- QA/QC measures
of particular importance to risk assessment;
-- special analytical
services
(SAS) needs;
-- alternate future land
use; and
-- location(s) in ground water that will be u
sed to evaluate future ground-water exposures.
3. A
T THE SCOPING MEETING
Present risk assessment data collection needs.
Ensure that the risk assessment data collection needs will be considered in development of the
sampling and analysis plan.
Where limited resources require that less-than-optimal sampling be conducted, discuss potential
impacts on risk assessment results.
4. AFTER THE SCOPING MEETING
Ensure that the risk assessor reviews and approves the sampling and analysis plan. C
Consult with ATSDR if human monitoring is planned.
(continued)

Page 9-16
EXHIBIT 9-3 (continued)
CHECKLIST FOR MANAGER INVOLVEMENT
5. DURING SAMPLING AND ANALYSIS
Ensure that risk assessment needs are being met during sampling.
Provide risk assessor with any preliminary sampling results so that he/she can determine if
sampling should be refocused.
Consult with ATSDR to obtain a status report on any human monitoring that is being conducted.
Provide any results to risk assessor.
6. DURING DEVELOPMENT OF RISK ASSESSMENT
Meet with risk assessor to discuss basis of excluding chemicals from the risk assessment (and
developing the list of chemicals of potential concern). Confirm appropriateness of excluding
chemicals.
Confirm determination of alternate future land use.
Confirm location(s) in ground water that will be used to evaluate future ground-water exposures.
Understand basis for selection of pathways and potentially exposed populations.
Facilitate discussions between risk assessor and EPA risk assessment support personnel on the
following points:
- the need for any major exposure, fate, and transport models (e.g., air or ground-water
dispersion models) used;
- site-specific exposure assumptions;
- non-EPA-derived toxicity values; and
- appropriate level of detail for uncertainty analysis, and the degree to which uncertainties
will be quantified.
Discuss and approve combination of pathway risks and hazard indices.
Ensure that end results of risk characterization have been compared with ATSDR health
assessments and other site-specific human studies that might be available.
7. REVIEWING THE RISK ASSESSMENT
Allow sufficient time for review and incorporation of comments.
Ensure that reviewers' comments are incorporated
(continued)

Page 9-17
EXHIBIT 9-3 (continued)
CHECKLIST FOR MANAGER INVOLVEMENT
8. COMMUNICATING THE RISK ASSESSMENT
Plan a briefing among technical staff to discuss significant findings and uncertainties.
Discuss development of graphics, tools, and presentations to assist risk management decisions.
Consult with other groups (e.g., community relations staff), as appropriate.
Brief upper management.

Page 9-18
REFERENCES FOR CHAPTER 9
Bean, M.C. (CH2M Hill). 1987. Tools for Environmental Professionals Involved in Risk Communication at Hazardous Waste
Facilities Undergoing Siting, Permitting, or Remediation. Presented at the Air Pollution Control Association Annual Meeting.
New York. June 21-26, 1987.
Environmental Protection Agency (EPA). 1986. Explaining Environmental Risk. Office of Toxic Substances.
Environmental Protection Agency (EPA). 1988a. Seven Cardinal Rules of Risk Communication. Office of Policy Analysis.
Environmental Protection Agency (EPA). 1988b. Guidance for Conducting Remedial Investigations and Feasibility Studies Under
CERCLA. Office of Emergency and Remedial Response. (OSWER Directive 9355.3-01).
Environmental Protection Agency (EPA). 1989. Interim Final Guidance on Preparing Superfund Decision Documents: The Proposed
Plan, the Record of Decision, Explanation of Significant Differences, and the Record of Decision Amendment. Office of
Emergency and Remedial Response. (OSWER Directive 9355.3-02).
New Jersey Department of Environmental Protection (NJDEP). 1987. Improving Dialogue with Communities: A Short Guide for
Government Risk Communication. Division of Science and Research.

CHAPTER 10
RADIATION RISK ASSESSMENT
GUIDANCE
There are many sites contaminated with
radioactive substances that are included on the
National Priorities List (NPL), and additional
sites are expected in future NPL updates. This
chapter provides supplemental baseline risk
assessment guidance for use at these sites. This
guidance is intended as an overview of key
differences in chemical and radionuclide
assessments, and not as a comprehensive, stand-
alone approach for assessing the risks posed by
radiation.
The reader should be familiar with the
guidance provided in Chapters 2 through 9
before proceeding further in Chapter 10.
Although the discussions in the previous
chapters focus primarily on chemically
contaminated sites, much of the information
presented is also applicable to the evaluation of
radioactively contaminated Superfund sites. For
consistency and completeness, the topics
discussed in each section of this chapter parallel
the topics covered in each of the previous
chapters.
After a brief introduction to some of the
basic principles and concepts of radiation
protection (Section 10.1), seven additional areas
are addressed:
(1) Regulation of Radioactively
Contaminated Sites (Section 10.2);
(2) Data Collection (Section 10.3);
(3) Data Evaluation (Section 10.4);
(4) Exposure and Dose Assessment
(Section 10.5);
ACRONYMS, SYMBOLS, AND UNITS FOR
CHAPTER 10
A(t) = Activity at Time t
Bq = Becquerel
Ci = Curie
CLP = Contract Laboratory Program
D = Absorbed Dose
DCF = Dose Conversion Factor Per Unit Intake
HE = Effective Dose Equivalent
HT = Dose Equivalent Averaged Over Tissue or Organ
T
HE,50 = Committed Effective Dose Equivalent Per
Intake
HT,50 = Committed Dose Equivalent Averaged Over
Tissue T
LET = Linear Energy Transfer
LLD = Lower Limit of Detection
MeV = Million Electron Volts
N = Modifying Factor in the Definition of Dose
Equivalent
pCi = PicoCurie (10
-12
Ci)
Q = Quality Factor in Definition of Dose Equivalent
RBE = Relative Biological Effectiveness
SI = International System of Units
Sv = Sievert
T = Tissue or Target Organs
wT = Weighting Factor in the Definition of Effective
Dose Equivalent and Committed Effective Dose
Equivalent
(5) Toxicity Assessment (Section 10.6);
(6) Risk Characterization (Section 10.7);
and
(7) Documentation, Review, and
Management and Tools for the Risk
Assessor, Reviewer, and Manager
(Section 10.8).

Page 10-2
DEFINITIONS FOR CHAPTER 10
Absorbed Dose (D). The mean energy imparted by ionizing radiation to matter per unit mass. The special SI unit of absorbed dose is the gray
(Gy); the conventional unit is the rad (1 rad = 0.01 Gy).
Becquerel (Bq). One nuclear disintegration per second; the name for the SI unit of activity. 1 Bq = 2.7 x 10
-11
Ci.
Committed Dose Equivalent (H T,50 ). The total dose equivalent (averaged over tissue T) deposited over the 50-year period following the
intake of a radionuclide.
Committed Effective Dose Equivalent (H E,50 ). The weighted sum of committed dose equivalents to specified organs and tissues, in
analogy to the effective dose equivalent.
Curie (Ci). 3.7 x 10
10
nuclear disintegrations per second, the name for the conventional unit of activity. 1 Ci = 3.7 x 10
10
Bq.
Decay Product(s). A radionuclide or a series of radionuclides formed by the nuclear transformation of another radionuclide which, in this
context, is referred to as the parent.
Dose Conversion Factor (DCF). The dose equivalent per unit intake of radionuclide.
Dose Equivalent (H). The product of the absorbed dose (D), the quality factor (Q), and any other modifying factors (N). The SI unit of dose
equivalent is the sievert (Sv); the conventional unit is the rem (1 rem = 0.01 Sv).
Effective Dose Equivalent (H E). The sum over specified tissues of the products of the dose equivalent in a tissue or organ (T) and the
weighting factor for that tissue.
External Radiation. Radiations incident upon the body from an external source.
Gray (Gy). The SI unit of absorbed dose. 1Gy = 1 Joule kg
-1
= 100 rad.
Half-Life (physical, biological, or effective). The time for a quantity of radionuclide, i.e., its activity, to diminish by a factor of a half
(because of nuclear decay events, biological elimination of the material, or both.).
Internal Radiation. Radiation emitted from radionuclides distributed within the body.
Ionizing Radiation. Any radiation capable of displacing electrons from atoms or molecules, thereby producing ions.
Linear Energy Transfer (LET). A measure of the rate of energy absorption, defined as the average energy imparted to the absorbing medium
by a charged particle per unit distance (KeV per um).
Nuclear Transformation. The spontaneous transformation of one radionuclide into a different nuclide or into a different energy state of the
same nuclide.
Quality Factor (Q). The principal modifying factor that is employed in deriving dose equivalent, H, from absorbed dose, D; chosen to
account for the relative biological effectiveness (RBE) of the radiation in question, but to be independent of the tissue or organ under
consideration, and of the biological endpoint. For radiation protection purposes, the quality factor is determined by the linear energy transfer
(LET) of the radiation.
Rad. The conventional unit for absorbed dose of ionizing radiation; the corresponding SI unit is the gray (Gy); 1 rad = 0.01 Gy = 0.01
Joule/kg.
Rem. An acronym of radiation equivalent man, the conventional unit of dose equivalent; the corresponding SI unit is the Sievert; 1 Sv = 100
rem.
Sievert (Sv). The special name for the SI unit of dose equivalent. 1 Sv = 100 rem.
Slope Factor. The age-averaged lifetime excess cancer incidence rate per unit intake (or unit exposure for external exposure pathways) of a
radionuclide.
Weighting Factor (w T). Factor indicating the relative risk of cancer induction or hereditary defects from irradiation of a given tissue or
organ; used in calculation of effective dose equivalent and committed effective dose equivalent.

There are special hazards associated with
handling radioactive waste and EPA strongly
recommends that a health physicist experienced
in radiation measurement and protection be
consulted prior to initiating any activities at a
site suspected of being contaminated with
radioactive substances. EPA also recommends
that the remedial project manager (RPM) or on-
scene coordinator (OSC) should designate both a
chemical risk assessor and a radiation risk
assessor. These individuals should work closely
with each other and the RPM to coordinate
remedial activities (e.g., site scoping, health and
safety planning, sampling and analysis) and
exchange information common to both chemical
and radionuclide assessments, including data on
the physical characteristics of the site,
potentially impacted populations, pathways of
concern, and fate and transport models used. At
the conclusion of the remedial
investigation/feasibility study (RI/FS) process,
the RPM should issue a single report that
summarizes and integrates the results from both
the chemical and the radiation risk assessments.
A two-phase evaluation is described for
the radiation risk assessment. As discussed in
Section 10.5, procedures established by the
International Commission on Radiological
Protection (ICRP 1979) and adopted by EPA in
Federal Guidance Report No. 11 (EPA 1988)
are used to estimate the radiation dose
equivalent to humans from potential exposures
to radionuclides through all pertinent exposure
pathways at a site. Those estimates of dose
equivalent may be used for comparison with
established radiation protection standards and
criteria. However, this methodology was
developed for regulation of occupational
radiation exposures for adults and is not
completely applicable for estimating health risk
to the general population at a Superfund site.
Therefore, a separate methodology is presented
in Section 10.7.2 for estimating health risk,
based on the age-averaged lifetime excess
cancer incidence per unit intake (and per unit
external exposure) for radionuclides of concern.
Radiation risk assessments for Superfund sites
should include estimates of both the dose
equivalent computed as described in Section
10.5, and the health risk attributable to
Page 10-3
radionuclide exposures computed using the
approach described in Section 10.7.
Only summary-level information is
presented in this chapter, and references are
provided to a number of supporting technical
documents for further information. In particular,
the reader is encouraged to consult Volume 1 of
the Background Information Document for the
Draft Environmental Impact Statement for
Proposed NESHAPS for Radionuclides (EPA
1989a) for a more comprehensive discussion of
EPA's current risk assessment methodology for
radionuclides.
For additional radiation risk assessment
information and guidance, RPMs and other
interested individuals can contact the Office of
Radiation Programs (ORP) within EPA
headquarters at 202-475-9630 (FTS 475-9630).
Interested individuals also can contact the
Regional Radiation Program Managers within
each of the EPA regional offices for guidance
and health physics support.
10.1 RADIATION PROTECTION
PRINCIPLES AND CONCEPTS
Radioactive atoms undergo spontaneous
nuclear transformations and release excess
energy in the form of ionizing radiation. Such
transformations are referred to as radioactive
decay. As a result of the radioactive decay
process, one element is transformed into
another; the newly formed element, called a
decay product, will possess physical and
chemical properties different from those of its
parent, and may also be radioactive. A
radioactive species of a particular element is
referred to as a radionuclide or radioisotope. The
exact mode of radioactive transformation for a
particular radionuclide depends solely upon its
nuclear characteristics, and is independent of the
nuclide's chemical characteristics or physical
state. A fundamental and unique characteristic of
each radionuclide is its radioactive half-life,
defined as the time required for one half of the
atoms in a given quantity of the radionuclide to
decay. Over 1,600 different radionuclides have
been identified to date, with half-lives ranging
from fractions of a second to millions of years.
Selected radionuclides of potential importance at
Superfund sites are listed in Exhibit 10-1.
Comment [A66]: The Superfund program has
updated its approach for assessing radiation
risks at sites. For current information, consult
EPA’s Radiation Risk Assessment Guidance for
CERCLA Sites posted on the Agency’s website:
http://www.epa.gov/superfund/health/contamin
ants/radiation/radrisk.htm

Page 10-4
Radiation emitted by radioactive
substances can transfer sufficient localized
energy to atoms to remove electrons from the
electric field of their nucleus (ionization). In
living tissue this energy transfer can destroy
cellular constituents and produce electrically
charged molecules (i.e., free radicals). Extensive
biological damage can lead to adverse health
effects. The type of ionizing radiation emitted by
a particular radionuclide depends upon the exact
nature of the nuclear transformation, and may
include emission of alpha particles, electrons
(beta particles or positrons), and neutrons; each
of these transformations may be accompanied by
emission of photons (gamma radiation or x-
rays). Each type of radiation differs in its
physical characteristics and in its ability to
inflict damage to biological tissue. These
characteristics and effects are summarized in the
box on this page.
Quantities of radionuclides are typically
expressed in terms of activity at a given time t
(A(t)). The SI unit of activity is the becquerel
(Bq), which is defined as the quantity of a given
radionuclide in which one atom is transformed
per second (i.e., one decay per second). The
conventional unit of activity is the curie (Ci),
which is defined as the quantity of a given
radionuclide in which 3.7x10
10
atoms undergo
nuclear transformation each second; one curie is
approximately equivalent to the decay rate of
one gram of Ra-226. A more convenient unit of
activity for expressing environmental
concentrations of radionuclides is the picoCurie
(pCi), which is equal to 10
-12
Ci. Occasionally,
activity is expressed incorrectly in terms of
counts per second (cps) or counts per minute
(cpm): these refer to the number of
transformations per unit time measured by a
particular radiation detector and do not represent
the true decay rate of the radionuclide. To derive
activity values, count rate measurements are
multiplied by adioisotope-specific detector
calibration factors.
PRINCIPAL TYPES OF IONIZING RADIATION
Alpha particles are doubly charged cations, composed of two protons and two neutrons, which are ejected
monoenergetically from the nucleus of an atom when the neutron to proton ratio is too low. Because of their relatively large
mass and charge, alpha particles tend to ionize nearby atoms quite readily, expending their energy in short distances. Alpha
particles will usually not penetrate an ordinary sheet of paper or the outer layer of skin. Consequently, alpha particles
represent a significant hazard only when taken into the body, where their energy is completely absorbed by small volumes of
tissues.
Beta particles are electrons ejected at high speeds from the nucleus of an unstable atom when a neutron
spontaneously converts to a proton and an electron. Unlike alpha particles, beta particles are not emitted with discrete
energies but are ejected from the nucleus over a continuous energy spectrum. Beta particles are smaller than alpha particles,
carry a single negative charge, and possess a lower specific ionization potential. Unshielded beta sources can constitute
external hazards if the beta radiation is within a few centimeters of exposed skin surfaces and if the beta energy is greater
than 70 keV. Beta sources shielded with certain metallic materials may produce bremsstrahlung (low energy x-ray) radiation
which may also contribute to the external radiation exposure. Internally, beta particles have a much greater range than alpha
particles in tissue. However, because they cause fewer ionizations per unit path length, beta particles deposit much less
energy to small volumes of tissue and, consequently, inflict must less damage than alpha particles.
Positrons are identical to beta particles except that they have a positive charge. A positron is emitted from the nucleus
of a neutron-deficient atom when a proton spontaneously transforms into a neutron. Alternatively, in cases where positron
emission is not energetically possible, the neutron deficiency may be overcome by electron capture, whereby one of the
orbital electrons is captured by the nucleus and united with a proton to form a neutron, or by annihilation radiation, whereby
the combined mass of a positron and electron is converted into photon energy. The damage inflicted by positrons to small
volumes of tissue is similar to that of beta particles.
Gamma radiations are photons emitted from the nucleus of a radioactive atom. X-rays, which are extra-nuclear in
origin, are identical in form to gamma rays, but have slightly lower energy ranges. There are three main ways in which x-
and gamma rays interact with matter: the photoelectric effect, the Compton effect, and pair production. All three processes
yield electrons which then ionize or excite other atoms of the substance. Because of their high penetration ability, x- and
gamma radiations are of most concern as external hazards.
Neutrons are emitted during nuclear fission reactions, along with two smaller nuclei, called fission fragments, and
beta and gamma radiation. For radionuclides likely to be encountered at Superfund sites, the rate of spontaneous fission is
minute and no significant neutron radiation is expected.

EXHIBIT 10-1
RADIOLOGICAL CHARACTERISTICS OF SELECTED RADIONUCLIDES
a
FOUND AT SUPERFUND SITES
a
Source: ICRP 1983 (except Ba-137m data from Kocher 1981).
b
Computed as the sum of the products of the energies and yields of individual radiations.
c
Half-life expressed in years (y), days (d), and hours (h).

Page 10-6
The activity per unit mass of a given
radionuclide is called the specific activity, and is
usually expressed in units of becquerels per
gram (Bq/g) or curies per gram (Ci/g). The
shorter the half-life of the radionuclide, the
greater is its specific activity. For example, Co-
60 has a radioactive half-life of about 5 years
and a specific activity of 4x10
13
Bq/g, whereas
Np-237 has a half-life of 2 million years and a
specific activity of 3×10
7
Bq/g.
Several terms are used by health physicists
to describe the physical interactions of different
types of radiations with biological tissue, and to
define the effects of these interactions on human
health. One of the first terms developed was
radiation exposure, which refers to the transfer
of energy from a radiation field of x- or gamma
rays to a unit mass of air. The unit for this
definition of exposure is the roentgen (R),
expressed as coulombs of charge per kilogram of
air (1 R = 2.58×10
-4
C/kg).
The term exposure is also defined as the
physical contact of the human body with
radiation. Internal exposure refers to an exposure
that occurs when human tissues are subjected to
radiations from radionuclides that have entered
the body via inhalation, ingestion, injection, or
other routes. External exposure refers to the
irradiation of human tissues by radiations
emitted by radionuclides located outside the
body either dispersed in the air or water, on skin
surfaces, or deposited on ground surfaces. All
types of radiation may contribute to internal
exposure, whereas only photon, beta, and
neutron radiations contribute significantly to
external exposure.
Ionizing radiation can cause deleterious
effects on biological tissues only when the
energy released during radioactive decay is
absorbed in tissue. The absorbed dose (D) is
defined as the mean energy imparted by ionizing
radiation per unit mass of tissue. The SI unit of
absorbed dose is the joule per kilogram, also
assigned the special name the gray (1 Gy = 1
joule/kg). The conventional unit of absorbed
dose is the rad (1 rad = 100 ergs per gram = 0.01
Gy).
For radiation protection purposes, it is
desirable to compare doses of different types of
radiation. The absorbed dose of any radiation
divided by the absorbed dose of a reference
radiation (traditionally 250 kVp x-rays) that
produces the same biological endpoint is called
the Relative Biological Effectiveness or RBE.
For regulatory purposes, an arbitrary consensus
RBE estimate called the Quality Factor or Q is
often used. The dose equivalent (H) was
developed to normalize the unequal biological
effects produced from equal absorbed doses of
different types of radiation. The dose equivalent
is defined as:
H = DQN
where D is the absorbed dose, Q is a quality
factor that accounts for the RBE of the type of
radiation emitted, and N is the product of any
additional modifying factors. Quality factors
currently assigned by the International
Commission on Radiological Protection (ICRP)
include values of Q=20 for alpha particles, Q=10
for neutrons and protons, and Q=1 for beta
particles, positrons, x-rays, and gamma rays
(ICRP 1984). These factors may be interpreted
as follows: on average, if an equal amount of
energy is absorbed, an alpha particle will inflict
approximately 20 times more damage to
biological tissue than a beta particle or gamma
ray, and twice as much damage as a neutron.
The modifying factor is currently assigned a
value of unity (N=1) for all radiations. The SI
unit of dose equivalent is the sievert (Sv), and
the conventional unit is the rem (1 rem = 0.01
Sv).
GENERAL HEALTH PHYSICS
REFERENCES
Introduction to Health Physics (Cember 1983)
Atoms, Radiation, and Radiation Protection (Turner 1986)
Environmental Radioactivity (Eisenbud 1987)
The Health Physics and Radiological Health Handbook
(Shleien and Terpilak 1984)

Page 10-7
EFFECTIVE DOSE EQUIVALENT
The effective dose equivalent, H
E
, is a weighted sum of dose equivalents to all organs and tissues (ICRP 1977, ICRP
1979), defined as:
H
E
= Σ w
T
H
T
T
where w is the weighting factor for organ or tissue T and H
T
is the mean dose equivalent to organ or tissue T. The factor
w
T
, which is normalized so that the summation of all the organ weighting factors is equal to one, corresponds to the
fractional contribution of organ or tissue T to the total risk of stochastic health effects when the body is uniformly
irradiated. Similarly, the committed effective dose equivalent, H
E,50
, is defined as the weighted sum of committed dose
equivalents to all irradiated organs and tissues, as follows:
H
E,50
= Σ w
T
H
T,50
T
H
E
and H
E
,50 thus reflect both the distribution of dose among the various organs and tissues of the body and their assumed
relative sensitivities to stochastic effects. The organ and tissue weighting factor values wT are as follows: Gonads, 0.25;
Breast, 0.15; Red Marrow, 0.12; Lungs, 0.12; Thyroid, 0.03; Bone Surface, 0.03; and Remainder, 0.30 (i.e., a value of w
T
=
0.06 is applicable to each of the five remaining organs or tissues receiving the highest doses).
The dose delivered to tissues from
radiations external to the body occurs only
while the radiation field is present.
However, the dose delivered to body tissues
due to radiations from systemically
incorporated radionuclides may continue
long after intake of the nuclide has ceased.
Therefore, internal doses to specific tissues
and organs are typically reported in terms of
the committed dose equivalent (H
T,50
),
which is defined as the integral of the dose
equivalent in a particular tissue T for 50
years after intake (corresponding to a
working lifetime).
When subjected to equal doses of
radiation, organs and tissues in the human body
will exhibit different cancer induction rates. To
account for these differences and to normalize
radiation doses and effects on a whole body
basis for regulation of occupational exposure,
the ICRP developed the concept of the effective
dose equivalent (H ) and committed effective
dose equivalent (HE,50), which are defined as
weighted sums of the organ-specific dose
equivalents (i.e., w
T
H
T
) and organ-specific
committed dose equivalents (i.e., w
T
H
T,50
),
respectively. Weighting factors, w
T
, are based on
selected stochastic risk factors specified by the
ICRP and are used to average organ-specific
dose equivalents (ICRP 1977, 1979). The
effective dose equivalent is equal to that dose
equivalent, delivered at a uniform whole-body
rate, that corresponds to the same number (but
possibly a dissimilar distribution) of fatal
stochastic health effects as the particular
combination of committed organ dose
equivalents (see the box on this page).
A special unit, the working level (WL), is
used to describe exposure to the short-lived
radioactive decay products of radon (Rn-222).
Radon is a naturally occurring radionuclide that
is of particular concern because it is ubiquitous,
it is very mobile in the environment, and it
decays through a series of short-lived decay
products that can deliver a significant dose to the
lung when inhaled. The WL is defined as any
combination of short-lived radon decay products
in one liter of air that will result in the ultimate
emission of 1.3×10
5
MeV of alpha energy. The
working level month (WLM) is defined as the
exposure to 1 WL for 170 hours (1 working
month).
Radiation protection philosophy
encourages the reduction of all radiation
exposures as low as reasonably achievable
(ALARA), in consideration of technical,
economic, and social factors. Further, no
practice involving radiation exposure should be
adopted unless it provides a positive net benefit.
In addition to these general guidelines, specific
upper limits on radiation exposures and doses
have been established by regulatory authorities
as described in the following section.

Additional discussion on the measurement
of radioactivity is provided in Sections 10.3 and
10.4, and the evaluation of radiation exposure
and dose is discussed further in Section 10.5.
Discussion of potential
health impacts from
ionizing radiation is presented in Section 10.6.
10.2 REGULATION
OF
RADIOACTIVELY
CONTAMINATED SITES
Chapter 2 briefly
describes the statutes,
regulations, guidance, and studies related to the
human health
evaluation process for chemical
contaminants. The
discussion describes
CERCLA, as amended
by SARA, and the RI/FS
process. Since radionuclides are classified as
hazardous substances under CERCLA, this
information is also applicable to radioactively
contaminated sites. Chapter 2
also introduces the
concept of compliance with applicable or
relevant and appropriate
requirements (ARARs)
in federal and state environmental laws as
required
by SARA. Guidance on potential
ARARs for the remediation of radioactively
contaminated sites under CERCLA is available
in the CERCLA Compliance with Other Laws
Manual (EPA 1989c). Only
a brief summary
of
regulatory authorities
is presented here.
The primary agencies with
regulatory
authority
for the
cleanup of radioactively
contaminated sites include EPA, the Nuclear
Regulatory Commission (NRC), the
Department
of Energy (DOE), and state agencies. Other
federal agencies,
including the Department
of
Transportation (DOT) and Department of
Defense (DOD), also have regulatory programs
(but more
limited) for radioactive materials.
Also, national and international
scientific
advisory organizations provide recommendations
related to radiation protection and radioactive
waste management, but have no r
egulatory
authority. The following is a brief description
of
the
main functions and areas of
jurisdiction of
these agencies and organizations.
EPA's authority to
protect public health
and the environment from
adverse
effects of radiation exposure is
derived
from several statutes, including the
Atomic Energy Act,
the
Clean Air Act,
Page 10-8
the Uranium Mill Tailings Radiation
Control
Act (UMTRCA), the Nuclear
Waste Policy
Act, the Resource
Conservation and Recovery Act
(RCRA), and CERCLA. EPA's major
responsibilities with regard to radiation
include the development of
federal
guidance a
nd standards, assessment of
new technologies, and surveillance
of
radiation in the environment. EPA also
has lead responsibility in the
federal
government
for advising all
federal
agencies on radiation standards. EPA's
radiation standards apply to many
different types of activities
involving all
types of radioactive material (i.e.,
source, byproduct, special nuclear, and
naturally occurring and accelerator
produced radioactive material
[NARM]).
For some
of the EPA
standards, implementation a
nd
enforcement responsibilities are vested
in other agencies, such as NRC and
DOE.
NRC licenses the possession and use of
certain
types of radioactive material at
certain types of facilities.
Specifically,
the NRC is authorized to license
source,
byproduct, and special nuclear material.
The NRC is not authorized to license
NARM, although NARM may
be
partially subject
to NRC regulation
when it is associated with material
licensed
by the NRC. Most of DOE's
operations are exempt from
NRC's
licensing and regulatory requirements,
as are certain
DOD activities involving
nuclear weapons and the use of
nuclear
reactors for military purposes.
DOE is responsible for conducting or
overseeing radioactive material
operations at numerous government-
owned/contractor-operated facilities.
DOE is also responsible for managing
several inactive sites that contain
radioactive waste, such
as sites
associated with
the Formerly Utilized
Sites Remedial Action Program
(FUSRAP), the Uranium
Mill Tailings
Remedial Action Program (UMTRAP),
the Grand Junction Remedial Action

Page 10-9
MAJOR FEDERAL LAWS FOR RADIATION PROTECTION
Atomic Energy Act of 1954, Public Law 83-703 - established the Atomic Energy Commission as the basic regulatory
authority for ionizing radiation.
Energy Reorganization Act of 1974, Public Law 93-438 - amended the Atomic Energy Act, and established the
Nuclear Regulatory Commission to regulate nondefense nuclear activities.
Marine Protection, Research, and Sanctuaries Act of 1972, Public Law 92-532 - established controls for ocean disposal
of radioactive waste.
Safe Drinking Water Act, Public Law 93-523 - mandated regulation of radionuclides in drinking water.
Clean Air Act Amendments of 1977, Public Law 95-95 - extended coverage of the Act's provisions to include
radionuclides.
Uranium Mill Tailings Radiation Control Act of 1978, Public Law 96-415 - required stabilization and control of
byproduct materials (primarily mill tailings) at licensed commercial uranium and thorium processing sites.
Low-Level Radioactive Waste Policy Act of 1980, Public Law 96-573 - made states responsible for disposal of LLRW
generated within their borders and encouraged formation of inter-state compacts.
Nuclear Waste Policy Act of 1982, Public Law 97-425 - mandated the development of repositories for the disposal of
high-level radioactive waste and spent nuclear fuel.
Low-Level Radioactive Waste Policy Act Amendments of 1985, Public Law 99-240 - amended LLRWPA
requirements and
Program (GJRAP), and the Surplus
Facilities Management Program
(SFMP). DOE is authorized to
control
all types of radioactive materials at sites
within its
jurisdiction.
Other
federal agencies with regulatory
programs applicable to radioactive
waste include DOT and
DOD. DOT has
issued regulations that
set forth
packaging, labeling, record keeping,
and
reporting requirements for the transport
of radioactive material (see 49 CFR
Parts
171 through 179). Most of
DOD's
radioactive waste management activities
are
regulated by NRC and/or EPA.
However, DOD has its own program
for
controlling wastes generated for certain
nuclear weapon and reactor
operations
for military purposes. Other agencies,
such as the Federal Emergency
Management Agency
(FEMA) and the
Department of the Interior (DOI),
may
also play a role in radioactive waste
cleanups in certain
cases.
States have their own authority and
regulations for managing radioactive
material
and waste. In addition, 29
states
(Agreement States) have entered into
agreements with the NRC, whereby
the
Commission has relinquished to
the
states its regulatory authority over
source, byproduct, and small quantities
of special nuclear material.
Both
Agreement States and Nonagreement
States can also regulate NARM. Su
ch
state-implemented regulations
are
potential ARARs.
The National Council on Radiation
Protection and Measurements (NCRP)
and the International Commission on
Radiological Protection (ICRP) provide
recommendations on human radiation
protection. The NCRP was chartered by
Congress to
collect, analyze, develop,
and disseminate information and
recommendations about radiation
protection and measurements. The
ICRP's
function i
s basically the same,
but on
an
international level. Although

Page 10-10
neither the NCRP nor the ICRP have
regulatory authority, their
recommendations serve as the basis for
many of the general (i.e., not source-
specific) regulations on radiation
protection developed at state and federal
levels.
The standards, advisories, and guidance of
these various groups are designed primarily to
be consistent with each other, often overlapping
in scope and purpose. Nevertheless, there are
important differences between agencies and
programs in some cases. It is important that
these differences be well understood so that
when more than one set of standards is
potentially applicable to or relevant and
appropriate for the same CERCLA site, RPMs
will be able to evaluate which standards to
follow. In general, determination of an ARAR
for a site contaminated with radioactive
materials requires consideration of the
radioactive constituents present and the
functional operations that generated the site,
whose regulatory jurisdiction the site falls under,
and which regulation is most protective, or if
relevant and appropriate, most appropriate given
site conditions.
For further information on radiation
standards, advisories, and guidance, RPMs
should consult the detailed ARARs guidance
document (EPA 1989c), as well as EPA's ORP
and/or Regional Radiation Program Managers.
10.3 DATA COLLECTION
Data collection needs and procedures for
sites contaminated with radioactive substances
are very similar to those described in Chapter 4
for chemically contaminated sites. There are,
however, some basic differences that simplify
data collection for radionuclides, including the
relative ease and accuracy with which natural
background radiation and radionuclide
contaminants can be detected in the environment
when compared with chemical contaminants.
The pathways of exposure and the
mathematical models used to evaluate the
potential health risks associated with
radionuclides in the environment are similar to
those used for evaluating chemical
contaminants. Many of the radionuclides found
at Superfund sites behave in the environment
like trace metals. Consequently, the types of data
needed for a radiation risk assessment are very
similar to those required for a chemical
contaminant risk assessment. For example, the
environmental, land use, and demographic data
needed and the procedures used to gather the
data required to model fate and effect are
virtually identical. The primary differences lie in
the procedures used to characterize the
radionuclide contaminants. In the sections that
follow, emphasis is placed on the procedures
used to characterize the radionuclide
contaminants and not the environmental setting
that affects their fate and effects, since the latter
has been thoroughly covered in Chapter 4.
10.3.1 RADIATION DETECTION METHODS
Field and laboratory methods used to
identify and quantify concentrations of
radionuclides in the environment are, in many
cases, more exact, less costly, and more easily
implemented than those employed for chemical
analyses. Selection of a radiometric method
depends upon the number of radionuclides of
interest, their activities and types of radiations
emitted, as well as on the level of sensitivity
required and the sample size available. In some
cases, the selection process requires prior
knowledge of the nature and extent of
radioactive contamination present onsite. See the
references provided in the box on page 10-12 for
detailed guidance on sample collection and
preparation, radiochemical procedures, and
radiation counters and measurement techniques.
The following discussion provides an overview
of a few of the radiation detection techniques
and instruments currently used to characterize
sites contaminated with radioactive materials.
Field methods utilize instrumental
techniques rather than radiochemical procedures
to determine in-situ identities and concentrations
of radionuclides, contamination profiles, and
external beta/gamma exposure rates. Field
instruments designed for radiation detection (see
Exhibit 10-2) are portable, rugged, and relatively
insensitive to wide fluctuations in temperature
and humidity. At the same time, they are
sensitive enough to discriminate between
variable levels of background radiation from
naturally occurring radionuclides and excess
radiation due to radioactive waste.

Page 10-11
EXHIBIT 10-2
TYPES OF FIELD RADIATION DETECTION INSTRUMENTS

Page 10-12
RADIONUCLIDE MEASUREMENT
PROCEDURES
Environmental Radiation Measurements
(NCRP 1976)
Instrumentation and Monitoring Methods for
Radiation Protection (NCRP 1978)
Radiochemical Analytical Procedures for
Analysis of Environmental Samples (EPA
1979a)
Eastern Environmental Radiation Facility
Radiochemistry Procedures Manual (EPA
1984a)
A Handbook of Radioactivity Measurement
Procedures (NCRP 1985a)
Because of the harsh conditions in which they
are sometimes operated, and because their
detection efficiency varies with photon energy,
all field instruments should be properly
calibrated in the laboratory against National
Bureau of Standards (NBS) radionuclide sources
prior to use in the field. Detector response
should also be tested periodically in the field
against NBS check-sources of known activity.
Commonly used gamma-ray survey
meters include Geiger-Muller (G-M) probes,
sodium iodide (NaI(Tl)) crystals, and solid-state
germanium diodes (Ge(Li)) coupled to
ratemeters, scalers, or multichannel analyzers
(MCAs). These instruments provide
measurements of overall exposure rates in
counts per minute, or microRoentgens or
microrem per hour. However, only NaI and
Ge(Li) detectors with MCAs provide energy
spectra of the gamma rays detected and can
therefore verify the identity of specific
radionuclides. Thin window G-M detectors and
Pancake (ionization) probes are used to detect
beta particles. Alpha-particle surface monitors
include portable air proportional, gas
proportional, and zinc sulfide (ZnS) scintillation
detectors, which all have very thin and fragile
windows. The references in the box on this page
provide additional information on several other
survey techniques and instruments, such as
aerial gamma surveillance used to map gamma
exposure rate contours over large areas.
Laboratory methods involve both
chemical and instrumental techniques to
quantify low-levels of radionuclides in sample
media. The preparation of samples prior to
counting is an important consideration,
especially for samples containing alpha- and
beta-emitting radionuclides that either do not
emit gamma rays or emit gamma rays of low
abundance. Sample preparation is a multistep
process that achieves the following three
objectives: (1) the destruction of the sample
matrix (primarily organic material) to reduce
alpha- and beta-particle self-absorption; (2) the
separation and concentration of radionuclides of
interest to increase resolution and sensitivity;
and (3) the preparation of the sample in a
suitable form for counting. Appropriate
radioactive tracers (i.e., isotopes of the
radionuclides of interest that are not present in
the sample initially, but are added to the sample
to serve as yield determinants) must be selected
and added to the sample before a radiochemical
procedure is initiated.
For alpha counting, samples are prepared
as thin-layer (low mass) sources on membrane
filters by coprecipitation with stable carriers or
on metal discs by electrodeposition. These
sample filters and discs are then loaded into gas
proportional counters, scintillation detectors, or
alpha spectrometry systems for measurement
(see Exhibit 10-3). In a proportional counter, the
sample is immersed in a counting gas, usually
methane and argon, and subjected to a high
voltage field: alpha emissions dissociate the
counting gas creating an ionization current
proportional to the source strength, which is then
measured by the system electronics. In a
scintillation detector, the sample is placed in
contact with a ZnS phosphor against the window
of a photomultiplier (PM) tube: alpha particles
induce flashes of light in the phosphor that are
converted to an electrical current in the PM tube
and measured. Using alpha spectrometry, the
sample is placed in a holder in an evacuated
chamber facing a solid-state, surface-barrier
detector: alpha particles strike the detector and
cause electrical impulses, which are sorted by
strength into electronic bins and counted. All
three systems yield results in counts per minute,
which are then converted into activity units

Page 10-13
using detector-and radionuclide-specific calibration
EXHIBIT 10-3
TYPES OF LABORATORY RADIATION DETECTION INSTRUMENTS
α

Page 10-14
values. Alpha spectrometry is the only system,
however, that can be used to identify specific
alpha-emitting radionuclides.
For beta counting, samples are prepared
both as thin-sources and as solutions mixed with
scintillation fluid, similar in function to a
phosphor. Beta-emitting sources are counted in
gas proportional counters at higher voltages than
those applied for alpha counting or in
scintillation detectors using phosphors
specifically constructed for beta-particle
detection. Beta-emitters mixed with scintillation
fluid are counted in 20 ml vials in beta-
scintillation counters: beta-particle interactions
with the fluid produce detectable light flashes.
Like alpha detectors, beta detectors provide
measurements in counts per minute, which are
converted to activity units using calibration
factors. It should be noted, however, that few
detection systems are available for determining
the identity of individual beta-emitting
radionuclides, because beta particles are emitted
as a continuous spectrum of energy that is
difficult to characterize and ascribe to any
specific nuclide.
It is advisable to count all samples intact
in a known geometry on a NaI or Ge(Li)
detector system prior to radiochemical analysis,
because many radionuclides that emit gamma
rays in sufficient abundance and energy can be
detected and measured by this process. Even
complex gamma-ray spectra emitted by multiple
radionuclide sources can be resolved using
Ge(Li) detectors, MCAs, and software packages,
and specific radionuclide concentrations can be
determined. If the sample activity is low or if
gamma rays are feeble, then more rigorous alpha
or beta analyses are advised.
10.3.2 REVIEWING AVAILABLE SITE
INFORMATION
In Chapter 4, reference is made to
reviewing the site data for chemical
contaminants in accordance with Stage 1 of the
Data Quality Objectives (DQO) process (see box
on Page 4-4). This process also applies to
radionuclides. For further guidance on the
applicability of DQOs to radioactively
contaminated sites, consult EPA's Office of
Radiation Programs.
10.3.3 ADDRESSING MODELING
PARAMETER NEEDS
Exhibits 4-1 and 4-2 describe the elements
of a conceptual model and the types of
information that may be obtained during a site
sampling investigation. These exhibits apply to
radioactively contaminated sites with only minor
modifications. For example, additional exposure
pathways for direct external exposure from
immersion in contaminated air or water or from
contaminated ground surfaces may need to be
addressed for certain radionuclides; these
exposure pathways are discussed further in
subsequent sections. In addition, several of the
parameters identified in these exhibits are not as
important or necessary for radiological surveys.
For example, the parameters that are related
primarily to the modeling of organic
contaminants, such as the lipid content of
organisms, are typically not needed for
radiological assessments.
10.3.4 DEFINING BACKGROUND
RADIATION SAMPLING NEEDS
As is the case with a chemically
contaminated site, the background
characteristics of a radioactively contaminated
site must be defined reliably in order to
distinguish natural background radiation and
fallout from the onsite sources of radioactive
waste. With the possible exception of indoor
sources of Rn-222, it is often possible to make
these distinctions because the radiation detection
equipment and analytical techniques used are
very precise and sensitive. At a chemically
contaminated site, there can be many potential
and difficult-to-pinpoint offsite sources for the
contamination found onsite, confounding the
interpretation of field measurements. With a
radioactively contaminated site, however, this is
not usually a problem because sources of
radionuclides are, in general, easier to isolate
and identify. In fact, some radionuclides are so
specifically associated with particular industries
that the presence of a certain radioactive
contaminant sometimes acts as a "fingerprint" to
identify its source. Additional information on the
sources of natural background and man-made

Page 10-15
NATURAL BACKGROUND
RADIATION
Tritium in the Environment (NCRP 1979)
Ionizing Radiation: Sources and Effects
(UNSCEAR 1982)
Exposure from the Uranium Series with Emphasis
on Radon and its Daughters (NCRP 1984b)
Carbon-14 in the Environment (NCRP 1985c)
Environmental Radioactivity (Eisenbud 1987)
Population Exposure to External Natural
Radiation Background in the United States
(EPA 1987a)
Ionizing Radiation Exposure of the Population of
the United States (NCRP 1987a)
Exposure of the Population of the United States
and Canada
f
rom Natural Back
g
round
radiation in the environment may be found in the
references listed in the box on the next page.
10.3.5 PRELIMINARY IDENTIFICATION OF
POTENTIAL EXPOSURE
Identification of environmental media of
concern, the types of radionuclides expected at a
site, areas of concern (sampling locations), and
potential routes of radionuclide transport
through the environment is an important part of
the radiological risk assessment process.
Potential media of concern include soil, ground
water, surface water, air, and biota, as discussed
in Chapter 4. Additional considerations for
radioactively contaminated sites are listed
below.
Usually a very limited number of
radionuclides at a site contribute
significantly to the risk. During the site
scoping meeting, it is appropriate to
consult with a health physicist not only
to develop a conceptual model of the
facility, but also to identify the
anticipated critical radionuclides and
pathways.
In addition to the environmental media
identified for chemically contaminated
sites, radioactively contaminated sites
should be examined for the potential
presence of external radiation fields.
Many radionuclides emit both beta and
gamma radiation, which can create
significant external exposures.
There are other components in the
environment that may or may not be
critical exposure pathways for the
public, but that are very useful
indicators of the extent and type of
contamination at a site. These
components include sediment, aquatic
plants, and fish, which may concentrate
and integrate the radionuclide
contaminants that may be (or have been)
present in the aquatic environment at a
site. Accordingly, though some
components of the environment may or
may not be important direct routes of
exposure to man, they can serve as
indicators of contamination.
10.3.6 DEVELOPING A STRATEGY FOR
SAMPLE COLLECTION
The discussions in Chapter 4 regarding
sample location, size, type, and frequency apply
as well to radioactively contaminated sites with
the following additions and qualifications. First,
the resolution and sensitivity of radioanalytical
techniques permit detection in the environment
of most radionuclides at levels that are well
below those that are considered potentially
harmful. Analytical techniques for
nonradioactive chemicals are usually not this
sensitive.
For radionuclides, continuous monitoring
of the site environment is important, in addition
to the sampling and monitoring programs
described in Chapter 4. Many field devices that
measure external gamma radiation, such as
continuous radon monitors and high pressure
ionization chambers, provide a real time
continuous record of radiation exposure levels
and radionuclide concentrations. Such devices
are useful for determining the temporal variation
of radiation levels at a contaminated site and for

Page 10-16
comparing these results to the variability
observed at background locations. Continuous
measurements provide an added level of
resolution for quantifying and characterizing
radiological risk.
Additional factors that affect the
frequency of sampling for radionuclides, besides
those discussed in Chapter 4, include the half-
lives and the decay products of the
radionuclides. Radionuclides with short half-
lives, such as Fe-59 (half-life = 44.5 days), have
to be sampled more frequently because
relatively high levels of contamination can be
missed between longer sampling intervals. The
decay products of the radionuclides must also be
considered, because their presence can interfere
with the detection of the parent nuclides of
interest, and because they also may be important
contributors to risks.
10.3.7 QUALITY ASSURANCE AND QUALITY
CONTROL (QA/QC) MEASURES
The QA/QC concepts described in
Chapter 4 also apply to sampling and analysis
programs for radionuclides, although the
procedures differ. Guidance regarding sampling
and measurement of radionuclides and QA/QC
protocols for their analyses are provided in the
publications listed in the box on this page.
The QA/QC protocols used for
radionuclide analysis were not developed to
meet the evidential needs of the Superfund
program; however, it is likely that many of the
current radiological QA/QC guidance would
meet the intent of Superfund requirements.
Some areas where radiological QA/QC guidance
may not meet the intent of Superfund are listed
below.
The degree of standardization for
radiochemical procedures may be less
rigorous in the QA/QC protocols than
that required for chemical labs under the
Contract Laboratory Program (CLP). In
radiochemical laboratories, several
different techniques may be used to
analyze for a specific radionuclide in a
given matrix with comparable results.
The CLP requires all participating
RADIONUCLIDE MEASUREMENT
QA/QC PROCEDURES
Quality Control for Environmental Measurements
Using Gamma-Ray Spectrometry (EPA 1977b)
Quality Assurance Monitoring Programs
(Normal Operation) - Effluent Streams and the
Environment (NRC 1979)
Upgrading Environmental Radiation Data
(EPA 1980)
Handbook of Analytical Quality Control in
Radioanalytical Laboratories (EPA 1987b)
QA Procedures for Health Labs
Radiochemistry (American Public Health
Association 1987)
chemical laboratories to use
standardized techniques.
The required number and type of QC
blanks are fewer for radionuclide
samples. For example, a "trip" blank is
not generally used because radionuclide
samples are less likely to be
contaminated from direct exposure to air
than are samples of volatile organics.
Limited guidance is available that
specifies field QA/QC procedures (see the box
on this page). These and other issues related to
QA/QC guidance for radiological analyses are
discussed further in the Section 10.4.
10.4 DATA EVALUATION
Chapter 5 describes the procedures for
organizing and evaluating data collected during
a site sampling investigation for use in risk
assessment. The ten-step process outlined for
chemical data evaluation is generally applicable
to the evaluation of radioactive contaminants,
although many of the details must be modified
to accommodate differences in sampling and
analytical methods.

10.4.1 COMBINING DATA FROM
AVAILABLE SITE INVESTIGATIONS
All available data for the site should be
gathered for evaluation and sorted by
environmental medium sampled, analytical
methods, and sampling periods. Decisions
should be made, using the process described in
Section 5.1, to combine, evaluate individually,
or eliminate specific data for use in the
quantitative risk assessment.
10.4.2 EVALUATING ANALYTICAL
METHODS
As with chemical data, radiological data
should be grouped according to the types of
analyses performed to determine which data are
appropriate for use in quantitative risk
assessment. Analytical methods for measuring
radioactive contaminants differ from those for
measuring organic and inorganic chemicals.
Standard laboratory procedures for radionuclide
analyses are presented in references, such as
those listed in the box on page 10-12. Analytical
methods include alpha, beta, and gamma
spectrometry, liquid scintillation counting,
proportional counting, and chemical separation
followed by spectrometry, depending on the
specific radionuclides of interest.
Laboratory accreditation procedures for
the analysis of radionuclides also differ.
Radionuclide analyses are not currently
conducted as part of the Routine Analytical
Services (RAS) under the Superfund CLP.
However, these analyses may be included under
Special Analytical Services (SAS). The EPA
Environmental Radioactivity Intercomparison
Program, coordinated by the Nuclear Radiation
Assessment Division of the Environmental
Monitoring Systems Laboratory in Las Vegas
(EMSL-LV), provides quality assurance
oversight for participating radiation
measurement laboratories (EPA 1989b). Over
300 federal, state, and private laboratories
participate in some phase of the program, which
includes analyses for a variety of radionuclides
in media (e.g., water, air, milk, and food) with
activity concentrations that approximate levels
that may be encountered in the environment.
Similar intercomparison programs for analysis
of thermoluminescent dosimeters (TLDs) for
Page 10-17
external radiation exposure rate measurements
are conducted by the DOE Environmental
Measurements Laboratory (EML) and the DOE
Radiological and Environmental Services
Laboratory (RESL).
In both cases, these intercomparison
programs are less comprehensive than the CLP
in terms of facility requirements other than
analysis of performance evaluation samples,
such as laboratory space and procedural
requirements, instrumentation, training, and
quality control. However, until such time as
radiation measurements become fully
incorporated in the CLP, use of laboratories that
successfully participate in these intercomparison
studies may be the best available alternative for
ensuring high-quality analytical data. Regardless
of laboratory accreditation, all analytical results
should be carefully scrutinized and not accepted
at face value.
As discussed in Chapter 5 for chemical
analyses, radioanalytical results that are not
specific for a particular radionuclide (e.g., gross
alpha, gross beta) may have limited usefulness
for quantitative risk assessment. They can be
useful as a screening tool, however. External
gamma exposure rate data, although thought of
as a screening measurement, can be directly
applied as input data for a quantitative risk
assessment.
10.4.3 EVALUATING QUANTITATION
LIMITS
Lower limits of detection (LLDs), or
quantitation limits, for standard techniques for
most radionuclide analyses are sufficiently low
to ensure the detection of nuclides at activity
concentrations well below levels of concern.
There are exceptions, however: some
radionuclides with very low specific activities,
long half-lives, and/or low-energy decay
emissions (e.g., I-129, C-14) are difficult to
detect precisely using standard techniques. To
achieve lower LLDs, a laboratory may: (1) use
more sensitive measurement techniques and/or
chemical extraction procedures; (2) analyze
larger sample sizes; or (3) increase the counting
time of the sample. A laboratory may also
choose to apply all three options to increase
detection capabilities.

Page 10-18
EXHIBIT 10-4
EXAMPLE OF LOWER LIMITS OF DETECTION (LLD)
FOR SELECTED RADIONUCLIDES USING STANDARD ANALYTICAL METHODS
a
LLD
Isotope Sample Media
b
pCi Bq Methodology
Co-60 -W ater 10 0.4 Gamma Spectrometry
-Soil (dry wt.) 0.1 0.004 Gamma Spectrometry
-Biota (wet wt.)
c
0.1
0.004
Gamma
Spectrometry
-Air
d
25 0.9
Gamma Spectrometry
Sr-90
-Water
1
0.04 Radiochemistry
Cs-137
-Water 10
0.4
Gamma Spectrometry
0.3
0.01
Radiochemistry
-Soil (dry wt.)
1 0.04
Gamma Spectrometry
0.3
0.01
Radiochemistry
-Biota (wet wt.)
1 0.04
Gamma Spectrometry
0.3
0.01
Radiochemistry
-Air
30 1 Gamma Spectrometry
Pb-210 -W ater
0.2
0.007 Radiochemistry
-Soil (dry wt.)
0.2
0.007
Radiochemistry
-Biota (wet wt.)
0.2
0.007
Radiochemistry
-Air
5 0.2 Radiochemistry
Ra-226
-Water
100 4
Gamma Spectrometry
0.1
0.004 Radiochemistry
0.1
0.004 Radon
Daughter Emanation
-Soil (dry wt.)
0.1
0.004
Radon Daughter Emanation
-Biota (wet wt.)
0.1
0.004
Radon Daughter Emanation
-Air
1
0.04
Alpha
Spectrometry
Th-232
-Water
0.02 0.0007
Alpha Spectrometry
-Soil (dry wt.)
0.2
0.007
Radiochemistry
-Biota (wet wt.)
0.02 0.0007
Alpha Spectrometry
-Air
0.3
0.01
Alpha Proportional Counter
U-234
-Water
0.02
0.0007 Alpha Spectrometry
U-235
-Soil (dry wt.)
0.1 0.004
Alpha Spectrometry
U-238
-Biota
(wet
wt.) 0.02
0.0004 Alpha Spectrometry
-Air
0.2
0.007 Alpha Spectrometry
(continued)

Page 10-19
EXHIBIT 10-4 (CONTINUED)
EXAMPLES OF LOWER LIMITS OF DETECTION (LLD)
FOR SELECTED RADIONUCLIDES USING STANDARD ANALYTICAL METHODS
3
LLD
Isotope Sample Media
b
pCi Bq Methodology
Pu-238 -Water 0.02 0 .0007 Alpha Spectrometry
Pu-239 -Soil (dry wt.) 0.1 0.004 Alpha Spectrometry
Pu-240 -Biota (wet wt.) 0.01 0.0004 Alpha Spectrometry
-Air 0.2 0.007 Alpha Spectrometry
a
Source: U.S. E nvironmental Protection Agency Eastern Environmental Radiation Facility (EPA-EERF), Department of
Energy Environmental Measurements Laboratory (DOE-EML), and commercial laboratories. N ote that LLDs are
radionuclide-, media-, sa mple size-, and laboratory-specific: higher and lower LLDs than those reported above are
possible. The risk a ssessor should request and report the LLDs supplied by the laboratory performing the analyses.
b
Nominal sample sizes: water (1 liter), soil (1 kg dry wt.), biota (1 kg wet wt.), and air (1 filter sample).
c
Biota includes vegetation, fish, and meat.
d
Air refers to a sample of 300 m
3
of air collected on a filter, which is analyzed for the radionuclide of interest.

Page 10-20
Exhibit 10-4 presents examples of typical LLDs
using standard analytical techniques. The same
special considerations noted for chemical
analyses would also apply for radionuclides that
are not detected in any samples from a particular
medium, but are suspected to be present at a site.
In these cases, three options may be applied: (1)
re-analyze the sample using more sensitive
methods; (2) use the LLD value as a "proxy"
concentration to evaluate the potential risks at
the detection limit; or (3) evaluate the possible
risk implication of the radionuclide qualitatively.
An experienced health physicist should decide
which of these three options would be most
appropriate.
When multiple radionuclides are present
in a sample, various interferences can occur that
may reduce the analytical sensitivity for a
particular radionuclide. Also, in some areas of
high background radioactivity from naturally
occurring radionuclides, it may be difficult to
differentiate background contributions from
incremental site contamination. It may be
possible to eliminate such interferences by
radiochemical separation or special instrumental
techniques.
A sample with activity that is nondetectable
should be reported as less than the appropriate
sample and radionuclide-specific LLD value.
However, particular caution should be exercised
when applying this approach to radionuclides
that are difficult to measure and possess
unusually high detection limits, as discussed
previously. In most cases where a potentially
important radionuclide contaminant is suspected,
but not detected, in a sample, the sample should
be reanalyzed using more rigorous
radiochemical procedures and more
sophisticated detection techniques.
If radionuclide sample data for a site are
reported without sample-specific radionuclide
quantitation limits, the laboratory conducting the
analyses should be contacted to determine the
appropriate LLD values for the analytical
techniques and sample media.
10.4.4 EVALUATING QUALIFIED AND
CODED DATA
Various data qualifiers and codes may be
attached to problem data from inorganic and
organic chemical analyses conducted under the
CLP as shown in Exhibits 5-4 and 5-5. These
include laboratory qualifiers assigned by the
laboratory conducting the analysis and data
validation qualifiers assigned by personnel
involved in data validation. These qualifiers
pertain to QA/QC problems and generally
indicate questions concerning chemical identity,
chemical concentration, or both. No
corresponding system of qualifiers has been
developed for radioanalytical data, although
certain of the CLP data qualifiers might be
adopted for use in reporting radioanalytical data.
The health physicist should define and evaluate
any qualifiers attached to data for radionuclide
analyses. Based on the discussions in Chapter 5,
the references on methods listed above, and
professional judgment, the health physicist
should eliminate inappropriate data from use in
the risk assessment.
10.4.5 COMPARING CONCENTRATIONS
DETECTED IN BLANKS WITH
CONCENTRATIONS DETECTED IN
SAMPLES
The analysis of blank samples (e.g.,
laboratory or reagent blanks, field blanks,
calibration blanks) is an important component of
a proper radioanalytical program. Analysis of
blanks provides a measure of contamination
introduced into a sample during sampling or
analysis activities.
The CLP provides guidance for inorganic
and organic chemicals that are not common
laboratory contaminants. According to this
guidance, if a blank contains detectable levels of
any uncommon laboratory chemical, site sample
results should be considered positive only if the
measured concentration in the sample exceeds
five times the maximum amount detected in any
blank. Samples containing less than five times
the blank concentration should be classified as
nondetects, and the maximum blank-related
concentration should be specified as the
quantitation limit for that chemical in the
sample. Though they are not considered to be

common laboratory contaminants, radionuclides
should not be classified as nondetects using the
above CLP guidance. Instead, the health
physicist should evaluate all active sample
preparation and analytical procedures for
possible sources of contamination.
10.4.6 EVALUATING TENTATIVELY
IDENTIFIED RADIONUCLIDES
Because radionuclides are not included on
the Target Compound List (TCL), they may be
classified as tentatively identified compounds
(TICs) under CLP protocols. In reality, however,
radioanalytical techniques are sufficiently
sensitive that the identity and quantity of
radionuclides of potential concern at a site can
be determined with a high degree of confidence.
In some cases, spectral or matrix interferences
may introduce uncertainties, but these problems
usually can be overcome using special
radiochemical and/or instrumental methods. In
cases where a radionuclide's identity is not
sufficiently well-defined by the available data
set: (1) further analyses may be performed
using more sensitive methods, or (2) the
tentatively identified radionuclide may be
included in the risk assessment as a contaminant
of potential concern with notation of the
uncertainty in its identity and concentration.
10.4.7 COMPARING SAMPLES WITH
BACKGROUND
It is imperative to select, collect, and
analyze an appropriate number of background
samples to be able to distinguish between onsite
sources of radionuclide contaminants from
radionuclides expected normally in the
environment. Background measurements of
direct radiation and radionuclide concentrations
in all media of concern should be determined at
sampling locations geologically similar to the
site, but beyond the influence of the site.
Screening measurements (e.g., gross alpha, beta,
and gamma) should be used to determine
whether more sensitive radionuclide- specific
analyses are warranted. Professional judgment
should be used by the health physicist to select
appropriate background sampling locations and
analytical techniques. The health physicist
should also determine which naturally occurring
radionuclides (e.g., uranium, radium, or
Page 10-21
thorium) detected onsite should be eliminated
from the quantitative risk assessment. All man-
made radionuclides detected in samples
collected should, however, be retained for
further consideration.
10.4.8 DEVELOPING A SET OF
RADIONUCLIDE DATA AND
INFORMATION FOR USE IN A RISK
ASSESSMENT
The process described in Section 5.8 for
selection of chemical data for inclusion in the
quantitative risk assessment generally applies for
radionuclides as well. One exception is the lack
of CLP qualifiers for radionuclides, as discussed
previously. Radionuclides of concern should
include those that are positively detected in at
least one sample in a given medium, at levels
significantly above levels detected in blank
samples and significantly above local
background levels. As discussed previously, the
decision to include radionuclides not detected in
samples from any medium but suspected at the
site based on historical information should be
made by a qualified health physicist.
10.4.9 GROUPING RADIONUCLIDES BY
CLASS
Grouping radionuclides for consideration
in the quantitative risk assessment is generally
unnecessary and inappropriate. Radiation dose
and resulting health risk is highly dependent on
the specific properties of each radionuclide. In
some cases, however, it may be acceptable to
group different radioisotopes of the same
element that have similar radiological
characteristics (e.g., Pu-238/239/240, U-
235/238) or belong to the same decay series.
Such groupings should be determined very
selectively and seldom offer any significant
advantage.
10.4.10 FURTHER REDUCTION IN THE
NUMBER OF RADIONUCLIDES
For sites with a large number of
radionuclides detected in samples from one or
more media, the risk assessment should focus on
a select group of radionuclides that dominate the
radiation dose and health risk to the critical
receptors. For example, when considering

Page 10-22
transport through ground water to distant
receptors, transit times may be very long;
consequently, only radionuclides with long half-
lives or radioactive progeny that are formed
during transport may be of concern for that
exposure pathway. For direct external exposures,
high-energy gamma emitters are of principal
concern, whereas alpha-emitters may dominate
doses from the inhalation and ingestion
pathways. The important radionuclides may
differ for each exposure pathway and must be
determined on their relative concentrations, half-
lives, environmental mobility, and dose
conversion factors (see Section 10.5 for
discussion of dose conversion factors) for each
exposure pathway of interest.
The total activity inventory and individual
concentrations of radionuclides at a Superfund
site will change with time as some nuclides
decay away and others "grow in" as a result of
radioactive decay processes. Consequently, it
may be important to evaluate different time
scales in the risk assessment. For example, at a
site where Ra-226 (half-life = 1600 years) is the
only contaminant of concern in soil at some
initial time, the Pb-210 (half-life = 22.3 years)
and Po-210 (half-life = 138 days) progeny will
also become dominant contributors to the
activity onsite over a period of several hundred
years.
10.4.11 SUMMARIZING AND PRESENTING
DATA
Presentation of results of the data
collection and evaluation process will be
generally the same for radionuclides and
chemical contaminants. The sample table
formats presented in Exhibits 5-6 and 5-7 are
equally applicable to radionuclide data, except
that direct radiation measurement data should be
added, if appropriate for the radionuclides and
exposure pathways identified at the site.
10.5 EXPOSURE AND DOSE
ASSESSMENT
This section describes a methodology for
estimating the radiation dose equivalent to
humans from potential exposures to
radionuclides through all pertinent exposure
pathways at a remedial site. These estimates of
dose equivalent may be used for comparison
with radiation protection standards and criteria.
However, this methodology has been developed
for regulation of occupational radiation
exposures for adults and is not completely
applicable for estimating health risk to the
general population. Section 10.7.2, therefore,
describes a separate methodology for estimating
health risk.
Chapter 6 describes the procedures for
conducting an exposure assessment for chemical
contaminants as part of the baseline risk
assessment for Superfund sites. Though many
aspects of the discussion apply to radionuclides,
the term "exposure" is used in a fundamentally
different way for radionuclides as compared to
chemicals. For chemicals, exposure generally
refers to the intake (e.g., inhalation, ingestion,
dermal exposure) of the toxic chemical,
expressed in units of mg/kg-day. These units are
convenient because the toxicity values for
chemicals are generally expressed in these
terms. For example, the toxicity value used to
assess carcinogenic effects is the slope factor,
expressed in units of risk of lifetime excess
cancers per mg/kg-day. As a result, the product
of the intake estimate with the slope factor
yields the risk of cancer (with proper
adjustments made for absorption, if necessary).
Intakes by inhalation, ingestion, and
absorption are also potentially important
exposure pathways for radionuclides, although
radionuclide intake is typically expressed in
units of activity (i.e., Bq or Ci) rather than mass.
Radionuclides that enter through these internal
exposure pathways may become systemically
incorporated and emit alpha, beta, or gamma
radiation within tissues or organs. Unlike
chemical assessments, an exposure assessment
for radioactive contaminants can include an
explicit estimation of the radiation dose
equivalent. As discussed previously in Section
10.1, the dose equivalent is an expression that
takes into consideration both the amount of
energy deposited in a unit mass of a specific
organ or tissue as a result of the radioactive
decay of a specific radionuclide, as well as the
relative biological effectiveness of the radiations
emitted by that nuclide. (Note that the term dose
has a different meaning for radionuclides [dose
= energy imparted to a unit mass of tissue] than

that used in Chapter 6 for chemicals [dose, or
absorbed dose = mass penetrating into an
organism].)
Unlike chemicals, radionuclides can have
deleterious effects on humans without being
taken into or brought in contact with the body.
This is because high energy beta particles and
photons from radionuclides in contaminated air,
water, or soil can travel long distances with only
minimum attenuation in these media before
depositing their energy in human tissues.
External radiation exposures can result from
either exposure to radionuclides at the site area
or to radionuclides that have been transported
from the site to other locations in the
environment. Gamma and x-rays are the most
penetrating of the emitted radiations, and
comprise the primary contribution to the
radiation dose from external exposures. Alpha
particles are not sufficiently energetic to
penetrate the outer layer of skin and do not
contribute significantly to the external dose.
External exposure to beta particles primarily
imparts a dose to the outer layer skin cells,
although high-energy beta radiation can
penetrate into the human body.
The quantification of the amount of
energy deposited in living tissue due to internal
and external exposures to radiation is termed
radiation dosimetry. The amount of energy
deposited in living tissue is of concern because
the potential adverse effects of radiation are
proportional to energy deposition. The energy
deposited in tissues is proportional to the decay
rate of a radionuclide, and not its mass.
Therefore, radionuclide quantities and
concentrations are expressed in units of activity
(e.g., Bq or Ci), rather than in units of mass.
Despite the fundamental difference
between the way exposures are expressed for
radionuclides and chemicals, the approach to
exposure assessment presented in Chapter 6 for
chemical contaminants largely applies to
radionuclide contaminants. Specifically, the
three steps of an exposure assessment for
chemicals also apply to radionuclides:
(1) characterization of the exposure setting; (2)
identification of the exposure pathways; and (3)
quantification of exposure. However, some of
Page 10-23
the methods by which these three steps are
carried out are different for radionuclides.
REFERENCES ON EXPOSURE
ASSESSMENT FOR RADIONUCLIDES
Calculation of Annual Doses to Man from Routine
Releases of Reactor Effluents (NRC 1977)
Radiological Assessment: A Textbook on
Environmental Dose Analysis (Till and Meyer 1983)
Models and Parameters for Environmental
Radiological Assessments (Miller 1984)
Radiological Assessment: Predicting the Transport,
Bioaccumulation, and Uptake by Man of Radionuclides
Released to the Environment (NCRP 1984a)
Background Information Document, Draft EIS for
Proposed NESHAPS for Radionuclides, Volume I, Risk
Assessment Methodology (EPA 1989a)
Screening Techniques for Determining Compliance
with Environmental Standards
(NCRP 1989)
10.5.1 CHARACTERIZING THE EXPOSURE
SETTING
Initial characterization of the exposure
setting for radioactively contaminated sites is
virtually identical to that described in Chapter 6.
One additional consideration is that, at sites
suspected of having radionuclide contamination,
a survey should be conducted to determine
external radiation fields using any one of a
number of field survey instruments (preferably,
G-M tubes and NaI(Tl) field detectors) (see
Exhibit 10-2). Health and safety plans should be
implemented to reduce the possibility of
radiation exposures that are in excess of
allowable limits.
10.5.2 IDENTIFYING EXPOSURE
PATHWAYS
The identification of exposure pathways
for radioactively contaminated sites is very
similar to that described in Chapter 6 for
chemically contaminated sites, with the
following additional guidance.
In addition to the various ingestion,
inhalation, and direct contact pathways
described in Chapter 6, external exposure to
penetrating radiation should also be

Page 10-24
considered. Potential external exposure
pathways to be considered include
immersion in contaminated air, immersion in
contaminated water, and radiation exposure
from ground surfaces contaminated with beta
and photon-emitting radionuclides.
As with nonradioactive chemicals,
environmentally dispersed radionuclides are
subject to the same chemical processes that
may accelerate or retard their transfer rates
and may increase or decrease their
bioaccumulation potentials. These
transformation processes must be taken into
consideration during the exposure
assessment.
Radionuclides undergo radioactive decay
that, in some respects, is similar to the
chemical or biological degradation of
organic compounds. Both processes reduce
the quantity of the hazardous substance in
the environment and produce other
substances. (Note, however, that biological
and chemical transformations can never
alter, i.e., either increase or decrease, the
radioactivity of a radionuclide.) Radioactive
decay products can also contribute
significantly to the radiation exposure and
must be considered in the assessment.
Chapter 6 presents a series of equations
(Exhibits 6-11 through 6-19) for
quantification of chemical exposures. These
equations and suggested default variable
values may be used to estimate radionuclide
intakes as a first approximation, if the
equations are modified by deleting the body
weight and averaging time from the
denominator. However, depending upon the
characteristics of the radionuclides of
concern, consideration of radioactive decay
and ingrowth of radioactive decay products
may be important additions, as well as the
external exposure pathways.
Chapter 6 also refers to a number of
computer models that are used to predict the
behavior and fate of chemicals in the
environment. While those models may be
suitable for evaluations of radioactive
contaminants in some cases, numerous
models have been developed specifically for
evaluating the transport of radionuclides in
the environment and predicting the doses
and risks to exposed individuals. In general,
models developed specifically for
radiological assessments should be used.
Such models include, for example, explicit
consideration of radioactive decay and
ingrowth of radioactive decay products.
(Contact ORP for additional guidance on the
fate and transport models recommended by
EPA.)
10.5.3 QUANTIFYING EXPOSURE: GENERAL
CONSIDERATIONS
One of the primary objectives of an
exposure assessment is to make a reasonable
estimate of the maximum exposure to
individuals and critical population groups. The
equation presented in Exhibit 6-9 to calculate
intake for chemicals may be considered to be
applicable to exposure assessment for
radionuclides, except that the body weight and
averaging time terms in the denominator should
be omitted. However, as discussed previously,
exposures to radionuclides include both internal
and external exposure pathways. In addition,
radiation exposure assessments do not end with
the calculation of intake, but take the calculation
an additional step in order to estimate radiation
dose equivalent.
The radiation dose equivalent to specified
organs and the effective dose equivalent due to
intakes of radionuclides by inhalation or
ingestion are estimated by multiplying the
amount of each radionuclide inhaled or ingested
times appropriate dose conversion factors
(DCFs), which represent the dose equivalent per
unit intake. As noted previously, the effective
dose equivalent is a weighted sum of the dose
equivalents to all irradiated organs and tissues,
and represents a measure of the overall
detriment. Federal Guidance Report No. 11
(EPA 1988) provides DCFs for each of over 700
radionuclides for both inhalation and ingestion
exposures. It is important to note, however, that
these DCFs were developed for regulation of
occupational exposures to radiation and may not
be appropriate for the general population.

Radionuclide intake by inhalation and
ingestion is calculated in the same manner as
chemical intake except that it is not divided by
body weight or averaging time. For
radionuclides, a reference body weight is already
incorporated into the DCFs, and the dose is an
expression of energy deposited per gram of
tissue.
If intake of a radionuclide is defined for a
specific time period (e.g., Bq/year), the dose
equivalent will be expressed in corresponding
terms (e.g., Sv/year). Because systemically
incorporated radionuclides can remain within the
body for long periods of time, internal dose is
best expressed in terms of the committed
effective dose equivalent, which is equal to the
effective dose equivalent over the 50-year period
following intake.
External exposures may be determined by
monitoring and sampling of the radionuclide
concentrations in environmental media, direct
measurement of radiation fields using portable
instrumentation, or by mathematical modeling.
Portable survey instruments that have been
properly calibrated can display dose rates (e.g.,
Sv/hr), and dose equivalents can be estimated by
multiplying by the duration of exposure to the
radiation field. Alternatively, measured or
predicted concentrations in environmental media
may be multiplied by DCFs, which relate
radionuclide concentrations on the ground, in
air, or in water to external dose rates (e.g., Sv/hr
2
per Bq/m for ground contamination or Sv/hr
per Bq/m
3
for air or water immersion).
The dose equivalents associated with
external and internal exposures are expressed in
identical units (e.g., Sv), so that contributions
from all pathways can be summed to estimate
the total effective dose equivalent value and
prioritize risk from different sources.
In general, radiation exposure assessments
need not consider acute toxicity effects. Acute
exposures are of less concern for radionuclides
than for chemicals because the quantities of
radionuclides required to cause adverse effects
from acute exposure are extremely large and
such levels are not normally encountered at
Superfund sites. Toxic effects from acute
Page 10-25
radiation exposures are possible when humans
are exposed to the radiation from large amounts
of radioactive materials released during a major
nuclear plant accident, such as Chernobyl, or
during above-ground weapons detonations.
Consequently, the exposure and risk assessment
guidance for radionuclides presented in this
chapter is limited to situations causing chronic
exposures to low levels of radioactive
contaminants.
10.5.4 QUANTIFYING EXPOSURE:
DETERMINING EXPOSURE POINT
CONCENTRATIONS
The preferred method for estimating the
concentration of chemical or radioactive
contaminants at those places where members of
the public may come into contact with them is
by direct measurement. However, this will not
be possible in many circumstances and it may be
necessary, therefore, to use environmental fate
and transport models to predict contaminant
concentrations. Such modeling would be
necessary, for example: (1) when it is not
possible to obtain representative samples for all
radionuclides of concern; (2) when the
contaminant has not yet reached the potential
exposure points; and (3) when the contaminants
are below the limits of detection but, if present,
can still represent a significant risk to the public.
Numerous fate and transport models have
been developed to estimate contaminant
concentrations in ground water, soil, air, surface
water, sediments, and food chains. Models
developed for chemical contaminants, such as
those discussed in Chapter 6, may also be
applied to radionuclides with allowance for
radioactive decay and ingrowth of decay
products. There are also a number of models that
have been developed specifically for
radionuclides. These models are similar to the
models used for toxic chemicals but have
features that make them convenient to use for
radionuclide pathway analysis, such as explicit
consideration of radioactive decay and daughter
ingrowth. Available models for use in radiation
risk assessments range in complexity from a
series of hand calculations to major computer
codes. For example, NRC Regulatory Guide
1.109 presents a methodology that may be used
to manually estimate dose equivalents from a
variety of exposure pathways (NRC 1977).

Page 10-26
Examples of computerized radiological
assessment models include the AIRDOS-EPA
code and the EPA-PRESTO family of codes,
which are used extensively by EPA to estimate
exposures and doses to populations following
atmospheric releases of radionuclides and
releases from a low-level waste disposal facility,
respectively. Guidance on selection and use of
the various models can be obtained from the
EPA Office of Radiation Programs.
Exhibit 6-10, Example of Table Format
for Summarizing Exposure Concentrations, may
be used for radionuclide contaminants, except
that radionuclide concentrations are expressed in
terms of activity per unit mass or volume of the
environmental medium (e.g., Bq/kg, Bq/L)
rather than mass.
10.5.5 QUANTIFYING EXPOSURE:
ESTIMATING INTAKE AND DOSE
EQUIVALENT
Section 6.6 presents a description of the
methods used to estimate intake rates of
contaminants from the various exposure
pathways. Exhibits 6-11 to 6-19 present the
equations and input assumptions recommended
for use in intake calculations. In concept, those
equations and assumptions also apply generally
to radionuclides, except that the body weight
and averaging time terms in the denominators
should be omitted. However, as discussed
previously, the product of these calculations for
radionuclides is an estimate of the radionuclide
intake, expressed in units of activity (e.g., Bq),
as opposed to mg/kg-day. In addition, the
endpoint of a radiation exposure assessment is
radiation dose, which is calculated using DCFs
as explained below. As explained previously,
dose equivalents calculated in the following
manner should be used to compare with
radiation protection standards and criteria, not to
estimate risk.
Internal Exposure. Exhibits 6-11, 6-12,
6-14, 6-17, 6-18, and 6-19 present simplified
models for the ingestion of water, food, and soil
as pathways for the intake of environmental
contaminants. The recommended assumptions
for ingestion rates and exposure durations are
applicable to radionuclide exposures and may be
used to estimate the intake rates of radionuclides
by these pathways. As noted previously,
however, these intake estimates for
radionuclides should not be divided by the body
weight or averaging time. These intake rates
must be multiplied by appropriate DCF values in
order to obtain committed effective dose
equivalent values. The more rigorous and
complex radionuclide pathway models noted
previously typically require much more
extensive input data and may include default
parameter values that differ somewhat from the
values recommended in these exhibits.
Exhibit 6-16 presents the equation and
assumptions used to estimate the contaminant
intake from air. For radionuclides, the dose from
inhalation of contaminated air is determined as
the product of the radionuclide concentration in
air (Bq/m
3
), the breathing rate (m
3
per day or
year), exposure duration (day or year), and the
inhalation DCF (Sv per Bq inhaled). The result
of this calculation is the committed effective
dose equivalent, in units of Sv.
Chapter 6 points out that dermal
absorption of airborne chemicals is not an
important route of uptake. This point is also true
for most radionuclides, except airborne tritiated
water vapor, which is efficiently taken into the
body through dermal absorption. In order to
account for this route of uptake, the inhalation
DCF for tritium includes an adjustment factor to
account for dermal absorption.
External Exposure. Immersion in air
containing certain beta-emitting and/or photon-
emitting radioactive contaminants can also result
in external exposures. Effective dose equivalents
from external exposure are calculated as the
product of the airborne radionuclide
concentration (Bq/m
3
), the external DCF for air
immersion (Sv/hr per Bq/m
3
), and the duration
of exposure (hours).
Exhibits 6-13 and 6-15 illustrate the
dermal uptake of contaminants resulting from
immersion in water or contact with soil. This
route of uptake can be important for many
organic chemicals; however, dermal uptake is
generally not an important route of uptake for
radionuclides, which have small dermal
permeability constants. External radiation
exposure due to submersion in water
contaminated with radionuclides is possible and
is similar to external exposure due to immersion

in air. However, because of the shielding effects
of water and the generally short durations of
such exposures, immersion in water is typically
of lesser significance. The product of the
radionuclide concentration in water (Bq/m
3
), the
relevant DCF (Sv/hr per Bq/m
3
), and the
duration of exposure (hours) yields effective
dose equivalent.
The third external exposure pathway of
potential significance is irradiation from
radionuclides deposited on the ground surface.
Effective dose equivalents resulting from this
pathway may be estimated as the product of the
soil surface concentration (Bq/m
2
) of photon-
emitting radionuclides of concern, the external
DCF for ground surface exposure (Sv/hr per
Bq/m
2
), and the duration of exposure (hours).
10.5.6 COMBINING INTAKES AND DOSES
ACROSS PATHWAYS
The calculations described previously result in
estimates of committed effective dose
equivalents (Sv) from individual radionuclides
via a large number of possible exposure
pathways. Because a given population may be
subject to multiple exposure pathways, the
results of the exposure assessment should be
organized by grouping all applicable exposure
pathways for each exposed population. Risks
from various exposure pathways and
contaminants then can be integrated during the
risk characterization step (see Section 10.7).
10.5.7 EVALUATING UNCERTAINTY
The radiation exposure assessment should
include a discussion of uncertainty, that, at a
minimum, should include: (1) a tabular
summary of the values used to estimate
exposures and doses and the range of these
values; and (2) a summary of the major
assumptions of the exposure assessment,
including the uncertainty associated with each
assumption and how it might affect the exposure
and dose estimates. Sources of uncertainty that
must be addressed include: (1) how well the
monitoring data represent actual site conditions;
(2) the exposure models, assumptions, and input
variables used to estimate exposure point
concentrations; and (3) the values of the
variables used to estimate intakes and external
exposures. More comprehensive discussions of
Page 10-27
uncertainty associated with radiological risk
assessment are provided in the Background
Information Document for the Draft EIS for
Proposed NESHAPS for Radionuclides (EPA
1989a), Radiological Assessment (Till and
Meyer 1983), and NCRP Report No. 76 (NCRP
1984a).
10.5.8 SUMMARIZING AND PRESENTING
EXPOSURE ASSESSMENT RESULTS
Exhibit 6-22 presents a sample format for
summarizing the results of the exposure
assessment. The format may also be used for
radionuclide contaminants except that the entries
should be specified as committed effective dose
equivalents (Sv) and the annual estimated
intakes (Bq) for each radionuclide of concern.
The intakes and dose estimates should be
tabulated for each exposure pathway so that the
most important radionuclides and pathways
contributing to the total health risk may be
identified.
The information should be organized by
exposure pathway, population exposed, and
current and future use assumptions. For
radionuclides, however, it may not be necessary
to summarize short-term and long-term
exposures separately as specified for chemical
contaminants.
10.6 TOXICITY ASSESSMENT
Chapter 7 describes the two-step process
employed to assess the potential toxicity of a
given chemical contaminant. The first step,
hazard identification, is used to determine
whether exposure to a contaminant can increase
the incidence of an adverse health effect. The
second step, dose-response assessment, is used
to quantitatively evaluate the toxicity
information and characterize the relationship
between the dose of the contaminant
administered or received and the incidence of
adverse health effects in the exposed population.
There are certain fundamental differences
between radionuclides and chemicals that
somewhat simplify toxicity assessment for
radionuclides. As discussed in the previous
sections, the adverse effects of exposure to
radiation are due to the energy deposited in
sensitive tissue, which is referred to as the

Page 10-28
radiation dose. In theory, any dose of radiation
has the potential to produce an adverse effect.
Accordingly, exposure to any radioactive
substances is, by definition, hazardous.
Dose-response assessment for
radionuclides is also more straightforward. The
type of effects and the likelihood of occurrence
of any one of a number of possible adverse
effects from radiation exposure depends on the
radiation dose. The relationship between dose
and effect is relatively well characterized (at
high doses) for most types of radiations. As a
result, the toxicity assessment, within the
context that it is used in this manual, need not be
explicitly addressed in detail for individual
radionuclides at each contaminated site.
The sections that follow provide a brief
summary of the human and experimental animal
studies that establish the hazard and dose-
response relationship for radiation exposure.
More detailed discussions of radiation toxicity
are provided in publications of the National
Academy of Sciences Committee on Biological
Effects of Ionizing Radiation (BEIR), the United
Nations Scientific Committee on Effects of
Atomic Radiation (UNSCEAR), NRC, NCRP,
and ICRP listed in the box on this page.
10.6.1 HAZARD IDENTIFICATION
The principal adverse biological effects
associated with ionizing radiation exposures
from radioactive substances in the environment
are carcinogenicity, mutagenicity, and
teratogenicity. Carcinogenicity is the ability to
produce cancer. Mutagenicity is the property of
being able to induce genetic mutation, which
may be in the nucleus of either somatic (body)
or germ (reproductive) cells. Mutations in germ
cells lead to genetic or inherited defects.
Teratogenicity refers to the ability of an agent to
induce or increase the incidence of congenital
malformations as a result of permanent
structural or functional deviations produced
during the growth and development of an
embryo (more commonly referred to as birth
defects). Radiation may induce other deleterious
effects at acute doses above about 1 Sv, but
doses of this magnitude are not normally
associated with radioactive contamination in the
environment.
REFERENCES ON HEALTH EFFECTS
OF RADIATION EXPOSURE
Recommendations of the ICRP (ICRP 1977)
Limits for Intake of Radionuclides by Workers
(ICRP 1979)
Influence of Dose and Its Distribution in Time on
Dose-Response Relationships for Low-LET
Radiations (NCRP 1980)
The Effects on Populations of Exposure to Low
Levels of Ionizing Radiation (NAS 1980)
Induction of Thyroid Cancer by Ionizing Radiation
(NCRP 1985b)
Lung Cancer Risk from Indoor Exposures to Radon
Daughters (ICRP 1987)
Health Risks of Radon and Other Internally
Deposited Alpha-Emitters (National Academy of
Sciences 1988)
Ionizing Radiation: Sources, Effects, and
Risks (UNSCEAR 1988)
Health Effects Models for Nuclear Power
Plant Accident Consequence Analysis: Low-LET
Radiation (NRC 1989)
As discussed in Section 10.1, ionizing
radiation causes injury by breaking molecules
into electrically charged fragments (i.e., free
radicals), thereby producing chemical
rearrangements that may lead to permanent
cellular damage. The degree of biological
damage caused by various types of radiation
varies according to how spatially close together
the ionizations occur. Some ionizing radiations
(e.g., alpha particles) produce high density
regions of ionization. For this reason, they are
called high-LET (linear energy transfer)
particles. Other types of radiation (e.g., x-rays,
gamma rays, and beta particles) are called low-
LET radiations because of the low density
pattern of ionization they produce. In equal
doses, the carcinogenicity and mutagenicity of
high-LET radiations may be an order of
magnitude or more greater than those of low-
LET radiations, depending on the endpoint being
evaluated. The variability in biological
effectiveness is accounted for by the quality
factor used to calculate the dose equivalent (see
Section 10.1).

Carcinogenesis. An extensive body of
literature exists on radiation carcinogenesis in
man and animals. This literature has been
reviewed most recently by the United Nations
Scientific Committee on the Effects of Atomic
Radiation (UNSCEAR) and the National
Academy of Sciences Advisory Committee on
the Biological Effects of Ionizing Radiations
(NAS-BEIR Committee) (UNSCEAR 1977,
1982, 1988; NAS 1972, 1980, 1988). Estimates
of the average risk of fatal cancer from low-LET
radiation from these studies range from
approximately 0.007 to 0.07 fatal cancers per
sievert.
An increase in cancer incidence or
mortality with increasing radiation dose has
been demonstrated for many types of cancer in
both human populations and laboratory animals
(UNSCEAR 1982, 1988; NAS 1980, 1988).
Studies of humans exposed to internal or
external sources of ionizing radiation have
shown that the incidence of cancer increases
with increased radiation exposure. This
increased incidence, however, is usually
associated with appreciably greater doses and
exposure frequencies than those encountered in
the environment. Therefore, risk estimates from
small doses obtained over long periods of time
are determined by extrapolating the effects
observed at high, acute doses. Malignant tumors
in various organs most often appear long after
the radiation exposure, usually 10 to 35 years
later (NAS 1980, 1988; UNSCEAR 1982,
1988). Radionuclide metabolism can result in
the selective deposition of certain radionuclides
in specific organs or tissues, which, in turn, can
result in larger radiation doses and higher-than-
normal cancer risk in these organs.
Ionizing radiation can be considered
pancarcinogenic, i.e., it acts as a complete
carcinogen in that it serves as both initiator and
promoter, and it can induce cancers in nearly
any tissue or organ. Radiation-induced cancers
in humans have been reported in the thyroid,
female breast, lung, bone marrow (leukemia),
stomach, liver, large intestine, brain, salivary
glands, bone, esophagus, small intestine, urinary
bladder, pancreas, rectum, lymphatic tissues,
skin, pharynx, uterus, ovary, mucosa of cranial
sinuses, and kidney (UNSCEAR 1977, 1982,
1988; NAS 1972, 1980, 1988). These data are
taken primarily from studies of human
Page 10-29
populations exposed to high levels of radiation,
including atomic bomb survivors, underground
miners, radium dial painters, patients injected
with thorotrast or radium, and patients who
received high x-ray doses during various
treatment programs. Extrapolation of these data
to much lower doses is the major source of
uncertainty in determining low-level radiation
risks (see EPA 1989a). It is assumed that no
lower threshold exists for radiation
carcinogenesis.
On average, approximately 50 percent of
all of the cancers induced by radiation are lethal.
The fraction of fatal cancers is different for each
type of cancer, ranging from about 10 percent in
the case of thyroid cancer to 100 percent in the
case of liver cancer (NAS 1980, 1988). Females
have approximately 2 times as many total
cancers as fatal cancers following radiation
exposure, and males have approximately 1.5
times as many (NAS 1980).
Mutagenesis. Very few quantitative data
are available on radiogenic mutations in humans,
particularly from low-dose exposures. Some
mutations are so mild they are not noticeable,
while other mutagenic effects that do occur are
similar to nonmutagenic effects and are
therefore not necessarily recorded as mutations.
The bulk of data supporting the mutagenic
character of ionizing radiation comes from
extensive studies of experimental animals
(UNSCEAR 1977, 1982, 1988; NAS 1972,
1980, 1988). These studies have demonstrated
all forms of radiation mutagenesis, including
lethal mutations, translocations, inversions,
nondisjunction, and point mutations. Mutation
rates calculated from these studies are
extrapolated to humans and form the basis for
estimating the genetic impact of ionizing
radiation on humans (NAS 1980, 1988;
UNSCEAR 1982, 1988). The vast majority of
the demonstrated mutations in human germ cells
contribute to both increased mortality and illness
(NAS 1980; UNSCEAR 1982). Moreover, the
radiation protection community is generally in
agreement that the probability of inducing
genetic changes increases linearly with dose and
that no "threshold" dose is required to initiate
heritable damage to germ cells.
The incidence of serious genetic disease
due to mutations and chromosome aberrations

Page 10-30
induced by radiation is referred to as genetic
detriment. Serious genetic disease includes
inherited ill health, handicaps, or disabilities.
Genetic disease may be manifest at birth or may
not become evident until some time in
adulthood. Radiation-induced genetic detriment
includes impairment of life, shortened life span,
and increased hospitalization. The frequency of
radiation-induced genetic impairment is
relatively small in comparison with the magnitude
of detriment associated with spontaneously arising
genetic diseases (UNSCEAR 1982, 1988).
Teratogenesis. Radiation is a well-known
teratogenic agent. The developing fetus is much
more sensitive to radiation than the mother. The
age of the fetus at the time of exposure is the
most important factor in determining the extent
and type of damage from radiation. The
malformations produced in the embryo depend
on which cells, tissues, or organs in the fetus are
most actively differentiating at the time of
radiation exposure. Embryos are relatively
resistant to radiation-induced teratogenic effects
during the later stages of their development and
are most sensitive from just after implantation
until the end of organogenesis (about two weeks
to eight weeks after conception) (UNSCEAR
1986; Brent 1980). Effects on nervous system,
skeletal system, eyes, genitalia, and skin have
been noted (Brent 1980). The brain appears to be
most sensitive during development of the
neuroblast (these cells eventually become the
nerve cells). The greatest risk of brain damage
for the human fetus occurs at 8 to 15 weeks,
which is the time the nervous system is
undergoing the most rapid differentiation and
proliferation of cells (Otake 1984).
10.6.2 DOSE-RESPONSE RELATIONSHIPS
This section describes the relationship of
the risk of fatal cancer, serious genetic effects,
and other detrimental health effects to exposure
to low levels of ionizing radiation. Most
important from the standpoint of the total
societal risk from exposures to low-level
ionizing radiation are the risks of cancer and
genetic mutations. Consistent with our current
understanding of their origins in terms of DNA
damage, these effects are believed to be
stochastic; that is, the probability (risk) of these
effects increases with the dose of radiation, but
the severity of the effects is independent of dose.
For neither induction of cancer nor genetic
effects, moreover, is there any convincing
evidence for a "threshold" (i.e., some dose level
below which the risk is zero). Hence, so far as is
known, any dose of ionizing radiation, no matter
how small, might give rise to a cancer or to a
genetic effect in future generations. Conversely,
there is no way to be certain that a given dose of
radiation, no matter how large, has caused an
observed cancer in an individual or will cause
one in the future.
Exhibit 10-5 summarizes EPA's current
estimates of the risk of adverse effects
associated with human exposure to ionizing
radiation (EPA 1989a). Important points from
this summary table are provided below.
Very large doses (>1 Sv) of radiation are
required to induce acute and irreversible
adverse effects. It is unlikely that such
exposures would occur in the environmental
setting associated with a potential Superfund
site.
The risks of serious noncarcinogenic effects
associated with chronic exposure to
radiation include genetic and teratogenic
effects. Radiation-induced genetic effects
have not been observed in human
populations, and extrapolation from animal
data reveals risks per unit exposure that are
smaller than, or comparable to, the risk of
cancer. In addition, the genetic risks are
spread over several generations. The risks
per unit exposure of serious teratogenic
effects are greater than the risks of cancer.
However, there is a possibility of a
threshold, and the exposures must occur
over a specific period of time during
gestation to cause the effect. Teratogenic
effects can be induced only during the nine
months of pregnancy. Genetic effects are
induced during the 30-year reproductive
generation and cancer can be induced at any
point during the lifetime. If a radiation
source is not controlled, therefore, the
cumulative risk of cancer may be many
times greater than the risk of genetic or
teratogenic effects due to the potentially
longer period of exposure.

Page 10-31
EXHIBIT 10-5
SUMMARY OF EPA'S RADIATION RISK FACTORS
a
Risk Significant Exposure Period Risk Factor Range
Low LET (Gy
-1
)
Teratogenic
:
b
Severe mental retardation
Weeks 8 to 15 of gestation 0.25-0.55
Genetic:
Severe hereditary defects, 30-year reproductive generation 0.006-0.11
all generations
Somatic:
Fatal cancers
Lifetime 0.012-0.12
In utero
0.029-0.10
All cancers
Lifetime
0.019-0.19
High LET (Gy
-1
)
Genetic:
Severe hereditary defects, 30-year reproductive generation 0.016-0.29
all generations
Somatic:
Fatal cancers Lifetime 0.096-0.96
All cancers Lifetime 0.15-1.5
Radon Decay Products (10
–6
LM
–1
)
Fatal lung cancer Lifetime 140-720
a
In addition to the stochastic risks indicated, acute toxicity may occur at a mean lethal dose of 3-5 Sv with a
threshold in excess of 1 Sv.
b
The range assumes a linear, non-threshold dose-response. However, it is plausible that a threshold may exist for
this effect.

Page 10-32
Based on these observations, it appears
that the risk of cancer is limiting and may be
used as the sole basis for assessing the radiation-
related human health risks of a site contaminated
with radionuclides.
For situations where the risk of cancer
induction in a specific target organ is of primary
interest, the committed dose equivalent to that
organ may be multiplied by an organ-specific
risk factor. The relative radiosensitivity of
various organs (i.e., the cancer induction rate per
unit dose) differs markedly for different organs
and varies as a function of the age and sex of the
exposed individual. Tabulations of such risk
factors as a function of age and sex are provided
in the Background Information Document for
the Draft Environmental Impact Statement for
Proposed NESHAPS for Radionuclides (EPA
1989a) for cancer mortality and cancer
incidence.
10.7 RISK CHARACTERIZATION
Comment [A67]: EPA’s Risk Assessment
Guidance for Superfund Volume I: Human
Health Evaluation Manual (Part D, Standardized
Planning, Reporting, and Review of Superfund
Risk Assessments) provides planning tables and
worksheets for use during the risk assessment
process, radiation risk characterization
. See
Part
D, Section 3.1.1, page 3-10 for an overview of
using Planning Table 8: Calculation of Radiation
Cancer Risks and page 3-11 for an overview of
the radiation dose assessment worksheet. Also
see Appendix 1 for the downloadable Planning
Tables and instructions for completing the
tables
. See
Appendix C for the planning
worksheets. RAGS, Part D may be found at:
http://www.epa.gov/oswer/riskassessment/rags
d/index.htm
The final step in the risk assessment
process is risk characterization. This is an
integration step in which the risks from
individual radionuclides and pathways are
quantified and combined where appropriate.
Uncertainties also are examined and discussed in
this step.
10.7.1 REVIEWING OUTPUTS FROM THE
TOXICITY AND EXPOSURE
ASSESSMENTS
The exposure assessment results should be
expressed as estimates of radionuclide intakes
by inhalation and ingestion, exposure rates and
duration for external exposure pathways, and
committed effective dose equivalents to
individuals from all relevant radionuclides and
pathways. The risk assessor should compile the
supporting documentation to ensure that it is
sufficient to support the analysis and to allow an
independent duplication of the results. The
review should also confirm that the analysis is
reasonably complete in terms of the
radionuclides and pathways addressed.
In addition, the review should evaluate the
degree to which the assumptions inherent in the
analysis apply to the site and conditions being
addressed. The mathematical models used to
calculate dose use a large number of
environmental transfer factors and dose
conversion factors that may not always be
entirely applicable to the conditions being
analyzed. For example, the standard dose
conversion factors are based on certain generic
assumptions regarding the characteristics of the
exposed individual and the chemical and
physical properties of the radionuclides. Also, as
is the case for chemical contaminants, the
environmental transfer factors used in the
models may not apply to all settings.
Though the risk assessment models may
include a large number of radionuclides and
pathways, the important radionuclides and
pathways are usually few in number. As a result,
it is often feasible to check the computer output
using hand calculations. This type of review can
be performed by health physicists familiar with
the models and their limitations. Guidance on
conducting such calculations is provided in
numerous references, including Till and Meyer
(1983) and NCRP Report No. 76 (NCRP
1984a).
10.7.2 QUANTIFYING RISKS
Given that the results of the exposure
assessment are virtually complete, correct, and
applicable to the conditions being considered,
the next step in the process is to calculate and
combine risks. As discussed previously, the risk
assessment for radionuclides is somewhat
simplified because only radiation carcinogenesis
needs to be considered.
Section 10.5 presents a methodology for
estimating committed effective dose equivalents
that may be compared with radiation protection
standards and criteria. Although the product of
these dose equivalents (Sv) and an appropriate
risk factor (risk per Sv) yields an estimate of
risk, the health risk estimate derived in such a
manner is not completely applicable for
members of the general public. A better
estimate of risk may be computed using age-and
sex-specific coefficients for individual organs
receiving significant radiation doses. This
information may be used along with organ-
specific dose conversion factors to derive slope
factors that represent the age-averaged lifetime

Page 10-33
excess cancer incidence per unit intake for the
radionuclides of concern. The Integrated Risk
Information System (IRIS) contains slope factor
values for radionuclides of concern at remedial
sites for each of the four major exposure
pathways (inhalation, ingestion, air immersion,
and ground-surface irradiation), along with
supporting documentation for the derivation of
these values (see Chapter 7 for more detail on
IRIS).
The slope factors from the IRIS data base
for the inhalation pathway should be multiplied
by the estimated inhaled activity (derived using
the methods presented in Section 6.6.3 and
Exhibit 6-16, without division of the body
weight and averaging time) for each
radionuclide of concern to estimate risks from
the inhalation pathway. Similarly, risks from the
ingestion pathway should be estimated by
multiplying the ingestion slope factors by the
activity ingested for each radionuclide of
concern (derived using the methods presented in
Exhibits 6-11, 6-12, 6-14, 6-17, 6-18, and 6-19,
without division by the body weight and
averaging time). Estimates of the risk from the
air immersion pathway should be computed by
multiplying the appropriate slope factors by the
airborne radionuclide concentration (Bq/m
3
) and
the duration of exposure. Risk from the ground
surface pathway should be computed as the
product of the slope factor, the soil
concentration (Bq/m
2
), and the duration of
exposure for each radionuclide of concern.
The sum of the risks from all
radionuclides and pathways yields the lifetime
risk from the overall exposure. As discussed in
Chapter 8, professional judgment must be used
in combining the risks from various pathways,
as it may not be physically possible for one
person to be exposed to the maximum
radionuclide concentrations for all pathways.
10.7.3 COMBINING RADIONUCLIDE AND
CHEMICAL CANCER RISKS
Comment [A68]: EPA has updated its
recommendation concerning the summing of
radiation cancer risks and chemical cancer risks.
As stated in its December 1999 document
Radiation Risk Assessment at CERCLA Sites:
Q&A
(see Q28, page 11), “[e]xcess cancer risk
from both radionuclides and chemical
carcinogens should be summed to provide an
estimate of the combined risk presented by all
carcinogenic contaminants. An exception would
be cases in which a person reasonably cannot
be exposed to both chemical and radiological
carcinogens. Similarly, the chemical toxicity
from uranium should be combined with that of
other site-related contaminants.” While there
are differences between slope factors for
radionuclides and chemicals, similar differences
also occur between different chemical slope
factors. In the absence of additional
information, it is reasonable to assume that
excess cancer risks are additive when
evaluating the total incremental cancer risk
associated with contaminated sites.
EPA continues to recommend that risk
estimates for radionuclides and chemical
contaminants also be tabulated and presented
separately in the risk characterization report.
The Radiation Risk Assessment Q&A may be
found at:
http://www.epa.gov/superfund/health/contamin
ants/radiation/pdfs/riskqa.pdf
Estimates of the lifetime risk of cancer to
exposed individuals resulting from radiological
and chemical risk assessments may be summed
in order to determine the overall potential human
health hazard associated with a site. Certain
precautions should be taken, however, before
summing these risks. First, the risk assessor
should evaluate whether it is reasonable to
assume that the same individual can receive the
maximum radiological and chemical dose. It is
possible for this to occur in some cases because
many of the environmental transport processes
and routes of exposure are the same for
radionuclides and chemicals.
In cases where different environmental
fate and transport models have been used to
predict chemical and radionuclide exposure, the
mathematical models may incorporate somewhat
different assumptions. These differences can
result in incompatibilities in the two estimates of
risk. One important difference of this nature is
how the cancer toxicity values (i.e., slope
factors) were developed. For both radionuclides
and chemicals, cancer toxicity values are
obtained by extrapolation from experimental and
epidemiological data. For radionuclides,
however, human epidemiological data form the
basis of the extrapolation, while for many
chemical carcinogens, laboratory experiments
are the primary basis for the extrapolation.
Another even more fundamental difference
between the two is that slope factors for
chemical carcinogens generally represent an
upper bound or 95th percent confidence limit
value, while radionuclide slope factors are best
estimate values.
In light of these limitations, the two sets of
risk estimates should be tabulated separately in
the final baseline risk assessment.
10.7.4 ASSESSING AND PRESENTING
UNCERTAINTIES
Uncertainties in the risk assessment must
be evaluated and discussed, including
uncertainties in the physical setting definition
for the site, in the models used, in the exposure
parameters, and in the toxicity assessment.
Monte Carlo uncertainty analyses are frequently
performed as part of the uncertainty and
sensitivity analysis for radiological risk
assessments. A summary of the use of
uncertainty analyses in support of radiological
risk assessments is provided in NCRP Report
No. 76 (NCRP 1984a), Radiological Assessment
(Till and Meyer 1983), and in the Background
Information Document for the Draft EIS for

Page 10-34
Proposed NESHAPs for Radionuclides (EPA
1989a).
10.7.5 SUMMARIZING AND PRESENTING
THE BASELINE RISK
CHARACTERIZATION RESULTS
The results of the baseline risk
characterization should be summarized and
presented in an effective manner to assist in
decision-making. The estimates of risk should be
summarized in the context of the specific site
conditions. Information should include the
identity and concentrations of radionuclides,
types and magnitudes of health risks predicted,
uncertainties in the exposure estimates and
toxicity information, and characteristics of the
site and potentially exposed populations. A
summary table should be provided in a format
similar to that shown in Exhibit 6-22, as well as
graphical presentations of the predicted health
risks (see Exhibit 8-7).
10.8 DOCUMENTATION, REVIEW, AND
MANAGEMENT TOOLS FOR THE
RISK ASSESSOR, REVIEWER, AND
MANAGER
The discussion provided in Chapter 9 also
applies to radioactively contaminated sites. The
suggested outline provided in Exhibit 9-1 may
also be used for radioactively contaminated sites
with only minor modifications. For example, the
portions that uniquely pertain to the CLP
program and noncarcinogenic risks are not
needed. In addition, because radionuclide hazard
and toxicity have been addressed adequately on
a generic basis, there is no need for an extensive
discussion of toxicity in the report.

Page 10-35
REFERENCES FOR CHAPTER 10
American Public Health Association. 1987. QA Procedures for Health Labs Radiochemistry.
Beebe, G.W., Kato, H., and Land, C.E. 1977. Mortality Experience of Atomic Bomb Survivors, 1950-1974, Life Span Study Report 8.
RERFTR 1-77. Radiation Effects Research Foundation. Japan.
Brent, R.L. 1980. Radiation Teratogenesis. Teratology 21:281-298.
Cember, H. 1983. Introduction to Health Physics (2nd Ed.) Pergamon Press. New York, NY.
Department of Energy (DOE). 1987. The Environmental Survey Manual. DOE/EH-0053.
Department of Energy (DOE). 1988. External Dose-Rate Conversion Factors for Calculation of Dose to the Public. DOE/EH-0070.
Department of Energy (DOE). 1989. Environmental Monitoring for Low-level Waste Disposal Sites. DOE/LLW-13Tg.
Eisenbud, M. 1987. Environmental Radioactivity (3rd Ed.) Academic Press. Orlando, FL.
Environmental Protection Agency (EPA). 1972. Environmental Monitoring Surveillance Guide.
Environmental Protection Agency (EPA). 1977a. Handbook of Analytical Quality Control in Radioanalytical Laboratories. Office of
Research and Development. EPA/600/7-77/008.
Environmental Protection Agency (EPA). 1977b. Quality Control for Environmental Measurements Using Gamma-Ray Spectrometry.
EPA/500/7-77/14.
Environmental Protection Agency (EPA). 1979a. Radiochemical Analytical Procedures for Analysis of Environmental Samples. EMSL-
LV 0539-17.
Environmental Protection Agency (EPA). 1980. Upgrading Environmental Radiation Data. Office of Radiation Programs. EPA/520/1-
80/012.
Environmental Protection Agency (EPA). 1984a. Eastern Environmental Radiation Facility Radiochemistry Procedures Manual. Office
of Radiation Programs. EPA/520/5-84/006.
Environmental Protection Agency (EPA). 1984b. Federal Guidance Report No. 10: The Radioactivity Concentration Guides. Office of
Radiation Programs. EPA/520/1-84/010.
Environmental Protection Agency (EPA). 1987a. Population Exposure to External Natural Radiation Background in the United States.
Office of Radiation Programs. EPA ORP/SEPD-80-12.
Environmental Protection Agency (EPA). 1987b. Handbook of Analytical Quality Control in Radioanalytical Laboratories. Office of
Research and Development. EPA/600/7-87/008.
Environmental Protection Agency (EPA). 1988. Federal Guidance Report No. 11: Limiting Values of Radionuclide Intake and Air
Concentration and Dose Conversion Factors for Inhalation, Submersion, and Ingestion. Office of Radiation Programs.
EPA/520/1-88/020.
Environmental Protection Agency (EPA). 1989a. Background Information Document, Draft EIS for Proposed NESHAPS for
Radionuclides,
Volume I, Risk Assessment Methodology. Office of Radiation Programs. EPA/520/1-89/005.
Environmental Protection Agency (EPA). 1989b. Annual Report Fiscal Year 1988 Laboratory Intercomparison Studies for
Radionuclides.
Environmental Protection Agency (EPA). 1989c. CERCLA Compliance with Other Laws Manual. Part II. Office of Emergency and
Remedial Response. (OSWER Directive 9234.1-02).
International Commission on Radiological Protection (ICRP). 1977. Recommendations of the ICRP. ICRP Publication 26.
International Commission on Radiological Protection (ICRP). 1979. Limits for Intake of Radionuclides by Workers. ICRP Publication
30.
International Commission on Radiological Protection (ICRP). 1983. Principles for Limiting Exposure of the Public to Natural Sources of
Radiation. ICRP Publication 39.
International Commission on Radiological Protection (ICRP). 1984. A Compilation of the Major Concepts and Quantities in Use by the
ICRP. ICRP Publication 42.

Page 10-36
International Commission on Radiological Protection (ICRP). 1985. Principles of Monitoring for the Radiation Protection of the
Population. ICRP Publication 43.
International Commission on Radiological Protection (ICRP). 1987. Lung Cancer Risk from Indoor Exposures to Radon Daughters.
ICRP Publication 50.
Kato, H. and Schull, W.J. 1982. Studies of the Mortality of A-Bomb Survivors. Report 7 Part 1, Cancer Mortality Among Atomic Bomb
Survivors, 1950-78. Radiation Research 90:395-432.
Kocher, D. 1981. Radioactive Decay Data Tables: A Handbook of Decay Data for Application to Radiation Dosimetry and Radiological
Assessments. DOE/TIC-11026.
Miller. 1984. Models and Parameters for Environmental Radiological Assessments. DOE/TIC-11468.
National Academy of Sciences - National Research Council. 1972. The Effects on Populations of Exposures to Low Levels of Ionizing
Radiation. (BEIR Report).
National Academy of Sciences - National Research Council. 1980. The Effects on Populations of Exposures to Low Levels of Ionizing
Radiation. (BEIR Report).
National Academy of Sciences - National Research Council. 1988. Health Risks of Radon and Other Internally Deposited Alpha-
Emitters. (BEIR Report).
National Council on Radiation Protection and Measurements (NCRP). 1989. Screening Techniques for Determining Compliance with
Environmental Standards. NCRP Commentary No. 3.
National Council on Radiation Protection and Measurements (NCRP). 1976. Environmental Radiation Measurements. NCRP Report No.
50.
National Council on Radiation Protection and Measurements (NCRP). 1978. Instrumentation and Monitoring Methods for Radiation
Protection. NCRP Report No. 57.
National Council on Radiation Protection and Measurements (NCRP). 1979. Tritium in the Environment. NCRP Report No. 62.
National Council on Radiation Protection and Measurements (NCRP). 1980. Influence of Dose and Its Distribution in Time on Dose-
response Relationships for Low-LET Radiations. NCRP Report No. 64.
National Council on Radiation Protection and Measurements (NCRP). 1984a. Radiological Assessment: Predicting the Transport,
Bioaccumulation, and Uptake by Man of Radionuclides Released to the Environment. NCRP Report No. 76.
National Council on Radiation Protection and Measurements (NCRP). 1984b. Exposure from the Uranium Series with Emphasis on
Radon and its Daughters. NCRP Report No. 77.
National Council on Radiation Protection and Measurements (NCRP). 1985a. A Handbook of Radioactivity Measurement Procedures.
NCRP Report No. 58.
National Council on Radiation Protection and Measurements (NCRP). 1985b. Induction of Thyroid Cancer by Ionizing Radiation. NCRP
Report No. 80.
National Council on Radiation Protection and Measurements (NCRP). 1985c. Carbon-14 in the Environment. NCRP Report No. 81.
National Council on Radiation Protection and Measurements (NCRP). 1987a. Ionizing Radiation Exposure of the Population of the
United States. NCRP Report No. 93.
National Council on Radiation Protection and Measurements (NCRP). 1987b. Exposure of the Population of the United States and
Canada from Natural Background Radiation. NCRP Report No. 94.
National Council on Radiation Protection and Measurements (NCRP). 1989. Screening Techniques for Determining Compliance with
Environmental Standards. NCRP Commentary No. 3.
Nuclear Regulatory Commission (NRC). 1977. Calculation of Annual Doses to Man from Routine Releases of Reactor Effluents for the
Purpose of Evaluating Compliance with 10 CFR 50, Appendix I. Regulatory Guide 1.109.
Nuclear Regulatory Commission (NRC). 1979. Quality Assurance Monitoring Programs (Normal Operation) -- Effluent Streams and the
Environment. NRC Regulatory Guide 4.15.
Nuclear Regulatory Commission (NRC). 1989. Health Effects Models for Nuclear Power Plant Accident Consequence Analysis: Low-
LET Radiation, Part II: Scientific Bases for Health Effects Models. NUREG/CR-4214, Rev. 1. Part II.

Page 10-37
Otake, M. and Schull W. 1984. Mental Retardation in Children Exposed in Utero to the Atomic Bombs: A Reassessment. Technical
Report RERF TR 1-83. Radiation Effects Research Foundation. Japan.
Schleien, B. and Terpilak, M., (Eds). 1984. The Health Physics and Radiological Health Handbook. (7th Ed.) Nucleon Lectern Assoc.,
Inc. Maryland.
Till, J.E. and Meyer, H.R. 1983. Radiological Assessment: A Textbook on Environmental Dose Analysis. Prepared for Office of
Nuclear Reactor Regulation. U.S. Nuclear Regulatory Commission. Washington, DC. NUREG/CR-3332.
Turner, J.E. 1986. Atoms, Radiation, and Radiation Protection. Pergamon Press. New York, NY.
United Nations Scientific Committee Report on the Effects of Atomic Radiation (UNSCEAR). 1958. Official Records: Thirteenth
Session, Supplement No. 17(A/3838). United Nations. New York, NY.
United Nations Scientific Committee on the Effects of Atomic Radiation (UNSCEAR). 1977. Sources and Effects of Ionizing Radiation.
United Nations. New York, NY.
United Nations Scientific Committee on the Effects of Atomic Radiation (UNSCEAR). 1982. Ionizing Radiation: Sources and Effects.
United Nations. New York, NY.
United Nations Scientific Committee on the Effects of Atomic Radiation (UNSCEAR). 1986. Genetic and Somatic Effects of Ionizing
Radiation. United Nations. New York, NY.
United Nations Scientific Committee on the Effects of Atomic Radiation (UNSCEAR). 1988. Sources, Effects, and Risks of Ionizing
Radiation. United Nations. New York, NY.
Wakabayashi, T., et al. 1983. Studies of the Mortality of A-Bomb Survivors, Report 7, Part III, Incidence of Cancer in 1959-1978, Based
on the Tumor Registry, Nagasaki. Radiat. Res. 93: 112-146.

APPENDIX A
ADJUSTMENTS FOR
ABSORPTION EFFICIENCY
This appendix contains example
calculations for absorption efficiency
adjustments that might be needed for Superfund
site risk assessments. Absorption adjustments
might be necessary in the risk characterization
step to ensure that the site exposure estimate and
the toxicity value for comparison are both
expressed as absorbed doses or both expressed
as intakes.
Information concerning absorption
efficiencies might be found in the sections
describing absorption toxicokinetics in HEAs,
HEEDs, HEEPs, HADs, EPA drinking water
quality criteria or ambient water quality criteria
documents, or in ATSDR toxicological profiles.
If there is no information on absorption
efficiency by the oral/inhalation routes, one can
attempt to find absorption efficiencies for
chemically related substances. If no information
is available, conservative default assumptions
might be used. Contact ECAO for further
guidance.
Adjustments may be necessary to match
the exposure estimate with the toxicity value if
one is based on an absorbed dose and the other
is based on an intake (i.e., administered dose).
Adjustments may also be necessary for different
vehicles of exposure (e.g., water, food, or soil).
For the dermal route of exposure, the
procedures outlined in Chapter 6 result in an
estimate of the absorbed dose. Toxicity values
that are expressed as administered doses will
need to be adjusted to absorbed doses for
comparison. This adjustment is discussed in
Section A.1.
For the other routes of exposure (i.e., oral
and inhalation), the procedures outlined in
Chapter 6 result in an estimate of daily intakes.
If the toxicity value for comparison is expressed
as an administered dose, no adjustment may be
necessary (except, perhaps, for vehicle of
exposure). If the toxicity value is expressed as
an absorbed dose, however, adjustment of the
exposure estimate (i.e., intake) to an absorbed
dose is needed for comparison with the toxicity
value. This adjustment is discussed in Section
A.2.
Adjustments also may be necessary for
different absorption efficiencies depending on
the medium of exposure (e.g., contaminants
ingested with food or soil might be less
completely absorbed than contaminants ingested
with water). This adjustment is discussed in
Section A.3.
A.1 ADJUSTMENTS OF TOXICITY
VALUE FROM ADMINISTERED TO
ABSORBED DOSE
Comment [A69]: EPA has supplemented the
guidance presented in this document on the
adjustment of toxicity values from administered
to absorbed dose. This supplemental
information can be found in
Risk Assessment
Guide for Superfund (Part E, Supplemental
Guidance for Dermal Risk Assessment).
Please
consult Sections 4.2 and 4.3 for a description of
the approach for adjusting toxicity factors and
calculating absorbed toxicity values. RAGS Part
E may be found at:
http://epa.gov/oswer/riskassessment/ragse/ind
ex.htm
Because there are few, if any, toxicity
ACRONYMS FOR APPENDIX A
ATSDR = Agency for Toxic Substances and
Disease Registry
ECAO = Environmental Criteria and Assessment
Office
HAD = Health Assessment Docum ent
HEA = Health Effects Assessment
HEED = Health and Environmental Effects
Document
HEEP = Health and Environmental Effects
Profile
RfD = Reference Dose

Page A-2
DEFINITIONS FOR APPENDIX A
Absorbed Dose. The amount of a substance penetrating the exchange boundaries of an organism after
contact. Absorbed dose is calculated from the intake and the absorption efficiency, and it
usually is expressed as mass of a substance absorbed into the body per unit body weight per
unit time (e.g., mg/kg-day).
Administered Dose. The mass of substance administered to an organism and in contact with an
exchange boundary (e.g., gastrointestinal tract) per unit body weight per unit time (e.g.,
mg/kg-day).
Exposure Route. The way a chemical or physical agent comes in contact with an organism (i.e., by
ingestion, inhalation, or dermal contact).
Intake. A measure of exposure expressed as the mass of substance in contact with the exchange
boundary per unit body weight per unit time (e.g., mg/kg-day). Also termed the normalized
exposure rate, equivalent to administered dose.
Reference Dose (RfD). The Agency's preferred toxicity value for evaluating noncarcinogenic effects
resulting from exposures at Superfund sites. See specific entries for chronic RfD, subchronic
RfD, and developmental RfD. The acronym RfD, when used without other modifiers, either
refers generically to all types of RfDs or specifically to chronic RfDs; it never refers
specifically to subchronic or developmental RfDs.
Slope Factor. A plausible upper-bound estimate of the probability of a response per unit intake of a
chemical over a lifetime. The slope factor is used to estimate an upper-bound probability of an
individual developing cancer as a result of
reference values for dermal exposure, oral
values are frequently used to assess risks from
dermal exposure. Most RfDs and some slope
factors are expressed as the amount of substance
administered per unit time and unit body weight,
whereas exposure estimates for the dermal route
of exposure are eventually expressed as
absorbed doses. Thus, for dermal exposure to
contaminants in water or in soil, it may be
necessary to adjust an oral toxicity value from
an administered to an absorbed dose. In the
boxes to the right and on the next page are
samples of adjustments for an oral RfD and an
oral slope factor, respectively. If the oral toxicity
value is already expressed as an absorbed dose
(e.g., trichloroethylene), it is not necessary to
adjust the toxicity value.
In the absence of any information on
absorption for the substance or chemically
related substances, one must assume an oral
absorption efficiency. Assuming 100 percent
absorption in an oral administration study that
serves as the basis for an RfD or slope factor
EXAMPLE: ADJUSTMENT OF AN
ADMINISTERED TO AN ABSORBED DOSE RfD
An oral RfD, unadjusted for absorption, equals 10
mg/kg-day.
Other information (or an assumption) indicates a 20%
oral absorption efficiency in the species on which the
RfD is based.
The adjusted RfD that would correspond to the
absorbed dose would be:
10 mg/kg-day x 0.20 = 2 mg/kg-day.
The adjusted RfD of 2 mg/kg-day would be compared
with the amount estimated to be absorbed dermally
each day.

Page A-3
would be a non-conservative approach for
estimating the dermal RfD or slope factor (i.e.,
depending on the type of chemical, the true
absorbed dose might have been much lower than
100 percent, and hence an absorbed-dose RfD
should similarly be much lower or the slope
factor should be much higher). For example,
some metals tend to be poorly absorbed (less
than 5 percent) by the gastrointestinal tract. A
relatively conservative assumption for oral
absorption in the absence of appropriate
information would be 5 percent.
EXAMPLE: ADJUSTMENT OF AN
ADMINISTERED TO AN ABSORBED
DOSE SLOPE FACTOR
An oral slope factor, unadjusted for
absorption equals 1.6 (mg/kg-day)
-1
.
Other information (or an assumption)
indicates a 20% absorption efficiency in the
species on which the slope factor is based.
The adjusted slope factor that would
correspond to the absorbed dose would be:
1.6(mg/kg-day)
–1
/0.20 = 8 (mg/kg-day)
–1
.
The adjusted slope factor of 8 (mg/kgday)
-1
would be used to estimate the cancer risk
associated with the estimated absorbed
A.2 ADJUSTMENT OF EXPOSURE
ESTIMATE TO AN ABSORBED
DOSE
If the toxicity value is expressed as an
absorbed rather than an administered dose, it
may be necessary to convert the exposure
estimate from an intake into an absorbed dose
for comparison. An example of estimating an
absorbed dose from an intake using an
absorption efficiency factor is provided in the
box in the top right corner. Do not adjust
exposure estimates for absorption efficiency if
the toxicity values are based on administered
doses.
A.3 ADJUSTMENT FOR MEDIUM OF
EXPOSURE
EXAMPLE: ADJUSTMENT OF
EXPOSURE ESTIMATE TO
AN ABSORBED DOSE
The exposure assessment indicates that an
individual ingests 40 mg/kg-day of the
chemical from locally grown vegetables.
The oral RfD (or slope factor) for the
chemical is based on an absorbed, not
administered, dose.
The human oral absorption efficiency for
the contaminant from food is known or
assumed to be 10 percent.
The adjusted exposure, expressed as an
absorbed dose for comparison with the
RfD (or slope factor), would be:
40 mg/kg-day x 0.10 = 4 mg/kg-day.
If the medium of exposure in the site
exposure assessment differs from the medium of
exposure assumed by the toxicity value (e.g.,
RfD values usually are based on or have been
adjusted to reflect exposure via drinking water,
while the site medium of concern may be soil),
an absorption adjustment may, on occasion, be
appropriate. For example, a substance might be
more completely absorbed following exposure to
contaminated drinking water than following
exposure to contaminated food or soil (e.g., if
the substance does not desorb from soil in the
gastrointestinal tract). Similarly, a substance
might be more completely absorbed following
inhalation of vapors than following inhalation of
particulates. The selection of adjustment method
will depend upon the absorption efficiency
inherent in the RfD or slope factor used for
comparison. To adjust a food or soil ingestion
exposure estimate to match an RfD or slope
factor based on the assumption of drinking water
ingestion, an estimate of the relative absorption
of the substance from food or soil and from
water is needed. A sample calculation is
provided in the box on the next page.

Page A-4
EXAMPLE: ADJUSTMENT FOR
MEDIUM OF EXPOSURE
The expected human daily intake of the substance
in food or soil is estimated to be 10 mg/kg-day.
Absorption of the substance from drinking water
is known or assumed to be 90%, and absorption
of the substance from food or soil is known or
assumed to be 30%.
The relative absorption of the substance in food
or soil/drinking water is 0.33 (i.e., 30/90).
The oral intake of the substance, adjusted to be
comparable with the oral RfD (based on an
administered dose in drinking water), would be:
In the absence of a strong argument for
making this adjustment or reliable information
on relative absorption efficiencies, assume that
the relative absorption efficiency between food
or soil and water is 1.0.
If the RfD or slope factor is expressed as
an absorbed dose rather than an administered
dose, it is only necessary to identify an
absorption efficiency associated with the
medium of concern in the site exposure estimate.
In the example above, this situation would
translate into a relative absorption of 0.3 (i.e.,
30/100).

APPENDIX B
INDEX
Comment [A70]: The index in Appendix B may
not reflect the true page numbers of this annotated
version.
A
Absorbed dose
calculation 6-34,
6-39, 7-8,
7-10, 7-12
definition 6-2, 6-4, 6-32, 6-34, 7-10, 10-2
following dermal contact with soil, sedim
or dust 6-39, 6-41 to 6-43, 7-16
following dermal contact with water 6-34
39, 7-16
radiation 10-1, 10-2, 10-6
toxicity value 7-10, 7-16, 8-5, A-1, A-2
Absorption adjustment
dermal exposures 8-5, A-1, A-2
medium of
exposure 8-5,
A-3, A-4
Absorption efficiency
default assumptions 6-34,
6-39,
A-2
to A
dermal
6-34, 6-39
general 6-2, 7-10, 7-20, 8-5, 8-10
Acceptable daily
intakes 7-1, 7-2, 7-6
Activity
at time t 10-1
Activity patterns 6-2,
6-6, 6-7,
6-24, 7-3
Acute exposures. See Exposure -- short-ter
Acute toxicants 6-23, 6-28
ADIs. See Acceptable daily intakes
Administered d
ose 6-2, 6-4,
7-1, 7-2, 7-10,
8-5, A-1 to A-4
Agency for Toxic Substances and Disease
Registry
1-8, 2-1, 2-3, 2-4, 2-8 to
2-11, 6-1, 6-17, 7
8-1, 8-15, 8-24
Air data collection
and soil 4-10
background sampling 4-9
concentration variability 4-9
emission sources 4-15
flow 4-8
meteorological conditions 4-15, 4-20
monitoring
4-8, 4-9, 4-14
radionuclides 10-11
sample type 4-19
sampling locations 4-19
short-term
4-15
spatial considerations 4-15
temporal considerations 4-15, 4-20
time and
cost 4-21
Air exposure
dispersion
models
6-29
indoor modeling 6-29
outdoor modeling 6-29
volatilization 6-29
Analytes 4-2, 5-2, 5-5, 5-7, 5-10, 5-27
Analytical methods
evaluation 5-5 to 5-7
radionuclides 10-12, 10-13
routine analytical services 4-22
special analytical services 4-3, 4-22
Animal studies 7-12, 10-28, 10-29, 10-33
Applicable or
relevant and appropriate
requirement
2-2, 2-7, 2-8, 8-1, 10-8 to 10-10
Applied dose
6-2, 6-4
ARAR. See
Applicable or relevant and
appropriate requirement
A(t). See Activity at time
t
ATSDR. See
Agency
for Toxic Substances and
Disease Registry
Averaging time 6-23
B

Page B-2
Background
anthropogenic 4-2, 4-5
comparison to site related contamination 4-9,
4-10, 4-18
defining needs 4-5 to 4-10, 6-29, 6-30
information useful for data collection 4-1
localized 4-5
naturally occurring 4-2, 4-5, 8-25, 10-14
sampling 4-5 to 4-10, 10-14
ubiquitous 4-5
BCF. See Bioconcentration factor
Bench scale tests 4-3
Benthic oxygen conditions 4-7
Bioconcentration 4-11, 6-31, 6-32
Bioconcentration factor 6-1, 6-12, 6-31, 6-32
Biota sampling 4-7, 4-10, 4-16
Blanks
evaluation 5-17
field 4-22, 4-23, 5-17, 10-20
laboratory 4-22, 5-13, 5-17
laboratory calibration 5-17
laboratory reagent or method 5-17
trip 4-22, 5-17
Body weight as an intake variable 6-22, 6-23, 6-
39, 7-8, 7-12, 10-26, 10-33
Bulk density 4-7, 4-12
C
Cancer risks
extrapolating to lower doses 7-11, 7-12
linear low-dose equation 8-6
multiple pathways 8-16
multiple substances 8-12
one-hit equation 8-11
radiation 10-28 to 10-32
summation of 8-12, 8-16
Carcinogenesis 7-10, 10-28 to 10-32
Carcinogen Risk Assessment Verification
Endeavor
7-1, 7-13
Carcinogens 5-8, 5-21, 6-23, 7-10, 8-6, 10-30,
10-33
CDI. See Chronic daily intake
CEAM. See Center for Exposure Assessment
Modeling
Center for Exposure Assessment Modeling 6-1,
6-25, 6-31
CERCLA. See Comprehensive Environmental
Response, Compensation, and Liability Act of
1980
CERCLA Information System 2-4
CERCLIS. See CERCLA Information System
Checklist for manager involvement 9-14 to 9-17
Chemicals of potential concern
definition 5-2
listing 5-20
preliminary assessment 5-8
radionuclides 10-21
reducing 5-20 to 5-24
summary 5-24 to 5-27
Chronic daily intake 6-1, 6-2, 6-23, 7-1, 8-1, 8-6
to 8-11
CLP. See Contract Laboratory Program
Combustible gas indicator 5-6
Common laboratory contaminants 5-2, 5-3, 5-
13, 5-16, 5-17
Comprehensive Environmental Response,
Compensation, and Liability Act of 1980 1-1, 1-
3, 2-1 to 2-4
Concentration-toxicity screen 5-20, 5-23
Conceptual model 4-5, 4-10
Contact rate 6-2, 6-22
Contract Laboratory Program
applicability to radionuclides 10-16, 10-17,
10-20, 10-21
definition 4-2

Page B-3
routine analytical services 4-22, 5-5, 5-7, 5-
15, 5-18, 5-20
special analytical services 4-3, 4-22, 5-5, 5-7
to 5-10, 5-18 to 5-20
statements of work 5-5
Contract-required detection limit. See Detection
limit
Contract-required quantitation limit. See
Quantitation limit
CRAVE. See Carcinogen Risk Assessment
Verification Endeavor
CRDL. See Contract-required detection limit
Critical study. See Reference dose
Critical toxicity effect. See Reference dose
CRQL. See Contract-required quantitation limit
Curie 10-2, 10-4, 10-6
D
D. See Absorbed dose – radiation
Data
codes 5-11 to 5-16
positive 5-2
qualifiers 5-11 to 5-16
Data quality objectives 3-4, 4-1 to 4-5, 4-19, 4-
24, 10-14
DCF. See Dose conversion factor
Decay products 10-2, 10-7, 10-21, 10-24
Decision Summary 9-3
Declaration 9-3
Dermal
absorption efficiency 6-34, 6-39
contact with soil, sediment, or dust 6-39, 6-41
to 6-43, A-2
contact with water 6-34, 6-37 to 6-39, A-2
exposure 4-10, 4-11, 4-14, 6-34, 6-37 to 6-39,
6-43, 8-5, A-2
external radiation exposure 10-22, 10-23, 10
25, 10-26
toxicity values 7-16
Detection frequency 5-20, 5-22
Detection limits
contract-required 5-1, 5-2, 5-8
definition 5-1, 5-2, 5-8
evaluation 4-3 to 4-5, 5-7 to 5-11, 5-20, 6-31
instrument 4-1, 5-1, 5-7
limitations to 4-15, 4-22, 5-8
method 4-22, 5-1, 5-7
radionuclides 10-17 to 10-20
Diffusivity 6-12
Dissolved oxygen 4-7
DL. See Detection limit
Documentation. See Preparing and reviewing the
baseline risk assessment
Dose
absorbed vs administered 6-4, 7-10, 8-2, A-1
to
absorption efficiency A-1 to A-3
response curve 7-12
response evaluation 7-1, 7-2, 7-11, 7-12
Dose conversion factor 10-1, 10-2, 10-24, 10-25,
10-26
Dose equivalent
committed 10-1, 10-2, 10-7, 10-24, 10-25,
10-26
effective 10-1, 10-2, 10-7, 10-24, 10-25, 10-
26
DQO. See Data quality objectives
Dry weight 4-7
Dust
exposure 6-39, 6-43
fugitive dust generation 4-3, 4-5, 4-15, 6-29
transport indoors 6-29
E
E. See Exposure level

Page B-4
ECAO. See Environmental Criteria and
Assessment Office
Emission sampling
rate 4-5, 4-7, 4-14
strength 4-7
Endangerment Assessment Handbook 1-1, 2-9
Endangerment assessments 2-1, 2-8
Environmental Criteria and Assessment Office
7-1,
7-15, 7-16, 7-19, 8-1, 8-5, A-1
Environmental Evaluation Manual 1-1, 1-11, 2-
9, 4-16
Environmental Photographic Interpretation
Center 4-4
EPIC. See Environmental Photographic
Interpretation Center
Epidemiology
site-specific studies 2-10, 8-22, 8-24
toxicity assessment 7-3, 7-5
Essential nutrients 5-23
Estuary sampling 4-7, 4-13, 4-14
Exposure
averaging time 6-23
characterization of setting 6-2, 6-5 to 6-8
definition 6-2, 8-2
event 6-2
expressed as absorbed doses 6-34, 6-39, A-1
for dermal route 6-34, 6-39, 6-41 to 6-43
frequency/duration 6-22
general considerations 6-19 to 6-24
level 8-1
long-term 6-23
parameter estimation 6-19 to 6-23
pathway-specific exposures 6-32 to 6-47
point 6-2, 6-11
potentially exposed populations 6-6 to 6-8
radionuclides vs chemicals 10-22
route 6-2, 6-11, 6-17, 6-18, 8-2, A-1
short-term 6-23, 8-11, 10-25, 10-28, 10-30
Exposure assessment
definition 1-6, 1-7, 6-1, 6-2, 8-2
intake calculations 6-32 to 6-47
objective 6-1
output for dermal contact with contaminated
soil 6-39
output for dermal exposure to contaminated
water 6-34
preliminary 4-3, 4-10 to 4-16
radiation 10-22 to 10-27
spatial considerations 6-24 to 6-26
Exposure concentrations
and the reasonable maximum exposure 6-19
in air 6-28, 6-29
in food 6-31, 6-32
in ground water 6-26, 6-27
in sediment 6-30
in soil 6-27, 6-28
in surface water 6-29, 6-30
summarizing 6-32, 6-33, 6-50, 6-52
Exposure pathways
components 6-8, 6-9
definition 6-2, 8-2
external radiation exposure 10-22, 10-23, 10-
25, 10-26
identification 6-8 to 6-19
multiple 6-47
summarizing 6-17, 6-20
F
Fate and transport assessment 6-11, 6-14 to 6-
16.
See also Exposure assessment
Field blanks. See Blanks
Field investigation team 4-1, 4-16, 4-20, 4-24, 5-
1, 5-2
Field sampling plan 4-1, 4-2, 4-23, 4-24, 10-15
Field screen 4-11, 4-20, 4-21, 5-5, 5-6, 5-24
First-order analysis 8-20
FIT. See Field investigation team
Five-year review 2-3, 2-5
Food chain 2-3, 4-7, 4-10, 4-16, 6-31, 6-32

Page B-5
Fraction organic content of soil 4-7
Frequency of detection. See Detection frequency
FS. See Remedial investigation/feasibility study
FSP. See Field sampling plan
G
Ground-water data collection
and air 4-13
and soil 4-12
filtered vs unfiltered samples 4-12, 6-27
hydrogeologic properties 4-12
sample type 4-19
transport route 4-11
well location and depth 4-12
Grouping chemicals by class 5-21, 10-21
H
HADs. See Health Assessment Documents
HAs. See Health Advisories
Half-life 6-12, 10-2
Hazard identification 1-6, 7-1, 7-2, 10-28 to 10-
30
Hazard index
chronic 8-13
definition 8-1, 8-2
multiple pathways 8-16, 8-17
multiple substances 8-12, 8-13
noncancer 8-12, 8-13
segregation 8-14, 8-15
short-term 8-13, 8-14
subchronic 8-13, 8-14
Hazard quotient 8-2, 8-11
Hazard Ranking System 2-5, 2-6, 4-1, 4-4
H
E
. See Dose equivalent
HE
E,50
. See Dose equivalent
Head measurements 4-7
Health Advisories 2-10, 7-9, 7-10, 8-13
Health and Environmental Effects Documents 7-
1, 7-14, A-1
Health and Environmental Effects Profiles 7-1,
7-14,
Health Assessment Documents 7-1, 7-14, A-1
Health Effects Assessments 7-1, 7-14, A-1
Health Effects Assessment Summary Tables 7-1,
7-14
Health physicist 10-3, 10-21
HEAs. See Health Effects Assessments
HEAST. See Health Effects Assessment
Summary Tables
HEEDs. See Health and Environmental Effects
Documents
HEEPs. See Health and Environmental Effects
Profiles
Henry's law constant 6-12
HI. See Hazard index
HNu organic vapor detector 5-6
Hot spots 4-10 to 4-12, 4-17, 4-19, 5-27, 6-24,
6-28
HQ. See Hazard quotient
HRS. See Hazard Ranking System
H
t
. See Dose equivalent
HT
T,50
. See Dose equivalent
Hydraulic gradient 4-7
I
IARC. See International Agency for Research on
Cancer

Page B-6
IDL. See Instrument detection limit
Ingestion
of dairy products 4-16, 6-47, 6-48
of fish and shellfish 4-3, 4-11, 4-14, 4-15, 4-
16,
6-43, 6-45
of ground water 6-34, 6-35
of meat 4-15, 4-16, 6-47, 6-48
of produce 4-16, 6-43, 6-46, 6-47
of soil, sediment, or dust 6-39, 6-40
of surface water 4-14, 6-34, 6-35
while swimming 4-14, 6-34, 6-36
Instrument detection limit. See Detection limit
Inhalation 6-43, 6-44
Intake 6-2, 6-4, 6-19, 6-21, 8-2, 10-26
Integrated Risk Information System 7-1, 7-2, 7-
6, 7-12 to 7-15, 8-1, 8-2, 8-7, 8-8, 10-33
International Agency for Research on Cancer 7-
11
International System of Units 10-1
Ionizing radiation. See Radionuclides, radiation
IRIS. See Integrated Risk Information System
K
K
d
6-12
K
oc
6-12
K
ow
6-12, 6-31
Kriging 6-19
L
Land use
and risk characterization 8-10, 8-20, 8-26
current 6-6
future 6-7
Lentic waters 4-14
LET. See Linear energy transfer
Level of effort 1-6 to 1-8, 3-3
Life history stage 4-7
Lifetime average daily intake 6-2, 6-23, 8-4
Linear energy transfer 10-1, 10-2, 10-28, 10-29,
10-31
Linearized multistage model 7-12, 8-6
Lipid content 4-7, 10-14
LLD. See Lower limit of detection
LOAEL. See Lowest-observed-adverse-effect-
level
Lotic waters 4-13, 4-14
Lower limit of detection 10-1
Lowest-observed-adverse-effect-level 7-1, 7-2,
7-7, 8-1
M
Management tools 9-1, 9-14, 10-1, 10-34
Maximum contaminant levels 1-8, 5-8
MCLs. See Maximum contaminant levels
MDL. See Method detection limit
Media of concern
air 4-14
biota 4-15
ground water 4-12
sampling 4-2, 4-3, 4-10 to 4-16
soil 4-11
surface water/sediments 4-13
Metals
absorption by gastrointestinal tract A-2, A-3
default assumptions for A-2
Method detection limit. See Detection limit
MeV. See Million electron volts
MF. See Modifying factor

Million electron volts 10-1, 10-5
Modeling 4-3 to 4-8, 5-8, 5-22, 5-27, 6-25, 6-26,
8-18 to 8-20
Modifying factor 7-7, 7-21, 8-4, 8-8, 10-1, 10-2,
10-6
Monte Carlo simulation 8-19, 8-20
Multistage model. See Linearized multistage
model
N
N. See Dose equivalent
National Oceanographic and Atmospheric
Administration 6-1, 6-6
National Oil and Hazardous Substances
Pollution Contingency Plan 1-1, 2-2, 2-4, 2-
5
National Priorities List 2-3, 2-5, 2-6, 10-1
National Response Center 2-4
National Technical Guidance Studies 6-1
NCP. See National Oil and Hazardous
Substances Pollution Contingency Plan
ND. See Non-detect
NOAA. See National Oceanographic and
Atmospheric Administration
NOAEL. See No-observed-adverse-effect-level
Noncancer hazard indices. See Hazard index
Noncancer hazard quotient. See Hazard quotient
Noncarcinogenic threshold toxicants 7-6
Non-detects 5-1, 5-2, 5-7, 5-10, 5-11, 5-15, 5-16
No-observed-adverse-effect-level 7-1, 7-2, 7-7,
8-1
Normalized exposure rate 6-4, 8-2, A-2
Page B-7
NPL. See National Priorities List
NRC. See Nuclear Regulatory Commission
NTGS. See National Technical Guidance
Studies
Nuclear Regulatory Commission 8-1, 10-8
Nuclear transformation 10-2
O
OAQPS. See Office of Air Quality Planning and
Standards
OERR. See Office of Emergency and Remedial
Response
Office of Air Quality Planning and Standards 6-
1
Office of Emergency and Remedial Response 1-
1
Office of Radiation Programs 10-3, 10-10, 10-
14, 10-24 to 10-26
Operable units 1-8, 1-9, 3-1, 3-2, 5-24
Oral absorption A-2, A-3
Oral cancer potency factor adjustment A-3
Oral reference dose adjustment A-2
Organic carbon content 4-7, 4-12, 5-5
Organic vapor analyzer 5-6
OVA. See Oxygen vapor analyzer
Oxygen-deficient atmosphere 5-6
P
PA. See Preliminary assessment/site inspection
Partition coefficient 4-7, 6-31, 6-32
PA/SI. See Preliminary assessment/site
inspection

Page B-8
PC. See Permeability constant
PE. See Performance evaluation
Performance evaluation 5-1, 5-5
Permeability constant 6-34, 10-26
Persistence 4-2, 5-21, 6-4, 6-23, 6-24
pH 4-7
PHE. See Public health evaluation
Porosity 4-7, 4-12
PQL. See Practical quantitation limit
Practical quantitation limit 5-1
Preliminary assessment/site inspection 2-4, 2-5,
2-6, 4-2, 4-4, 6-5
Preliminary remediation goals 1-3 to 1-5, 1-8, 8-
1
Preparing and reviewing the baseline risk
assessment
addressing the objectives 9-1, 9-2
communicating the results 9-1, 9-2
documentation tools 9-1 to 9-8
other key reports 9-3
review tools 9-3, 9-9 to 9-14
scope 9-2, 9-3
PRGs. See Preliminary remediation goals
Primary balancing criteria 1-9
Proxy concentration 5-10
Public health evaluation 1-11
Q
Q. See Dose equivalent
QAPjP. See Quality assurance project plan
QA/QC. See Quality Assurance/Quality Control
QL. See Quantitation limit
Qualifiers. See Data Quality assurance project
plan 4-1, 4-2, 4-23
Quality assurance/quality control 3-4, 4-1, 4-3,
5-1, 5-29
Quality factor 10-2, 10-6
Quantitation limit
compared to health-based concentrations 5-2,
5-5, 5-7, 5-8, 5-11
contract-required 5-1, 5-2, 5-8
definitions 5-2, 5-5, 5-8
evaluation 5-1 to 5-9, 10-20
high 5-10
radionuclides 10-17 to 10-20
sample 5-8
strategy 4-21
unavailability 4-3, 5-10
R
RA. See Remedial action
Radiation. See Radionuclides, radiation
Radiation advisory groups
International Commission on Radiation
Protection 10-3, 10-9, 10-28
National Academy of Sciences 10-28, 10-29
National Council on Radiation Protection and
Measurements 10-9, 10-28
United Nations Scientific Committee on the
Effects of Atomic Radiation 10-28, 10-29,
10-30
Radiation detection instruments
gas proportional counters 10-12, 10-13
Geiger-Mueller (G-M) counters 10-11, 10-12
ionization chambers 10-11 to 10-13
scintillation detectors 10-11 to 10-13
solid-state detectors 10-12, 10-13
Radiation units
becquerel 10-1, 10-2, 10-4, 10-6
curie 10-1, 10-2, 10-4, 10-6
picocurie 10-1
rad 10-2, 10-6
rem 10-2
roentgen 10-2, 10-6

sievert 10-1, 10-2, 10-6
working level 10-7
working level month 10-7
Radionuclides, radiation
alpha particles 10-4, 10-5, 10-28
beta particles 10-4, 10-5, 10-28
decay products 10-2, 10-7, 10-21, 10-24
definition 10-2
external 10-2
half-life 10-2
internal 10-2
ionizing 10-2
linear energy transfer 10-2, 10-28, 10-29, 10-
31
lower limit of detection 10-17, 10-20
neutrons 10-4
photons 10-4, 10-5, 10-28
positrons 10-4
quality factors 10-2, 10-6, 10-29
radioactive decay 10-2, 10-2
radon decay products 10-7
regulatory agencies 10-8, 10-9
relative biological effectiveness 10-1, 10-6,
1029
risk characterization 10-32 to 10-34
toxicity assessment 10-27 to 10-32
RAS. See Routine analytical services
RBE. See Relative biological effectiveness
RCRA. See Resource Conservation and
Recovery Act
RD. See Remedial design
Reasonable maximum exposure
and body weight 6-22, 6-23
and contact rate 6-22
and exposure concentration 6-19
and exposure frequency and duration 6-22
and risk characterization 8-1, 8-15, 8-16, 8-
26
definition 6-1, 6-4, 6-5
estimation of 6-19 to 6-23, 8-15, 8-16
Record of Decision 2-5, 9-3
Redox potential 4-7
Reference dose
Page B-9
chronic 7-1, 7-2, 7-5, 8-1, 8-2, 8-8, 8-10, 8-
13, A-1, A-2
critical toxic effect 7-7, 8-4, 8-10, 8-15
critical study 7-7
definition 7-1, 7-2, 8-2, A-2
developmental 7-1, 7-6, 7-9, 8-2
inhalation 7-8 oral 7-6, 7-7
subchronic 7-1, 7-2, 7-6, 7-8, 7-9, 8-2, 8-9, 8-
14 verified 7-10
Regional Radiation Program Managers 10-3, 10-
10
Relative biological effectiveness 10-1, 10-6, 10-
29
Release sources 6-10
Remedial action 1-3, 1-8 to 1-10, 2-5, 2-7, 2-9,
3-1, 3-2, 6-8, 10-8
Remedial action objectives 1-3, 1-8, 2-7
Remedial design 2-5, 2-6, 2-9
Remedial investigation/feasibility study 1-1 to 1-
5, 1-8 to 1-10, 2-5 to 2-7, 3-1 to 3-3, 4-1 to
4-5, 423, 8-1
Remedial project manager
and background sampling 4-8
and elimination of data 5-2, 5-17, 5-20, 5-21
and ground-water sampling 4-13 and
radiation 10-3
and reasonable maximum exposure 6-5
and scoping meeting 4-3
definition 1-2
management tools for 9-14 to 9-17
Remedy selection 1-9, 2-5
Resource Conservation and Recovery Act 2-7,
10-8
Responsiveness Summary 9-3
Reviewing the risk assessment. See Preparing
and reviewing the baseline risk assessment
RfD. See Reference dose
RfD
dt
. See Reference dose

Page B-10
RfD
s
See Reference dose
RI. See Remedial investigation/feasibility
studies
RI/FS. See Remedial investigation/feasibility
study
Risk assessment reviewer 1-2, 9-1, 9-3, 9-9 to 9-
14
Risk assessor
definition 1-2
tools for documentation 9-1 to 9-8
Risk characterization 1-6, 1-7, 8-1
Risk information in the RI/FS process 1-3 to 1-
10
Risk manager 1-2
RME. See Reasonable maximum exposure
ROD. See Record of Decision
Route-to-route extrapolation 7-16
Routine analytical services. See Contract
Laboratory Program
RPM. See Remedial project manager
S
Salinity 4-7, 4-14, 6-5
Saltwater incursion extent 4-7
Sample Management Office 4-1, 4-2, 5-1, 5-5
Sample quantitation limit 5-1. See also
Quantitation limit
Samples. See Sampling
Sampling
annual/seasonal cycle 4-20
composite 4-11, 4-14, 4-19
cost 4-10, 4-17, 4-18, 4-20, 4-21
depth 4-7, 4-11, 4-12, 4-19
devices 4-21
grab 4-19
purposive 4-9, 4-10, 4-12, 4-18, 4-19
radionuclides 10-10 to 10-16
random 4-9, 4-12, 4-18 to 4-20
routes of contaminant transport 4-10 to 4-16
strategy 4-16
systematic 4-18, 4-19
Sampling and analysis plan 1-4, 4-1, 4-2, 4-3, 4-
22 to 4-24
SAP. See Sampling and analysis plan
SARA. See Superfund Amendments and
Reauthorization Act of 1986
SAS. See Special analytical services
Scoping
meeting 4-3, 4-18, 4-22, 4-23, 9-15, 10-15
of project 1-3 to 1-5, 1-8, 2-7, 3-2, 3-3
SDI. See Subchronic daily intake
SEAM. See Superfund Exposure Assessment
Manual
Segregation of hazard indices 8-14, 8-15
Selection of remedy. See Remedy selection
Semi-volatile organic chemical 5-1
SI. See International System of Units,
Preliminary assessment/site inspection
Site discovery or notification 2-4
Site inspection. See Preliminary assessment/site
inspection
Skin 5-29, 7-16, 10-4, 10-6, 10-22, 10-29. See
also Dermal Slope factor 5-9, 5-21, 7-3, 7-11
to 7-13, 7-16, 8-1, 8-2 to 8-7, 8-10 to 8-12,
10-2, 10-33, A-1 to A-4
SMO. See Sample management office
Soil data collection 4-11
and ground water 4-12
depth of samples 4-12
heterogeneity 4-11
hot spots 4-11

Solubility 6-12
Sorption 6-27
SOW. See Statements of work
Special analytical services. See Contract
Laboratory Program
Specific organ 4-7, 10-7, 10-22
SPHEM. See Superfund Public Health
Evaluation Manual
SQL. See Sample quantitation limit
Stability class 4-7
Statements of work. See Contract Laboratory
Program
Statistics
and background 4-8 to 4-10, 5-18
certainty 4-8, 4-17, 4-18
methods 4-8, 4-18
power 4-9, 4-18
sampling strategy 4-16 to 4-20
variability 4-9, 4-18
Structure-activity studies 7-5
Subchronic daily intake 6-1, 6-2, 6-23, 7-1, 8-1
Superfund. See Comprehensive Environmental
Response, Compensation, and Liability Act of
1980
Superfund Amendments and Reauthorization
Act of 1986 1-11, 2-1 to 2-4
Superfund Exposure Assessment Manual 2-1, 2-
8, 6-1
Superfund Public Health Evaluation Manual 1-1,
2-8
SVOC. See Semi-volatile organic chemical
T
T. See Tissue
Page B-11
TAL. See Target analyte list
Target analyte list 4-1, 4-2, 5-5, 5-8, 5-17
Target compound list 4-1, 4-2, 4-22, 5-1, 5-5, 5-
8, 517, 5-21, 10-20
TCL. See Target compound list
Tentatively identified compound 4-1, 5-1, 5-13,
5-17, 5-18
Thermocline 4-7
TIC. See Tentatively identified compound
Tidal cycle 4-7, 4-14
Tissue 10-1
TOC. See Total organic carbon
Tools
documentation 9-1 to 9-8
management 9-13 to 9-17
review 9-3, 9-9 to 9-14
Topography 4-7
Total organic carbon 5-1
Total organic halogens 5-1
TOX. See Total organic halogens
Toxicity assessment 1-6, 1-7, 7-1, 7-4, 10-27 to
10-32
Toxicity values
absorbed vs administered dose 7-10, A-1
definition 7-3
generation of 7-16
hierarchy of information 7-15
oral 7-16, 10-33, A-2
radiation 10-22, 10-32
educing number of chemicals 5-21, 5-23
Transfer coefficients 6-32
Transformation 5-20, 6-27, 7-5, 10-2, 10-3, 10-5
Treatability 5-21

Page B-12
Trip blanks. See Blanks
U UFs. See Uncertainty factors
Uncertainty analysis
exposure 6-17, 6-34, 6-47, 6-49 to 6-51, 8-18,
8-22
factors 7-7 to 7-10, 8-4, 8-8, 8-9, 8-17, 8-18,
8-20, 8-22
first-order analysis 8-20
model applicability and assumptions 6-50, 8-
18 to 8-22
Monte Carlo simulation 8-20
multiple substance exposure 8-22
parameter value 8-19
qualitative 8-20, 8-21
quantitative 8-19, 8-20
radiation 10-27, 10-33
risk 8-17
semi-quantitative 8-20
toxicity 7-19, 7-20, 8-22
Uncertainty factors. See Uncertainty analysis —
factors
Unit risk 7-13
U.S. Geological Survey 6-1, 6-6
USGS. See U.S. Geological Survey
V
Vapor pressure 6-12
VOC. See Volatile organic chemical
Volatile organic chemical 4-2, 5-1, 5-17, 6-31
W
Water hardness 4-7
Weighting factor 10-1, 10-2, 10-7
Weight-of-evidence classification 5-20, 7-3, 7-9,
7-11, 8-2, 8-4, 8-7, 8-10
Whole body 4-7, 4-16, 6-31, 10-6, 10-7
Workplan 4-1, 4-4, 4-22 to 4-24, 9-15
W
T
. See Weighting factors
