
Guidelines on the Calibration of
Non-Automatic Weighing
Instruments
EURAMET Calibration Guide No. 18
Version 4.0 (11/2015)

EURAMET Calibration Guide No. 18
Version 4.0 (10/2015)
I-CAL-GUI-018/v4.0/2015-10-01
Authorship and Imprint
This document was developed by the EURAMET e.V., Technical Committee for Mass and Related
Quantities.
Version 4.0 was developed thanks to the cooperation of Stuart Davidson (NPL, UK), Klaus Fritsch
(Mettler Toledo, Switzerland), Matej Grum (MIRS, Slovenia), Andrea Malengo (INRIM, Italy), Nieves
Medina (CEM, Spain), George Popa (INM, Romania), Norbert Schnell (Sartorius, Germany).
Version 4.0 (11/2015)
Version 3.0 (03/2011)
Version 2.0 (09/2010)
Version 1.0 (01/2009)
EURAMET e.V.
Bundesallee 100
D-38116 Braunschweig
Germany
E-Mail: secretariat@euramet.org
Phone: +49 531 592 1960
Official language
The English language version of this publication is the definitive version. The EURAMET Secretariat can
give permission to translate this text into other languages, subject to certain conditions available on
application. In case of any inconsistency between the terms of the translation and the terms of this
publication, this publication shall prevail.
Copyright
The copyright of this publication (EURAMET Calibration Guide No. 18, version 4.0 – English version) is
held by © EURAMET e.V. 2009. The text may not be copied for resale and may not be reproduced other
than in full. Extracts may be taken only with the permission of the EURAMET Secretariat.
ISBN 978-3-942992-40-4
Guidance Publications
This document gives guidance on measurement practices in the specified fields of measurements. By
applying the recommendations presented in this document laboratories can produce calibration results
that can be recognized and accepted throughout Europe. The approaches taken are not mandatory and
are for the guidance of calibration laboratories. The document has been produced as a means of
promoting a consistent approach to good measurement practice leading to and supporting laboratory
accreditation.
The guide may be used by third parties e.g. National Accreditation Bodies, peer reviewers witnesses to
measurements etc., as a reference only. Should the guide be adopted as part of a requirement of any
such party, this shall be for that application only and EURAMET secretariat should be informed of any
such adoption.
On request EURAMET may involve third parties in a stakeholder consultations when a review of the
guide is planned. Please register for this purpose at the EURAMET Secretariat.
No representation is made nor warranty given that this document or the information contained in it will be
suitable for any particular purpose. In no event shall EURAMET, the authors or anyone else involved in
the creation of the document be liable for any damages whatsoever arising out of the use of the
information contained herein. The parties using the guide shall indemnify EURAMET accordingly.
Further information
For further information about this document, please contact your national contact person of the
EURAMET Technical Committee for Mass and Related Quantities (see www.euramet.org).

EURAMET Calibration Guide No. 18
Version 4.0 (11/2015)
EURAMET Calibration Guide No. 18
Version 4.0 (11/2015)
Guidelines on the Calibration of
Non-Automatic Weighing Instruments
Purpose
This document has been produced to enhance the equivalence and mutual recognition of
calibration results obtained by laboratories performing calibrations of non-automatic weighing
instruments.
EURAMET Calibration Guide No. 18
Version 4.0 (11/2015)
- 2 -
Content
1 INTRODUCTION ................................................................................................................... 4
2 SCOPE .................................................................................................................................. 4
3 TERMINOLOGY AND SYMBOLS ......................................................................................... 5
4 GENERAL ASPECTS OF THE CALIBRATION .................................................................... 5
4.1 Elements of the calibration ............................................................................................. 5
4.1.1 Range of calibration ......................................................................................................... 5
4.1.2 Place of calibration ........................................................................................................... 5
4.1.3 Preconditions, preparations ............................................................................................. 6
4.2 Test load and indication ................................................................................................. 6
4.2.1 Basic relation between load and indication ...................................................................... 6
4.2.2 Effect of air buoyancy ....................................................................................................... 6
4.2.3 Effects of convection ........................................................................................................ 8
4.2.4 Buoyancy correction for the reference value of mass ...................................................... 9
4.3 Test loads ..................................................................................................................... 10
4.3.1 Standard weights ............................................................................................................ 10
4.3.2 Other test loads .............................................................................................................. 10
4.3.3 Use of substitution loads ................................................................................................ 11
4.4 Indications .................................................................................................................... 12
4.4.1 General ........................................................................................................................... 12
4.4.2 Resolution ...................................................................................................................... 12
5 MEASUREMENT METHODS ............................................................................................. 13
5.1 Repeatability test .......................................................................................................... 13
5.2 Test for errors of indication ........................................................................................... 14
5.3 Eccentricity test ............................................................................................................ 15
5.4 Auxiliary measurements ............................................................................................... 16
6 MEASUREMENT RESULTS ............................................................................................... 16
6.1 Repeatability ................................................................................................................. 17
6.2 Errors of indication ....................................................................................................... 17
6.2.1 Discrete values ............................................................................................................... 17
6.2.2 Characteristic of the weighing range .............................................................................. 17
6.3 Effect of eccentric loading ............................................................................................ 18
7 UNCERTAINTY OF MEASUREMENT ................................................................................ 18
7.1 Standard uncertainty for discrete values ...................................................................... 19
7.1.1 Standard uncertainty of the indication ............................................................................ 19
7.1.2 Standard uncertainty of the reference mass .................................................................. 21
7.1.3 Standard uncertainty of the error ................................................................................... 24
7.2 Standard uncertainty for a characteristic ...................................................................... 25
7.3 Expanded uncertainty at calibration ............................................................................. 25
7.4 Standard uncertainty of a weighing result .................................................................... 25
7.4.1 Standard uncertainty of a reading in use ....................................................................... 27
7.4.2 Uncertainty of the error of a reading .............................................................................. 27
7.4.3 Uncertainty from environmental influences .................................................................... 28
7.4.4 Uncertainty from the operation of the instrument ........................................................... 29
7.4.5 Standard uncertainty of a weighing result ...................................................................... 31
7.5 Expanded uncertainty of a weighing result ................................................................... 32
7.5.1 Errors accounted for by correction ................................................................................. 32
EURAMET Calibration Guide No. 18
Version 4.0 (11/2015)
- 3 -
7.5.2 Errors included in uncertainty ......................................................................................... 32
7.5.3 Other ways of qualification of the instrument ................................................................. 33
8 CALIBRATION CERTIFICATE ............................................................................................ 34
8.1 General information ...................................................................................................... 34
8.2 Information about the calibration procedure ................................................................. 34
8.3 Results of measurement .............................................................................................. 35
8.4 Additional information ................................................................................................... 35
9 VALUE OF MASS OR CONVENTIONAL VALUE OF MASS .............................................. 36
9.1 Value of mass ............................................................................................................... 36
9.2 Conventional value of mass ......................................................................................... 36
10 REFERENCES .................................................................................................................... 37
APPENDIX A: ADVICE FOR ESTIMATION OF AIR DENSITY ................................................. 38
A1 Formulae for the density of air ...................................................................................... 38
A1.1 Simplified version of CIPM-formula, exponential version ............................................... 38
A1.2 Average air density ......................................................................................................... 38
A2 Variations of parameters constituting the air density .................................................... 39
A2.1 Barometric pressure ....................................................................................................... 39
A2.2 Temperature ................................................................................................................... 39
A2.3 Relative humidity ............................................................................................................ 39
A3 Uncertainty of air density .............................................................................................. 40
APPENDIX B: COVERAGE FACTOR k FOR EXPANDED UNCERTAINTY OF
MEASUREMENT ....................................................................................................................... 41
B1 Objective ...................................................................................................................... 41
B2 Normal distribution and sufficient reliability .................................................................. 41
B3 Normal distribution, no sufficient reliability ................................................................... 42
B4 Determining k for non-normal distributions ................................................................... 42
APPENDIX C: FORMULAE TO DESCRIBE ERRORS IN RELATION TO THE INDICATIONS 43
C1 Objective ...................................................................................................................... 43
C2 Functional relations ...................................................................................................... 43
C3 Terms without relation to the readings ......................................................................... 49
APPENDIX D: SYMBOLS .......................................................................................................... 50
APPENDIX E: INFORMATION ON AIR BUOYANCY ................................................................ 52
E1 Density of standard weights ......................................................................................... 52
E2 Air buoyancy for weights conforming to OIML R111 .................................................... 52
APPENDIX F: EFFECTS OF CONVECTION ............................................................................. 54
F1 Relation between temperature and time....................................................................... 54
F2 Change of the apparent mass ...................................................................................... 56
APPENDIX G: MINIMUM WEIGHT ............................................................................................ 58
APPENDIX H: EXAMPLES ........................................................................................................ 60
H1 Instrument of 220 g capacity and scale interval 0,1 mg ............................................... 60
H2 Instrument of 60 kg capacity, multi-interval .................................................................. 75
H3 Instrument of 30 000 kg capacity, scale interval 10 kg .................................................. 91
H4 Determination of the error approximation function ..................................................... 109
EURAMET Calibration Guide No. 18
Version 4.0 (11/2015)
- 4 -
1 INTRODUCTION
Non-automatic weighing instruments (NAWI) are widely used to determine the value of a
load in terms of mass. For some applications specified by national legislation, NAWI are
subject to legal metrological control – i.e. type approval, verification etc. – but there is an
increasing need to have their metrological quality confirmed by calibration, e.g. where
required by ISO 9001 or ISO/IEC 17025 standards.
2 SCOPE
This document contains guidance for the static calibration of self-indicating, non-
automatic weighing instruments (hereafter called “instrument”), in particular for
1. measurements to be performed,
2. calculation of the measuring results,
3. determination of the uncertainty of measurement,
4. contents of calibration certificates.
The object of the calibration is the indication provided by the instrument in response to
an applied load. The results are expressed in units of mass. The value of the load
indicated by the instrument will be affected by local gravity, the load temperature and
density, and the temperature and density of the surrounding air.
The uncertainty of measurement depends significantly on properties of the calibrated
instrument itself, not only on the equipment of the calibrating laboratory; it can to some
extent be reduced by increasing the number of measurements performed for a
calibration. This guideline does not specify lower or upper boundaries for the uncertainty
of measurement.
It is up to the calibrating laboratory and the client to agree on the anticipated value of the
uncertainty of measurement that is appropriate in view of the use of the instrument and
in view of the cost of the calibration.
While it is not intended to present one or few uniform procedures the use of which would
be obligatory, this document gives general guidance for establishing of calibration
procedures the results of which may be considered as equivalent within the EURAMET
Member Organisations.
Any such procedure must include, for a limited number of test loads, the determination of
the error of indication and of the uncertainty of measurement assigned to these errors.
The test procedure should as closely as possible resemble the weighing operations that
are routinely being performed by the user – e.g. weighing discrete loads, weighing
continuously upwards and/or downwards, use of tare balancing function.
The procedure may further include rules how to derive from the results advice to the
user of the instrument with regard to the errors, and assigned uncertainty of
measurement, of indications which may occur under normal conditions of use of the
instrument, and/or rules on how to convert an indication obtained for a weighed object
into the value of mass or conventional value of mass of that object.
The information presented in this guideline is intended to serve, and should be observed
by
1. bodies accrediting laboratories for the calibration of weighing instruments,
2. laboratories accredited for the calibration of non-automatic weighing
instruments,
EURAMET Calibration Guide No. 18
Version 4.0 (11/2015)
- 5 -
3. test houses, laboratories, or manufacturers using calibrated non-automatic
weighing instruments for measurements relevant for the quality of production
subject to QM requirements (e.g. ISO 9000 series, ISO 10012, ISO/IEC 17025).
3 TERMINOLOGY AND SYMBOLS
The terminology used in this document is mainly based on existing documents
JCGM 100 [1] for terms related to the determination of results and the
uncertainty of measurement,
OIML R76 [2] (or EN 45501 [3]) for terms related to the functioning, to the
construction, and to the metrological characterisation of non-automatic weighing
instruments,
OIML R111 [4] for terms related to the standard weights,
JCGM 200 [5] for terms related to the calibration.
Such terms are not explained in this document, but where they first appear, references
will be indicated.
Symbols whose meanings are not self-evident, will be explained where they are first
used. Those that are used in more than one section are collected in Appendix D.
4 GENERAL ASPECTS OF THE CALIBRATION
4.1 Elements of the calibration
Calibration consists of
1. applying test loads to the instrument under specified conditions,
2. determining the error or variation of the indication, and
3. evaluating the uncertainty of measurement to be attributed to the results.
4.1.1 Range of calibration
Unless requested otherwise by the client, a calibration extends over the full weighing
range [2] (or [3]) from zero to the maximum capacity
Max. The client may specify a
certain part of a weighing range, limited by a minimum load
nMi
and the largest load to
be weighed
xMa
, or individual nominal loads, for which he requests calibration.
On a multiple range instrument [2] (or [3]), the client should identify which range(s) shall
be calibrated. The paragraph above may be applied to each range separately.
4.1.2 Place of calibration
Calibration is normally performed in the location where the instrument is being used.
If an instrument is moved to another location after the calibration, possible effects from
1. difference in local gravity acceleration,
2. variation in environmental conditions,
3. mechanical and thermal conditions during transportation
are likely to alter the performance of the instrument and may invalidate the calibration.
Moving the instrument after calibration should therefore be avoided, unless immunity to
these effects of a particular instrument, or type of instrument has been clearly
demonstrated. Where this has not been demonstrated, the calibration certificate should
not be accepted as evidence of traceability.

EURAMET Calibration Guide No. 18
Version 4.0 (11/2015)
- 6 -
4.1.3 Preconditions, preparations
Calibration should not be performed unless
1. the instrument can be readily identified,
2. all functions of the instrument are free from effects of contamination or damage,
and functions essential for the calibration operate as intended,
3. presentation of weight values is unambiguous and indications, where given, are
easily readable,
4. the normal conditions of use (air currents, vibrations, stability of the weighing
site etc.) are suitable for the instrument to be calibrated,
5. the instrument is energized prior to calibration for an appropriate period, e.g. as
long as the warm-up time specified for the instrument, or as set by the user,
6. the instrument is levelled, if applicable,
7. the instrument has been exercised by loading approximately up to the largest
test load at least once, repeated loading is advised.
Instruments that are intended to be regularly adjusted before use should be adjusted
before the calibration, unless otherwise agreed with the client. Adjustment should be
performed with the means that are normally applied by the client, and following the
manufacturer’s instructions where available. Adjustment could be done by means of
external or built-in test loads.
The most suitable operating procedure for high resolution balances (with relative
resolution better 1 × 10
-5
of full scale) is to perform the adjustment of the balance
immediately before the calibration and also immediately before use.
Instruments fitted with an automatic zero-setting device or a zero-tracking device [2] (or
[3]) should be calibrated with the device operative or not, as set by the client.
For on site calibration the user of the instrument should be asked to ensure that the
normal conditions of use prevail during the calibration. In this way disturbing effects such
as air currents, vibrations, or inclination of the measuring platform will, so far as is
possible, be inherent in the measured values and will therefore be included in the
determined uncertainty of measurement.
4.2 Test load and indication
4.2.1 Basic relation between load and indication
In general terms, the indication of an instrument is proportional to the force exerted by
an object of mass m on the load receptor
I
= k
s
a
1mg
(4.2.1-1)
with
g
local gravity acceleration
a
density of the surrounding air
density of the object
k
s
adjustment factor
The terms in the brackets account for the reduction of the force due to the air buoyancy
of the object.
4.2.2 Effect of air buoyancy
It is state of the art to use standard weights that have been calibrated to the

EURAMET Calibration Guide No. 18
Version 4.0 (11/2015)
- 7 -
conventional value of mass
c
m
1
, for the adjustment and/or the calibration of weighing
instruments. In principle, at the reference air density
0
= 1,2 kg/m
3
, the balance should
indicate the conventional mass m
c
of the test object.
The adjustment is performed at an air density ρ
as
and is such that the effects of
g
and of
the actual buoyancy of the adjustment weight having conventional mass
cs
m
are included
in the adjustment factor k
s
. Therefore, at the moment of the adjustment, the indication
s
I
is
css
mI
(4.2.2-1)
This adjustment is performed under the conditions characterized by the actual values of
s
g
,
cs
, and
0as
, identified by the suffix “
s
”, and is valid only under these
conditions. For another body of conventional mass
c
m
with
s
, weighed on the
same instrument but under different conditions:
s
gg
and
asa
the indication is in
general (neglecting terms of 2nd or higher order) [6]
sasa
s
0asc
/111/
ggmI
(4.2.2-3)
If the instrument is not displaced, there will be no variation of
g
, so
1
s
gg
. This is
assumed hereafter.
The indication of the balance will be exactly the conventional mass of the body, only in
some particular cases, the most evident are
ρ
a
= ρ
as
= ρ
0
.
the weighing is performed at ρ
a
= ρ
as
and the body has a density ρ = ρ
s
.
The formula simplifies further in situations where some of the density values are equal
a) weighing a body in the reference air density:
0a
, then
sasac
/1
mI
(4.2.2-4)
b) weighing a body of the same density as the adjustment weight:
s
, then
again (as in case a))
sasac
1
/mI
(4.2.2-5)
c) weighing in the same air density as at the time of adjustment:
asa
, then
s
0ac
111
mI
(4.2.2-6)
Figure 4.2-1 shows examples for the magnitude of the relative changes
1
The conventional value of mass m
c
of a body has been defined in [4] as the numerical value of mass m of a weight of reference
density
c
= 8000 kg/m³ which balances that body at 20 °C in air of density
0
:
c00c
1/1
mm
(4.2.2-2)
with
0
= 1,2 kg/m³ = reference value of the air density

EURAMET Calibration Guide No. 18
Version 4.0 (11/2015)
- 8 -
ccc
// mmImI
for an instrument adjusted with standard weights of
cs
, when
calibrated with standard weights of different but typical density.
Line is valid for a body of
7 810 kg/m³, weighed in
asa
(as for case c above)
Line
× is valid for a body of
8 400 kg/m³, weighed in
asa
(as for case c above)
Line is valid for a body of
cs
after adjustment in
0as
(as for case b above)
It is obvious that under these conditions, a variation in air density has a far greater effect
than a variation in the body density.
Further information on air density is given in Appendix A, and on air buoyancy related to
standard weights in Appendix E.
4.2.3 Effects of convection
Where weights have been transported to the calibration site they may not be at the same
temperature as the instrument and its environment. The temperature difference
T
is
defined as the difference between the temperature of a standard weight and the
temperature of the surrounding air. Two phenomena should be noted in this case:
An initial temperature difference
0
T
may be reduced to a smaller value
T
by
acclimatisation over a time
t
; this occurs faster for smaller weights than for
larger ones.
When a weight is put on the load receptor, the actual difference
T
will
produce an air flow about the weight leading to parasitic forces which result in
an apparent change
conv
m
on its mass. The sign of
conv
m
is normally
opposite to the sign of
T
, its value being greater for large weights than for
small ones.
The relations between any of the quantities mentioned:
0
T
, t
,
T
,
m
and
conv
m
are nonlinear, and they depend on the conditions of heat exchange between the weights
and their environment – see [7].

EURAMET Calibration Guide No. 18
Version 4.0 (11/2015)
- 9 -
Figure 4.2-2 gives an impression of the magnitude of the apparent change in mass in
relation to a temperature difference, for some selected weight values.
This effect should be taken into account by either letting the weights acclimatise to the
extent that the remaining change
conv
m
is negligible in view of the uncertainty of the
calibration required by the client, or by considering the possible change of indication in
the uncertainty budget. The effect may be significant for weights of high accuracy, e.g.
for weights of class E
2
or F
1
in R 111 [4].
More detailed information is given in Appendix F.
4.2.4 Buoyancy correction for the reference value of mass
To determine the errors of indication of an instrument, standard weights of known
conventional value of mass
cCal
m
are applied. Their density
Cal
is normally different
from the reference value
c
and the air density
aCal
at the time of calibration is
normally different from
0
.
The error
E
of indication is
ref
IIE
(4.2.4-1)
where
ref
I
is the reference value of the indication of the instrument, further called
reference value of mass, m
ref
. Due to effects of air buoyancy, convection, drift and others
which may lead to minor correction terms
x
m
,
ref
m
is not exactly equal to
cCal
m
, the
conventional value of the mass
..
BcCalref
mmmm
(4.2.4-2)
The correction for air buoyancy
B
m
is affected by values of
s
and
as
, that were valid
for the adjustment but are not normally known. It is assumed that weights of the
reference density
cs
have been used. From (4.2.2-3) the general expression for the
correction is

EURAMET Calibration Guide No. 18
Version 4.0 (11/2015)
- 10 -
casaCalcCal0aCalcCalB
11
mm
(4.2.4-3)
For the air density
as
two situations are considered. If the instrument has been
adjusted immediately before the calibration, then
aCalas
. This simplifies (4.2.4-3) to
cCal0aCalcCalB
11
mm
(4.2.4-4)
If the instrument has been adjusted independent of the calibration, in unknown air
density
as
, it is not possible to perform the correction for the last term of equation
(4.2.4-3), which intrinsically forms part of the error of indication. The correction to be
applied should also be (4.2.4-4) [10].
The suffix “Cal” will from now on be omitted unless where necessary to avoid confusion.
4.3 Test loads
Test loads should preferably consist of standard weights that are traceable to the SI unit
of mass. However, other test loads may be used for tests of a comparative nature – e.g.
test with eccentric loading, repeatability test – or for the mere loading of an instrument –
e.g. preloading, tare load that is to be balanced, substitution load.
4.3.1 Standard weights
The traceability of weights to be used as standards shall be demonstrated by calibration
[8] consisting of
1. determination of the conventional value of mass
c
m
and/or the correction
c
m
to its nominal value
N
m
:
Ncc
mmm
, together with the expanded uncertainty
of the calibration
95
U
, or
2. confirmation that
c
m
is within specified maximum permissible errors
mpe
:
95N
Umpem
≤
c
m
≤
95N
Umpem
The standards should further satisfy the following requirements to an extent
appropriate to their accuracy:
3. density
s
sufficiently close to
c
= 8 000 kg/m³,
4. surface finish suitable to prevent a change in mass through contamination by
dirt or adhesion layers,
5. magnetic properties such that interaction with the instrument to be calibrated is
minimized.
Weights that comply with the relevant specifications of the International
Recommendation OIML R 111 [4] should satisfy all these requirements.
The maximum permissible errors, or the uncertainties of calibration of the standard
weights, shall be compatible with the scale interval d [2] (or [3]) of the instrument and/or
the needs of the client with regard to the uncertainty of the calibration of the instrument.
4.3.2 Other test loads
For certain applications mentioned in 4.3, 2
nd
sentence, it is not essential that the
conventional value of mass of a test load is known. In these cases, loads other than
standard weights may be used, with due consideration of the following
1. shape, material, composition should allow easy handling,

EURAMET Calibration Guide No. 18
Version 4.0 (11/2015)
- 11 -
2. shape, material, composition should allow the position of the centre of gravity to
be readily estimated,
3. their mass must remain constant over the full period they are in use for the
calibration,
4. their density should be easy to estimate,
5. loads of low density (e.g. containers filled with sand or gravel), may require
special attention in view of air buoyancy. Temperature and barometric pressure
may need to be monitored over the full period the loads are in use for the
calibration.
4.3.3 Use of substitution loads
A test load, of which the conventional value of mass must be known, should be made up
entirely of standard weights. But where this is not possible, or where the standard
weights are not sufficient to calibrate the normal range of the instrument or the range
agreed with the customer, any other load which satisfies 4.3.2 may be used for
substitution. The instrument under calibration is used as a comparator to adjust the
substitution load
sub
L
so that it brings about approximately the same indication
I
as the
corresponding load
St
L
made up of standard weights.
A first test load
1T
L
made up of standard weights
ref
m
is indicated as
refSt
mILI
(4.3.3-1)
After removing
St
L
a substitution load
sub1
L
is put on and adjusted to give approximately
the same indication
refsub1
mILI
(4.3.3-2)
so that
1refrefsub1refsub1
ImmILImL
(4.3.3-3)
The next test load
T2
L
is made up by adding
ref
m
1refrefsub1T2
2 ImmLL
(4.3.3-4)
ref
m
is again replaced by a substitution load of ≈
sub1
L
with adjustment to ≈
T2
LI
.
The procedure may be repeated, to generate test loads L
T3
, ...,L
Tn
121refT
nn
IIInmL
(4.3.3-5a)
With each substitution step however, the uncertainty of the total test load increases
substantially more than if it were made up of standard weights only, due to the effects of
repeatability and resolution of the instrument. – cf. also 7.1.2.6
2
.
If the test load
1T
L
is made up of more than one standard weight, it is possible to first use
2
Example: for an instrument with Max = 5000 kg, d= 1 kg, the standard uncertainty of 5 t standard weights of accuracy class M1
– based on their nominal value, and using (7.1.2-3) – is around150 g, while the standard uncertainty of a test load made up of 1 t
standard weights and 4 t substitution load, using (7.1.2-16a), will be about 1,2 kg. In this example, uncertainty contributions due to
buoyancy and drift were neglected. Equally, it was assumed that the uncertainty of the indication only comprises the rounding error
at no-load and at load.

EURAMET Calibration Guide No. 18
Version 4.0 (11/2015)
- 12 -
the standard weights to create N individual test loads
k
m
ref,
(k = 1,…, N) with the
condition
1Trefref2refref,1
Lmm...mm
N,,
. (4.3.3-6)
Afterwards,
1T
L
is substituted by a substitution load
sub1
L
, and then the test loads
k
m
ref,
can again be added consecutively. The individual test loads shall be referred to as
kn
L
,T
with
121refrefT
1
nk,k,n
IIImmnL
. (4.3.3-5b)
4.4 Indications
4.4.1 General
Any indication I related to a test load is basically the difference of the indications
L
I
under load and
0
I
at no-load, before the load is applied
0
III
L
(4.4.1-1a)
It is preferable to record the no-load indications together with the load indications for any
test measurement. In the case that the user of the instrument takes into account the zero
return of any loading during normal use of the instrument, e.g. in the case of a
substantial drift, the indication can be corrected according to equation (4.4.1-1b)
3
.
However, recording the no-load indications may be redundant where a test procedure
calls for a balance to be zeroed before a test load is applied.
For any test load, including no-load, the indication I of the instrument is read and
recorded only when it can be considered as being stable. Where high resolution of the
instrument, or environmental conditions at the calibration site prevent stable indications,
an average value should be estimated and recorded together with information about the
observed variability (e.g. spread of values, unidirectional drift).
During calibration tests, the original indications should be recorded, not errors or
variations of the indication.
4.4.2 Resolution
Indications are normally obtained as integer multiples of the scale interval d.
At the discretion of the calibration laboratory and with the consent of the client, means to
obtain indications in higher resolution than in d may be applied, e.g. where compliance
to a specification is checked and smallest uncertainty is desired. Such means may be
1. switching the indicating device to a smaller scale interval d
T
<d (“service mode”).
In this case, the indications are obtained as integer multiple of d
T
.
2. applying small extra test weights in steps of
5
T
dd
or
10d
to determine
more precisely the load at which an indication changes unambiguously from
I
to dI
(“changeover point method”). In this case, the indication I’ is recorded
3
In case of linear drift the corrected reading is given by
2
00 iL
IIII
(4.4.1-1b)
where
I
0
and
I
0
i
are the no-load indications before and after the load is applied.

EURAMET Calibration Guide No. 18
Version 4.0 (11/2015)
- 13 -
together with the amount
L
of the n additional small test weights necessary to
increase
I
by one d .
The indication
L
I
is
T
22 nddILdII
'
L
(4.4.2-1)
Where the changeover point method is applied, it is advised to apply it for the indications
at zero as well as for the indications at load.
5 MEASUREMENT METHODS
Tests are normally performed to determine
the repeatability of indications,
the errors of indications,
the effect of eccentric application of a load on the indication.
A Calibration Laboratory deciding on the number of measurements for its routine
calibration procedure should consider that, in general, a larger number of measurements
tends to reduce the uncertainty of measurement but increase the cost.
Details of the tests performed for an individual calibration may be fixed by agreement of
the client and the Calibration Laboratory, in view of the normal use of the instrument.
The parties may also agree on further tests or checks which may assist in evaluating the
performance of the instrument under special conditions of use. Any such agreement
should be consistent with the minimum numbers of tests as specified in the following
sections.
5.1 Repeatability test
The test consists of the repeated deposition of the same load on the load receptor,
under identical conditions of handling the load and the instrument, and under constant
test conditions.
The test load(s) need not be calibrated nor verified, unless the results serve for the
determination of errors of indication as per 5.2. The test load should, as far as possible,
consist of one single body.
The test is performed with at least one test load
T
L
which should be selected in a
reasonable relation to
Max and the resolution of the instrument, to allow an appraisal of
the instrument performance. For instruments with a constant scale interval d a load of
about
MaxLMax
T
5,0
is quite common; this is often reduced for instruments where
T
L
would amount to several 1000 kg. For multi-interval instruments [2] (or [3]) a load
below and close to
1
Max
may be preferred. For multiple range instruments, a load below
and close to the capacity of the range with the smallest scale interval may be sufficient.
A special value of
T
L
may be agreed between the parties where this is justified in view
of a specific application of the instrument.
The test may be performed at more than one test point, with test loads
j
L
T
,
L
kj
1
with
L
k
= number of test points.
Prior to the test, the indication is set to zero. The load is to be applied at least 5 times, or
EURAMET Calibration Guide No. 18
Version 4.0 (11/2015)
- 14 -
at least 3 times where
T
L
≥ 100 kg.
Indications
Li
I
are recorded for each deposition of the load. After each removal of the
load, the indication should be checked, and may be reset to zero if it does not show
zero; recording of the no-load indications
i
I
0
may be advisable as per 4.4.1. In addition,
the status of the zero-setting or zero-tracking device if fitted should be recorded.
5.2 Test for errors of indication
This test is performed with
L
k
≥ 5 different test loads
j
L
T
, 1 ≤ j ≤
L
k
, distributed fairly
evenly over the normal weighing range or at individual test points agreed upon as per
4.1.1. Examples for target values
L
k
= 5: zero or Min; 0,25 Max; 0,5 Max; 0,75 Max;Max. Actual test loads may
deviate from the target value up to 0,1 Max, provided the difference between
consecutive test loads is at least 0,2 Max,
L
k
= 11: zero or Min, 10 steps of 0,1 Max up to Max. Actual test loads may
deviate from the target value up to 0,05 Max, provided the difference between
consecutive test loads is at least 0,08 Max.
The purpose of this test is an appraisal of the accuracy of the instrument over the whole
weighing range.
Where a significantly smaller range of calibration has been agreed, the number of test
loads may be reduced accordingly, provided there are at least 3 test points including
nMi
and xMa
, and the difference between two consecutive test loads is not greater
than
Max15,0
.
It is necessary that test loads consist of appropriate standard weights or of substitution
loads as per 4.3.3.
Prior to the test, the indication is set to zero. The test loads
j
L
T
are normally applied
once in one of these manners
1. increasing by steps with unloading between the separate steps – corresponding
to the majority of uses of the instruments for weighing single loads,
2. continuously increasing by stepswithout unloading between the separate steps;
this may include creep effects in the results but reduces the amount of loads to
be moved on and off the load receptor as compared to 1,
3. continuously increasing and decreasing by steps – procedure prescribed for
verification tests in [2] (or [3]), same comments as for 2,
4. continuously decreasing by steps starting from
Max- simulates the use of an
instrument as hopper weigher for subtractive weighing, same comments as for
2.
On multi-interval instruments – see [2] (or [3]), the methods above may be modified for
load steps smaller than
Max, by applying increasing and/or decreasing tare loads,
taring the instrument, and applying a test load close to but not larger than
1
Max
to obtain
indications with d
1
.
On a multiple range instrument [2] (or [3]), the client should identify which range(s) shall
be calibrated (see 4.1.1, 2
nd
paragraph).

EURAMET Calibration Guide No. 18
Version 4.0 (11/2015)
- 15 -
Further tests may be performed to evaluate the performance of the instrument under
special conditions of use, e.g. the indication after a tare balancing operation, the
variation of the indication under a constant load over a certain time, etc.
The test, or individual loadings, may be repeated to combine the test with the
repeatability test under 5.1.
Indications
Lj
I
are recorded for each load. In the case that the loads are removed, the
zero indication should be checked, and may be reset to zero if it does not show zero;
recording of the no-load indications
j
I
0
may be advisable as per 4.4.1.
5.3 Eccentricity test
The test comprises placing a test load
ecc
L
in different positions on the load receptor in
such a manner that the centre of gravity of the applied load takes the positions as
indicated in Figure 5.3-1 or equivalent positions, as closely as possible.
Fig. 5.3-1 Positions of load for test of eccentricity
1. Centre
2. Front left
3. Back left
4. Back right
5. Front right
There may be applications where the test load cannot be placed in or close to the centre
of the load receptor. In this case, it is sufficient to place the test load at the remaining
positions as indicated in Figure 5.3-1. Depending on the platter shape, the number of the
off-centre positions might deviate from figure 5.3-1.
The test load
ecc
L
should be about
3Max
or higher, or
3nMixManMi
or
higher for a reduced weighing range.
Advice of the manufacturer, if available, and limitations that are obvious from the design
of the instrument should be considered – e.g. see OIML R76 [2] (or EN 45501 [3]) for
special load receptors.
For a multiple range instrument [2] (or [3]) the test should only be performed in the range
with the largest capacity identified by the client (see 4.1.1, 2
nd
paragraph).
The test load need not be calibrated or verified, unless the results serve to determine the
errors of indication as per 5.2.
The test can be carried out in different manners:
1. Prior to the test, the indication is set to zero. The test load is first put on position
1, is then moved to the other 4 positions in arbitrary order. Indications
Li
I
are
recorded for each position of the load.
2. The test load is first put on position 1, then the instrument is tared. The test load
is then moved to the other 4 positions in arbitrary order. Indications
Li
I
are
recorded for each position of the load.
3. Prior to the test, the indication is set to zero. The test load is first put on position
1, removed, and then put to the next position, removed, etc. until it is removed
EURAMET Calibration Guide No. 18
Version 4.0 (11/2015)
- 16 -
from the last position. Indications
Li
I
are recorded for each position of the load.
After each removal of the load, the indication should be checked, and may be
reset to zero if it does not show zero; recording of the no-load indications
i
I
0
may be advisable as per 4.4.1.
4. The test load is first put on position 1, then the instrument is tared. The test load
is then moved to the next position and moved back to position 1, etc. until it is
removed from the last position. The center indication
1L
I
is recorded individually
for all off-centre indications
Li
I
.
Method 3 and 4 are suggested for instruments that show a substantial drift during the
time of the eccentricity test.
For methods 2 and 4 zero-setting or zero-tracking devices must be switched off during
the complete eccentricity test.
5.4 Auxiliary measurements
The following additional measurements or recordings are recommended, in particular
where a calibration is intended to be performed with the lowest possible uncertainty.
In view of buoyancy effects – cf. 4.2.2:
The air temperature in reasonable vicinity to the instrument should be measured, at
least once during the calibration. Where an instrument is used in a controlled
environment, the span of the temperature variation should be noted, e.g. from a
thermograph, from the settings of the control device etc.
Barometric pressure or, by default, the altitude above sea-level of the site may also
be useful.
In view of convection effects – cf. 4.2.3:
Special care should be taken to prevent excessive convection effects, by observing
a limiting value for the temperature difference between standard weights and
instrument, and/or recording an acclimatisation time that has been executed. A
thermometer kept inside the box with standard weights may be helpful, to check the
temperature difference.
In view of effects of magnetic interaction:
On high resolution instruments a check is recommended to see if there is an
observable effect of magnetic interaction. A standard weight is weighed together
with a spacer made of non-metallic material (e.g. wood, plastic), the spacer being
placed on top or underneath the weight to obtain two different indications.
If the difference between these two indications is significantly different from zero,
this should be mentioned as a warning in the calibration certificate.
6 MEASUREMENT RESULTS
The procedures and formulae in chapters 6 and 7 provide the basis for the evaluation of
the results of the calibration tests and therefore require no further description on a test
report. If the procedures and formulae used deviate from those given in the guide,
additional information may need to be provided in the test report.
It is not intended that all of the formulae, symbols and/or indices are used for
presentation of the results in a Calibration Certificate.

EURAMET Calibration Guide No. 18
Version 4.0 (11/2015)
- 17 -
The definition of an indication
I
as given in 4.4 is used in this section.
6.1 Repeatability
From the n indications
ji
I
for a given test load
j
L
T
, the standard deviation
j
s
is
calculated
n
i
jjij
II
n
s
1
2
1
1
(6.1-1)
with
n
i
jij
I
n
I
1
1
(6.1-2)
Where only one test load has been applied, the index
j
may be omitted.
6.2 Errors of indication
6.2.1 Discrete values
For each test load
j
L
T
, the error of indication is calculated as follows
jjj
mIE
ref
(6.2-1)
Where an indication
j
I
is the mean of more than one reading,
j
I
is understood as
being the mean value as per (6.1-2).
The reference value of mass
ref
m
could be approximated to its nominal value
j
m
N
jj
mm
Nref
(6.2-2)
or, more accurately, to its actual conventional value
c
m
jjjj
mmmm
cNcref
(6.2-3)
If a test load is made up of more than one weight,
j
m
N
is replaced by
j
m
N
and
j
m
c
is replaced by
j
m
c
in the formulae above.
Furthercorrections as per (7.1.2-1) might apply.
6.2.2 Characteristic of the weighing range
In addition, or as an alternative to the discrete values
j
I
,
j
E
, a characteristic, or
calibration curve may be determined for the weighing range, which allows estimation of
the error of indication for any indication
I
within the weighing range.
A function
IfE
(6.2-4)
may be generated by an appropriate approximation which should, in general, be based
on the “least squares” approach
EURAMET Calibration Guide No. 18
Version 4.0 (11/2015)
- 18 -
2
2
jjj
EIfv
minimum (6.2-5)
with
j
v
= residual
f
= approximation function
The approximation should further
take account of the uncertainties
j
Eu
of the errors,
use a model function that reflects the physical properties of the instrument, e.g.
the form of the relation between load and its indication
LgI
,
include a check as to whether the parameters found for the model function are
mathematically consistent with the actual data.
It is assumed that for any
j
m
N
the error
j
E
remains the same if the actual indication
j
I
is replaced by its nominal value
j
I
N
. The calculations to evaluate (6.2-5) can therefore
be performed with the data sets
j
m
N
,
j
E
, or
j
I
N
,
j
E
.
Appendix C offers advice for the selection of a suitable approximation formula and for
the necessary calculations.
6.3 Effect of eccentric loading
From the indications
i
I
obtained in the different positions of the load as per 5.3, the
differences
ecc
I
are calculated.
For method 1 and 2 as per 5.3
1ecc LLii
III
(6.3-1)
For method 3 as per 5.3
10ecc LiLii
IIII
(6.3-2)
For method 4 as per 5.3
iLLii
III
1ecc
(6.3-3)
where for each off-centre indication
Li
I
the respective centre indication
iL
I
1
is taken for
the calculation.
7 UNCERTAINTY OF MEASUREMENT
In this and the following sections, there are uncertainty terms assigned to small
corrections, which are proportional to a specified mass value or to a specified indication.
For the quotient of such an uncertainty divided by the related value of mass or indication,
the abbreviated notation u
rel
will be used.
Example: let
corrummu
corr
(7-1)

EURAMET Calibration Guide No. 18
Version 4.0 (11/2015)
- 19 -
with the dimensionless term
corru
, then
corrumu
corrrel
(7-2)
Accordingly, the related variance will be denoted by
corr
2
rel
mu
and the related
expanded uncertainty by
corrrel
mU
.
For the determination of uncertainty, second order terms have been considered
negligible, but when first order contributions cancel out, second order contributions
should be taken into account (see JCGM 101 [9], 9.3.2.6).
7.1 Standard uncertainty for discrete values
The basic formula for the calibration is
ref
mIE
(7.1-1)
with variance
ref
222
muIuEu
(7.1-2)
Where substitution loads are employed, see 4.3.3,
ref
m
is replaced by
n
L
T
or
kn
L
,T
in
both expressions.
The terms are further expanded hereafter.
7.1.1 Standard uncertainty of the indication
To account for sources of variability of the indication, (4.4.1-1) is amended by correction
terms
xx
I
as follows
...IIIIIII
LL
0dig0eccrepdig
(7.1.1-1)
Further correction terms may be applied in special conditions (temperature effects, drift,
hysteresis,..), which are not considered hereafter.
All these corrections have the expectation value zero. Their standard uncertainties are
7.1.1.1
0dig
R
accounts for the rounding error of no-load indication. Limits are
2
0
d
or
2
T
d
as applicable; rectangular distribution is assumed, therefore
32
00dig
dIu
(7.1.1-2a)
or
32
T0dig
dIu
(7.1.1-2b)
respectively.
Note 1: cf. 4.4.2 for significance of
T
d
.
Note 2: on an instrument which has been type approved to OIML R76 [2] (or EN 45501
[3]), the rounding error of a zero indication after a zero-setting or tare balancing
operation is limited to
4
0
d
, therefore

EURAMET Calibration Guide No. 18
Version 4.0 (11/2015)
- 20 -
34
00dig
dIu
(7.1.1-2c)
7.1.1.2
L
I
dig
accounts for the rounding error of indication at load. Limits are
2
I
d
or
2
T
d
as applicable; rectangular distribution to be assumed, therefore
32
Idig
dIu
L
(7.1.1-3a)
or
32
Tdig
dIu
L
(7.1.1-3b)
Note: on a multi-interval instrument,
I
d
varies with I.
7.1.1.3
rep
I
accounts for the repeatability of the instrument; normal distribution is assumed,
estimated as
j
IsIu
rep
(7.1.1-5)
where
j
Is
is determined in 6.1.
If the indication
I
is a single reading and only one repeatability test has been
performed, this uncertainty of repeatability can be considered as representative for the
whole range of the instrument.
Where an indication
j
I
is the mean of N indications performed with the same test load
during the error of indication test, the corresponding standard uncertainty is
NIsIu
j
rep
(7.1.1-6)
Where several
j
s
(
jj
Iss
in abbreviated notation) values have been determined with
different test loads, the greater value of
j
s
for the two test points enclosing the
indication whose error has been determined, should be used.
For multi-interval and multiple range instruments where a repeatability test was carried
out in more than one interval/range, the standard deviation of each interval/range may
be considered as being representative for all indications of the instrument in the
respective interval/range.
Note: For a standard deviation reported in a calibration certificate, it should be clear
whether it is related to a single indication or to the mean of N indications.
7.1.1.4
ecc
I
accounts for the error due to off-centre position of the centre of gravity of a test
load. This effect may occur where a test load is made up of more than one body. Where
this effect cannot be neglected, an estimate of its magnitude may be based on these
assumptions:
the differences
ecc
I
determined by (6.3-1) are proportional to the distance of
the load from the centre of the load receptor,
the differences
ecc
I
determined by (6.3-1) are proportional to the value of the
load,

EURAMET Calibration Guide No. 18
Version 4.0 (11/2015)
- 21 -
the effective centre of gravity of the test loads is not further from the centre of
the load receptor than half the distance between the load receptor centre and
the eccentricity load positions, as per figure 5.3-1.
Based on the largest of the differences determined as per 6.3,
ecc
I
is estimated to be
ILII
i ecc
max
eccecc
2
(7.1.1-9)
Rectangular distribution is assumed, so the standard uncertainty is
32
ecc
max
eccecc
LIIIu
i
(7.1.1-10)
or, in relative notation
32
ecc
max
ecceccrel
LIIu
i
(7.1.1-11)
7.1.1.5 The standard uncertainty of the indication is normally obtained by
2
ecc
2
relrep
222
0
2
1212 IIuIuddIu
I
(7.1.1-12)
Note 1: the uncertainty
Iu
is constant only where
s
is constant and no eccentricity
error has to be considered.
Note 2: the first two terms on the right hand side may have to be modified in special
cases as mentioned in 7.1.1.1 and 7.1.1.2.
7.1.2 Standard uncertainty of the reference mass
From 4.2.4 and 4.3.1 the reference value of mass is
mmmmmmm
D
convBcNref
(7.1.2-1)
The rightmost term stands for further corrections which may be necessary to apply under
special conditions.These are not considered hereafter.
The corrections and their standard uncertainties are
7.1.2.1
c
m
is the correction to
N
m
to obtain the conventional value of mass
c
m
; given in the
calibration certificate for the standard weights, together with the uncertainty of calibration
U and the coverage factor k . The standard uncertainty is
kUmu
c
(7.1.2-2)
Where the standard weight has been calibrated to specified tolerances
Tol , e.g. to the
mpe
given in OIML R111 [4], and where it is used its nominal value
N
m
, then
c
m
= 0,
and rectangular distribution is assumed, therefore
3
c
Tolmu
(7.1.2-3)
Where a test load consists of more than one standard weight, the standard uncertainties
are summed arithmetically not by a sum of squares, to account for assumed correlation.
For test loads partially made up of substitution loads see 7.1.2.6.

EURAMET Calibration Guide No. 18
Version 4.0 (11/2015)
- 22 -
7.1.2.2
B
m
is the correction for air buoyancy as introduced in 4.2.4. The value depends on the
density
of the calibration weight and on the assumed range of air density
a
at the
laboratory.
c0aNB
11
mm
(7.1.2-4)
with relative standard uncertainty
42
2
0a
2
ca
2
B
2
rel
11
uumu
(7.1.2-5a)
4
As far as values for
,
u
,
a
and
a
u
, are known, these values should be used
to determine
Brel
mu
.
The density
and its standard uncertainty may, in the absence of such information, be
estimated according to the state of the art or based on information provided by the
manufacturer. Appendix E1 offers internationally recognized values for common
materials used for standard weights.
The air density
a
and its standard uncertainty can be calculated from temperature and
barometric pressure if available (the relative humidity being of minor influence), or may
be estimated from the altitude above sea-level.
Where conformity of the standard weights to OIML R111 [4] is established, and no
information on
and
a
is at hand, recourse may be taken to section 10 of OIML
R111
5
. No correction is applied, and the relative uncertainties are
If the instrument is adjusted immediately before calibration
34
NBrel
mmpemu
(7.1.2-5c)
If the instrument is not adjusted before calibration
3410
Nc0Brel
mmpe,mu
(7.1.2-5d)
If some information can be assumed for the temperature variation at the location of the
instrument, equation (7.1.2-5d) can be substituted by:
34K1033110071
Nc0
2264
Brel
mmpeT,,mu
(7.1.2-5e)
where T is the maximum variation of environmental temperature that can be assumed
for the location (see appendixes A2.2 and A3 for details).
From the requirement in footnote 5, the limits of the value of
can be derived: e.g. for
class E
2
:
c
200 kg/m³, and for class F
1
:
c
600 kg/m³.
4
A more accurate formula for (7.1.2-5a) would be [10]
42
0a10a0a
2
ca
2
B
2
211
rel
uumu
(7.1.2-5b)
where
a1
is the air density at the time of the calibration of the standard weights. This formula is useful when the instrument is
located at high altitude above sea level, otherwise the uncertainty could be overestimated.
5
The density of the material used for weights shall be such that a deviation of10 % from the specified air density (1.2 kg/m³) does
not produce an error exceeding one quarter of the maximum permissible error.

EURAMET Calibration Guide No. 18
Version 4.0 (11/2015)
- 23 -
Note: Due to the fact that the density of materials used for standard weights is
normally closer to
c
than the OIML R111 limits would allow, the last 3
formulae may be considered as upper limits for
Brel
mu
. Where a simple
comparison of these values with the resolution of the instrument
Max/d
shows they are small enough, a more elaborate calculation of this uncertainty
component based on actual data may be superfluous.
7.1.2.3
D
m
corresponds to the possible drift of
c
m
since the last calibration. A limiting value
D
is best assumed, based on the difference in
c
m
evident from consecutive calibration
certificates of the standard weights.
D
may be estimated in view of the quality of the weights, and frequency and care of
their use, to at least a multiple of their expanded uncertainty
c
mU
(7.1.2-10)
where
D
k
is a chosen value between 1 and 3.
In the absence of information on drift the value of
D
will be chosen as the mpe
according to OIML R 111 [4].
It is not advised to apply a correction but to assume even distribution within
D
(rectangular distribution). The standard uncertainty is then
3Dmu
D
(7.1.2-11)
Where a set of weights has been calibrated with a standardised expanded relative
uncertainty
c
mU
rel
, it may be convenient to introduce a relative limit value for drift
Nrel
mDD
and a relative uncertainty for drift
3
relrel
Dmu
D
(7.1.2-12)
7.1.2.4
conv
m
corresponds to the convection effects as per 4.2.3. A limiting value
conv
m
may
be taken from Appendix F, depending on a known difference in temperature
T
and on
the mass of the standard weight.
It is not advised to apply a correction but to assume even distribution within
conv
m
.
The standard uncertainty is then
3
convconv
mmu
(7.1.2-13)
It appears that this effect is only relevant for weights of classes F
1
or better.
7.1.2.5 The standard uncertainty of the reference mass is obtained from – cf. 7.1.2
conv
22
B
2
c
2
ref
2
mumumumumu
D
(7.1.2-14)
with the contributions from 7.1.2.1 to 7.1.2.4.
c
mUkD
D
EURAMET Calibration Guide No. 18
Version 4.0 (11/2015)
- 24 -
7.1.2.6 Where a test load is partially made up of substitution loads as per 4.3.3, and the test
loads are defined per (4.3.3-5a), the standard uncertainty for the sum
121refT
nn
IIInmL
is given by the following expression
1
2
2
2
1
2
ref
22
T
2
2
nn
IuIuIumunLu
(7.1.2-15a)
with
ref
mu
from 7.1.2.5, and
j
Iu
from 7.1.1.5 for
j
LII
T
Where a test load is partially made up of substitution loads as per 4.3.3, and the test
loads are defined per (4.3.3-5b), the standard uncertainty for the sum
121,refref,T
1
nkkn
IIImmnL
is given by the following expression
1
2
2
2
1
2
2
,refref,T
2
21
nkkn
IuIuIumumunLu
(7.1.2-15b)
with
ref
mu
from 7.1.2.5, and
j
Iu
from 7.1.1.5 for
j
LII
T
Note: The uncertainties
j
Iu
also have to be included for indications where the
substitution load has been adjusted in such a way that the corresponding
I
becomes zero.
Depending on the kind of the substitution load, it may be necessary to add further
uncertainty contributions
for eccentric loading as per 7.1.1.4 to some or all of the actual indications
j
LI
T
for air buoyancy of the substitution loads, where these are made up of low
density materials (e.g. sand, gravel) and the air density varies significantly over
the time the substitution loads are in use.
Where
j
Iu
= const, the expression (7.1.2-15a) simplifies to
IunmunLu
n
2
ref
22
T
2
12
(7.1.2-16a)
and the expression (7.1.2-15b) simplifies to
IunmumunLu
kkn
2
2
,refref,T
2
121
(7.1.2-16b)
7.1.3 Standard uncertainty of the error
The standard uncertainty of the error is, with the terms from 7.1.1 and 7.1.2, as
appropriate, calculated from
conv
22
B
2
c
2
ecc
2
rep
2
dig
2
0dig
22
mumumumu
IuIuIuIuEu
D
I
(7.1.3-1a)
or, where relative uncertainties apply, from
conv
22
ref
2
relB
2
relc
2
rel
2
ecc
2
relrep
2
dig
2
0dig
22
mummumumu
IIuIuIuIuEu
D
I
(7.1.3-1b)
In the case of using substitution loads
knIkn
LuIuIuIuIuEu
,T
2
ecc
2
rep
2
dig
2
0dig
2
,
2
(7.1.3-1c)
EURAMET Calibration Guide No. 18
Version 4.0 (11/2015)
- 25 -
where n is related to the number of substitution steps and k is the number of standard
weights.
All input quantities are considered to be uncorrelated, therefore covariances are not
considered.
The index “
j
”has been omitted.
In view of the general experience that errors are normally very small compared to the
indication, or may even be zero, in (7.1.3-1b) the values for
ref
m
and
I
may be replaced
by
N
I
.
The terms in (7.1.3-1b) may then be grouped into a simple formula which better reflects
the fact that some of the terms are absolute in nature while others are proportional to the
indication
2222
IEu
(7.1.3-2)
7.2 Standard uncertainty for a characteristic
Where an approximation is performed to obtain a formula
IfE
for the whole
weighing range as per 6.2.2, the standard uncertainty of the error per 7.1.3 has to be
modified to be consistent with the method of approximation. Depending on the model
function, this may be
a single variance which is added to (7.1.3-1), or
a set of variances and covariances which include the variances in (7.1.3-1).
The calculations should also include a check whether the model function is
mathematically consistent with the data sets
j
E
,
j
I
,
j
Eu
.
The minimum
2
approach, which is similar to the least squares approach, is proposed
for approximations. Details are given in Appendix C.
7.3 Expanded uncertainty at calibration
The expanded uncertainty of the error is
EukEU
(7.3-1)
The coverage factor
k
should be chosen such that the expanded uncertainty
corresponds to a coverage probability of 95,45 %.
Further information on how to derive the coverage factor is given in Appendix B.
7.4 Standard uncertainty of a weighing result
Chapter 7.4 and 7.5 provide advice on how the measurement uncertainty of an
instrument could be estimated in normal usage, thereby taking into account the
measurement uncertainty at calibration. Where a calibration laboratory offers to its
clients such estimates which are based upon information that has not been measured by
the laboratory, the estimates must not be presented as part of the calibration certificate.
However, it is acceptable to provide such estimates as long as they are clearly
separated from the calibration results.
The user of an instrument should be aware of the fact that in normal usage, the situation
is different from that at calibration in some if not all of these aspects

EURAMET Calibration Guide No. 18
Version 4.0 (11/2015)
- 26 -
1. the indications obtained for weighed bodies are not the ones at calibration,
2. the weighing process may be different from the procedure at calibration
a. generally only one reading is taken for each load, not several readings to
obtain a mean value,
b. reading is to the scale interval
d , of the instrument, not to a higher
resolution,
c. loading is up and down, not only upwards – or vice versa,
d. load may be kept on load receptor for a longer time, not unloading after
each loading step – or vice versa,
e. eccentric application of the load,
f. use of tare balancing device, etc.
3. the environment (temperature, barometric pressure etc.) may be different,
4. for instruments which are not readjusted regularly e.g. by use of a built-in
device, the adjustment may have changed, due to drift or to wear and tear.
Unlike items 1 to 3, this effect should therefore be considered in relation to a
certain period of time, e.g. for one year or the normal interval between
calibrations,
5. the repeatability of the adjustment.
In order to clearly distinguish from the indications
I
obtained during calibration, the
weighing results obtained when weighing a load
L
on the calibrated instrument, these
terms and symbols are introduced
L
R
= reading when weighing a load
L
on the calibrated instrumentobtained
after the calibration.
0
R
= reading without load on the calibrated instrumentobtained after the
calibration.
Readings are taken to be single readings in normal resolution (multiple of
d ), with
corrections to be applied as applicable.
For a reading taken under the same conditions as those prevailing at calibration, the
result may be denominated as the weighing result under the conditions of the calibration
*W
ERRRRRR*W
LL
0dig0eccrepdig
(7.4-1a)
with the associated uncertainty
ecc
2
rep
2
dig
2
0dig
22
RuRuRuRuEu*Wu
L
(7.4-2a)
To take account of the remaining possible influences on the weighing result, further
corrections are formally added to the reading in a general manner resulting in the
general weighing result
(7.4-1b)
where
instr
R
represents a correction term due to environmental influences and
proc
R
represents a correction term due to the operation of the instrument.
procinstr
* RRWW

EURAMET Calibration Guide No. 18
Version 4.0 (11/2015)
- 27 -
The associated uncertainty is
proc
2
instr
22
* RuRuWuWu
(7.4-2b)
The added terms and the corresponding standard uncertainties are discussed in 7.4.3
and 7.4.4. The standard uncertainties
*Wu
and
Wu
are finally presented in 7.4.5.
Sections 7.4.3 and 7.4.4, 7.4.5 and 7.5, are meant as advice to the user of the
instrument on how to estimate the uncertainty of weighing results obtained under their
normal conditions of use. They are not meant to be exhaustive or mandatory.
7.4.1 Standard uncertainty of a reading in use
To account for sources of variability of the reading, (7.1.1-1) applies, with
I
replaced by
R
0dig0eccrepdig
RRRRRRR
LL
(7.4.1-1)
The corrections and their standard uncertainties are
7.4.1.1
0dig
R
accounts for the rounding error at zero reading. 7.1.1.1 applies with the exception
that the variant
dd
T
, is excluded, so
12
00dig
dRu
(7.4.1-2)
7.4.1.2
L
R
dig
accounts for the rounding error at load reading. 7.1.1.2 applies with the exception
that the variant
L
dd
T
is excluded, so
12
dig LL
dRu
(7.4.1-3)
7.4.1.3
rep
R
accounts for the repeatability of the instrument. 7.1.1.3 applies, the relevant
standard deviation
s for a single reading is to be taken from the calibration certificate, so
sRu
rep
or
RsRu
rep
(7.4.1-4)
Note: The standard deviation not the standard deviation of the mean should be used
for the uncertainty calculation.
7.4.1.4
ecc
R
accounts for the error due to off-centre position of the centre of gravity of a load.
32
ecc
max
ecceccrel
LIRu
i
(7.4.1-5)
7.4.1.5 The standard uncertainty of the reading is then obtained by
2
2
ecc
max
ecc
222
0
2
321212 RLIRsddRu
iL
(7.4.1-6)
7.4.2 Uncertainty of the error of a reading
Where a reading
R
corresponds to an indication
j
I
cal
reported in the calibration
certificate,
j
Eu
cal
may be taken from there. For other readings,
Eu
may be calculated
by (7.1.3-2) if
and
are known, or it results from interpolation, or from an

EURAMET Calibration Guide No. 18
Version 4.0 (11/2015)
- 28 -
approximation formula as per 7.2.
The uncertainty
Eu
is normally not smaller than
j
Eu
cal
for an indication
j
I
that is
close to the actual reading
R
, unless it has been determined by an approximation
formula.
Note: the calibration certificate normally presents
cal95
EU
from which
cal
Eu
is
calculated by dividing
cal95
EU
by the coverage factor k stated in the
certificate.
7.4.3 Uncertainty from environmental influences
The term
instr
R
accounts for up to 3 effects
temp
R
,
buoy
R
and
adj
R
, which are discussed
hereafter. Except for the contribution due to buoyancy, they do normally not apply to
instruments which are adjusted directly before they are actually used. Other instruments
should be considered as appropriate. No corrections are actually applied, the
corresponding uncertainties are estimated, based on the user’s knowledge of the
properties of the instrument.
7.4.3.1 The term
temp
R
accounts for a change in the characteristic of the instrument caused by
a change in ambient temperature. A limiting value can be estimated to be
TRKR
T
temp
where
T
is the maximum temperature variation at the instrument
location and K
T
is the sensitivity of the instrument to temperature variation. When the
balance is controlled by a temperature triggered adjustment by means of the built-in
weights then
T
can be reduced to the trigger threshold.
Normally there is a manufacturer’s specification such as
Max/T/)Max(IK
T
,
in many cases quoted in 10
-6
/K. By default, for instruments with type approval under
OIML R76 [2] (or EN 45501 [3]), it may be assumed
Approval
TMaxMaxmpeK
T
where
Approval
T
is the temperature range of approval marked on the instrument; for
other instruments, either a conservative assumption has to be made, leading to a
multiple (3 to 10 times) of the comparable value for instruments with type approval, or no
information can be given at all for a use of the instrument at other temperatures than that
at calibration.
The range of variation of temperature
T
(full width) should be estimated in view of the
site where the instrument is being used, as discussed in Appendix A2.2.
Rectangular distribution is assumed, therefore the relative uncertainty is
12
temprel
TKRu
T
(7.4.3-1)
7.4.3.2 The term
buoy
R
accounts for a change in the adjustment of the instrument due to the
variation of the air density; no correction to be applied.
When the balance is adjusted immediately before use and some assumption for the
variation in air density with respect to the air density value at the calibration time
a
can
be made, the uncertainty contribution could be [10]
s
2
c
a
bouyrel
uRu
(7.4.3-2)

EURAMET Calibration Guide No. 18
Version 4.0 (11/2015)
- 29 -
where u(
s
) is the uncertainty of the density of the reference weight used for adjustment
(built-in or external).
When the balance is not adjusted before use and some assumption for the variation in
density
a
can be made, the uncertainty contribution could be
3
c
a
bouyrel
Ru
(7.4.3-3)
If some assumptions can be made for the temperature variation in the location of the
balance, equation (7.4.3-3) can be approximated by
c
0
2264
bouyrel
K1033110071
T,,
Ru
(7.4.3-4)
where T is the maximum assumed variation for the temperature in the location of the
balance (see appendixes A2.2 and A3 for details).
If no assumption about the density variation can be made the most conservative
approach would be
3
10
c
0
bouyrel
,
Ru
(7.4.3-5)
7.4.3.3 The term
adj
R
accounts for a change in the characteristics of the instrument since the
time of calibration due to drift, or wear and tear.
A limiting value may be taken from previous calibrations where they exist, as the largest
difference
MaxE
in the errors at or near Max between any two consecutive
calibrations. By default,
MaxE
should be taken from the manufacturer’s specification
for the instrument, or may be estimated as
MaxmpeMaxE
for instruments
conforming to a type approval under OIML R76 [2] (or EN 45501 [3]). Any such value
can be considered in view of the expected time interval between calibrations, assuming
fairly linear progress of the change with time.
Rectangular distribution is assumed, therefore the relative uncertainty is
3
adjrel
MaxMaxERu
(7.4.3-6)
7.4.3.4 The relative standard uncertainty related to errors resulting from environmental effects is
calculated by
adj
2
relbuoy
2
reltemp
2
relinstr
2
rel
RuRuRuRu
(7.4.3-7)
7.4.4 Uncertainty from the operation of the instrument
The correction term
proc
R
accounts for additional errors (
Tare
R
,
time
R
and
ecc
R
) which
may occur where the weighing procedure(s) is different from the one(s) at calibration. No
corrections are actually applied but the corresponding uncertainties are estimated,
based on the user’s knowledge of the properties of the instrument.

EURAMET Calibration Guide No. 18
Version 4.0 (11/2015)
- 30 -
7.4.4.1 The term
Tare
R
accounts for a net weighing result after a tare balancing operation [2] (or
[3]). The possible error and the uncertainty assigned to it should be estimated
considering the basic relation between the readings involved
TareGrossNet
RRR
(7.4.4-1)
where the
R
are fictitious readings which are processed inside the instrument, while
the visible indication
Net
R
is obtained directly, after setting the instrument indication to
zero with the tare load on the load receptor. The weighing result, in this case, is, in
theory
procinstrNetNet
RRTareEGrossERW
(7.4.4-2)
consistent with (7.4-1). The errors at gross and tare would have to be taken as errors for
equivalent
R
values as above. However, the tare values – and consequently the gross
values – are not normally recorded.
The error may then be estimated as
TareNet
RNetEE
(7.4.4-3)
where
NetE
is the error for a reading
Net
R
and
Tare
R
is an additional correction for
the effect of non-linearity of the error curve
IE
cal
. To quantify the non-linearity,
recourse may be taken to the first derivative of the function
RfE
, if known, or the
slope
E
q
between consecutive calibration points may be calculated by
jj
jj
E
II
EE
I
E
q
1
1
(7.4.4-4)
The largest and the smallest values of the derivatives or of the quotients are taken as
limiting values for the correction
Tare
R
, for which rectangular distribution may be
assumed. This results in the relative standard uncertainty
12
minmaxTarerel EE
qqRu
(7.4.4-5)
To estimate the uncertainty
Wu
,
Net
RR
is considered. For
Eu
it is valid to assume
NetREuNetEu
because there is full correlation between the quantities
contributing to the uncertainties of the errors of the fictitious grossand tarereadings.
7.4.4.2 The term
time
R
accounts for possible effects of creep and hysteresis, in situations such
as
a) loading at calibration continuously upwards, or continuously upwards and
downwards (method 2 or 3 in 5.2), so the load remains on the load receptor for a
certain period of time; this is quite significant where the substitution method has
been applied, usually with high capacity instruments. When in normal use, a discrete
load to be weighed is put on the load receptor and is kept there just as long as is
necessary to obtain a reading or a printout, the error of indication may differ from the
value obtained for the same load at calibration.
Where tests were performed continuously up and down, the largest difference of

EURAMET Calibration Guide No. 18
Version 4.0 (11/2015)
- 31 -
errors
j
E
for any test load
j
m
may be taken as the limiting value for this effect,
leading to a relative standard uncertainty
12
maxtimerel jj
mERu
(7.4.4-6)
Where tests were performed only upwards, the error on return to zero
0
E
, if
determined, may be used to estimate a relative standard uncertainty
3
0timerel
MaxERu
(7.4.4-7)
In the absence of such information, the limiting value may be estimated for
instruments with type approval under OIML R76 [2] (or EN 45501 [3]) as
MaxMaxmpeRRE
(7.4.4-8)
For instruments without such type approval, a conservative estimate would be a
multiple (m = 3 to 10 times) of this value.
The relative standard uncertainty is
3
timerel
MaxMaxmpeRu
, (7.4.4-9a)
for instruments with type approval and
3
timerel
MaxMaxmpemRu
(7.4.4-9b)
for instruments without type approval.
b) loading at calibration with unloading between load steps, loads to be weighed in
normal use are kept on the load receptor for a longer period. In the absence of any
other information – e.g. observation of the change in indication over a typical period
of time – recourse may be taken to (7.4.4-9) as applicable.
c) loading at calibration only upwards, discharge weighing is performed in use. This
situation may be treated as the inverse of the tare balancing operation – see 7.4.4.1
- combined with point b) above. (7.4.4-5) and (7.4.4-9) apply.
Note: In case of discharge weighing, the reading
R
shall be taken as a positive value
although it may be indicated as negative by the weighing instrument.
7.4.4.3
ecc
R
accounts for the error due to off-centre position of the centre of gravity of a load.
(7.4.1-5) applies with the modification that the effect found during calibration should be
considered in full, so
3
ecc
max
ecceccrel
LIRu
i
(7.4.4-10)
7.4.5 Standard uncertainty of a weighing result
The standard uncertainty of a weighing result is calculated from the terms specified in
7.4.1 to 7.4.4, as applicable.
For the weighing result under the conditions of the calibration
EuRRuRsdd*Wu
L
22
ecc
2
rel
222
0
2
1212
(7.4.5-1a)
For the weighing result in general
EURAMET Calibration Guide No. 18
Version 4.0 (11/2015)
- 32 -
2
time
2
relTare
2
reladj
2
relbouy
2
reltemp
2
rel
22
RRuRuRuRuRu
W*uWu
(7.4.5-1b)
The many contributions to
Wu
may be grouped in two terms
2
W
and
2
W
2222
RWu
WW
(7.4.5-2)
where
2
W
is the sum of squares of all absolute standard uncertainties, and
2
W
is the
sum of squares of all relative standard uncertainties.
7.5 Expanded uncertainty of a weighing result
7.5.1 Errors accounted for by correction
The complete formula for a weighing result which is equal to the reading corrected for
the error determined by calibration, is
** WURERW
(7.5.1-1a)
or
WURERW
(7.5.1-1b)
as applicable.
The expanded uncertainty
WU
is to be determined as
*Wuk*WU
(7.5.1-2a)
or
WukWU
(7.5.1-2b)
with
*Wu
or
Wu
as applicable from 7.4.5.
For
*WU
the coverage factor k should be determined as per 7.3.
For
WU
the coverage factor k will, in most cases be equal to 2 even where the
standard deviation
s
is obtained from only few measurements, and/or where
cal
k
2
was stated in the calibration certificate. This is due to the large number of terms
contributing to
Wu
.
7.5.2 Errors included in uncertainty
It may have been agreed by the calibration laboratory and the client to derive a “global
uncertainty”
WU
gl
which includes the errors of indication such that no corrections have
to be applied to the readings in use
WURW
gl
(7.5.2-1)
Unless the errors are more or less centred around zero, they form a one-sided
contribution to the uncertainty which can only be treated in an approximate manner. For
the sake of simplicity and convenience, the “global uncertainty” is best stated in the
format of an expression for the whole weighing range, instead of individual values stated
EURAMET Calibration Guide No. 18
Version 4.0 (11/2015)
- 33 -
for fixed values of the weighing result.
Let
RE
be a function, or
0
E
be one value representative for all errors stated over the
weighing range in the calibration certificate. The combination with the uncertainties in
use may then, in principle, take on one of these forms
2
2
gl
REWukWU
(7.5.2-2a)
2
02
gl
EWukWU
(7.5.2-2b)
2
2
02
gl
Max
R
EWukWU
(7.5.2-2c)
REWkuWU
gl
(7.5.2-3a)
0
gl
EWkuWU
(7.5.2-3b)
Max
R
EWkuWU
0
gl
(7.5.2-3c)
Quite frequently, (7.5.2-3a) is taken as basis for the statement of the global uncertainty.
Thereby,
WukWU
is often approximated by the following formula
RMax
WU
MaxWU
WUWU
0
0
(7.5.2-3d)
and
RE
is often approximated by
RaRE
1
as per (C2.2-16) and (C2.2-16a) so that
RaRMax
WU
MaxWU
WUWU
gl 1
0
0
(7.5.2-3e)
For further information on alternative generation of the formulae
RE
or the
representative value
0
E
see Appendix C.
In analogy to (7.5.2-3d), for multi-interval instruments
)(WU
is indicated per interval as
)MaxR(
MaxMax
MaxUMaxU
MaxUWU
i
ii
ii
i 1
1
1
1
(7.5.2-3f)
and for multiple range instruments
)(WU
is indicated per range.
It is important to ensure that
WU
gl
retains a coverage probability of not less than 95 %
over the whole weighing range. For
WU
gl
the coverage factor k will, in most cases be
equal to 2 even where the standard deviation
s
is obtained from only few
measurements, and/or where
cal
k
2 was stated in the calibration certificate. This is due
to the large number of terms contributing to
Wu
.
7.5.3 Other ways of qualification of the instrument
A client may expect from, or have asked the Calibration Laboratory for a statement of
EURAMET Calibration Guide No. 18
Version 4.0 (11/2015)
- 34 -
conformity to a given specification, as
TolRW
with Tol being the applicable
tolerance. The tolerance may be specified as “
% xTol
of
R
”, as “ dnTol ”, or the
like.
Conformity may be declared, in consistency with ISO/IEC 17025 under condition that
RTolRWURE
(7.5.3-1)
either for individual values of
R
or for any values within the whole or part of the
weighing range.
Within the same weighing range, conformity may be declared for different parts of the
weighing range, to different values of Tol.
If the user defines a relative weighing accuracy requirement, then Appendix G “Minimum
weight” provides further advice.
8 CALIBRATION CERTIFICATE
This section contains advice regarding what information may usefully be provided in a
calibration certificate. It is intended to be consistent with the requirements of ISO/IEC
17025, which take precedence.
8.1 General information
Identification of the calibration laboratory,
reference to the accreditation (accrediting body, number of the accreditation),
identification of the certificate (calibration number, date of issue, number of pages),
signature(s) of authorised person(s).
Identification of the client.
Identification of the calibrated instrument,
information about the instrument (manufacturer, kind of instrument, Max, d, place of
installation).
Warning that the certificate may be reproduced only in full unless the calibration
laboratory permits otherwise in writing.
8.2 Information about the calibration procedure
Date of measurements,
site of calibration,
conditions of environment and/or use that may affect the results of the calibration.
Information about the instrument (adjustment performed: internal or external
adjustment and in the case of external adjustment what weight has been used, any
anomalies of functions, setting of software as far as relevant for the calibration,
etc.).
Reference to, or description of the applied procedure, as far as this is not obvious
from the certificate, e.g. constant time interval observed between loadings and/or
readings.
Agreements with the client e.g. over limited range of calibration, metrological
specifications to which conformity is declared.
EURAMET Calibration Guide No. 18
Version 4.0 (11/2015)
- 35 -
Information about the traceability of the measuring results.
8.3 Results of measurement
Indications and/or errors for applied test loads, or errors related to indications – as
discrete values and/or by an equation resulting from approximation,
details of the loading procedure if relevant for the understanding of the above,
standard deviation(s) determined as related to a single indication,
information about the eccentricity test if performed,
expanded uncertainty of measurement for the error of indication results.
Indication of the coverage factor
k , with comment on coverage probability, and
reason for
2k where applicable.
Where the indications/errors have not been determined by normal readings - single
readings with the normal resolution of the instrument - a warning should be given
that the reported uncertainty is smaller than would be found with normal readings.
8.4 Additional information
Additional information about the uncertainty of measurement expected in use, inclusive
of conditions under which it is applicable, may be attached to the certificate without
becoming a part of it.
Where errors are to be accounted for by correction, this formula could be used
WURERW
(8.4-1)
accompanied by the equation for
RE
.
Where errors are included in the “global uncertainty”, this formula could be used
WURW
gl
(8.4-2)
A statement should be added that the expanded uncertainty of values from the formula
corresponds to a coverage probability of at least 95 %.
Optional:
Statement of conformity to a given specification, and range of validity where applicable.
This statement may take the form
TolRW (8.4-3)
and may be given
in addition to the results of measurement, or
as stand-alone statement, with reference to the results of measurement declared to
be retained at the calibration laboratory.
The statement may be accompanied by a comment indicating that all measurement
results enlarged by the expanded uncertainty of measurement, are within the
specification limits.
Information about the minimum weight values for various weighing tolerances as per
appendix G may be provided.
For clients that are less knowledgeable, advice might be provided where applicable, on

EURAMET Calibration Guide No. 18
Version 4.0 (11/2015)
- 36 -
the definition of the error of indication,
how to correct readings in use by subtracting the corresponding errors,
how to interpret indications and/or errors presented with fewer digits than the scale
interval
d .
It may be useful to quote the values of
*WU
for either all individual errors or for the
function
RE
resulting from approximation.
9 VALUE OF MASS OR CONVENTIONAL VALUE OF MASS
The quantity
W is an estimate of the conventional value of mass
c
m
of the object
weighed
6
. For certain applications it may be necessary to derive from W the value of
mass
m
, or a more accurate value for
c
m
.
The density
or the volume V of the object, together with an estimate of their standard
uncertainty, must be known from other sources.
9.1 Value of mass
The mass of the object is
ca
111
Wm
(9.1-1)
Neglecting terms of second and higher order, the relative standard uncertainty
mu
rel
is
given by
4
2
2
a
2
c
a
2
2
2
2
rel
11
u
u
W
Wu
mu
(9.1-2)
For
a
and
a
u
(density of air) see Appendix A.
If V and
Vu
are known instead of
and
u
,
may be approximated by
VW
,
and
rel
u
may be replaced by
Vu
rel
.
9.2 Conventional value of mass
The conventional value of mass of the object is
c
0ac
111
Wm
(9.2-1)
Neglecting terms of second and higher order, the relative standard uncertainty
c
mu
rel
is given by
4
2
2
0a
2
c
a
2
2
2
c
2
rel
11
u
u
W
Wu
mu
(9.2-2)
The same comments as given to (9.1-2) apply.
6
In the majority of cases, especially when the results are used for trade, the value Wis used as the result of the weighing
EURAMET Calibration Guide No. 18
Version 4.0 (11/2015)
- 37 -
10 REFERENCES
[1] JCGM 100:2008 (GUM) Evaluation of measurement data — Guide to the expression of
uncertainty in measurement, September 2008
[2] OIML R 76: Non-automatic Weighing Instruments Part 1: Metrological Requirements -
Tests, Edition 2006 (E)
[3] EN 45501: Metrological Aspects of Non-automatic Weighing Instruments, Edition 2015
[4] OIML R111, Weights of Classes E1, E2, F1, F2, M1, M1-2, M2, M2-3, M3, Edition 2004
(E)
[5] JCGM 200:2012 (VIM), International Vocabulary of Metrology – Basic and General
Concepts and Associated Terms, 3
rd
edition with minor corrections, 2012
[6] Comprehensive Mass Metrology, M. Kochsiek, M. Glaser, WILEY-VCH Verlag Berlin
GmbH, Berlin. ISBN 3-527-29614-X
[7] M. Gläser: Change of the apparent mass of weights arising from temperature
differences, Metrologia 36 (1999), p. 183-197
[8] ILAC P10:01/2013, ILAC Policy on the Traceability of Measurement Results, 2013
[9] JCGM 101:2008, Evaluation of Measurement Data – Supplement 1 to the "Guide to the
expression of uncertainty in measurement" – Propagation of Distributions using a Monte
Carlo method, 1
st
edition, 2008
[10] A. Malengo, Buoyancy effects and correlation in calibration and use of electronic
balances, Metrologia 51 (2014) p. 441–451
[11] A. Picard, R. S. Davis, M. Gläser, K. Fujii: Revised formula for the density of moist air
(CIPM-2007), Metrologia 45 (2008), p. 149-155
[12] R. T. Birge, The Calculation of Errors by the Method of Least Squares, Phys. Rev. 40,
207 (1932)
[13] Dictionary of Weighing Terms – A Guide to the Terminology of Weighing, R. Nater, A.
Reichmuth, R. Schwartz, M. Borys and P. Zervos, Springer, Berlin, Heidelberg, 2009.
ISBN 978-3-642-02013-1

EURAMET Calibration Guide No. 18
Version 4.0 (11/2015)
- 38 -
APPENDIX A: ADVICE FOR ESTIMATION OF AIR DENSITY
Note: In Appendix A, the symbols are T for temperature in K, and
t
for temperature in °C
A1 Formulae for the density of air
The most accurate formula to determine the density of moist air is the one
recommended by the CIPM [11]
7
. For the purposes of this guideline, less sophisticated
formulae which render slightly less precise results are sufficient.
A1.1 Simplified version of CIPM-formula, exponential version
From OIML R111 [4], section E3
t,
t,expRH,p,
15273
0610 0090348480
a
(A1.1-1)
with
a
air density in kg/m³
p
barometric pressure in hPa
RH
relative humidity of air in %
t
air temperature in °C
The relative uncertainty of this approximation formula is
aform
/
u
2,4×10
-4
under the
following conditions of environment
600 hPa ≤
p
≤ 1 100 hPa
20 % ≤
RH
≤ 80 %
15 °C ≤
t
≤ 27 °C
Apart from the uncertainty
form
u
, the uncertainties of the estimates for
p
,
RH
and
t
determine the uncertainty of
a
(see section A3).
A1.2 Average air density
Where measurement of temperature and barometric pressure is not possible, the mean
air density at the site can be calculated from the altitude above sea level, as
recommended in [4]
SL
0
0
0a
exp gh
p
(A1.2-1)
with
0
p
= 1 013,25 hPa
0
= 1,200 kg/m³
g
= 9,81 m/s²
SL
h
= altitude above sea level in metre
This calculation for air density is intended for 20 °C and
RH
= 50%.
7
The relative uncertainty of the CIPM-2007 air density formula, without the uncertainties of the parameters is
5
aform
102.2/
u
, the best relative uncertainty achievable, which includes the uncertainty contributions for temperature,
humidity and pressure measurements, is about
5
aa
108/)(
u
.The recommended ranges of temperature and pressure
over which the CIPM-2007 equation may be used are: 600 hPa ≤
p
≤1 100 hPa, 15 ºC ≤
t
≤ 27 ºC.

EURAMET Calibration Guide No. 18
Version 4.0 (11/2015)
- 39 -
The relative uncertainty of this approximation formula is
aform
/
u
1,2 x10
-2
.
A2 Variations of parameters constituting the air density
In order to evaluate the uncertainties associated to the estimates
p
,
RH
and
t
, some
advice about their typical variations are given in the following chapter. This information
may be used when environmental measurements are not going to be performed.
A2.1 Barometric pressure
At any given location, the variation is at most
p
= ±40 hPa about the average
8
. Within
these limits, the distribution is not rectangular as extreme values do occur only once in
several years. It has been found that the distribution is basically normal. Taking into
account the typical atmospheric pressure variation it is realistic to assume a standard
uncertainty
pu
= 10 hPa (A2.1-1)
The average barometric pressure
SL
hp
(in hPa) can be evaluated according to the
International Standard Atmosphere, and may be estimated from the altitude
SL
h
in
metres above sea level of the location, using the relation
)m 00012,0exp(
1
SL0SL
hphp
(A2.1-2)
with
0
p
= 1 013,25 hPa
A2.2 Temperature
The possible variation
minmax
TTT
of the temperature at the place of use of the
instrument may be estimated from information which is easy to obtain
limits stated by the client from his experience,
reading from suitable recording means,
setting of the control instrument, where the room is acclimatized or temperature
stabilized,
in case of default, sound judgement should be applied, leading to – e.g.
17 °C ≤
t
≤ 27 °C for closed office or laboratory rooms with windows,
T
≤ 5 K for closed rooms without windows in the centre of a building,
- 10 °C ≤
t
≤ + 30 °C or
T
≤ 40 K for open workshops or factory spaces.
As stated for the barometric pressure, a rectangular distribution is unlikely to occur for
open workshops or factory spaces where the atmospheric temperature prevails.
However, to avoid different assumptions for different room situations, the assumption of
rectangular distribution is recommended, leading to
12TTu
(A2.2-1)
A2.3 Relative humidity
The possible variation
minmax
RHRHRH
of the relative humidity at the place of use
of the instrument may be estimated from information which is easy to obtain
limits stated by the client from his experience,
8
Example: at Hannover, Germany, the difference between highest and lowest barometric pressures ever observed over 20 years
was 77,1 hPa (Information from DWD, the German Meteorological Service).

EURAMET Calibration Guide No. 18
Version 4.0 (11/2015)
- 40 -
reading from suitable recording means,
setting of the control instrument, where the room is acclimatized,
in case of default, sound judgement should be applied, leading, for example, to
30 % ≤
RH
≤ 80 % for closed office or laboratory rooms with windows,
RH
≤ 30 % for closed rooms without windows in the centre of a building,
20 % ≤
RH
≤ 80 % for open workshops or factory spaces.
It should be kept in mind that
at
RH
< 40 % electrostatic effects may already influence the weighing result on high
resolution instruments,
at
RH
> 60 % corrosion may begin to occur.
As has been said for the barometric pressure, a rectangular distribution is unlikely to
occur for open workshops or factory spaces where the atmospheric relative humidity
prevails. However, to avoid different assumptions for different room situations, the
assumption of rectangular distribution is recommended, leading to
12RHRHu
(A2.3-1)
A3 Uncertainty of air density
The relative standard uncertainty of the air density
aa
/
u
may be calculated by
2
a
aform
2
a
a
2
a
a
2
a
a
a
a
u
RHu
u
Tu
u
pu
u
u
RHT
p
(A3-1)
with the sensitivity coefficients (derived from the CIPM formula for air density)
aa
/u
p
= 1 10
-5
Pa
-1
for barometric pressure
aa
/u
T
= - 4 10
-3
K
-1
for air temperature
aa
/
RH
u
= - 9 10
-3
for relative humidity (the unit for
RH
in this case is 1, not %)
These sensitivity coefficients may also be used for equation (A1.1-1).
Equation (A3-1) can be approximated as (A3-2) based on the following assumptions:
the standard uncertainty for pressure variation based on meteorological data,
that show it is a normal distribution, is 10 hPa
the maximum variation for humidity is 100 %.
the maximum variation of temperature in the location is included as T
2264
a
a
K1033110071 T,,
u
(A3-2)

EURAMET Calibration Guide No. 18
Version 4.0 (11/2015)
- 41 -
Examples of standard uncertainty of air density, calculated for different parameters using
the formula (A.1.1-1)
pu
/hPa
T
/K
RH
/%
pu
u
p
a
a
Tu
u
a
aT
)(
)(
a
a
RHu
u
RH
a
aform
)(
u
a
a
)(
u
10 2 20
1
10
-2
-2,31 10
-3
-5,20 10
-4
2,4×10
-4
1,03
10
-2
10 2 100
1
10
-2
-2,31 10
-3
-2,60 10
-3
2,4×10
-4
1,06
10
-2
10 5 20
1
10
-2
-5,77 10
-3
-5,20 10
-4
2,4×10
-4
1,16
10
-2
10 5 100
1
10
-2
-5,77 10
-3
-2,60 10
-3
2,4×10
-4
1,18
10
-2
10 10 20
1
10
-2
-1,15 10
-3
-5,20 10
-4
2,4×10
-4
1,53
10
-2
10 10 100
1
10
-2
-1,15 10
-3
-2,60 10
-3
2,4×10
-4
1,55
10
-2
10 20 20
1
10
-2
-2,31 10
-2
-5,20 10
-4
2,4×10
-4
2,52
10
-2
10 20 100
1
10
-2
-2,31 10
-2
-2,60 10
-3
2,4×10
-4
2,53
10
-2
10 30 20
1
10
-2
-3,46 10
-2
-5,20 10
-4
2,4×10
-4
3,61
10
-2
10 30 100
1
10
-2
-3,46 10
-2
-2,60 10
-3
2,4×10
-4
3,61
10
-2
10 40 20
1
10
-2
-4,62 10
-2
-5,20 10
-4
2,4×10
-4
4,73
10
-2
10 40 100
1
10
-2
-4,62 10
-2
-2,60 10
-3
2,4×10
-4
4,73
10
-2
10 50 20
1
10
-2
-5,77 10
-2
-5,20 10
-4
2,4×10
-4
5,86
10
-2
10 50 100
1
10
-2
-5,77 10
-2
-2,60 10
-3
2,4×10
-4
5,87
10
-2
T is the maximum variation of temperature and RH is the maximum variation of
humidity in the location of the balance.
APPENDIX B: COVERAGE FACTOR k FOR EXPANDED UNCERTAINTY OF
MEASUREMENT
Note: in this Appendix the general symbol
y
is used for the result of measurement, not a
particular quantity as an indication, an error, a mass of a weighed body etc.
B1 Objective
The coverage factor
k shall in all cases be chosen such that the expanded uncertainty
of measurement has a coverage probability of 95,45 %.
B2 Normal distribution and sufficient reliability
The value
k 2, corresponding to a 95,45% probability, applies where
a) a normal (Gaussian) distribution can be attributed to the error of indication,
and
b) the standard uncertainty
Eu
is of sufficient reliability (i.e. it has a sufficient number
of degrees of freedom), see JCGM 100 [1].
Normal distribution may be assumed where several (i.e. N ≥ 3) uncertainty components,
each derived from “well-behaved” distributions (normal, rectangular or the like),
contribute to
Eu
in comparable amounts.
Sufficient reliability is depending on the degrees of freedom. This criterion is met where
no Type A contribution to
Eu
is based on less than 10 observations. A typical Type A
contribution stems from repeatability. Consequently, if during a repeatability test a load is
applied not less than 10 times, sufficient reliability can be assumed.

EURAMET Calibration Guide No. 18
Version 4.0 (11/2015)
- 42 -
B3 Normal distribution, no sufficient reliability
Where a normal distribution can be attributed to the error of indication, but
Eu
is not
sufficiently reliable, then the effective degrees of freedom
eff
have to be determined
using the Welch-Satterthwaite formula
N
i
i
i
Eu
Eu
1
4
4
eff
)(
)(
(B3-1)
where
Eu
i
are the contributions to the standard uncertainty as per (7.1.3-1a), and
i
is
the degrees of freedom of the standard uncertainty contribution
Eu
i
. Based on
eff
the
applicable coverage factor
k is read from the extended table of [1], Table G.2 or the
underlying t-distribution described in [1], Annex C.3.8 may be used to determine the
coverage factor
k .
B4 Determining k for non-normal distributions
In any of the following cases, the expanded uncertainty is
ykuyU
.
It may be obvious in a given situation that
yu
contains one Type B uncertainty
component
yu
1
from a contribution whose distribution is not normal but, e.g.,
rectangular or triangular, which is significantly greater than all the remaining
components. In such a case,
yu
is split up in the (possibly dominant) part
1
u
and
R
u
=
square root of
2
j
u
with
j
≥ 2, the combined standard uncertainty comprising the
remaining contributions, see [1].
If
R
u
≤ 0,3
1
u
, then
1
u
is considered to be “dominant“ and the distribution of
y
is
considered to be essentially identical with that of the dominant contribution.
The coverage factor is chosen according to the shape of distribution of the dominant
component
for trapezoidal distribution with
95,0
,
(
= edge parameter, ratio of smaller to larger edge of trapezoid)
61105,01
22
k
(B4-1)
for a rectangular distribution (
= 1), k = 1,65,
for a triangular distribution (
= 0), k = 1,90,
for U-shaped distribution,
k = 1,41.
The dominant component may itself be composed of 2 dominant components
yu
1
,
yu
2
, e.g. 2 rectangular making up one trapezoid, in which case
R
u
will be determined
from the remaining
j
u
with
j
3.

EURAMET Calibration Guide No. 18
Version 4.0 (11/2015)
- 43 -
APPENDIX C: FORMULAE TO DESCRIBE ERRORS IN RELATION TO THE INDICATIONS
C1 Objective
This Appendix offers advice on how to derive, from the discrete values obtained at
calibration and/or given in a calibration certificate, errors and associated uncertainties for
any other reading
R
within the calibrated weighing range.
It is assumed that the calibration yields
n
sets of data
j
I
N
,
j
E
,
j
U
, or alternatively
j
m
N
,
j
I
,
j
U
, together with the coverage factor k and an indication of the distribution of
E
underlying
k .
In any case, the nominal indication
j
I
N
is considered to be
jj
mI
NN
.
It is further assumed that for any
j
m
N
the error
j
E
remains the same if
j
I
is replaced by
j
I
N
, it is therefore sufficient to look at the data
j
I
N
,
j
E
,
j
u
, and to omit the suffix N for
simplicity.
C2 Functional relations
C2.1 Interpolation
There are several polynomial formulae for interpolation
9
between tabulated values and
equidistant values which are relatively easy to employ. However, the test loads may not,
in many cases, be equidistant, which leads to quite complicated interpolation formulae if
applying a single formula to cover the whole weighing range.
Linear interpolation between two adjacent points may be performed by
kkkkkk
IIEEIRERE
11
(C2.1-1)
kkkkkk
IIUUIRUREU
11
(C2.1-2)
for a reading
R
with
1
kk
IRI
. A higher order polynomial would be needed to
estimate the possible interpolation error – this is not further elaborated.
C2.2 Approximation
Approximation should be performed by calculation or by algorithms based on the
”minimum
2
” approach, that is, the parameters of a function
f
are determined so that
minimum
2
22
jjjjj
EIfpvp
(C2.2-1)
with
j
p
= weighting factor (basically proportional to
2
1
j
u
),
j
= residual,
f
= approximation function containing
par
n
parameters to be determined,
j = 1…n,
9
An interpolation formula is understood to yield exactly the given values between which interpolation takes place. An approximation
formula will normally not yield the given values exactly.

EURAMET Calibration Guide No. 18
Version 4.0 (11/2015)
- 44 -
n = number of test points.
From the observed chi-squared value
obs
2
, if the following condition is met [12]
obs
2
(C2.2-2a)
with the degrees of freedom
par
nn
, it is justified to assume the form of the model
function
)(IfIE
to be mathematically consistent with the data underlying the
approximation.
An alternative option for testing the goodness of the fit is to assume that the maximum
value of the weighted differences will have to fulfil
1max
j
jj
IfU
EIf
(C2.2-2b)
that is, the expanded uncertainty must include the residual for each point j. This
condition is much more restrictive than equation (C2.2-2a).
C2.2.1 Approximation by polynomials
Approximation by a polynomial yields the general function
a
a
...
2
210
n
n
RaRaRaaRfRE
(C2.2-3)
The degree
a
n
of the polynomial should be chosen such that
21
apar
nnn
.
The calculation is best performed by matrix calculation.
Let
) x (
par
nn
X
be a matrix whose
n
rows are (1,
j
I
,
2
j
I
,...,
a
n
j
I
),
1) x (
par
n
a
be a column vector whose components are the coefficients
0
a
,
1
a
, ... ,
a
n
a
to be determined of the approximation
polynomial,
1 x n
e
be a column vector whose components are the
j
E
,
nn x
eU
be the variance-covariance matrix of
e
.
eU
is given by
modIm UUUeU
Calref
(C2.2-3a)
where
ref
mU
is the covariance matrix associated with the reference values
ref
m
(4.2.4-2). Considering reasonably high correlation among the referencevalues
T
refref
ref mm
m ssU
(C2.2-3b)
where
ref
m
s
is the column vector of the uncertainties
ref
mu
(equ. 7.1.2-14)
,

EURAMET Calibration Guide No. 18
Version 4.0 (11/2015)
- 45 -
Cal
IU
is a diagonal matrix whose elements are
jjj
Iuu
2
,
modU is an additional covariance matrix, which is given by
IU
2
m
smod
(C2.2-3c)
where I is the identity matrix and s
m
is an uncertainty due to the model. This contribution
is considered in order to take into account the model inadequacy.
Initially s
m
is set to zero, if the
2
test (C2.2-2a) fails, s
m
is enlarged in an iterative way,
until the
2
test result is satisfied.
If U(I
Cal
) is the dominant contribution, the covariances maybe be neglected and
eU
can be approximated to a diagonal matrix whose elements are
2
m
2
sEuu
jjj
(C2.2-3d)
The weighting matrix
P
is
1
eUP
(C2.2-4)
and the coefficients
0
a
,
1
a
,… are found by solving the normal equations
0 PeXPXaX
TT
(C2.2-5)
with the solution
PeXPXXa
TT
1
(C2.2-6)
The
n
residuals
jjj
EIfv
are comprised in the vector
eaXv
ˆ
(C2.2-7)
and
2
obs
is obtained by
Pvv
T
2
obs
(C2.2-8)
Provided the condition of (C2.2-2) is met, the variances and covariances for the
coefficients
i
a
are given by the matrix
1
PXXaU
T
ˆ
(C2.2-9)
Where the condition (C2.2-2) is not met, one of these procedures may be applied
a: repeat the approximation with an approximating polynomial of higher
degree
a
n
, as long as
21
a
nn
,
b: repeat the approximation after increasing
modU
.
The results of the approximation,
a
ˆ
and
aU
ˆ
may be used to determine the
approximated errors and the associated uncertainties for the
n points
j
I
.

EURAMET Calibration Guide No. 18
Version 4.0 (11/2015)
- 46 -
The errors
j
E
appr
are comprised in the vector
aXe
ˆ
appr
(C2.2-10)
with the uncertainties given by
T
XaXU
ˆ
Eu
j
diag
appr
2
. (C2.2-11)
They also serve to determine the error and its associated uncertainty for any other
indication – called a reading
R
to discriminate from the indications
j
I
– within the
calibrated weighing range.
Let
r
be a column vector whose elements are
T
a
, 1
32
n
R...,R,R,R,
,
r
be a column vector whose elements are the derivatives
T
1
a
2
a
, 3 2 1 0
n
Rn...,R,R,,
.
The error is
ar
ˆ
RE
T
appr
(C2.2-12)
and the uncertainty is given by
raUrarUar
ˆˆ
R
ˆ
Eu
T
T
TT
appr
2
(C2.2-13)
The first term on the right-hand side simplifies, as all 3 matrices are only one
dimensional, to
RuRan...RaRaa
ˆ
R
ˆ
n
n
2
2
1
a
2
321
T
a
a
32
T
T
arUar
(C2.2-14)
with
2
ecc
2
rel
222
0
2
1212 RRuRsddRu
R
as per (7.1.1-12).
C2.2.2 Approximation by a straight line
Many modern electronic instruments are well designed, and corrected internally to
achieve good linearity. Therefore errors mostly result from incorrect adjustment, and the
error increases in proportion to
R
. For such instruments it may be appropriate to restrict
the polynomial to a linear function, provided it is sufficient in view of condition (C2.2-2).
The standard solution is to apply (C2.2-3) with
1
a
n
RaaRfRE
10
(C2.2-15)
One variation to this is to set
0
0
a
and to determine only
1
a
. This can be justified by
the fact that due to zero-setting – at least for increasing loads – the error
0
RE
is
automatically zero
RaRfRE
1
(C2.2-16)

EURAMET Calibration Guide No. 18
Version 4.0 (11/2015)
- 47 -
Another variation is to define the coefficient
a (=
1
a
in (C2.2-16)) as the mean of all
relative errors
jjj
IEq
. This allows inclusion of errors of net indications after a tare
balancing operation if these have been determined at calibration
nIEa
jj
(C2.2-17)
The calculations, except for the variation (C2.2-17), may be performed using the matrix
formulae in C2.2.1.
Other possibilities are given hereafter.
C2.2.2.1 Linear regression as per (C2.2-15) may be performed by software.
Correspondence between results is typically
”intercept”
0
a
”slope”
1
a
However, simple pocket calculators may not be able to perform linear regression based
on weighted error data, or linear regression with
0
0
a
.
C2.2.2.2 To facilitate programming the calculations by computer in non-matrix notation, the
relevant formulae are presented hereafter.
If condition (C2.2-2a) is intended to be fulfilled, the method starts with the first linear
regression using
jj
Eup
2
1
(C2.2-18a)
If (C2.2-2a) is not yet fulfilled, then the standard deviation of the fit can be determined as
par
2
nn
EIf
std fit
j
jj
(C2.2-18b)
As a second step new weighting factors have to determined as
22
1 std fitEup
jj
(C2.2-18c)
With these new weighting factors a new linear regression has to be determined.
Following this method, the linear regression fulfils condition (C2.2-2a).
If condition (C2.2-2b), which is more restrictive, is intended to be fulfilled, it is very likely
that an additional uncertainty component, s
m
, has to be included in (C2.2-18a. Initially
s
m
is set to zero, then s
m
is enlarged in an iterative way until the condition in (C2.2-2b) is
satisfied. A proposal to increase the step to enlarge s
m
may be to consider 1/10 of the
resolution of the instrument.
In the following expressions for simplicity, all indices ”
j
” have been omitted from
I
,
E
,
p
.
a) linear regression for (C2.2-15)

EURAMET Calibration Guide No. 18
Version 4.0 (11/2015)
- 48 -
2
2
2
0
pIpIp
pIEpIpIpE
a
(C2.2-15a)
2
2
1
pIpIp
pIpEpIEp
a
(C2.2-15b)
2
10
2
EIaap
(C2.2-15c)
2
2
2
0
2
pIpIp
pI
au
(C2.2-15d)
2
2
1
2
pIpIp
p
au
(C2.2-15e)
2
2
10
cov
pIpIp
pI
a,a
(C2.2-15f)
(C2.2-15) applies for the approximated error of the reading
R
, and the uncertainty of the
approximation
appr
Eu
is given by
101
22
0
222
1appr
2
,cov2 aaRauRauRuaEu
(C2.2-15g)
b) linear regression with
0
a
= 0
2
1
pIpIEa
(C2.2-16a)
2
1
2
EIap
(C2.2-16b)
2
1
2
1 pIau
(C2.2-16c)
(C2.2-16) applies for the approximated error of the reading
R
, and the assigned
uncertainty
appr
Eu
is given by
1
2222
1appr
2
auRRuaEu
(C2.2-16d)
c) mean gradients
In this variant the uncertainties are
jjjj
IEuIEu
and
jjj
EuIp
22
.

EURAMET Calibration Guide No. 18
Version 4.0 (11/2015)
- 49 -
pIpEa
(C2.2-17a)
2
2
IEap
(C2.2-17b)
pau 1
2
(C2.2-17c)
(C2.2-17) applies for the approximated error of the reading R which may be also a net
indication, and the uncertainty of the approximation
appr
Eu
is given by
auRRuaEu
2222
appr
2
(C2.2-17d)
C3 Terms without relation to the readings
While terms that are not a function of the indication do not offer any estimated value for
an error to be expected for a given reading in use, they may be helpful to derive the
”global uncertainty” mentioned in 7.5.2.
C3.1 Mean error
The mean of all errors is
n
j
j
E
n
EE
1
0
1
(C3.1-1)
with the standard deviation
appr
1
2
1
1
uEE
n
Es
n
j
j
(C3.1-2)
Note: the data point
0I , 0
E shall be included as
1
I
,
1
E
.
Where
E
is close to zero, only
Es
2
may be added in (7.5.2-2a). In other cases, in
particular where
WuE
, (7.5.2-3a) should be used, with
Wu
increased by
Esu
appr
.
C3.2 Maximum error
The ”maximum error” shall be understood as the largest absolute value of all errors
max
max
j
EE
(C3.2-1)
C3.2.1 With
max
0
EE
, (7.5.2-3a) would certainly describe a ”global uncertainty” which would
cover any error in the weighing range with a higher coverage probability than 95 %. The
advantage is that the formula is simple and straightforward.
C3.2.2 Assuming a rectangular distribution of all errors over the – fictitious! – range
max
E
,
0
E
could be defined as the standard deviation of the errors
3
max
0
EE
(C3.2-2)
to be inserted into (7.5.2-2a).

EURAMET Calibration Guide No. 18
Version 4.0 (11/2015)
- 50 -
APPENDIX D: SYMBOLS
Symbols that are used in more than one section of the main document are listed and explained hereafter.
Symbol
Definition
D
drift, variation of a value with time
E
error (of an indication)
I
indication of an instrument
ref
I
reference value of the indication of an instrument
T
K
sensitivity of the instrument to the temperature variation
L
load on an instrument
Max
maximum weighing capacity
1
Max
upper limit of the weighing range with the smallest scale interval
xMa
upper limit of specified weighing range, MaxxMa
Min
value of the load below which the weighing result may be subject to an
excessive relative error (from [2] and [3])
nMi
lower limit of specified weighing range, MinnMi
R
indication (reading) of an instrument not related to a test load
R
min
minimum weight
R
min,SF
minimum weight for a safety factor >1
Req
user requirement for relative weighing accuracy
T
temperature (in K)
Tol
specified tolerance value
U
expanded uncertainty
U
gl
global expanded uncertainty
W
weighing result, weight in air
d
scale interval, the difference in mass between two consecutive
indications of the indicating device
1
d
smallest scale interval
d
T
effective scale interval < d , used in calibration tests
g
local gravity acceleration
k
coverage factor
k
s
adjustment factor
m
mass of an object
c
m
conventional value of mass, preferably of a standard weight
N
m
nominal value of mass of a standard weight
ref
m
reference weight (“true value“) of a test load
mpe
maximum permissible error (of an indication, a standard weight etc.) in
a given context
n
number of items, as indicated in each case
p
barometric pressure
s
standard deviation
t
temperature (in °C)
u
standard uncertainty

EURAMET Calibration Guide No. 18
Version 4.0 (11/2015)
- 51 -
rel
u
standard uncertainty related to a base quantity
number of degrees of freedom
density
0
reference density of air,
0
= 1,2 kg/m³
a
air density
c
reference density of a standard weight,
c
= 8 000 kg/m³
Suffix related to
B
air buoyancy (at calibration)
D
drift
L
at load
N
nominal value
St
standard (mass)
T
test
adj
adjustment
app
r
approximation
buoy
air buoyancy (weighing result)
cal
calibration
conv
convection
cor
r
correction
dig
digitalisation
ecc eccentric loading
gl
global, overall
i ,
j
numbering
instr weighing instrument
max
maximum value from a given population
mi
n
minimum value from a given population
proc
weighing procedure
ref
reference
rel relative
rep
repeatability
s
actual at time of adjustment
sub
substitution load
tare
tare balancing operation
temp
temperature
time
time
0
zero, no-load

EURAMET Calibration Guide No. 18
Version 4.0 (11/2015)
- 52 -
APPENDIX E: INFORMATION ON AIR BUOYANCY
This Appendix gives additional information to the air buoyancy correction treated in
7.1.2.2.
E1 Density of standard weights
Where the density
of a standard weight, and its standard uncertainty
u
are not
known, the following values may be used for weights of R111 classes E
2
to M
2
(taken
from [4], Table B7).
Alloy/material Assumed density
in kg/m³
Standard
uncertainty
u
in kg/m³
Nickel silver 8 600 85
Brass 8 400 85
stainless steel 7 950 70
carbon steel 7 700 100
iron 7 800 100
cast iron (white) 7 700 200
cast iron (grey) 7 100 300
aluminium 2 700 65
For weights with an adjustment cavity filled with a considerable amount of material of
different density, [4] gives a formula to calculate the overall density of the weight.
E2 Air buoyancy for weights conforming to OIML R111
As quoted in a footnote to 7.1.2.2, OIML R111 requires the density of a standard weight
to be within certain limits that are related to the maximum permissible error
mpe
and a
specified variation of the air density. The
mpe
are proportional to the nominal value for
weights of ≥ 100 g. This allows an estimate of the relative uncertainty
Brel
mu
. The
corresponding formulae (7.1.2-5c) for the case that the instrument is adjusted
immediately before calibration and (7.1.2-5d) for the case when the instrument is not
adjusted before calibration have been evaluated in Table E2.1, in relation to the
accuracy classes E
2
to M
1
.
For weights of
N
m
50 g the
mpe
are tabled in R111, the relative value
N
mmpe
is
increasing with decreasing mass. For these weights, Table E2.1 contains the absolute
standard uncertainties
NB
rel
B
mmumu
.
The values in Table E2.1 can be used for an estimate of the uncertainty contribution if air
buoyancy is not corrected for.
EURAMET Calibration Guide No. 18
Version 4.0 (11/2015)
- 53 -
Table E2.1: Standard uncertainty of air buoyancy correction for standard weights
conforming to R 111
Calculated according to 7.1.2.2 for the case the instrument is adjusted immediately before
calibration (7.1.2-5c), u
A
and the case where the instrument is not adjusted before calibration
(7.1.2-5d), u
B.
Class E
2
Class F
1
Class F
2
Class M
1
N
m
in g
mpe
in mg
A
u
in mg
B
u
in
mg
mpe
in mg
A
u
in mg
B
u
in
mg
mpe
in mg
A
u
in mg
B
u
in
mg
mpe
in mg
A
u
in mg
B
u
in
mg
50
0,100 0,014 0,447 0,30 0,043 0,476 1,00 0,14 0,58 3,0 0,43 0,87
20
0,080 0,012 0,185 0,25 0,036 0,209 0,80 0,12 0,29 2,5 0,36 0,53
10
0,060 0,009 0,095 0,20 0,029 0,115 0,60 0,09 0,17 2,0 0,29 0,38
5
0,050 0,007 0,051 0,16 0,023 0,066 0,50 0,07 0,12 1,6 0,23 0,27
2
0,040 0,006 0,023 0,12 0,017 0,035 0,40 0,06 0,08 1,2 0,17 0,19
1
0,030 0,004 0,013 0,10 0,014 0,023 0,30 0,04 0,05 1,0 0,14 0,15
0,5
0,025 0,004 0,008 0,08 0,012 0,016 0,25 0,04 0,04 0,8 0,12 0,12
0,2
0,020 0,003 0,005 0,06 0,009 0,010 0,20 0,03 0,03 0,6 0,09 0,09
0,1
0,016 0,002 0,003 0,05 0,007 0,008 0,16 0,02 0,02 0,5 0,07 0,07
Relative mpe and relative standard uncertainties
Brel
mu
in mg/kg for weights of 100 g and greater
Class E
2
Class F
1
Class F
2
Class M
1
mpe/
m
N
mg/kg
u
rel A
u
rel B
mpe/
m
N
mg/kg
u
rel A
u
rel
B
mpe/
m
N
mg/kg
u
rel A
u
rel
B
mpe/
m
N
mg/kg
u
rel A
u
rel
B
100
1,60 0,23 8,89 5,00 0,72 9,38 16,0 2,31 11,0 50,0 7,22 15,88
EURAMET Calibration Guide No. 18
Version 4.0 (11/2015)
- 54 -
APPENDIX F: EFFECTS OF CONVECTION
In 4.2.3 the generation of an apparent change of mass
conv
m
by a difference in
temperature
T
between a standard weight and the surrounding air has been explained
in principle. More detailed information is presented hereafter, to allow an assessment of
situations in which the effect of convection should be considered in view of the
uncertainty of calibration.
All calculations of values in the following tables are based on [7]. The relevant formulae,
and parameters to be included, are not reproduced here. Only the main formulae, and
essential conditions are referenced.
The problem treated here is quite complex, both in the underlying physics and in the
evaluation of experimental results. The precision of the values presented hereafter
should not be overestimated.
F1 Relation between temperature and time
An initial temperature difference
0
T
is reduced with time t by heat exchange
between the weight and the surrounding air. The rate of heat exchange is fairly
independent of the sign of
0
T
, therefore warming up or cooling down of a weight
occurs in similar time intervals.
Figure F1.1 gives some examples of the effect of acclimatisation. Starting from an initial
temperature difference of 10 K, the actual
T
after different acclimatisation times is
shown for 4 different weights. The weights are supposed to rest on three fairly thin PVC
columns in “free air”. In comparison,
T
is also shown for a 1 kg weight resting on the
same columns but enclosed in a bell jar which reduces the air flow of convection, so it
takes about 1,5 times to 2 times as much time to achieve the same reduction of
T
, as
for the 1 kg piece without the jar.
References in [7]: formula (21), and parameters for cases 3b and 3c in Table 4.

EURAMET Calibration Guide No. 18
Version 4.0 (11/2015)
- 55 -
Figure F1.1: Acclimatisation of standard weights
Tables F1.2 and F1.3 give acclimatisation times
t
for standard weights that may have
to be waited if the temperature difference is to be reduced from a value
1
T
to a lower
value
2
T
. The conditions of heat exchange are the same as in Figure F1.1: Table F1.2
as for “
m
= 0,1 kg” to “
m
= 50 kg”; Table F1.3 as for “
m
= 1 kg enclosed”.
Under actual conditions the waiting times may be shorter where a weight stands directly
on a plane surface of a heat conducting support; they may be longer where a weight is
partially enclosed in a weight case.
References in [7]: formula (26), and parameters for cases 3b, 3c in Table 4.
Table F1.2 Time intervals for reduction in steps of temperature differences
Weights standing on 3 thin PVC columns in free air
Acclimatisation time in min for
T
to be reached from the next higher
T
, case
3b
K/T
m/kg 20 K to
15 K
15 K to
10 K
10 K to
7 K
7 K to
5 K
5 K to
3 K
3 K to
2 K
2 K to
1 K
50 149,9 225,3 212,4 231,1 347,9 298,0 555,8
20 96,2 144,0 135,2 135,0 219,2 186,6 345,5
10 68,3 101,9 95,3 94,8 153,3 129,9 239,1
5 48,1 71,6 66,7 66,1 106,5 89,7 164,2
2 30,0 44,4 41,2 40,6 65,0 54,4 98,8
1 20,8 30,7 28,3 27,8 44,3 37,0 66,7
0,5 14,3 21,0 19,3 18,9 30,0 24,9 44,7
0,2 8,6 12,6 11,6 11,3 17,8 14,6 26,1
0,1 5,8 8,5 7,8 7,5 11,8 9,7 17,2
0,05 3,9 5,7 5,2 5,0 7,8 6,4 11,3
0,02 2,3 3,3 3,0 2,9 4,5 3,7 6,4
0,01 1,5 2,2 2,0 1,9 2,9 2,4 4,2

EURAMET Calibration Guide No. 18
Version 4.0 (11/2015)
- 56 -
Examples for a 1 kg weight
to reduce
T
from 20 K to 15 Kwill take 20,8 min,
to reduce
T
from 15 K to 10 K will take 30,7 min,
to reduce
T
from 10 K to 5 K will take 28,3 min + 27,8 min = 56,1 min.
Table F1.3 Time intervals for reduction in steps of temperature differences
Weights standing on 3 thin PVC columns, enclosed in a bell jar
Acclimatisation time in min for
T
to be reached from the next higher
T
, case
3c
K/T
m/kg 20 K to
15 K
15 K to
10 K
10 K to
7 K
7 K to
5 K
5 K to
3 K
3 K to
2 K
2 K to
1 K
50 154,2 235,9 226,9 232,1 388,7 342,7 664,1
20 103,8 158,6 152,4 155,6 260,2 228,9 442,2
10 76,8 117,2 112,4 114,7 191,5 168,1 324,0
5 56,7 86,4 82,8 84,3 140,5 123,1 236,5
2 37,8 57,5 54,9 55,8 92,8 81,0 155,0
1 27,7 42,1 40,1 40,7 67,5 58,8 112,0
0,5 20,2 30,7 29,2 29,6 48,9 42,4 80,5
0,2 13,3 20,1 19,1 19,2 31,7 27,3 51,6
0,1 9,6 14,5 13,7 13,8 22,6 19,5 36,6
0,05 6,9 10,4 9,8 9,9 16,1 13,8 25,7
0,02 4,4 6,7 6,3 6,2 10,2 8,6 16,0
0,01 3,2 4,7 4,4 4,4 7,1 6,0 11,1
F2 Change of the apparent mass
The air flow generated by a temperature difference
T
is directed upwards where the
weight is warmer,
0T , than the surrounding air, and downwards where it is cooler
0T . The air flow causes friction forces on the vertical surface of a weight, and
pushing or pulling forces on its horizontal surfaces, resulting in a change
conv
m
of the
apparent mass. The load receptor of the instrument is also contributing to the change, in
a manner not yet fully investigated.
There is evidence from experiments that the absolute values of the change are generally
smaller for
0T than for 0
T . It is therefore reasonable to calculate the mass
changes for the absolute values of
T
, using the parameters for 0T .
Table F2.1 gives values for
conv
m
for standard weights, for the temperature differences
T
appearing in Tables F1.2 and F1.3. They are based on experiments performed on a
mass comparator with turning table for automatic exchange of weights inside a glass
housing. The conditions prevailing at calibration of “normal” weighing instruments being
different, the values in the table should be considered as estimates of the effects that
may be expected at an actual calibration.
References in [7]: formula (34), and parameters for case 3d in Table 4

EURAMET Calibration Guide No. 18
Version 4.0 (11/2015)
- 57 -
Table F2.1 Change in apparent mass
conv
m
Change
conv
m
in mg of standard weights, for selected temperature differences
T
T
in K
m
in
kg
20 15 10 7 5 3 2 1
50 113,23 87,06 60,23 43,65 32,27 20,47 14,30 7,79
20 49,23 38,00 26,43 19,25 14,30 9,14 6,42 3,53
10 26,43 20,47 14,30 10,45 7,79 5,01 3,53 1,96
5 14,30 11,10 7,79 5,72 4,28 2,76 1,96 1,09
2 6,42 5,01 3,53 2,61 1,96 1,27 0,91 0,51
1 3,53 2,76 1,96 1,45 1,09 0,72 0,51 0,29
0,5 1,96 1,54 1,09 0,81 0,61 0,40 0,29 0,17
0,2 0,91 0,72 0,51 0,38 0,29 0,19 0,14 0,08
0,1 0,51 0,40 0,29 0,22 0,17 0,11 0,08 0,05
0,05 0,29 0,23 0,17 0,12 0,09 0,06 0,05 0,03
0,02 0,14 0,11 0,08 0,06 0,05 0,03 0,02 0,01
0,01 0,08 0,06 0,05 0,03 0,03 0,02 0,01 0,01
The values in this table may be compared with the uncertainty of calibration, or with a
given tolerance of the standard weights that are used for a calibration, in order to assess
whether an actual
T
value may produce a significant change of apparent mass.
As an example, Table F2.2 gives the temperature differences which are likely to
produce, for weights conforming to R 111, values of
conv
m
not exceeding certain limits.
The comparison is based on Table F2.1.
The limits considered are the maximum permissible errors, and
31
thereof.
It appears that with these limits, the effect of convection is relevant only for weights of
classes F
1
of OIML R111 or better.
Table F2.2 Temperature limits for specified
conv
m
values
A
T
= temperature difference for
mpem
conv
B
T
= temperature difference for
3
conv
mpem
Differences
A
T
for
mpem
conv
and
B
T
for
3
conv
mpem
Class E
2
Class F
1
N
m
in kg
mpe
in
mg
A
T
in K
B
T
in K
mpe
in
mg
A
T
in K
B
T
in K
50 75 12 4 250 >20 12
20 30 11 3 100 >20 11
10 15 10 3 50 >20 10
5 7,5 10 3 25 >20 10
2 3 9 1 10 >20 9
1 1,5 7 1 5 >20 7
0,5 0,75 6 1 2,5 >20 6
0,2 0,30 5 1 1,0 >20 5
0,1 0,15 4 1 0,50 >20 4
0,05 0,10 6 1 0,30 >20 6
0,02 0,08 10 2 0,25 >20 10
0,01 0,06 15 3 0,20 >20 15

EURAMET Calibration Guide No. 18
Version 4.0 (11/2015)
- 58 -
APPENDIX G: MINIMUM WEIGHT
The minimum weight is the smallest sample quantity required for a weighment to just
achieve a specified relative accuracy of weighing [13].
Consequently, when weighing a quantity representing minimum weight, R
min
, the relative
measurement uncertainty of the weighing result equals the required relative weighing
accuracy, Req, so that
Req
R
RU
min
min
(G-1)
This leads to the following relation that describes minimum weight
Req
RU
R
min
min
(G-2)
It is general practice that users define specific requirements for the performance of an
instrument (User Requirement Specifications). Normally they define upper thresholds for
measurement uncertainty values that are acceptable for a specific weighing application.
Colloquially users refer to weighing process accuracy or weighing tolerance
requirements. Very frequently users also have to follow regulations that stipulate the
adherence to a specific measurement uncertainty requirement. Normally these
requirements are indicated as a relative value, e.g. adherence to a measurement
uncertainty of 0,1 %.
For weighing instruments, usually the global uncertainty is used to assess whether the
instrument fulfils specific user requirements.
The global uncertainty is usually approximated by the linear equation (7.5.2-3e)
RRaRMax
WU
MaxWU
WUWU
glglgl
1
0
0
(G-3)
The relative global uncertainty thus is a hyperbolic function and is defined as
gl
glgl
relgl,
RR
WU
WU
(G-4)
For a given accuracy requirement, Req, only weighings with
ReqWU
relgl,
(G-5)
fulfil the respective user requirement. Consequently only weighings with a reading of
gl
gl
Req
R
(G-6)
have a relative measurement uncertainty smaller than the specific requirement set by
the user and are thus acceptable. The limit value, i.e. the smallest weighing result that
fulfils the user requirement is

EURAMET Calibration Guide No. 18
Version 4.0 (11/2015)
- 59 -
gl
gl
min
Req
R
(G-7)
and is called “minimum weight”. Based on this value the user is able to define
appropriate standard operating procedures that assure that the weighings he performs
on the instrument comply with the minimum weight requirement, i.e. he only weighs
quantities with higher mass than the minimum weight.
As measurement uncertainty in use may be difficult to estimate due to environmental
factors such as high levels of vibration, draughts, influences induced by the operator,
etc., or due to specific influences of the weighing application such as electrostatically
charged samples, magnetic stirrers, etc., a safety factor is usually applied.
The safety factor SF is a number larger than one, by which the user requirement Req is
divided. The objective is to ensure that the relative global measurement uncertainty is
smaller than or equal to the user requirement Req, divided by the safety factor. This
ensures that environmental effects or effects due to the specific weighing application that
have an important effect on the measurement and thus might increase the measurement
uncertainty of a weighing above a level estimated by the global uncertainty, still allow –
with a high degree of insurance – that the user requirement Req is fulfilled.
SF/ReqWU
relgl,
(G-8)
Consequently, the minimum weight based on the safety factor can be calculated as
SFReq
SF
R
gl
gl
SFmin,
(G-9)
The user is responsible for defining the safety factor depending on the degree to which
environmental effects and the specific weighing application could influence the
measurement uncertainty.
Note that the minimum weight refers to the net (sample) weight which is weighed on the
instrument, i.e. the tare vessel mass must not be considered to fulfil the user
requirement Req. Therefore, minimum weight is frequently called "minimum sample
weight".
Figure G.1: Measurement uncertainty
Absolute (green line) and relative (blue line) measurement uncertainty of a weighing
EURAMET Calibration Guide No. 18
Version 4.0 (11/2015)
- 60 -
instrument. The accuracy limit of the instrument, the so-called minimum weight, is the
intersection point between relative measurement uncertainty and the required weighing
accuracy.
APPENDIX H: EXAMPLES
The examples presented in this Appendix demonstrate in different ways how the rules
contained in this guideline may be applied correctly. They are not intended to indicate
any preference for certain procedures as against others for which no example is
presented.
Where a calibration laboratory wishes to proceed in full conformity to one of the
examples, it may make reference to it in its quality manual and in any certificate issued.
Examples H1, H2 and H3 provide a basic approach for the determination of error and
uncertainties in calibration. Example H4 provides a more sophisticated approach.
Note 1: The certificate should contain all the information presented in Hn.1, as far as
known, and, as applicable, at least what is printed in bold figures in Hn.2 and
Hn.3, with Hn = H1, H2…
Note 2: The values in the examples are indicated with more digits that may appear in a
calibration certificate for illustrative purposes.
Note 3: For rectangular distributions infinite degrees of freedom are assumed.
H1 Instrument of 220 g capacity and scale interval 0,1 mg
Preliminary note:
The calibration of a laboratory balance is demonstrated. This example shows the
complete standard procedure for the presentation of measurement results and the
related uncertainties, as executed by most laboratories. An alternative method for the
consideration of air buoyancy effects and convection effects is also presented as option
2 (in italic type).

EURAMET Calibration Guide No. 18
Version 4.0 (11/2015)
- 61 -
First situation: Adjustment of sensitivity carried out independently of calibration
H1.1/AConditions specific for the calibration
Instrument:
Electronic weighing instrument, description and
identification
Maximum Weighing
Capacity
Max/ Scale
interval
d
220 g / 0,1 mg
Temperature coefficient
K
T
= 1,5 x 10
-6
/K (manufacturer’s manual); only
necessary for calculation of the uncertainty of a weighing
result.
Built-in adjustment device
Acts automatically after switching-on the balance and
when
T
≥ 3 K. Only necessary for calculation of
uncertainty of a weighing result. Status: activated
Adjustment by
calibrator
Not adjusted immediately before calibration.
Temperature during
calibration
21 °C measured at the beginning of calibration.
Barometric pressure and
humidity (optional)
990 hPa, 50 % RH.
Room conditions
Maximum temperature deviation 5 K (laboratory room
without windows).If used for calculation of the buoyancy
uncertainty as per formula 7.1.2-5e, it must be presented
in the calibration certificate. Not relevant for the
uncertainty of a weighing result, when built-in adjustment
device is activated (
T
≥ 3 K). In this case the
maximum temperature variation for the estimation of the
uncertainty of a weighing result is 3 K.
Test loads/
acclimatization
Standard weights, class E
2
, acclimatized to room
temperature (in option 2 a temperature difference of 2 K
against room temperature is taken into account).
H1.2/A Tests and results
Repeatability
Requirements given in Chapter
5.1.
Indication at no load reset to
zero where necessary;
indications recorded.
Test load 100 g (applied 5 times)
100,000 6 g
100,000 3 g
100,000 5 g
100,000 4 g
100,000 5 g
Standard deviation
s = 0,00011 g

EURAMET Calibration Guide No. 18
Version 4.0 (11/2015)
- 62 -
Eccentricity
Requirements given in
Chapter 5.3.
Indication set to zero
prior to test; load put
in centre first then
moved to the other
positions.
Position of the load Test load 100 g
Middle 100,000 6 g
Front left 100,000 4 g
Back left 100,000 5 g
Back right 100,000 7 g
Front right 100,000 5 g
Maximum deviation
max
ecci
I
0,000 2 g
Errors of indication:
General prerequisites: Requirements given in Chapter 5.2, weights distributed fairly
evenly over the weighing range.
Test loads each applied once; discontinuous loading only
upwards, indication at no load reset to zero if necessary.
Option 1: Air densities unknown during adjustment and during calibration (i.e. no buoyancy
correction applied to the error of indication values)
Load m
ref
Indication
I Error of indication E
0,0000 g 0,000 0g 0,000 0 g
50,0000 g 50,000 4 g 0,000 4 g
99,9999 g 100,000 6 g 0,000 7 g
149,9999 g 150,000 9 g 0,001 0 g
220,0001 g 220,001 4 g 0,001 3 g
Option 2: Air density ρ
as
unknown during adjustment and air density ρ
acal
during calibration
calculated according to the simplified CIPM formula (A1.1-1)
Measurement values used for calculation:
Barometric pressure p: 990 hPa
Relative humidity RH: 50 %RH
Temperature t: 21 °C
Air density ρ
acal
: 1,173 kg/m³
Calculated buoyancy correction δm
B
according to formula (4.2.4-4).
Numerical value used for calculation:
Density of the reference mass ρ
cal
: (7950 + 70) kg/m³
Buoyancy correction δm
B
: 2,138 x 10
-8
m
ref
The calculated buoyancy correction δm
B
of m
ref
of load L following formula (4.2.4-4) is
negligible as the relative resolution of the instrument is in the order of 10
-6
and thus much
larger than the buoyancy correction. The above table is effectual.
H1.3/A Errors and related uncertainties (budget of related uncertainties)
Conditions common to both options:
- The uncertainty for the zero position only results from the digitalisation d
0
and
repeatability s.

EURAMET Calibration Guide No. 18
Version 4.0 (11/2015)
- 63 -
- The eccentric loading is taken into account for the calibration according to (7.1.1-
10).
- The conventional value of the test weights (class E
2
) is taken into account for the
calibration results. Therefore U(
m
c
) = U/k is calculated following formula (7.1.2-2).
- The drift of the weights has been statistically monitored and the factor k
D
of formula
(7.1.2-11) was chosen as 1,25.
- The degrees of freedom for the calculation of the coverage factor k are derived
following appendix B3 and table G.2 of [1]. In the case of the example, the influence
of the uncertainty of the repeatability test with 5 measurements is significant.
- The information about the relative uncertainty U(E)
rel
= u(E)/L is not mandatory, but
helps to demonstrate the characteristics of the uncertainties.
Uncertainty budget for option 1 (no buoyancy correction applied to the error of indication
values)
Additional condition:
The balance is not adjusted immediately before calibration. The procedure according to
option 1 is applied, with no information about air density. Therefore formula (7.1.2-5d) is
applied for the uncertainty due to air buoyancy. As an alternative in the table, formula
(7.1.2-5e) was used, thereby assuming a temperature variation during use of 5 K.

EURAMET Calibration Guide No. 18
Version 4.0 (11/2015)
- 64 -
Quantity or Influence
Load, indication and error in g
Uncertainties in g
Formula
Loadm
ref
/g
0,000 0 50,000 0 99,999 9 149,999 9 220,000 1
Indication I /g
0,000 0 50,000 4 100,000 6 150,000 9 220,001 4
Error of indication E /g
0,000 0 0,000 4 0,000 7 0,001 0 0,001 3
7.1-1
Repeatability u(δI
rep
)/g
0,000 114
7.1.1-5
Resolution u(δI
dig0
) /g
0,000 029
7.1.1-2a
Resolution u(δI
digL
) /g
0,000 000 0,000 029
7.1.1-3a
Eccentricity u(δI
ecc
)/g
0,000 000 0,000 029 0,000 058 0,000 087 0,000 127 7.1.1-10
Uncertainty of the indication
u(I)
/g
0,000 118 0,000 124 0,000 134 0,000 149 0,000 175 7.1.1-12
Test loads m
c
/g
0,000 0 50,000 0 99,999 9 99,999 9
50,000 0
200,000 1
20,000 0
Conventional mass u(
m
c
)/g
0,000 000 0,000 015 0,000 025 0,000 040 0,000 062
7.1.2-2
Drift u(
m
D
)/g
0,000 000 0,000 022 0,000 036 0,000 058 0,000 089 7.1.2-11
Buoyancy u(
m
B
)/g
0,000 000 0,000 447 0,000 889 0,001 330 0,001 960
7.1.2-5d
/ Table
E2.1
Convection u(
m
conv
)/g
Not relevant in this case (weights are acclimatized). 7.1.2-13
Uncertainty of the reference
mass
u(m
re
f
)/g
0,000 000 0,000 448 0,000 890 0,001 332 0,001 963 7.1.2-14
Standard uncertainty of the
error
u(E) /g
0,000 118 0,000 465 0,000 900 0,001 340 0,001 971 7.1.3-1a
eff
(degrees of freedom)
4 1104 15538 76345 357098 B3-1
k(95,45 %)
2,87 2,00 2,00 2,00 2,00
[1]
U(E) = ku(E)/g
0,000 34 0,000 93 0,001 80 0,002 68 0,003 94
7.3-1
U
rel
(E)/%
----
0,001 86 0,001 80 0,001 79 0,001 79
Alternative: Uncertainty due to buoyancy with formula (7.1.2-5e) instead of (7.1.2-5d), i.e. substituting the
worst case approach with a value derived from the estimated room temperature variations of 5 K during
use.
Buoyancy u(
m
B
)/g
0,000 000 0,000 103 0,000 201 0,000 304 0,000 446 7.1.2-5e
Uncertainty of the reference
mass
u(m
re
f
)/g
0,000 000 0,000 107 0,000 205 0,000 312 0,000 459 7.1.2-14
Standard uncertainty of the
error
u(E) /g
0,000 118 0,000 164 0,000 245 0,000 346 0,000 491 7.1.3-1a
eff
(degrees of freedom)
4 17 85 338 1377 B3-1
k(95,45 %)
2,87 2,16 2,03 2,01 2,00
[1]
U(E) = ku(E)/g
0,000 34 0,000 35 0,000 50 0,000 69 0,000 98
7.3-1
U
rel
(E)/%
----
0,000 70 0,000 50 0,000 46 0,000 45
It is seen in this example that the uncertainty of the reference mass is reduced
significantly if an uncertainty contribution for buoyancy is taken into account that is
based on the estimated room temperature changes during use rather than using the
most conservative approach provided by (7.1.2-5d).
It would be acceptable to state in the certificate only the largest value of expanded
uncertainty for all the reported errors: u(E) = 0,003 94 g (or alternatively 0,000 98 g)
based on k = 2,00 accompanied by the statement that the coverage probability is at
least 95 %.

EURAMET Calibration Guide No. 18
Version 4.0 (11/2015)
- 65 -
The certificate shall give the advice to the user that the expanded uncertainty stated in
the certificate is only applicable, when the error (E) is taken into account.
Uncertainty budget for option 2 (buoyancy correction applied to the error of indication
values)
Additional condition:
The balance is not adjusted immediately before calibration. The procedure according to
option 2 is applied, taking into account the determination of the air density and buoyancy
correction. Therefore, formula (7.1.2-5a) is applied for the uncertainty due to air
buoyancy.
Option 2 above has shown that the buoyancy correction δm
B
is negligible as it is smaller
than the relative resolution of the instrument, but the result of the calculation is
nevertheless shown in the table below. Now, the uncertainty of the buoyancy correction
u(
m
B
) is calculated using formula (7.1.2-5a). Note that the air density during adjustment
(which occurred independently of the calibration) is unknown, so that the variation of air
density over time is taken as an estimate for the uncertainty. Consequently, the
uncertainty of the air density is derived based on assumptions for pressure, temperature
and humidity variations which can occur at the installation site of the instrument.
Appendix A3 provides advice to estimate the uncertainty of the air density. The example
uses the approximation of the uncertainty based on (A3-2) instead of the general
equation (A3-1), i.e. with temperature being the only free parameter.
For a temperature variation of 5 K, the calculation with the approximation formula (A3-2)
leads to a relative uncertainty of u(
a
)/
a
= 1,18 × 10
-2
, which, for an air density at
calibration of ρ
a
= 1,173 kg/m³, leads to an uncertainty u(
a
)= 0,014 kg/m
3
.The same
result can be obtained if the exact formula for the uncertainty of the air density (A3-1) is
taken.
The following numeric values are taken to calculate the relative uncertainty of the
buoyancy correction, using formula (7.1.2-5a):
Air density ρ
aCal
: (1,173 ± 0,014) kg/m³
Density of the reference mass ρ
Cal
:
(7950 ± 70) kg/m
3
Formula (7.1.2-5a) leads to the relative uncertainty of the buoyancy correction of
u
rel
(
m
B
) = 3,203 × 10
-8
The relative uncertainty of the buoyancy correction is negligible as compared to the
other contributions to the uncertainty of the reference mass but the result of the
calculation is nevertheless shown in the table below.
This example has shown that the calculated correction of the error
m
B
and the
calculated relative uncertainty of the buoyancy correction u(
m
B
) are both negligible.
This leads to an updated measurement uncertainty budget.
The uncertainty of convection effects due to non-acclimatized weights u(
m
conv
) for a
temperature difference of 2 K is shown. The rest of the uncertainty contributions are the
same as in the table above and are not repeated in the table below.

EURAMET Calibration Guide No. 18
Version 4.0 (11/2015)
- 66 -
Quantity or Influence
Load, indication and error in g
Uncertainties in g
Formula
Load m
ref
/g
0,000 0 50,000 0 99,999 9 149,999 9 220,000 1
Correction
m
B
/g
0,000 0 0,000 001 0,000 002 0,000 003 0,000 005 4.2.4.3
Indication I /g 0,000 0 50,000 4 100,000 6 150,0009 220,001 4
Error of indication E /g 0,000 0 0,000 4 0,000 7 0,001 0 0,001 3
7.1-1
Buoyancyu(
m
B
)/g
0,000 0 0,00000 2 0,000 003 0,000 005 0,000 007 7.1.2-5a
Convectionu(
m
conv
)/g
0,000 0 0,000 029 0,000 046 0,000 075 0,000 092
7.1.2-13 /
Table
F2.1
Uncertainty of the
reference mass
u(m
ref
)/g
0,000 0 0,000 039 0,000 064 0,000 103 0,000 143 7.1.2-14
Standard uncertainty of
the error
u(E) /g
0,000 118 0,000 130 0,000 149 0,000 181 0,000 226 7.1.3-1a
eff
(degrees of freedom)
4 61125 62 B3-1
k(95,45 %)
2,87 2,52 2,25 2,11 2,05
[1]
U(E) = ku(E)/g
0,000 34 0,000 33 0,000 33 0,000 38 0,000 46
7.3-1
U
rel
(E)/%
----- 0,000 66 0,000 33 0,000 25 0,000 21
It can be seen from this example that the contribution of buoyancy to the standard
uncertainty is significant when the most conservative approach following formula (7.1.2-
5d) is chosen.
If information about the temperature estimated room temperature variations during use is
available and the uncertainty of the air buoyancy is calculated following formula (7.1.2-
5e), the difference in the uncertainty of the error is less significant.
H1.4/A Uncertainty of a weighing result (for option 1)
As stated in 7.4, the following information may be developed by the calibration laboratory
or by the user of the instrument. The results must not be presented as part of the
calibration certificate except for the approximated error of indication and the uncertainty
of the approximated error which can form part of the certificate. Usually the information
on the uncertainty of a weighing result is presented as an appendix to the calibration
certificate or is otherwise shown if its contents are clearly separated from the calibration
results.
Normal conditions of use of the instrument, as assumed, or as specified by the user may
include:
- Built-in adjustment device available and activated (T ≥ 3 K).Variation of room
temperature T = 5 K.
- Tare balancing function operated.
- Loads not always centred carefully.
The uncertainty of a weighing result is derived using a linear approximation of the error
of indication according to (C2.2-16).
The uncertainty of a weighing result is presented for option 1 only (no buoyancy
correction applied to the error of indication values). The approximated error of indication
per (C2.2-16) and the uncertainty of the approximated error of indication per (C2.2-16d)
differ insignificantly between both options as the underlying weighting factors

EURAMET Calibration Guide No. 18
Version 4.0 (11/2015)
- 67 -
jj
Eup
2
1
differ in the order of a few parts per million, and the errors of indication are
the same for both options (buoyancy correction smaller than the resolution of the
instrument).
The designations R and W are introduced to differentiate from the weighing instrument
indication I during calibration.
R: Reading when weighing a load on the calibrated instrument obtained after the
calibration
W: Weighing result
Note that within the following table the reading R and all results are in g.
Quantity or Influence
Reading, weighing result and error in g
Uncertainties in g or as relative value
Formula
Error of Indication
E
appr
(R) for gross or net
readings: Approximation
by a straight line through
zero
RRE
6
appr
10709,6
C2.2-16
Uncertainty of the approximated error of indication
Standard uncertainty of
the error
u(E
app
r
)
212211
appr
2
10543,110501,4 RRuEu
10
C2.2-16d
Standard uncertainty of
the error, neglecting the
offset
REu
6
appr
10242,1
Uncertainties from environmental influences
Temperature drift of
sensitivity
6
temprel
102991
,Ru
7.4.3-1
Buoyancy
6
buoyrel
10636,1
Ru
7.4.3-4
Change in characteristics
due to drift
Not relevant in this case (built-in adjustment activated and
drift between calibrations negligible).
7.4.3-5
Uncertainties from the operation of the instrument
Tare balancing operation
6
Tarerel
100721
,Ru
7.4.4
7.4.4-5
Creep, hysteresis
(loading time)
Not relevant in this case (short loading time). 7.4.4-9a/b
Eccentric loading
6
eccrel
101551
,Ru
7.4.4-10
Uncertainty of a weighing result
Standard uncertainty,
corrections to the
readings
u(E
appr
) to be
applied
21228
10390,8g10467,1 RWu
7.4.5-1a
7.4.5-1b
Standard uncertainty,
corrections to the
readings
u(E
appr
) to be
applied
21228
10390,8g10467,12 RWU
7.5.-2b
Simplified to first order
RWU
64
10796,4g 10422,2
7.5.2-3d
Global uncertainty of a weighing result without correction to the readings
REWUWU
apprgl
RWU
54
gl
10150,1g10422,2
7.5.2-3a
7.5.2-3e
10
The first term is negligible as the uncertainty of the reading u(R) is in the order of some g. Thus the first term is in the order of 10
-7
g
2
while the second term represents values up to 15 g
2
.

EURAMET Calibration Guide No. 18
Version 4.0 (11/2015)
- 68 -
The condition regarding the observed chi-squared value following (C2.2-2a) was
checked with positive result. The first linear regression is taking into account the
weighing factors
j
p
, equation (C2.2-18b).
Based on the global uncertainty, the minimum weight value for the instrument may be
derived as per Appendix G.
Example:
Weighing tolerance requirement: 1 %
Safety factor: 3
The minimum weight according to formula (G-9), using the above equation for the global
uncertainty in results is 0,072 9 g; i.e. the user needs to weigh a net quantity of material
that exceeds 0,072 9 g in order to achieve a relative (global) measurement uncertainty
for a relative weighing tolerance requirement of 1 % and a safety factor of 3 (equals a
relative weighing tolerance of 0,33 %).
Second situation: Adjustment of sensitivity carried out immediately before
calibration
H1.1/B Conditions specific for the calibration
Instrument:
Electronic weighing instrument, description and
identification
Maximum Capacity
L/Scale interval d
220 g / 0,000 1 g
Temperature coefficient
K
T
= 1,5 x 10
-6
/K (manufacturer’s manual) Only
necessary for calculation of the uncertainty of a weighing
result.
Built-in adjustment
device
Acts automatically upon: after switch-on of the balance,
and when
T ≥ 3 K. Only necessary for calculation of
uncertainty of a weighing result.Status: activated.
Adjustment by
calibrator
Adjusted immediately before calibration (built-in
adjustment weights).
Temperature during
calibration
21 °C measured at the beginning of calibration.
Barometric pressure and
humidity (optional)
990 hPa, 50 % RH.
Room conditions
Max. Temperature deviation 5 K (laboratory room without
windows). Not relevant, when built-in adjustment device is
activated (
T ≥ 3 K). In this case the maximum
temperature variation for the estimation of uncertainty of a
weighing result is 3 K.
Test loads /
acclimatization
Standard weights, class E
2
, acclimatized to room
temperature (alternative a temperature difference of 2 K
against room temperature is taken into account).

EURAMET Calibration Guide No. 18
Version 4.0 (11/2015)
- 69 -
H1.2/B Tests and results
Option 1: Air densities unknown during adjustment /calibration (i.e. no buoyancy
correction applied to the error of indication values)
The repeatability test is omitted and the results from the first calibration are taken into
account. Also the eccentricity test was omitted and the results from the first calibration
are taken into account. This can be done as only the sensitivity of the balance was
adjusted and no influence to the repeatability and the eccentricity test can be estimated.
Air density not calculated.
Errors of indication
Requirements given in
Chapter 5.2, weights distributed
fairly evenly
Test loads each applied once; discontinuous loading only
upwards, indication at no load reset to zero where
necessary.
Indications recorded:
Load m
ref
Indication
I Error of indication E
0,000 0 g 0,000 0 g 0,000 0 g
50,000 0 g 50,000 0 g 0,000 0 g
99,999 9 g 99,999 8 g - 0,000 1 g
149,999 9 g 149,999 9 g 0,000 0 g
220,000 1 g 220,000 0 g - 0,000 1 g
Option 2: Air density ρ
as
during adjustment and air density ρ
acal
during calibration are
identical as an adjustment was carried out immediately before calibration.
The air density is calculated according to the simplified CIPM formula (A1.1-1)
Measurement values used for calculation:
Barometric pressure p: 990 hPa
Relative humidity RH: 50 %
Temperature t: 21 °C
Density ρ
s
and ρ
Cal
: (7950 ± 70) kg/m³
Air density ρ
aCal
: 1,173 kg/m³
Calculated buoyancy correction δm
B
according to formula (4.2.4-4).
Numerical value used for calculation:
Density of the reference mass ρ
Cal
: (7950 + 70) kg/m³
Buoyancy correction δm
B
: 2,138 x 10
-8
m
ref
The calculated buoyancy correction δm
B
of m
ref
of Load L following formula (4.2.4-4) is
negligible as the relative resolution of the instrument is in the order of 10
-6
and thus
much larger than the buoyancy correction. The above table is effectual.
H1.3/B Errors and related uncertainties (budget of related uncertainties)
Conditions:
- The uncertainty for the zero position only results in the digitalisation d
0
and
repeatability s.
- The eccentric loading is taken into account for the calibration according to (7.1.1-
10).
- The conventional mass of the test weights (class E
2
) is taken into account for the
calibration results. Therefore U(
m
c
) = U/k is calculated following formula 7.1.2-2.

EURAMET Calibration Guide No. 18
Version 4.0 (11/2015)
- 70 -
- The drift of the weights was statistically monitored and the factor k
D
of formula 7.1.2-
11 was chosen as 1,25.
- The degrees of freedom for the calculation of the coverage factor k are derived
following appendix B3 and table G.2 of [1]. In the case of the example, the influence
of the uncertainty of the repeatability test with 5 measurements is significant.
- The information about the relative uncertainty U(E)
rel
= u(E)/m
ref
is not mandatory,
but helps to demonstrate the characteristics of the uncertainties.
Uncertainty budget for option 1 (no buoyancy correction applied to the error of indication
values)
Additional condition:
The balance is adjusted immediately before the calibration and no information about air
density at the time of calibration is available. Therefore, formula (7.1.2-5c) is relevant.
Quantity or Influence
Load, indication and error in g
Uncertainties in g
Formula
Loadm
ref
/g 0,000 0 50,000 0 99,999 9 149,999 9 220,000 1
Indication I / g
0,000 0 50,000 0 99,999 8 149,999 9 220,000 0
Error of indication E /g 0,000 0 0,000 0 -0,000 1 0,000 0 -0,000 1
7.1-1
Repeatability u(δI
rep
)/g
0,000 114
7.1.1-5
Resolution u(δI
dig0
) /g
0,000 029 7.1.1-2a
Resolution u(δI
digL
) /g
0,000 0 0,000 029 7.1.1-3a
Eccentricity u(δI
ecc
)/g
0,000 0 0,000 029 0,000 058 0,000 087 0,000 127 7.1.1-10
Uncertainty of the
indication
u(I)/g
0,000 118 0,000 124 0,000 134 0,000 149 0,000 175 7.1.1-12
Test loads m
c
/g
0,000 0 50,000 0 99,999 9 99,999 9
50,000 0
200,000 1
20,000 0
Conventional mass
u(
m
c
)/g
0,000 0 0,000 015 0,000 025 0,000 040 0,000 063
7.1.2-2
Drift u(
m
D
)/g
0,000 0 0,000 022 0,000 036 0,000 058 0,000 090 7.1.2-10
Buoyancy u(
m
B
)/g
0,000 000 0,000 014 0,000 022 0,000 036 0,000 055
7.1.2-5c /
Table
E2.1
Convection u(
m
conv
)/g
Not relevant in this case (weights are acclimatized) 7.1.2-13
Uncertainty of the
reference mass
u(m
ref
)/g
0,000 00 0,000 03 0,000 049 0,000 079 0,000 123 7.1.2-14
Standard uncertainty of the
error
u(E) /g
0,000 118 0,000 128 0,000 143 0,000 169 0,000 214 7.1.3-1a
eff
(degrees of freedom)
4 6 9 19 49 B3-1
k(95,45 %)
2,87 2,52 2,32 2,14 2,06
[1]
U(E) = ku(E)/g
0,000 34 0,000 32 0,000 33 0,000 36 0,000 44
7.3-1
U
rel
(E)/%
---- 0,000 64 0,000 33 0,000 24 0,000 20
It would be acceptable to state in the certificate only the largest value of expanded
uncertainty for all the reported errors: U(E)= 0,000 44 g, based on k = 2,06 accompanied
by the statement that the coverage probability is at least 95 %.The certificate shall give
the advice to the user that the expanded uncertainty stated in the certificate is only
applicable, when the Error (E) is taken into account.

EURAMET Calibration Guide No. 18
Version 4.0 (11/2015)
- 71 -
Uncertainty budget for option 2 (buoyancy correction applied to the error of indication
values)
Additional condition:
The balance is adjusted immediately before calibration. The procedure according to
option 2 is applied, taking into account the determination of the air density and buoyancy
correction. Therefore, formula (7.1.2-5a) is applied for the uncertainty due to air
buoyancy.
As an adjustment has been carried out immediately before the calibration, the expected
maximum values for pressure, temperature and humidity variations which can occur at
the installation site of the instrument do not have to be taken into account in contrast to
the scenario where the adjustment has been performed independent of the calibration.
The only contributing factor to the standard uncertainty of the air density originates from
the uncertainty of the measurement of the environmental parameters.
The following numeric values are taken to calculate the relative uncertainty of the
buoyancy correction, using formula (7.1.2-5a):
Air density ρ
aCal
: 1,173 kg/m³
Density of the reference mass ρ
Cal
: (7950 ± 70) kg/m
3
Furthermore, the following uncertainties for temperature, pressure and humidity
measurement are taken for calculating the relative uncertainty of the air density
according to (A3-1):
Tu
= 0,2 K
pu
= 50 Pa
RHu
= 1%
This leads to
a
a
)(
u
= 9,77 × 10
-4
, and
)(
a
u
= 0,00115 kg/m
3
.
Formula (7.1.2-5a) leads to the relative uncertainty of the buoyancy correction of
u(
m
B
) = 3,014 × 10
-8
As an alternative the additional uncertainty of convection effects due to non-acclimatized
weights u(
m
conv
) for a temperature difference of 2 K is shown.

EURAMET Calibration Guide No. 18
Version 4.0 (11/2015)
- 72 -
Quantity or Influence
Load, indication and error in g
Uncertainties in g
Formula
Load m
ref
/g
0,000 0 50,000 0 99,999 9 149,999 9 220,000 1
Correction
m
B
/g
0,000 0 0,000 001 0,000 002 0,000 003 0,000 005 4.2.4-4
Indication I /g
0,000 0 50,000 0 99,999 8 149,999 9 220,000 0
Error of indication E /g
0,000 0 0,000 0 -0,000 1 0,000 0 -0,000 1
Buoyancy u(
m
B
)/g
0,000 0 0,000 001 5 0,000 003 0 0,000 004 5 0,000 006 6 7.1.2-5a
Convection u(
m
conv
)/g
Not relevant in this case (weights are acclimatized).
Uncertainty of the
reference mass
u(m
ref
) /g
0,000 000 0,000 026 0,000 044 0,000 066 0,000 110 7.1.2-14
Standard uncertainty of
the error
u(E) /g
0,000 118 0,000 127 0,000 141 0,000 163 0,000 207 7.1.3-1a
eff
(degrees of freedom)
4 6 9 16 43 B3-1
k(95,45 %)
2,87 2,52 2,32 2,17 2,06
[1]
U(E) = ku(E)/g
0,000 34 0,000 32 0,000 33 0,000 35 0,000 43
7.3-1
U
rel
(E)/ %
---- 0,000 64 0,000 33 0,000 23 0,000 20
Alternative the additional uncertainty of convection effects due to non-acclimatized weights u(
m
conv
) for
a temperature difference of 2 K is shown.
Convection u(
m
conv
)/g
0,000 000 0,000 029 0,000 046 0,000 075 0,000 092 7.1.2-13
Uncertainty of the
reference mass
u(m
ref
) /g
0,000 000 0,000 031 0,000 051 0,000 079 0,000 122 7.1.2-14
Standard uncertainty of
the error
u(E) / g
0,000 118 0,000 128 0,000 144 0,000 168 0,000 214 7.1.3-1a
eff
(degrees of freedom)
4 6 10 19 49 B3-1
k(95,45 %)
2,87 2,52 2,28 2,14 2,06
[1]
U(E) = ku(E)/g
0,000 34 0,000 32 0,000 33 0,000 36 0,000 44
7.3-1
U
rel
(E)/%
---- 0,000 64 0,000 33 0,000 24 0,000 20
The expanded uncertainties of the error using option 1 and using the option 2 are almost
identical as the uncertainty of the reference mass u(m
ref
) is very small as compared to
the uncertainty of the indication u(I). In this example, the determination of pressure and
humidity on site to determine the buoyancy correction and to minimize the uncertainty
contribution due to buoyancy does not significantly improve the results of the calibration.
H1.4/B Uncertainty of a weighing result (for option 1)
As stated in 7.4, the following information may be developed by the calibration laboratory
or by the user of the instrument. The results must not be presented as part of the
calibration certificate except for the approximated error of indication and the uncertainty
of the approximated error which can form part of the certificate. Usually the information
on the uncertainty of a weighing result is presented as an appendix to the calibration
certificate or is otherwise shown if its contents are clearly separated from the calibration
results.
Normal conditions of use of the instrument, as assumed, or as specified by the user may
include:
- Built-in adjustment device available and activated (T ≥ 3 K)
- Variation of room temperature T = 5 K
- Tare balancing function operated

EURAMET Calibration Guide No. 18
Version 4.0 (11/2015)
- 73 -
- Loads not always centred carefully
The uncertainty of a weighing result is derived using a linear approximation of the error
of indication according to (C2.2-16).
The uncertainty of a weighing result is presented for option 1 only (no buoyancy
correction applied to the error of indication values). The approximated error of indication
per (C2.2-16) and the uncertainty of the approximated error of indication per (C2.2-16d)
differ insignificantly between both options as the underlying weighting factors
jj
Eup
2
1
differ in the order of a few per mil, and the errors of indication are the same
for both options (buoyancy correction smaller than the resolution of the instrument).
The designations R and W are introduced to differentiate from the weighing instrument
indication I during calibration.
R: Reading when weighing a load on the calibrated instrument obtained after the
calibration
W: Weighing result
Note that within the following table the reading R and all results are in g.

EURAMET Calibration Guide No. 18
Version 4.0 (11/2015)
- 74 -
Quantity or Influence
Reading, weighing result and error in kg
Uncertainties in g or as relative value
Formula
Error of Indication
E
appr
(R) for gross or net
readings: Approximation
by a straight line through
zero
RRE
7
appr
10895,3
C2.2-16
Uncertainty of the approximated error of indication
Standard uncertainty of
the error
u(E
app
r
)
213213
appr
2
10015,410517,1 RRuEu
11
C2.2-16d
Standard uncertainty of
the error, neglecting the
offset
REu
7
appr
10337,6
Uncertainties from environmental influences
Temperature drift of
sensitivity
6
temprel
102991
,Ru
7.4.3-1
Buoyancy
6
buoyrel
10636,1
Ru
7.4.3-4
Change in characteristics
due to drift
Not relevant in this case (built-in adjustment activated and
drift between calibrations negligible)
7.4.3-5
Uncertainties from the operation of the instrument
Tare balancing operation
7
Tarerel
107745
,Ru
7.4.4-5
Creep, hysteresis
(loading time)
Not relevant in this case (short loading time). 7.4.4-9a/b
Eccentric loading
6
eccrel
101541
,Ru
7.4.4-10
Uncertainty of a weighing result
Standard uncertainty,
corrections to the
readings
u(E
appr
) to be
applied
21228
10433,6g10466,1 RWu
7.4.5-1a
7.4.5-1b
Standard uncertainty,
corrections to the
readings
u(E
appr
) to be
applied
21228
10433,6g10466,12 RWU
7.5.1-2b
Simplified to first order
RWU
64
10090,4g 10422,2
7.5.2-3d
Global uncertainty of a weighing result without correction to the readings
REWUWU
apprgl
RWU
64
gl
10479,4g10422,2
7.5.2-3a
The condition regarding the observed chi-squared value following (C2.2-2a) was
checked with positive result. The first linear regression taking into account the weighing
factors
j
p
, equation (C2.2-18b).
Based on the global uncertainty, the minimum weight value for the instrument may be
derived as per Appendix G.
Example:
Weighing tolerance requirement: 1%
Safety factor: 3
The minimum weight according to formula (G-9), using the above equation for the global
11
The first term is negligible as the uncertainty of the reading u(R) is in the order of some mg. Thus the first term is in the order of
10
-11
mg
2
while the second term represents values up to 10
-7
mg
2
.

EURAMET Calibration Guide No. 18
Version 4.0 (11/2015)
- 75 -
uncertainty results in 0,0727 g; i.e. the user needs to weigh a net quantity of material
that exceeds 0,0727 g in order to achieve a relative (global) measurement uncertainty
for a relative weighing tolerance requirement of 1 % and a safety factor of 3 (equals a
relative weighing tolerance of 0,33%).
H2 Instrument of 60 kg capacity, multi-interval
Preliminary note:
The calibration of a multi-interval balance with scale intervals 2 g / 5 g / 10 g is
demonstrated. This example shows the complete standard procedure for the
presentation of measurement results and the related uncertainties as executed by most
laboratories. An alternative method for the consideration of air buoyancy effects is also
presented as option 2 (in italic type).
First situation: adjustment of sensitivity carried out independently of calibration
H2.1/A Conditions specific for the calibration
Instrument
Electronic non-automatic weighing instrument,
description and identification
Upper limits of the
intervals
Max
i
/Scale
intervals
d
i
12 000 g / 2 g
30 000 g / 5 g
60 000 g / 10 g
Sensitivity of the
instrument to
temperature variation
K
T
= 2×10
-6
/K (manufacturer’s manual); only necessary for
calculation of the uncertainty of a weighing result.
Built-in adjustment
device
Acts automatically after switching on the balance, and
when
T≥ 3 K; only necessary for calculation of
uncertainty of a weighing result. Status: activated.
Adjustment by
calibrator
Not adjusted immediately before calibration.
Temperature during
calibration
21 °C at the beginning of calibration
23 °C at the end of the calibration.
Barometric pressure and
humidity (optional)
990 hPa, 50 % RH.
Room conditions
Maximum temperature variation during use 10 K
(laboratory room with windows). If used for the buoyancy
uncertainty as per formula 7.1.2-5e, it must be presented
in the calibration certificate. Not relevant for the
uncertainty of a weighing result, when built-in adjustment
device is activated (
T≥ 3 K). In this case the maximum
temperature variation for the estimation ofthe uncertainty
of a weighing result is 3 K.
Test loads /
Acclimatization
Standard weights, class F
2
, acclimatized to room
temperature.

EURAMET Calibration Guide No. 18
Version 4.0 (11/2015)
- 76 -
H2.2/A Tests and results
Repeatability
Requirements given in
Chapter 5.1
Indication at no load
reset to zero where
necessary
Repeatability test carried
out in interval 1 and 2
Test load 10 000 g
applied 5 times(standard
deviation assumed
constant over interval 1)
Test load 25 000 g applied
5 times(standard deviation
assumed constant over
interval 2 and 3)
9 998 g 24 995 g
10 000 g 25 000 g
9 998 g 24 995 g
10 000 g 24 995 g
10 000 g 25 000 g
Standard deviation
s = 1,095 g s = 2,739 g
Eccentricity
Requirements given in
Chapter 5.3
Indication set to zero prior to
test; load put in centre first then
moved to the other positions
Position of the load Test load 20 000 g
Centre 19 995 g
Front left 19 995 g
Back left 19 995 g
Back right 19 990 g
Front right 19 990 g
Maximum deviation
max
ecc
i
I
5 g
Errors of indication
General prerequisites: Requirements given in Chapter 5.2, weights distributed
fairly evenly over the weighing range.
Test loads each applied once; discontinuous loading only
upwards, indication at no load reset to zero if necessary.
Option 1: Air density unknown during adjustment and during calibration (i.e. no
buoyancy correction applied to the error of indication values)
Requirements given in
chapter 5.2, weights
distributed fairly evenly.
Test loads each applied
once; discontinuous
loading only upwards;
indication at no load reset
to zero where necessary
Load m
ref
(
m
N
)
Indication
I
Error of
indication
E
0 g 0 g 0 g
10 000 g 10 000 g 0 g
20 000 g 19 995 g -5 g
40 000 g 39 990 g - 10 g
60 000 g 59 990 g - 10 g

EURAMET Calibration Guide No. 18
Version 4.0 (11/2015)
- 77 -
Option 2: Air density ρ
as
during adjustment unknown and air density ρ
aCal
during
calibration calculated according to the simplified CIPM formula (A1.1-1)
Measurement values used for calculation:
Barometric pressure p: 990 hPa
Relative humidity RH: 50 %
Temperature t: 21 °C
Air density ρ
aCal
1,173 kg/m³
Calculated buoyancy correction δm
B
according to formula 4.2.4-4:
Numerical value used for calculation
Density of the reference mass ρ
Cal
: (7950 ± 70) kg/m
3
Buoyancy correction δm
B
: 2,138 × 10
-8
m
N
The calculated correction δm
B
of the loads m
N
following formula 4.2.4-4 is negligible as
the relative resolution of the instrument is in the order of 10
-4
and thus much larger than
the buoyancy correction. The above table is effectual.
H2.3/A Errors and related uncertainties (budget of related uncertainties)
Conditions common to both options:
- The uncertainty of the error at zero only comprises the uncertainty of the no-load
indication (scale interval d
0
= d
1
= 2 g) and the repeatability s. The uncertainty of the
indication at load is not taken into consideration at zero.
- The eccentric loading is taken into account for the calibration according to (7.1.1-
10).
- The error of indication is derived using the nominal weight value as reference value,
therefore the maximum permissible errors of the test weights are taken into account
for deriving the uncertainty contribution due to the reference mass: u(
m
c
)is
calculated as u(
m
c
) = Tol/3 following formula (7.1.2-3).
- The average drift of the weights monitored over 2 recalibrations in two-yearly
intervals was Dmpe/2. Therefore the uncertainty contribution due to the drift of
the weights was set to u(
m
D
) = mpe/23. This corresponds to a k
D
factor of 1,5
(assuming the worst-case scenario of U = mpe / 3).
- The weights are acclimatized with a residual temperature difference of 2 K to the
ambient temperature.
- The degrees of freedom for the calculation of the coverage factor k are derived
following appendix B3 and table G.2 of [1]. In the case of the example, the influence
of the uncertainty of the repeatability test with 5 measurements is significant.
- The information about the relative uncertainty U(E)
rel
= U(E)/m
ref
is not mandatory,
but helps to demonstrate the characteristics of the uncertainties.
Uncertainty budget for option 1 (no buoyancy correction applied to the error of indication
values)
Additional condition:
The balance is not adjusted immediately before calibration. The procedure according to
option 1 is applied, with no information about air density. Therefore formula (7.1.2-5d) is
applied for the uncertainty due to air buoyancy. As an alternative in the table, formula
(7.1.2-5e) was used, thereby assuming a temperature variation during use of 10 K.

EURAMET Calibration Guide No. 18
Version 4.0 (11/2015)
- 78 -
Quantity or Influence
Load, indication and error in g
Uncertainties in g
Formula
Load m
ref
(m
N
) /g
0 10 000 20 000 40 000 60 000
Indication I /g
0 10 000 19 995 39 990 59 990
Error of Indication E /g
0 0 - 5 - 10 - 10
7.1-1
Repeatability u(
I
rep
) /g
1,095 2,739
7.1.1-5
Resolution u(
I
dig0
) /g
0,577 7.1.1-2a
Resolution u(
I
digL
) /g
0,000 0,577 1,443 2,887 2,887 7.1.1-3a
Eccentricity u(
I
ecc
) /g
0,000 0,722 1,443 2,887 4,330 7.1.1-10
Uncertainty of the
indication
u(I) /g
1,238 1,545 3,464 4,950 5,909 7.1.1-12
Test loads m
N
/g
0 10 000 20 000 20 000
20 000
20 000
20 000
20 000
Weights u(
m
c
) /g
0,000 0,092
0,173 0,346 0,554
7.1.2-3
Drift u(
m
D
) / g
0,000 0,046 0,087 0,173 0,277 7.1.2-11
Buoyancy u(
m
B
) /g
0,000 0,110 0,217 0,433 0,658
7.1.2-5d
/ Table
E2.1
Convection u(
m
conv
) /g
Not relevant in this case (only relevant for F
1
and
better).
7.1.2-13
Uncertainty of the reference
mass
u(m
re
f
) /g
0,000 0,151 0,290 0,581 0,904 7.1.2-14
Standard uncertainty of the
error
u(E) /g
1,238 1,552 3,476 4,984 5,978 7.1.3-1a
eff
(degrees of freedom)
616104390 B3-1
k(95,45 %)
2,52 2,17 2,28 2,06 2,05
[1]
U(E) = ku(E)/g
3,120 3,369 7,926 10,266 12,254
7.3-1
U
rel
(E)/%
----
0,0337 % 0,0396 % 0,0257 % 0,0204 %
Alternative: Uncertainty due to buoyancy with formula (7.1.2-5e) instead of (7.1.2-5d), i.e.
substituting the worst case approach with a value derived from the estimated room
temperature variations of 10 K during use.
Buoyancy u(
m
B
) /g
0,000 0,046 0,089 0,178 0,276 7.1.2-5e
Uncertainty of the reference
mass
u(
m
re
f
) /g
0,000 0,113 0,213 0,462 0,678 7.1.2-14
Standard uncertainty of the
error
u(E) /g
1,238 1,549 3,471 4,968 5,948 7.1.3-1a
eff
(degrees of freedom)
616104388 B3-1
k(95,45 %)
2,52 2,17 2,28 2,06 2,05
[1]
U(E) = ku(E)/g
3,120 3,362 7,913 10,234 12,193
7.3-1
U
rel
(E)/%
---- 0,0336 0,0396 0,0256 0,0203
It is seen in this example that the uncertainty of the reference mass is reduced
significantly if an uncertainty contribution for buoyancy is taken into account that is
based on the estimated room temperature changes during use rather than using the
most conservative approach provided by (7.1.2-5d). However, as the uncertainty of the
reference mass is very small compared to the uncertainty of the indication, the standard
uncertainty of the error is almost not affected.
It would be acceptable to state in the certificate only the largest value of the expanded
uncertainty for all the reported errors: U(E)= 12,254 g, based on k = 2,05 accompanied
by the statement that the coverage probability is at least 95 %.
The certificate shall give the advice to the user that the expanded uncertainty stated in

EURAMET Calibration Guide No. 18
Version 4.0 (11/2015)
- 79 -
the certificate is only applicable, when the Error (E) is taken into account.
Uncertainty budget for option 2 (buoyancy correction applied to the error of indication
values)
Additional condition:
The balance is not adjusted immediately before calibration. The procedure according to
option 2 is applied, taking into account the determination of the air density and buoyancy
correction. Therefore, formula (7.1.2-5a) is applied for the uncertainty due to air
buoyancy.
Note that the air density during adjustment (which occurred independent of the
calibration) is unknown, so that the variation of air density over time is taken as an
estimate for the uncertainty. Consequently, the uncertainty of the air density is derived
based on assumptions for pressure, temperature and humidity variations which can
occur at the installation site of the instrument.
Appendix A3 provides advice to estimate the uncertainty of the air density. The example
uses the approximation of the uncertainty based on (A3-2) instead of the general
equation (A3-1), i.e. with temperature being the only free parameter.
For a temperature variation of 10 K, the calculation with the approximation formula (A3-
2) leads to a relative uncertainty of u(
a
)/
a
= 1,55
10
-2
, which, for an air density at
calibration of ρ
a
= 1,173 kg/m³, leads to an uncertainty u(
a
) = 0,018 kg/m
3
.
The following numeric values are taken to calculate the relative uncertainty of the
buoyancy correction, using formula (7.1.2-5a):
Air density ρ
aCal
: (1,173 ± 0,018) kg/m³
Density of the reference mass ρ
Cal
: (7950 ± 70) kg/m
3
Formula (7.1.2-5a) leads to the relative uncertainty of the buoyancy correction of
u
rel
(
m
B
) = 3,334 × 10
-8
The relative uncertainty of the buoyancy correction is negligible as compared to the
other contributions to the uncertainty of the reference mass.
This example has shown that the calculated correction of the error δm
B
and the
calculated relative uncertainty of the buoyancy correction u
rel
(
m
B
) are both negligible.
This leads to an updated measurement uncertainty budget:

EURAMET Calibration Guide No. 18
Version 4.0 (11/2015)
- 80 -
Quantity or Influence
Load, indication and error in g
Uncertainties in g
Formula
Load m
ref
(m
N
)/g
0 10 000 20 000 40 000 60 000
Correction
m
B
/g
00000
4.2.4-4
Indication I /g
0 10000 19 995 39 990 59 990
Error of Indication E/g
0 0 - 5 - 10 - 10
7.1-1
Repeatability u(
I
rep
) /g
1,095 2,739
7.1.1-5
Resolution u(
I
dig0
) /g
0,577 7.1.1-2a
Resolution u(
I
digL
) /g
0,000 0,577 1,443 2,887 2,887 7.1.1-3a
Eccentricityu(
I
ecc
) /g
0,000 0,722 1,443 2,887 4,330 7.1.1-10
Uncertainty of the
indication
u(I) /g
1,238 1,545 3,464 4,950 5,909 7.1.1-12
Test loadsm
N
/g
0 10 000 20 000 20 000
20 000
20 000
20 000
20 000
Weightsu(
m
c
) /g
0,000 0,092 0,173 0,346 0,554
7.1.2-3
Driftu(
m
D
)/ g
0,000 0,046 0,087 0,173 0,277 7.1.2-11
Buoyancyu(
m
B
) /g
0,000 0,000 0,001 0,001 0,002 7.1.2-5a
Convectionu(
m
conv
) /g
Not relevant in this case (only relevant for F
1
and
better).
7.1.2-13
Uncertainty of the reference
mass
u(m
re
f
)/g
0,000 0,103 0,194 0,387 0,620 7.1.2-14
Standard uncertainty of the
error
u(E) /g
1,238 1,549 3,470 4,965 5,941 7.1.3-1a
eff
(degrees of freedom)
615104388 B3-1
k(95,45 %)
2,52 2,17 2,28 2,06 2,05
[1]
U(E) = ku(E)/g
3,120 3,360 7,910 10,228 12,180
7.3-1
U
rel
(E)/%
----
0,0360 0,0396 0,0256 0,0203
It can be seen from this example that the contribution of buoyancy to the standard
uncertainty is insignificant. Furthermore, the standard uncertainties of the error using
option 1 and option 2 are almost identical as the uncertainty of the reference mass
u(m
ref
) is very small as compared to the uncertainty of the indication u(I). The
determination of pressure and humidity on site in addition to the temperature
measurement to correct for buoyancy and to minimize the associated uncertainty
contribution does not significantly improve the results of the calibration.
H2.4/A Uncertainty of a weighing result (for option 1)
As stated in 7.4, the following information may be developed by the calibration laboratory
or by the user of the instrument. The results must not be presented as part of the
calibration certificate except for the approximated error of indication and the uncertainty
of the approximated error which can form part of the certificate. Usually the information
on the uncertainty of a weighing result is presented as an appendix to the calibration
certificate or is otherwise shown if its contents are clearly separated from the calibration
results.
Normal conditions of use of the instrument, as assumed, or as specified by the user may
include:
- Built-in adjustment device available and activated (T ≥ 3 K)
- Variation of room temperature T = 10 K
- Tare balancing function operated

EURAMET Calibration Guide No. 18
Version 4.0 (11/2015)
- 81 -
- Loads not always centred carefully
The uncertainty of a weighing result is derived using a linear approximation of the error
of indication according to (C2.2-16).
The uncertainty of a weighing result is presented for option 1 only (no buoyancy
correction applied to the error of indication values). The approximated error of indication
per (C2.2-16) and the uncertainty of the approximated error of indication per (C2.2-16d)
differ insignificantly between both options as the underlying weighting factors
jj
Eup
2
1
differ in the order of a few per mil, and the errors of indication are the same
for both options (buoyancy correction smaller than the resolution of the instrument).
Buoyancy according to chapter 7.4.3.2 is not taken into account as the estimation of the
uncertainty at calibration has shown that this influence is negligible.
The designations R and W are introduced to differentiate from the weighing instrument
indication I during calibration.
R: Reading when weighing a load on the calibrated instrument obtained after the
calibration
W: Weighing result
Note that within the following table the reading R and all results are in g.

EURAMET Calibration Guide No. 18
Version 4.0 (11/2015)
- 82 -
Quantity or Influence
Reading, weighing result and error in g
Uncertainties in g or as relative value
Formula
Error of Indication
E
appr
(R) for gross or net
readings: Approximation
by a straight line through
zero
R,R
4
appr
107171E
C2.2-16
Uncertainty of the approximated error of indication
Standard uncertainty of
the error
u(E
app
r
)
2928
appr
2
10172,4)(10950,2 RRuEu
12
C2.2-16d
Standard uncertainty of
the error, neglecting the
intercept
R,Eu
5
appr
104596
Uncertainties from environmental influences
Temperature drift of
sensitivity
6
temprel
107321
,Ru
7.4.3-1
Buoyancy Not relevant in this case. 7.4.3-2
Change in characteristics
due to drift
Not relevant in this case (built-in adjustment activated and
drift between calibrations negligible)
7.4.3-5
Uncertainties from the operation of the instrument
Tare balancing operation
4
Tarerel
104441
,Ru
7.4.4-5
Creep, hysteresis
(loading time)
Not relevant in this case (short loading time). 7.4.4-9a/b
Eccentric loading
4
eccrel
104431
,Ru
7.4.4-10
Uncertainty of a weighing result, for partial weighing intervals (PWI)
Standard uncertainty,
corrections to the
readings
u(E
appr
) to be
applied
PWI 1
282
10589,4g867,1 RWu
7.4.5-1b
PWI 2
282
10589,4g917,9 RWu
PWI 3
282
10589,4g167,16 RWu
Expanded uncertainty,
corrections to the
readings
E
appr
to be
applied
PWI 1
282
10589,4g867,12 RWU
7.5.1-2b
PWI 2
282
10589,4g917,92 RWU
PWI 3
282
10589,4g167,162 RWU
Simplified to first order
PWI 1
R,,WU
4
105742g 3732
7.5.2-3f
PWI 2
g 01200104343g 01910
4
R,,)W(U
PWI 3
g 30000109233g 13120
4
R,,WU
Global uncertainty of a weighing result without correction to the readings
REWUWU
apprgl
PWI 1
R,,WU
4
gl
102914g 3732
7.5.2-3a
PWI 2
g 12000101515g 01910
4
gl
R,,WU
PWI 3
g 03000106415g 13120
4
gl
R,,WU
The condition regarding the observed chi-squared value following (C2.2-2a) was
checked with positive result. The linear regression was performed taking into account
the weighing factors
j
p
of equation (C2.2-18b).
12
The first term is negligible as the uncertainty of the reading u(R) is in the order of some g. Thus the first term is in the order of 10
-7
g
2
while the second term represents values up to 15 g
2
.

EURAMET Calibration Guide No. 18
Version 4.0 (11/2015)
- 83 -
Based on the global uncertainty, the minimum weight value for the instrument may be
derived as per Appendix G.
Example:
Weighing tolerance requirement: 1 %
Safety factor: 2
The minimum weight according to formula G-9, using the above equation for the global
uncertainty in PWI 1 results in 598 g; i.e. the user needs to weigh a net quantity of
material that exceeds 598 g in order to achieve a relative (global) measurement
uncertainty for a relative weighing tolerance requirement of 1% and a safety factor of 2
(equals a relative weighing tolerance of 0,5%).
Second situation: adjustment of sensitivity carried out immediately before calibration
H2.1/B Conditions specific for the calibration
Instrument
Electronic non-automatic weighing instrument,
description and identification
Upper limits of the
intervals
Max
i
/Scale
intervals
d
i
12 000 g / 2 g
30 000 g / 5 g
60 000 g / 10 g
Sensitivity of the
instrument to
temperature variation
K
T
= 2×10
-6
/K (manufacturer’s manual); only necessary for
calculation of uncertainty of a weighing result.
Built-in adjustment
device
Acts automatically after switching on the balance, and
when
T≥ 3 K; only necessary for calculation of the
uncertainty of a weighing result. Status: activated.
Adjustment by
calibrator
Adjusted immediately before calibration (built-in
adjustment weights).
Temperature during
calibration
23 °C at the beginning of calibration
24 °C at the end of the calibration
Barometric pressure and
humidity (optional)
990 hPa, 50 % RH.
Room conditions
Maximum temperature variation during use 10 K (room
without windows).Not relevant, when built-in adjustment
device is activated (
T ≥ 3 K). In this case the maximum
temperature variation for the estimation of uncertainty of a
weighing result is 3 K.
Test loads /
acclimatization
Standard weights, class F
2
, acclimatized to room
temperature.

EURAMET Calibration Guide No. 18
Version 4.0 (11/2015)
- 84 -
H2.2/B Tests and results
Repeatability
Requirements given in
Chapter 5.1
Indication at no load
reset to zero where
necessary
Repeatability test carried
out in interval 1 and 2
Test load 10 000 g
applied 5 times (standard
deviation assumed
constant over interval 1)
Test load 25 000 g applied
5 times (standard deviation
assumed constant over
interval 2 and 3)
10 000 g 25 000 g
10 000 g 25 000 g
9 998 g 25000g
10 000 g 24995g
10 000 g 25 000 g
Standard deviation
s = 0,894 g s = 2,236 g
Eccentricity
Requirements given in
Chapter 5.3
Indication set to zero prior to
test; load put in centre first then
moved to the other positions
Position of the load Test load 20 000 g
Centre 20 000g
Front left 20 000g
Back left 20 000g
Back right 20 000g
Front right 19 995g
Maximum deviation
max
ecc
i
I
5 g
Errors of indication
General prerequisites:
Requirements given in Chapter 5.2, weights distributed fairly
evenly over the weighing range.
Test loads each applied once; discontinuous loading only
upwards, indication at no load reset to zero if necessary.
Option 1: Air density unknown during adjustment / calibration (i.e. no buoyancy
correction applied to the error of indication values).
Requirements given in
chapter 5.2, weights
distributed fairly evenly.
Test loads each applied
once; discontinuous
loading only upwards;
indication at no load reset
to zero where necessary
Load
m
ref
(m
N
)
Indication
I
Error of
indication
E
0 g 0 g 0 g
10 000 g 10 000 g 0 g
20 000 g 20 000 g 0 g
40 000 g 40 000 g 0 g
60 000 g 60 000 g 0 g

EURAMET Calibration Guide No. 18
Version 4.0 (11/2015)
- 85 -
Option 2: Air density ρ
as
during adjustment and air density ρ
aCal
during calibration are
identical as an adjustment was carried out immediately before calibration
The air density is calculated according to the simplified CIPM formula (A1.1-1):
Measurement values used for calculation:
Barometric pressure p: 990 hPa
Relative humidity RH: 50 %
Temperature t: 23 °C
Air density ρ
aCal
: 1,165 kg/m³
Calculated buoyancy correction
m
B
according to formula (4.2.4-4):
Numerical value used for calculation
Density of the reference mass ρ
Cal
: (7950 ± 70) kg/m
3
Buoyancy correction
m
B
: 2,762 × 10
-8
m
N
The calculated correction
m
B
of the loads m
N
following formula (4.2.4-4) is negligible as
the relative resolution of the instrument is in the order of 10
-4
and thus much larger than
the buoyancy correction. The above table is effectual.
H2.3/B Errors and related uncertainties (budget of related uncertainties)
Conditions common to both options:
-
The uncertainty of the error at zero only comprises the uncertainty of the no-load
indication (scale interval d
0
= d
1
= 2 g) and the repeatability s. The uncertainty of the
indication at load is not taken into consideration at zero.
- The eccentric loading is taken into account for the calibration according to (7.1.1-
10).
- The error of indication is derived using the nominal weight value as reference value,
therefore the maximum permissible errors of the test weights are taken into account
for deriving the uncertainty contribution due to the reference mass: u(
m
c
)is
calculated as u(
m
c
) = Tol/3 following formula (7.1.2-3).
- The average drift of the weights monitored over 2 recalibrations in two-yearly
intervals was Dmpe/2. Therefore the uncertainty contribution due to the drift of
the weights was set to u(
m
D
) = mpe/23. This corresponds to a k
D
factor of 1.5
(assuming the worst-case scenario of U = mpe / 3).
- The weights are acclimatized with a residual temperature difference of 2 K to the
ambient temperature.
- The degrees of freedom for the calculation of the coverage factor k are derived
following appendix B3 and table G.2 of [1]. In the case of the example, the influence
of the uncertainty of the repeatability test with 5 measurements is significant.
- The information about the relative uncertainty U(E)
rel
= U(E)/m
ref
is not mandatory,
but helps to demonstrate the characteristics of the uncertainties.
Uncertainty budget for option 1 (no buoyancy correction applied to the error of indication
values)
Additional condition:
The balance is adjusted immediately before calibration. The procedure according to
option 1 is applied, with no information about air density. Therefore, formula (7.1.2-5c) is
applied for the uncertainty due to air buoyancy.

EURAMET Calibration Guide No. 18
Version 4.0 (11/2015)
- 86 -
Quantity or Influence
Load, indication and error in g
Uncertainties in g
Formula
Load m
ref
(m
N
) /g
0 10 000 20 000 40 000 60 000
Indication I /g
0 10 000 20 000 40 000 60 000
Error of Indication E /g
0 0000
7.1-1
Repeatability u(
I
rep
) /g
0,894 2,236
7.1.1-5
Resolution u(
I
dig0
) /g
0,577 7.1.1-2a
Resolution u(
I
digL
) /g
0,000 0,577 1,443 2,887 2,887 7.1.1-3a
Eccentricity u(
I
ecc
) /g
0,000 0,722 1,443 2,887 4,330 7.1.1-10
Uncertainty of the
indication
u(I) /g
1,065 1,410 3,082 4,690 5,694 7.1.1-12
Test loads m
N
/g
0 10 000 20 000 20 000
20 000
20 000
20 000
20 000
Weights u(
m
c
) /g
0,000 0,092 0,173 0,346 0,554
7.1.2-3
Drift u(
m
D
) /g
0,000 0,046 0,087 0,173 0,277 7.1.2-11
Buoyancy u(
m
B
) /g
0,000 0,023 0,043 0,087 0,139 7.1.2-5c
Convection u(
m
conv
) /g
Not relevant in this case (only relevant for F
1
and
better).
7.1.2-13
Uncertainty of the reference
mass
u(m
re
f
) /g
0,000 0,106 0,198 0,397 0,635 7.1.2-14
Standard uncertainty of the
error
u(E) /g
1,065 1,414 3,089 4,707 5,739 7.1.3-1a
eff
(degrees of freedom)
8251478172 B3-1
k(95,45 %)
2,37 2,11 2,20 2,05 2,025
[1],
U(E) = ku(E)/g
2,523 2,983 6,795 9,650 11,601
7.3-1
U
rel
(E)/%
----
0,0298 0,0340 0,0241 0,0193
It would be acceptable to state in the certificate only the largest value of the expanded
uncertainty for all the reported errors: U(E) = 11,601 g, based on k = 2,025 accompanied
by the statement that the coverage probability is at least 95%.
The certificate shall give the advice to the user that the expanded uncertainty stated in
the certificate is only applicable, when the Error (E) is taken into account.
Uncertainty budget for option 2 (buoyancy correction applied to the error of indication
values)
Additional condition:
The balance is adjusted immediately before calibration. The procedure according to
option 2 is applied, taking into account the determination of the air density and buoyancy
correction. Therefore formula (7.1.2-5a) is applied for the uncertainty due to air
buoyancy.
As an adjustment has been carried out immediately before the calibration, the expected
maximum values for pressure, temperature and humidity variations which can occur at
the installation site of the instrument do not have to be taken into account – in contrast to
the scenario where the adjustment has been performed independent of the calibration.
The only contributing factor to the standard uncertainty of the air density originates from
the uncertainty of the measurement of the environmental parameters.
The following numeric values are taken to calculate the relative uncertainty of the
buoyancy correction, using formula (7.1.2-5a):
Air density ρ
aCal
: 1,165 kg/m³

EURAMET Calibration Guide No. 18
Version 4.0 (11/2015)
- 87 -
Density of the reference mass ρ
Cal
: (7950 ± 70) kg/m
3
Furthermore, the following uncertainties for temperature, pressure and humidity
measurement are taken for calculating the relative uncertainty of the air density
according to (A3-1):
Tu
= 0,2 K
pu
= 50 Pa
RHu
= 1%
This leads to
a
a
)(
u
= 9,77 × 10
-4
, and
)(
a
u
= 0,00114 kg/m
3
.
Formula (7.1.2-5a) leads to the relative uncertainty of the buoyancy correction of
u
rel
(
m
B
) = 3,892 × 10
-8
.
The relative uncertainty of the buoyancy correction is negligible as compared to the
other contributions to the uncertainty of the reference mass.
This example has shown that the calculated correction of the error
m
B
and the
calculated relative uncertainty of the buoyancy correction u
rel
(
m
B
) are both negligible.
This leads to an updated measurement uncertainty budget:

EURAMET Calibration Guide No. 18
Version 4.0 (11/2015)
- 88 -
Quantity or Influence
Load, indication and error in g
Uncertainties in g
Formula
Load m
ref
(m
N
)/g
0 10 000 20 000 40 000 60 000
Correction
m
B
/g
00000
4.2.4-4
Indication I /g
0 10 000 20 000 40 000 60 000
Error of Indication E/g
00000
7.1-1
Repeatability u(
I
rep
)/g
0,894 2,236
7.1.1-5
Resolution u(
I
dig0
) /g
0,577 7.1.1-2a
Resolution u(
I
digL
) /g
0,000 0,577 1,443 2,887 2,887 7.1.1-3a
Eccentricityu(
I
ecc
) /g
0,000 0,722 1,443 2,887 4,330 7.1.1-10
Uncertainty of the
indication
u(I) /g
1,065 1,410 3,082 4,690 5,694 7.1.1-12
Test loadsm
N
/g
0 10 000 20 000 20 000
20 000
20 000
20 000
20 000
Weightsu(
m
c
) /g
0,000 0,092 0,173 0,346 0,554
7.1.2-3
Driftu(
m
D
)/g
0,000 0,046 0,087 0,173 0,277 7.1.2-11
Buoyancyu(
m
B
) /g
0,000 0,000 0,001 0,001 0,002 7.1.2-5c
Convectionu(
m
conv
) /g
Not relevant in this case (only relevant for F
1
and
better).
7.1.2-13
Uncertainty of the reference
mass
u(m
re
f
)/g
0,000 0,103 0,194 0,387 0,620 7.1.2-14
Standard uncertainty of the
error
u(E) /g
1,065 1,414 3,089 4,706 5,727 7.1.3-1a
eff
(degrees of freedom)
8 25 14 78 172 B3-1
k(95,45 %)
2,37 2,11 2,20 2,05 2,025
[1]
U(E) = ku(E)/g
2,523 2,983 6,794 9,648 11,598
7.3-1
U
rel
(E)/%
----
0,0301 0,0340 0,0241 0,0193
The expanded uncertainties of the error using the standard procedure and using the
option are almost identical as the uncertainty of the reference mass u(m
ref
) is very small
as compared to the uncertainty of the indication u(I). In this example, the determination
of pressure and humidity on site to determine the buoyancy correction and to minimize
the uncertainty contribution due to buoyancy does not significantly improve the results of
the calibration.
H2.4/B Uncertainty of a weighing result (for option 1)
As stated in 7.4, the following information may be developed by the calibration laboratory
or by the user of the instrument. The results must not be presented as part of the
calibration certificate except for the approximated error of indication and the uncertainty
of the approximated error which can form part of the certificate. Usually the information
on the uncertainty of a weighing result is presented as an appendix to the calibration
certificate or is otherwise shown if its contents are clearly separated from the calibration
results.
Normal conditions of use of the instrument, as assumed, or as specified by the user may
include:
- Built-in adjustment device available and activated (T ≥ 3 K)
- Variation of room temperature T = 10 K
- Tare balancing function operated
- Loads not always centred carefully
The uncertainty of a weighing result is derived using a linear approximation of the error

EURAMET Calibration Guide No. 18
Version 4.0 (11/2015)
- 89 -
of indication according to (C2.2-16).
The uncertainty of a weighing result is presented for option 1 only (no buoyancy
correction applied to the error of indication values). The approximated error of indication
per (C2.2-16) and the uncertainty of the approximated error of indication per (C2.2-16d)
differ insignificantly between both options as the underlying weighting factors
jj
Eup
2
1
differ in the order of a few per mil, and the errors of indication are the same
for both options (buoyancy correction smaller than the resolution of the instrument).
The designations R and W are introduced to differentiate from the weighing instrument
indication I during calibration.
R: Reading when weighing a load on the calibrated instrument obtained after the
calibration
W: Weighing result
Note that within the following table the reading R and all results are in g.

EURAMET Calibration Guide No. 18
Version 4.0 (11/2015)
- 90 -
Quantity or Influence
Reading, weighing result and error in kg
Uncertainties in g or as relative value
Formula
Error of Indication
E
appr
(R) for gross or net
readings: Approximation
by a straight line through
zero
0
appr
RE
C2.2-16
Uncertainty of the approximated error of indication
Standard uncertainty of
the error
u(E
app
r
)
292
appr
2
10651,3)(0 RRuEu
C2.2-16d
Standard uncertainty of
the error, neglecting the
offset
REu
5
appr
10043,6
Uncertainties from environmental influences
Temperature drift of
sensitivity
6
temprel
107321
,Ru
7.4.3-1
Buoyancy Not relevant in this case. 7.4.3-2
Change in adjustment
due to drift
Not relevant in this case (built-in adjustment activated and
drift between calibrations negligible)
7.4.3-5
Uncertainties from the operation of the instrument
Tare balancing operation
0
Tarerel
Ru
7.4.4-5
Creep, hysteresis
(loading time)
Not relevant in this case (short loading time). 7.4.4-9a/b
Eccentric loading
4
eccrel
104431
,Ru
7.4.4-10
Uncertainty of a weighing result, for partial weighing intervals (PWI)
Standard uncertainty,
corrections to the
readings
E
appr
to be
applied
PWI 1
282
10449,2g467,1 RWu
7.4.5-1b
PWI 2
282
10449,2g417,7 RWu
PWI 3
282
10449,2g667,13 RWu
Expanded uncertainty,
corrections to the
readings
E
app
to be
applied
PWI 1
282
10449,2g467,12 RWU
7.5.1-2b
PWI 2
282
10449,2g417,72 RWU
PWI 3
282
10449,2g667,132 RWU
Simplified to first order
PWI 1
R,,WU
4
107061g 2422
7.5.2-3f
PWI 2
g 01200103552g 6616
4
R,,WU
PWI 3
g 03000107442g 19511
4
R,,WU
Global uncertainty of a weighing result without correction to the readings
REWUWU
apprgl
PWI 1
R,,U
4
gl
107061g 2422W
7.5.2-3a
PWI 2
g 12000103552g 6616
4
gl
R,,WU
PWI 3
g 03000107442g 51911
4
gl
R,,WU
The condition regarding the observed chi-squared value following (C2.2-2a) was
checked with positive result. The linear regression was performed taking into account
the weighing factors
j
p
of equation (C2.2-18b).
Based on the global uncertainty, the minimum weight value for the instrument may be
derived as per Appendix G.

EURAMET Calibration Guide No. 18
Version 4.0 (11/2015)
- 91 -
Example:
Weighing tolerance requirement: 1 %
Safety factor: 2
The minimum weight according to formula G-9, using the above equation for the global
uncertainty in PWI 1 results in 502 g; i.e. the user needs to weigh a net quantity of
material that exceeds 502 g in order to achieve a relative (global) measurement
uncertainty for a relative weighing tolerance requirement of 1% and a safety factor of 2
(equals a relative weighing tolerance of 0,5%).
H3 Instrument of 30 000 kg capacity, scale interval 10 kg
Preliminary note:
The calibration of a weighbridge for road vehicles is demonstrated. This example shows
the complete standard procedure for the presentation of measurement results and the
related uncertainties as executed by most laboratories.
Test loads should preferably consist only of standard weights that are traceable to the SI
unit of mass.
This example shows the use of standard weights and substitution loads. The instrument
under calibration is used as comparator to adjust the substitution load so that it brings
about approximately the same indication as the corresponding load made up of standard
weights.

EURAMET Calibration Guide No. 18
Version 4.0 (11/2015)
- 92 -
First situation: adjustment of sensitivity carried out independent of calibration
(Instrument status: as it was found)
H3.1/A Conditions specific for the calibration
Instrument: Electronic non-automatic weighing instrument, description
and identification, with OIML R76 certificate of conformity or
EN 45501 type approval but not verified
Maximum weighing capacity Max
/ scale interval
d
30 000 kg / 10 kg
Load receptor
3 m wide, 10 m long, 4 points of support
Installation
Outside, in plain air, under shadow
Temperature coefficient
K
T
= 2 × 10
-6
/K (manufacturer’s manual); only necessary for
calculation of uncertainty of a weighing result.
Built-in adjustment device
Not provided.
Adjustment by calibrator
Not adjusted immediately before calibration.
Scale interval for testing
Higher resolution (service mode),
d
T
= 1 kg
Duration of tests
From 9h to 13h (this information could be useful in relation with
possible effects of creep and hysteresis)
Temperature during calibration
17°C at the beginning of the calibration
20°C at the end of the calibration
Barometric pressure and
environmental conditions during
calibration (optional)
1 010 hPa ± 5 hPa ; no rain, no wind
Test loads Standard weights:
10 parallelepiped standard weights, cast iron, 1 000 kg
each, certified to class M
1
tolerance of mpe = 50 g
(OIML R111 [4])
Substitution loads made up of steel or cast iron:
2 steel containers filled with loose steel or cast iron,
each weighing ≈ 2 000 kg;
2 steel containers filled with loose steel or cast iron,
each weighing ≈ 3 000 kg;
trailer to support the standard weights or the steel
containers, weight adjusted to ≈ 10 000 kg;
small metallic pieces, used to adjust the substitution
loads.
Lifting and manoeuvring means for standard weights and
substitution loads:
forklift, weight ≈ 4500 kg, capacity 6 000 kg to move
standard weights and substitution loads;
vehicle with trailer and crane, lifting capacity 10 000 kg,
to transport and to move standard weights and
substitution loads.

EURAMET Calibration Guide No. 18
Version 4.0 (11/2015)
- 93 -
H3.2/A Tests and results
Repeatability
Requirements given in
Chapter 5.1
Indication at no load reset
to zero where necessary
After unloading, no-load
indications were between 0
and 2 kg
Test load ≈ 10 420 kg:
Fork lift with 2 steel
containers, moved on
alternating from either long
end of load receptor, load
centred by eyesight
Test load ≈ 24 160 kg:
Loaded vehicle moved on
alternating from either long end
of load receptor, load centred by
eyesight (alternatively or
additionally performed)
10 405 kg
24 145 kg
10 414 kg
24 160 kg
10 418 kg
24 172 kg
10 412 kg
24 152 kg
10 418 kg
24 156 kg
10 425 kg
24 159 kg
Standard deviation
s = 6,74 kg s = 9,03 kg
Eccentricity
Requirements given in Chapter 5.3
Indication set to zero prior to test;
load put in centre first then moved to
the other positions
Position of the load Test load ≈ 10 420 kg:
Fork lift with 2 steel
containers
Centre 10 420 kg
Front left 10 407 kg
Back left 10 435 kg
Back right 10 433 kg
Front right 10 413 kg
Maximum difference between
center indication and the off-
center indications (in the four
corners)
max
ecci
I
15 kg
Eccentricity (alternatively or
additionally performed with rolling
loads)
Requirements given in Chapter 5.3
Indication set to zero prior to test
and prior the change of direction;
Position of the load Test load ≈ 24 160 kg:
heaviest and most
concentrated available
vehicle
Left 24 160 kg
Centre 24 157 kg
Right 24 181 kg
(change direction)
Right
24 177 kg
Centre 24 157 kg
Left 24 162 kg
Maximum difference between
center indication and the two
off-center indications (along the
longitudinal axis)
max
ecci
I
24 kg

EURAMET Calibration Guide No. 18
Version 4.0 (11/2015)
- 94 -
Errors of indication
Standard Procedure: Requirements given in chapter 5.2, weights distributed fairly
evenly.
Test loads built up by substitution, with 10 000 kg standard weights (10 weights × 1 000
kg) and 2 substitution loads L
sub1
and L
sub2
of approximately 10 000 kg each (the trailer
and the sum of 4 containers). Test loads applied once; continuous loading only upwards.
This may include creep and hysteresis effects in the results, but reduces the amount of
loads to be moved on and off the load receptor.
Indications after removal of standard weights recorded but no correction applied; all
loads arranged reasonably around centre of load receptor.
Indications recorded:
Air density ρ
as
during adjustment is unknown and air density ρ
aCal
is unknown.
No buoyancy correction is applied to the error of indication values. Using standard
weights class M
1
the relative uncertainty for buoyancy effect is calculated according to
(7.1.2-5d) is 1,6×10
-5
(since the instrument is not adjusted immediately before
calibration). The uncertainty is small enough, so a more elaborate calculation of this
uncertainty component based on actual data for air density is superfluous (the
uncertainty of buoyancy is smaller than the scale interval of the high resolution mode d
T
and is negligible).
The limit of density for class M
1
standard weights is established to be ρ ≥ 4 400 kg m
-3
[4]. This limit may be considered also for the substitution loads. In this case, the relative
uncertainty estimated for the buoyancy effect of the substitution loads is the same as
above (for standard weights) and is small enough; a more elaborate calculation of this
uncertainty component based on actual data is superfluous.
Note: In the estimation of density for substitution loads, it is necessary to take
into account any internal cavities, which are not open to the atmosphere (for
LOAD
Standard weights
m
N
Substitution
loads L
sub
Total test load
L
T
= m
N
+L
sub
Indication I
Error of
indication E
0 kg 0 kg 0 kg 0 kg 0 kg
5 000 kg
½ m
re
f
0 kg 5 000 kg
5 002 kg
I(½ m
re
f
)
2 kg
10 000 kg
m
ref
0 kg 10 000 kg
10 010 kg
I(m
re
f
)
10 kg
0 kg
10 000 kg
L
sub1
10 000 kg
10 010 kg
I(L
sub1
)
10 kg
5 000 kg
½ m
re
f
10 000 kg
L
sub1
15 000 kg
15 015 kg
I(½ m
ref
+L
sub1
)
15 kg
10 000 kg
m
re
f
10 000 kg
L
sub1
20 000 kg
20 018 kg
I(m
ref
+L
sub1
)
18 kg
0 kg
20 010 kg
L
sub1
+L
sub2
20 010 kg
20 028 kg
I(L
sub1
+L
sub2
)
18 kg
5 000 kg
½ m
re
f
20 010 kg
L
sub1
+L
sub2
25 010 kg
25 035 kg
I(½ m
ref
+L
sub1
+L
sub2
)
25 kg
10 000 kg
m
re
f
20 010 kg
L
sub1
+L
sub2
30 010 kg
30 040 kg
I(m
ref
+L
sub1
+L
sub2
)
30 kg
0 kg 0 kg 0 kg 4 kg
4 kg
E
0
EURAMET Calibration Guide No. 18
Version 4.0 (11/2015)
- 95 -
example at tanks, reservoirs). It is necessary to estimate the density of such a load
as a whole, not to suppose that it has the same density as the material from which
it is built.
H3.3/A Errors and related uncertainties (budget of related uncertainties)
Conditions:
- The uncertainty of the error at zero only comprises the uncertainty of the no-load
indication (scale interval d = 1 kg) and the repeatability s. The uncertainty of the
indication at load is not taken into consideration at zero
- The eccentric loading is taken into account for the calibration according to (7.1.1-10)
because it cannot be excluded during the error of indication test. If both eccentricity
tests were performed, then the result with the largest relative value should be used.
- The error of indication is derived using the nominal weight value as reference value,
therefore the maximum permissible errors of the test weights are taken into account
for deriving the uncertainty contribution due to the reference mass: u(
m
c
) is
calculated as u(
m
c
) = mpe/3 following formula (7.1.2-3). For each standard weight
of 1000 kg u(
m
c
) =50/3 29 g.
- In the absence of information on drift, the value of D is chosen D = mpe. For each
standard weight of 1000 kg mpe = ± 50 gand u(
m
c
) =50/3 29 g, following
formula (7.1.2-11).
- The instrument is not adjusted immediately before calibration. The standard
procedure is applied, with no information about air density. Therefore, formula
(7.1.2-5d) is applied for the uncertainty due to air buoyancy.
- The load remains on the load receptor for a significant period of time during the
calibration. Based on chapter 7.1.1 that states that additional uncertainty
contributions might have to be taken into account, the creep and hysteresis effects
in the results are calculated following formula (7.4.4-7) and included in the
uncertainty of the indication.
- The weights are acclimatized with a residual temperature difference of 5 K to the
ambient temperature. The effects of convection are not relevant (usually they are
only relevant for weights of class F
1
or better).
- The degrees of freedom for the calculation of the coverage factor k are derived
following appendix B3 and table G.2 of [1]. In the case of the example, the influence
of the uncertainty of the repeatability test with 6 measurements is significant.
- The information about the relative uncertainty U(E)
rel
= U(E)/m
ref
is not mandatory,
but helps to demonstrate the characteristics of the uncertainties.

EURAMET Calibration Guide No. 18
Version 4.0 (11/2015)
- 96 -
Quantity or Influence Load, indication, error and uncertainties in kg Formula
Total test load
L
T
= m
N
+L
sub
j
/kg
0 5 000 10 000
m
re
f
10 000*
)
L
sub
1
15 000
Indication I /kg
0 5 002 10 010
I (m
re
f
)
10 010
I (L
sub1
)
15 015
Error of Indication E /kg
0210
10
I
1
= 0
15
7.1-1
Repeatability u(
I
rep
) /kg
6,74 7.1.1-5
Resolution u(
I
dig0
) /kg
0,29 7.1.1-2a
Resolution u(
I
digL
) /kg
0,00 0,29 7.1.1-3a
Eccentricity u(
I
ecc
) /kg
0,00 2,08 4,16 4,16 6,24 7.1.1-10
Creep / hysteresis u
rel
(
I
time
)
/kg
0,00 0,38 0,77 0,77 1,16 7.4.4-7
Uncertainty of the indication
u(I)
/kg
6,75 7,08 7,97 7,97 9,27 7.1.1-12
Standard weights m
N
/kg
0 5 000 10 000
0
5 000
Uncertainty u(
m
c
) /kg
0,00 0,14
0,29 0,00 0,14
7.1.2-3
Drift u(
m
D
) /kg
0,00 0,14 0,29 0,00 0,14 7.1.2-11
Buoyancy u(
m
B
) /kg
0,00 0,08 0,16 0,00 0,08 7.1.2-5d
Convection u(
m
conv
) /kg
Not relevant in this case 7.1.2-13
Uncertainty of the reference
mass
u(m
re
f
) /kg
0,00 0,22 0,44 0,00 0,22 7.1.2-14
Substitution loads L
subj
/kg
000
10 000
L
sub1
=
m
re
f
+I
1
10 000
L
sub1
Uncertainty u(L
subj
)/kg
0,00 0,00 0,00 11,28 11,28 7.1.2-15b
Buoyancy u(
m
B
) /kg
0,00 0,00 0,00 0,16 0,16 7.1.2-5d
Convection u(
m
conv
) /kg
Not relevant in this case
Uncertainty of substitution
loads
u(L
sub
j
) /kg
0,00 0,00 0,00 11,28 11,28 7.1.2-15b
7.1.2-14
Standard uncertainty of the
error
u(E) /kg
6,75 7,08 7,98 -------- 14,60 7.1.3-1c
eff
(degrees of freedom)
5 6 9 -------- 109 B3-1
k(95,45 %)
2,65 2,52 2,32
--------
2,02
[1]
U(E) = ku(E)/kg
18 18 19
--------
29
7.3-1
U
rel
(E) /%
---- 0,36 0,19 -------- 0,20

EURAMET Calibration Guide No. 18
Version 4.0 (11/2015)
- 97 -
(continue)
Quantity or Influence Load, indication, error and uncertainties in kg Formula
Total test load
L
T
= m
N
+L
sub
j
/kg
20 000
m
ref2
+L
sub2
20 010*
)
25 010 30 010
Indication I /kg
20 018
I
(m
ref2
+L
sub2
)
20 028
I(L
sub1
+L
sub2
)
25 035 30 040
Error of Indication E /kg
18
18
I
2
=10
25 30
7.1-1
Repeatability u(
I
rep
) /kg
6,74 7.1.1-5
Resolution u(
I
dig0
) /kg
0,29 7.1.1-2a
Resolution u(
I
digL
) /kg
0,29 7.1.1-3a
Eccentricity u(
I
ecc
) /kg
8,32 8,32 10,40 12,48 7.1.1-10
Creep / hysteresis u
rel
(
I
time
)
/kg
1,54 1,54 1,93 2,31 7.4.4-7
Uncertainty of the indication
u(I)
/kg
10,82 10,82 12,54 14,38 7.1.1-12
Standard weights m
N
/kg
10 000
0
5 000 10 000
Uncertainty u(
m
c
) /kg
0,29 0,00 0,14 0,29
7.1.2-3
Drift u(
m
D
) /kg
0,29 0,00 0,14 0,29 7.1.2-11
Buoyancy u(
m
B
) /kg
0,16 0,00 0,08 0,16 7.1.2-5d
Convection u(
m
conv
) /kg
Not relevant in this case 7.1.2-13
Uncertainty of the reference
mass
u(m
re
f
) /kg
0,44 0,00 0,22 0,44 7.1.2-14
Substitution loads L
subj
/kg
10 000
L
sub1
20 010
L
sub1
+L
sub2
=
2m
ref1
+I
2
20 010
L
sub1
+L
sub2
20 010
L
sub1
+L
sub2
Uncertainty u(L
subj
)/kg
11,28 19,02 19,02 19,02 7.1.2-15b
Buoyancy u(
m
B
) /kg
0,16 0,32 0,32 0,32 7.1.2-5d
Convection u(
m
conv
) /kg
Not relevant in this case
Uncertainty of substitution
loads
u(L
sub
j
) /kg
11,28 19,02 19,02 19,02 7.1.2-15b
7.1.2-14
Standard uncertainty of the
error
u(E) /kg
15,64 -------- 22,79 23,85 7.1.3-1c
eff
(degrees of freedom)
144 -------- 653 783 B3-1
k(95,45 %)
2,02
--------
2,00 2,00
[1]
U(E) = ku(E)/kg
32
--------
46 48
7.3-1
U
rel
(E) /%
0,16 -------- 0,18 0,16
*
)
The values written in this column (for the same total load value as in previous column, after
substitution of standard weights with substitution loads) are not reported in the calibration
certificate, but are used in next columns. In order to remember this, the bold font is not used in
this column and the final 5 cells are empty.
It would be acceptable to state in the certificate only the largest value of the expanded
uncertainty for all the reported errors: U(E) = 48 kg, based on k = 2 accompanied by the
statement that the coverage probability is at least 95 %.
The certificate shall give the advice to the user that the expanded uncertainty stated in
the certificate is only applicable, when the Error (E) is taken into account.
EURAMET Calibration Guide No. 18
Version 4.0 (11/2015)
- 98 -
H3.4/A Uncertainty of a weighing result
As stated in 7.4, the following information may be developed by the calibration laboratory
or by the user of the instrument. The results must not be presented as part of the
calibration certificate, except for the approximated error of indication and the uncertainty
of the approximated error which can form part of the certificate. Usually the information
on the uncertainty of a weighing result is presented as an appendix to the calibration
certificate or is otherwise shown if its contents are clearly separated from the calibration
results.
The normal conditions of use of the instrument, as assumed, or as specified by the user
may include:
Variation of temperature T =40 K
Loads not always centred carefully
Tare balancing function operated
Loading times: normal, that is shorter than at calibration
Readings in normal resolution, d = 10 kg
The error of indication at 30 000 kg is 30 kg, and this value is taken for the change in
adjustment due to drift.
The designations R and W are introduced to differentiate from the weighing instrument
indication I during calibration.
R: Reading when weighing a load on the calibrated instrument obtained after the
calibration
W: Weighing result
Note that within the following table the reading R and all results are in kg.

EURAMET Calibration Guide No. 18
Version 4.0 (11/2015)
- 99 -
Quantity or Influence
Reading, weighing result and error in kg
Uncertainties in g or as relative value
Formula
Error of Indication
RE
appr
for gross or net
readings: Approximation
by a straight line through
zero
RRE
4
appr
10379.9
C2.2-16
Uncertainty of the approximated error of indication
Standard uncertainty of
the error
appr
Eu
2727
appr
10316,1)(10797,8 RRuEu
C2.2-16d
Standard uncertainty of
the error, neglecting the
offset
REu
4
appr
10627,3
Uncertainties from environmental influences
Temperature drift of
sensitivity
5
6
temprel
10309,2
12
40102
Ru
7.4.3-1
Buoyancy
Not relevant in this case. 7.4.3-3
Change in adjustment
due to drift (change of
E(Max) over 1 year =
30 kg)
4
adjrel
10774,533000030
Ru
7.4.3-6
Uncertainties from the operation of the instrument
Tare balancing operation
4
Tarerel
10457,3
Ru
7.4.4-5
Creep, hysteresis
(loading time)
Not relevant in this case (short loading time).
7.4.4-7
Eccentric loading
4
eccrel
10311,8
Ru
7.4.4-10
Uncertainty of a weighing result
Standard uncertainty,
corrections to the
readings
E
appr
to be
applied
262
10276,1kg 133,62 RWu
7.4.5-1a
7.4.5-1b
Expanded uncertainty,
corrections to the
readings
E
appr
to be
applied
262
10276,1kg 133,622 RWU
7.5.1-2b
Simplified to first order
RWU
3
1079,1kg 16
7.5.2-3d
Global uncertainty of a weighing result without correction to the readings
REWUWU
apprgl
RWU
3
gl
1073,2kg 61
7.5.2-3a
The condition regarding the observed chi-squared value following (C2.2-2a) was
checked with positive result. The first linear regression taking into account the weighing
factors
j
p
, equation (C2.2-18b).
Based on the global uncertainty, the minimum weight value for the instrument may be
derived as per Appendix G.
Example:
Weighing tolerance requirement: 1 %
Safety factor: 1
EURAMET Calibration Guide No. 18
Version 4.0 (11/2015)
- 100 -
The minimum weight according to formula (G-9), using the above equation for the global
uncertainty results in 2 169 kg; i.e. the user needs to weigh a net quantity of material that
exceeds 2 169 kg in order to achieve a relative (global) measurement uncertainty for a
relative weighing tolerance requirement of 1 % and a safety factor of 1.
If a safety factor is included, it might be chosen to be 2. Because of the large global
uncertainty, a higher safety factor might not be able to be realised.
The minimum weight according to formula (G-9), using the above equation for the global
uncertainty results in 6 950 kg; i.e. the user needs to weigh a net quantity of material that
exceeds 6 950 kg in order to achieve a relative (global) measurement uncertainty for a
relative weighing tolerance requirement of 1 % and a safety factor of 2 (equals a relative
weighing tolerance of 0,50 %).

EURAMET Calibration Guide No. 18
Version 4.0 (11/2015)
- 101 -
Second situation:adjustment of sensitivity carried out immediately before calibration
(Previously, repair and maintenance operations were performed on the instrument)
H3.1/B Conditions specific for the calibration
Instrument: Electronic non-automatic weighing instrument, description
and identification, with OIML R76 certificate of conformity or
EN 45501 type approval but not verified
Maximum weighing capacity Max /
scale interval
d
30 000 kg / 10 kg
Load receptor
3 m wide, 10 m long, 4 points of support
Installation
Outside, in plain air, under shadow
Temperature coefficient
K
T
= 2 × 10
-6
/K (manufacturer’s manual); only necessary for
calculation of uncertainty of a weighing result.
Built-in adjustment device
Not provided.
Adjustment by calibrator
Adjusted immediately before calibration.
Scale interval for testing
Higher resolution (service mode),
T
d
= 1 kg
Duration of tests
From 14h to 18h
Temperature during calibration
22°C at the beginning of the calibration
18°C at the end of the calibration
Barometric pressure during calibration
1 010 hPa ± 5 hPa; no rain, no wind
Test loads Standards weights:
10 parallelepiped standard weights, cast iron, 1 000 kg
each, certified to class M
1
tolerance of mpe = 50 g (OIML
R111 [4])
Substitution loads made up of steel or cast iron:
2 steel containers filled with loose steel or cast iron,
each weighing ≈ 2 000 kg;
2 steel containers filled with loose steel or cast iron,
each weighing ≈ 3 000 kg;
trailer to support the standard weights or the steel
containers, weight adjusted to ≈ 10 000 kg;
small metallic pieces, used to adjust the substitution
loads.
Lifting and manoeuvring means for standard weights and
substitution loads:
forklift, weight ≈ 4500 kg, capacity 6 000 kg to move
standard weights and substitution loads;
vehicle with trailer and crane, lifting capacity 10 000 kg,
to transport and to move standard weights and
substitution loads.

EURAMET Calibration Guide No. 18
Version 4.0 (11/2015)
- 102 -
H3.2/B Tests and results
Repeatability
Requirements given in
Chapter 5.1
Indication at no load reset
to zero where necessary
After unloading, no-load
indications were between 0
and 2 kg
Test load ≈ 10 420 kg:
Fork lift with 2 steel
containers (or the empty
trailer), moved on alternating
from either long end of load
receptor, load centred by
eyesight
Test load ≈ 24 160 kg:
Loaded vehicle (or loaded
trailer), moved on alternating
from either long end of load
receptor, load centred by
eyesight (alternatively or
additionally performed)
10 415 kg
24 155 kg
10 418 kg
24 160 kg
10 422 kg
24 162 kg
10 416 kg
24 152 kg
10 422 kg
24 156 kg
10 419 kg
24 159 kg
Standard deviation
s = 2,94 kg s = 3,67 kg
Eccentricity
Requirements given in
Chapter 5.3
Indication set to zero prior to test;
load put in centre first then moved to
the other positions
Position of the load Test load ≈ 10 420 kg:
Fork lift with 2 steel
containers
Centre 10 420 kg
Front left 10 417 kg
Back left 10 423 kg
Back right 10 425 kg
Front right 10 425 kg
Maximum difference between
center indication and the off-
center indications (in the four
corners)
max
ecci
I
5 kg
Eccentricity (alternatively or
additionally performed with rolling
loads)
Requirements given in Chapter 5.3
Indication set to zero prior to test
and prior the change of direction;
Position of the load Test load ≈ 24 160 kg:
heaviest and most
concentrated available
vehicle
Left 24 151 kg
Centre 24 160 kg
Right 24 169 kg
(change direction)
Right
24 167 kg
Centre 24 160 kg
Left 24 150 kg
Maximum difference between
center indication and the two
off-center indications (along the
longitudinal axis)
max
ecci
I
10 kg

EURAMET Calibration Guide No. 18
Version 4.0 (11/2015)
- 103 -
Errors of indication
Standard Procedure: Requirements given in chapter 5.2, weights distributed fairly
evenly.
Test loads built up by substitution, with 10 000 kg standard weights (10 weights × 1 000
kg) and 2 substitution loads L
sub1
and L
sub2
of approximately 10 000 kg each (the trailer
and the sum of 4 containers). Test loads applied once; continuous loading only upwards.
This may include creep and hysteresis effects in the results, but reduces the amount of
loads to be moved on and off the load receptor.
Indications after removal of standard weights recorded but no correction applied; all
loads arranged reasonably around centre of load receptor.
Indications recorded:
Air density ρ
as
during adjustment is unknown and air density ρ
aCal
is unknown.
No buoyancy correction is applied to the error of indication values. Using standard
weights class M
1
, the relative uncertainty for buoyancy effect is calculated according to
(7.1.2-5c) and it is 7,2×10
-6
(since the instrument is adjusted immediately before
calibration), The uncertainty is small enough; a more elaborate calculation of this
uncertainty component based on actual data for air density is superfluous (the
uncertainty of buoyancy is smaller than the scale interval of the high resolution mode d
T
and is negligible).
The limit of density for class M
1
standard weights is established to be ρ ≥ 4 400 kg m
-3
[4]. This limit may be considered also for the substitution loads. In this case, the relative
uncertainty estimated for the buoyancy effect of the substitution loads is the same as
above (for standard weights) and is small enough; a more elaborate calculation of this
uncertainty component based on actual data is superfluous.
Note: In the estimation of density for substitution loads, it is necessary to take
into account any internal cavities, which are not open to the atmosphere (for
LOAD
Standard weights
m
N
Substitution
loads L
sub
Total test load
L
T
=m
N
+L
sub
Indication I
Error of
indication E
0 kg 0 kg 0 kg 0 kg 0 kg
5 000 kg
½ m
re
f
0 kg 5 000 kg
5 002 kg
I(½ m
re
f
)
2 kg
10 000 kg
m
re
f
0 kg 10 000 kg
10 005 kg
I (m
re
f
)
5 kg
0 kg
10 000 kg
L
sub1
10 000 kg
10 005 kg
I(L
sub1
)
5 kg
5 000 kg
½ m
re
f
10 000 kg
L
sub1
15 000 kg
15 007 kg
I(½ m
re
f
+L
sub1
)
7 kg
10 000 kg
m
re
f
10 000 kg
L
sub1
20 000 kg
20 008 kg
I(m
re
f
+L
sub1
)
8 kg
0 kg
20 010 kg
L
sub1
+ L
sub2
20 010 kg
20 018 kg
I(L
sub1
+L
sub2
)
8 kg
5 000 kg
½ m
re
f
20 010 kg
L
sub1
+ L
sub2
25 010 kg
25 020 kg
I(½ m
ref
L
sub1
+L
sub2
)
10 kg
10 000 kg
m
re
f
20 010 kg
L
sub1
+ L
sub2
30 010 kg
30 022 kg
I(m
re
f
+L
sub1
+L
sub2
)
12 kg
0 kg 0 kg 0 kg 4 kg
4 kg
E
0
EURAMET Calibration Guide No. 18
Version 4.0 (11/2015)
- 104 -
example at tanks, reservoirs). It is necessary to estimate the density of such a load
as a whole, not to suppose that it has the same density as the material from which
it is built.
H3.3/B Errors and related uncertainties (budget of related uncertainties)
Conditions:
- The uncertainty of the error at zero only comprises the uncertainty of the no-load
indication (scale interval d = 1 kg) and the repeatability s. The uncertainty of the
indication at load is not taken into consideration at zero.
- The eccentric loading is taken into account for the calibration according to (7.1.1-10)
because it cannot be excluded during the error of indication test. If both eccentricity
tests were performed, then the result with the largest relative value should be used.
- The error of indication is derived using the nominal weight value as reference value,
therefore the maximum permissible errors of the test weights are taken into account
for deriving the uncertainty contribution due to the reference mass: u(
m
c
) is
calculated as u(
m
c
) = mpe/3 following formula (7.1.2-3). For each standard weight
of 1000 kg u(
m
c
) =50/3 29 g.
- In the absence of information on drift, the value of D is chosen D = mpe. For each
standard weight of 1000 kg mpe = ± 50 gand u(
m
c
) =50/3 29 g, following
formula (7.1.2-11).
- The instrument is adjusted immediately before calibration. The standard procedure
is applied, with no information about air density. Therefore formula (7.1.2-5c) is
applied for the uncertainty due to air buoyancy.
- The load remains on the load receptor for a significant period of time during the
calibration. Based on chapter 7.1.1 that states that additional uncertainty
contributions might have to be taken into account, the creep and hysteresis effects
in the results are calculated following formula (7.4.4-7) and included in the
uncertainty of the indication.
- The weights are acclimatized with a residual temperature difference of 5 K to the
ambient temperature. The effects of convection are not relevant (usually they are
only relevant for weights of class F1 or better).
- The degrees of freedom for the calculation of the coverage factor k are derived
following appendix B3 and table G.2 of [1]. In the case of the example, the influence
of the uncertainty of the repeatability test with 6 measurements is significant.
- The information about the relative uncertainty U(E)
rel
= U(E)/m
ref
is not mandatory,
but helps to demonstrate the characteristics of the uncertainties.

EURAMET Calibration Guide No. 18
Version 4.0 (11/2015)
- 105 -
Quantity or Influence Load, indication, error and uncertainties in kg Formula
Total test load
L
T
= m
N
+L
sub
j
/kg
0 5 000 10 000
m
re
f
10 000*
)
L
sub1
15 000
Indication I /kg
0 5 002 10 005
I (m
re
f
)
10 005
I (L
sub1
)
15 007
Error of Indication E /kg
025
5
I
1
=0
7
7.1-1
Repeatability u(
I
rep
) /kg
2,94 7.1.1-5
Resolution u(
I
dig0
) /kg
0,29 7.1.1-2a
Resolution u(
I
digL
) /kg
0,00 0,29 7.1.1-3a
Eccentricity u(
I
ecc
) /kg
0,00 0,69 1,39 1,39 2,08 7.1.1-10
Creep / hysteresis
u
rel
(
I
time
) /kg
0,00 0,39 0,77 0,77 1,16 7.4.4-7
Uncertainty of the indication
u(I)
/kg
2,96 3,08 3,37 3,37 3,81 7.1.1-12
Standard weights m
N
/kg
0 5 000 10 000
0
5 000
Uncertainty u(
m
c
) /kg
0,00 0,14 0,29 0,00 0,14
7.1.2-3
Drift u(
m
D
) /kg
0,00 0,14 0,29 0,00 0,14 7.1.2-11
Buoyancy u(
m
B
) /kg
0,00 0,04 0,07 0,00 0,04 7.1.2-5c
Convection u(
m
conv
) /kg
Not relevant in this case 7.1.2-13
Uncertainty of the reference
mass
u(m
re
f
) /kg
0,00 0,21 0,42 0,00 0,21 7.1.2-14
Substitution loads L
subj
/kg
000
10 000
L
sub1
=
m
re
f
+I
1
10 000
L
sub1
Uncertainty u(L
subj
)/kg
0,00 0,00 0,00 4,78 4,78 7.1.2-15b
Buoyancy u(
m
B
) /kg
0,00 0,00 0,00 0,07 0,07 7.1.2-4
Convection u(
m
conv
) /kg
Not relevant in this case
Uncertainty of substitution
loads
u(L
sub
j
) /kg
0,00 0,00 0,00 4,78 4,78 7.1.2-15b
7.1.2.-4
Standard uncertainty of the
error
u(E) /kg
2,96 3,08 3,39 -------- 6,12 7.1.3-1c
eff
(degrees of freedom)
5 6 8 -------- 93 B3-1
k(95,45 %)
2,65 2,52 2,32
--------
2,03
[1]
U(E) = ku(E)/kg
888
--------
12
7.3-1
U
rel
(E) /%
---- 0,16 0,08 -------- 0,08

EURAMET Calibration Guide No. 18
Version 4.0 (11/2015)
- 106 -
(continue)
Quantity or Influence Load, indication, error and uncertainties in kg Formula
Total test load
L
T
= m
N
+L
sub
j
/kg
20 000
m
ref2
+L
sub2
20 010*
)
25 010 30 010
Indication I /kg
20 008
I(m
ref2
+L
sub2
)
20 018
I(L
sub1
+L
sub2
)
25 020 30 022
Error of Indication E /kg
8
8
I
2
=10
10 12
7.1-1
Repeatability u(
I
rep
) /kg
2,94 7.1.1-5
Resolution u(
I
dig0
) /kg
0,29 7.1.1-2a
Resolution u(
I
digL
) /kg
0,29 7.1.1-3a
Eccentricity u(
I
ecc
) /kg
2,77 2,77 3,47 4,16 7.1.1-10
Creep / hysteresis u
rel
(
I
time
)
/kg
1,54 1,54 1,93 2,31 7.4.4-7
Uncertainty of the indication
u(I)
/kg
4,34 4,34 4,95 5,61 7.1.1-12
Standard weights m
N
/kg
10 000
0
5 000 10 000
Uncertainty u(
m
c
) /kg
0,29 0,00 0,14 0,29
7.1.2-3
Drift u(
m
D
) /kg
0,29 0,00 0,14 0,29 7.1.2-11
Buoyancy u(
m
B
) /kg
0,07 0,00 0,04 0,07 7.1.2-5c
Convection u(
m
conv
) /kg
Not relevant in this case 7.1.2-13
Uncertainty of the reference
mass
u(m
re
f
) /kg
0,42 0,00 0,21 0,42 7.1.2-14
Substitution loads L
subj
/kg
10 000
L
sub1
20 010
L
sub1
+L
sub2
=2
m
ref1
+I
2
20 010
L
sub1
+L
sub2
20 010
L
sub1
+L
sub2
Uncertainty u(L
subj
)/kg
4,78 7,80 7,80 7,80 7.1.2-15a
Buoyancy u(
m
B
) /kg
0,07 0,14 0,14 0,14 7.1.2-5c
Convection u(
m
conv
) /kg
Not relevant in this case 7.1.2-13
Uncertainty of substitution
loads
u(L
sub
j
) /kg
4,78 7,80 7,80 7,80 7.1.2-15a
7.1.2-4
Standard uncertainty of the
error
u(E) /kg
6,47 -------- 9,24 9,62 7.1.3-1a
eff
(degrees of freedom)
117 -------- 486 569 B3-1
k(95,45 %)
2,02
--------
2,01 2,00
[1]
U(E) = ku(E)/kg
13
--------
19 19
7.3-1
U
rel
(E) /%
0,06 -------- 0,07 0,06
*
)
The values written in this column (for the same total load value as in previous column, after
substitution of standard weights with substitution loads) are not reported in the calibration
certificate, but are used in next columns. In order to remember this, the bold font is not used in
this column and the final 5 cells are empty.
It would be acceptable to state in the certificate only the largest value of the expanded
uncertainty for all the reported errors: U(E) = 19 kg, based on k = 2 accompanied by the
statement that the coverage probability is at least 95 %.
The certificate shall give the advice to the user that the expanded uncertainty stated in
the certificate is only applicable, when the Error (E) is taken into account.
EURAMET Calibration Guide No. 18
Version 4.0 (11/2015)
- 107 -
H3.4/B Uncertainty of a weighing result
As stated in 7.4, the following information may be developed by the calibration laboratory
or by the user of the instrument. The results must not be presented as part of the
calibration certificate, except for the approximated error of indication and the uncertainty
of the approximated error which can form part of the certificate. Usually the information
on the uncertainty of a weighing result is presented as an appendix to the calibration
certificate or is otherwise shown if its contents are clearly separated from the calibration
results.
The normal conditions of use of the instrument, as assumed, or as specified by the user
may include:
Variation of temperature T = 40 K
Loads not always centred carefully
Tare balancing function operated
Loading times: normal, that is shorter than at calibration
Readings in normal resolution, d = 10 kg
For the change in adjustment due to drift, the error of indication at 30 000 kg is assumed
to be 15 kg. This is the mpe at initial verification, and taken as the instrument is in good
condition after maintenance and repair.
The designations R and W are introduced to differentiate from the weighing instrument
indication I during calibration.
R: Reading when weighing a load on the calibrated instrument obtained after the
calibration
W: Weighing result
Note that within the following table the reading R and all results are in kg.

EURAMET Calibration Guide No. 18
Version 4.0 (11/2015)
- 108 -
Quantity or Influence
Reading, weighing result and error in kg
Uncertainties in g or as relative value
Formula
Error of Indication
RE
appr
for gross or net
readings: Approximation
by a straight line through
zero
RRE
4
appr
10280,4
C2.2-16
Uncertainty of the approximated error of indication
Standard uncertainty of
the error
appr
Eu
2827
appr
2
10204,2)(10832,1 RRuEu
C2.2-16d
Standard uncertainty of
the error, neglecting the
offset
REu
4
appr
10485,1
Uncertainties from environmental influences
Temperature drift of
sensitivity
5
6
temprel
10309,2
12
40102
Ru
7.4.3-1
Buoyancy
Not relevant in this case. 7.4.3-2
Change in adjustment
due to drift (change of
E(Max) over 1 year = 15
kg)
4
adjrel
10887233000015
,Ru
7.4.3-6
Uncertainties from the operation of the instrument
Tare balancing operation
4
Tarerel
10154,1δR
u
7.4.4-5
Creep, hysteresis
(loading time)
Not relevant in this case (short loading time). 7.4.4-7
Eccentric loading
4
eccrel
10770,2
Ru
7.4.4-10
Uncertainty of a weighing result
Standard uncertainty,
corrections to the
readings
E
appr
to be
applied
272
10960,1kg 333,25 RWu
7.4.5-1a
7.4.5-1b
Expanded uncertainty,
corrections to the
readings
E
appr
to be
applied
272
10960,1kg 333,252 RWU
7.5.1-2b
Simplified to first order
RWU
4
10113,6kg 0,0671
7.5.2-3d
Global uncertainty of a weighing result without correction to the readings
REWUWU
apprgl
RWU
3
gl
1004,1kg 01
7.5.2-3a
The condition regarding the observed chi-squared value following (C2.2-2a) was
checked with positive result. The first linear regression taking into account the weighing
factors
j
p
, equation (C2.2-18b).
Based on the global uncertainty, the minimum weight value for the instrument may be
derived as per Appendix G.

EURAMET Calibration Guide No. 18
Version 4.0 (11/2015)
- 109 -
Example:
Weighing tolerance requirement: 1 %
Safety factor: 1
The minimum weight according to formula (G-9), using the above equation for the global
uncertainty results in 1 123 kg; i.e. the user needs to weigh a net quantity of material that
exceeds 1 123 kg in order to achieve a relative (global) measurement uncertainty for a
relative weighing tolerance requirement of 1 % and a safety factor of 1.
If a safety factor is included, it might be chosen to be 2. Because of the large global
uncertainty, a higher safety factor might not be able to be realised.
The minimum weight according to formula (G-9), using the above equation for the global
uncertainty results in 2 542 kg; i.e. the user needs to weigh a net quantity of material that
exceeds 2 542 kg in order to achieve a relative (global) measurement uncertainty for a
relative weighing tolerance requirement of 1 % and a safety factor of 2 (equals a relative
weighing tolerance of 0,50 %).
H3.5 Further information to the example: Details of the substitution procedure (4.3.3)
It is highly recommended to let the substitution load indicate – as far as possible –
the same value as the standard load (as demonstrated for the indication of 10 005 kg for
the second situation).
For this purpose, the substitution load can be adjusted by adding or removing small
metallic parts until you get the same indication value (10 005 kg). The value of mass
assigned to first substitution load is L
sub1
= m
N
= 10 000 kg.
Note: Both m
N
and m
ref
can be used (m
ref
= m
N
).
In the same table, the situation when it was not possible to adjust the substitution load to
achieve the indication value 20 008 kg is presented. The value of mass assigned to
second substitution load is L
sub2
= m
N
+ I(L
sub2
) − I(m
N
) = 10 000 kg + 20 018 kg −20 008
kg = 10 010 kg, and the total substitution load L
sub
is L
sub
= L
sub1
+ L
sub2
= 20 010 kg.
H4 Determination of the error approximation function
Preliminary note:
In this example the main procedure for the determination of the coefficients of the
calibration function and the evaluation of the related uncertainties as described in
Appendix C is shown.
H4.1 Conditions specific for the calibration
Instrument Electronic weighing instrument
Maximum Capacity
Max/
Scale interval d
400 g / 0,000 1 g
Adjustment by
calibrator
Adjusted immediately before calibration (built-in
adjustment weights).
Room conditions
Temperature 23 °C
Air density
ρ
aCal
=1,090 kg/m
3
, u(ρ
aCal
)=0,004 kg/m
3
Test loads /
acclimatization
Standard weights, Class E
2
, acclimatized to room
temperature:
m
conv
=0; u(m
con
v
)=0.

EURAMET Calibration Guide No. 18
Version 4.0 (11/2015)
- 110 -
H4.2 Tests and calibration results
Repeatability test
performed at 200 g
s(I) = 0,052 mg 7.1.1-5
Eccentricity test
performed at 200 g
∆I
ecci
max
= 0,10 mg
u
rel
(I
ecc
)= 0,000 144
7.1.1-11
Calibration method
The test loads applied
increasing by steps with
unloading between the
separate steps.
Number of test points n = 9.
Number of cycles N = 3.
Uncertainty due to the
repeatability
NIsIu
j
rep
= 0,030 mg
7.1.1-6
H4.3 Errors and related uncertainties (budget of related uncertainties)
Conditions:
-
The uncertainty of the error at zero comprises the uncertainty of the no-load
indication and the repeatability.
-
The eccentric loading is taken into account for the calibration according to (7.1.1-10)
-
The error of indication is derived using the calibration value as reference value, the
uncertainty contribution due to the reference mass is given by the Calibration
Certificate u(
m
c
) = U/2.
-
In addition, also the air density at the time of calibration ρ
a1
is known.
-
The drift of the weights is estimated by subsequent recalibrations.
The results are:
m
N
m
c
/g
U (
m
c
) /
mg
u(
m
D
) / mg
50 g 50,000 006 0,030 0,005
100 g 99,999 987 0,050 0,010
200 g 200,000 013 0,090 0,015
200 g* 199,999 997 0,090 0,015
ρ
Cal
=8000 kg/m
3
, u(ρ
Cal
)=60 kg/m
3
Calibration carried out at an air density ρ
a1
=1,045 kg/m
3
.
From equation (4.2.4-4)
m
B
= 0, therefore m
ref
= m
c
.
- The weights are acclimatized to the ambient temperature, the temperature variation
during the balance calibration is negligible.
- The balance is adjusted immediately before calibration and air density at the
calibration time is determined.
- The air buoyancy uncertainty is determined by
B
2
rel
2
NB
2
mummu
by (7.1.2-5b).
Note that in this example this contribution is negative, for this reason, the variance
contribution instead of the uncertainty is given.

EURAMET Calibration Guide No. 18
Version 4.0 (11/2015)
- 111 -
Loads from 0 g to 200 g
Quantity or Influence
Load and indication in g
Error and uncertainties in mg
Formula
Load m
ref
/g
0 50,000 006 99,999 987 149,999 993 200,000 01
3
Indication I /g
(mean value)
0,000 000 50,000 067 100,000 100 150,000 233 200,000 267
Error of Indication E
/mg
0,000 0,061 0,113 0,240 0,254
7.1-1
Repeatability s /mg
0,030
7.1.1-6
Resolution u(
I
dig0
)
/mg
0,029 7.1.1-2a
Resolution u(
I
digL
)/mg
0,000 0,029 7.1.1-3a
Eccentricity u(
I
ecc
)
/
mg
0,000 0,007 0,014 0,022 0,029 7.1.1-10
Uncertainty of the
indication
u(I) /mg
0,042 0,051 0,053 0,055 0,058 7.1.1-12
Test loads m
N
/g
0 50 100 100
50
200
Weights u(
m
c
) /mg
0,000 0,015 0,025 0,040 0,045
7.1.2-3
Drift u(
m
D
) /mg
0,000 0,005 0,010 0,015 0,015 7.1.2-11
Buoyancyu
2
(
m
B
)/mg
2
0,000
-4,8310
-5
-1,9310
-4
-4,3510
-4
-7,7310
-4
7.1.2-5b
Convection
u(
m
con
v
)/mg
Not relevant in this case. 7.1.2-13
Uncertainty of the
reference mass
u(m
re
f
)/ mg
0,000 0,014 0,023 0,037 0,038 7.1.2-14
Standard uncertainty of
the error
u(E) / mg
0,042 0,053 0,058 0,067 0,070 7.1.3-1a

EURAMET Calibration Guide No. 18
Version 4.0 (11/2015)
- 112 -
Loads from 250 g to 400 g
Quantity or Influence
Load and indication in g
Error and uncertainties in mg
Formula
Load m
ref
(m
N
) /g
250,000 019 300,000 000 350,000 006 400,000 010
Indication I/g
250,000 100 300,000 200 350,000 267 400,000 400
Error of Indication E
/mg
0,081 0,200 0,261 0,390
7.1-1
Repeatability s /mg
0,030
7.1.1-6
Resolution u(
I
dig0
) /mg
0,029 7.1.1-2a
Resolution u(
I
digL
)/mg
0,000 0,029 7.1.1-3a
Eccentricity u(
I
ecc
) /mg
0,036 0,043 0,051 0,058 7.1.1-10
Uncertainty of the
indication
u(I) /mg
0,062 0,067 0,072 0,077 7.1.1-12
Test loadsm
N
/g
50
200
100
200
50
100
200
200
200 *
Weights u(
m
c
) /mg
0,060 0,070 0,085 0,090
7.1.2-3
Drift u(
m
c
)/mg
0,020 0,025 0,030 0,030 7.1.2-11
Buoyancyu
2
(
m
B
)/mg
2
-1,2110
-3
-1,7410
-3
-2,3710
-3
-3,0910
-3
7.1.2-5b
Convection u(
m
conv
) /mg
Not relevant in this case. 7.1.2-13
Uncertainty of the
reference mass
u(m
ref
)
/mg
0,053 0,062 0,076 0,077 7.1.2-14
Standard uncertainty of
the error
u(E) /mg
0,082 0,091 0,104 0,109 7.1.3-1a
From the calibration results the calibration function
IfE
is determined.
As an example the linear regression model
IaE
1
is considered.
The coefficientsa
1
is determined by equation C2.2-6.
Table H4.1 shows the matrix X and the vector e. The relevant covariance matrix U(e) is
given in Table H4.4, which is determined by (C2.2-3a).
Table H4.2 shows the covariance matrices U(m
ref
), which is determined by (C2.2-3b),
where the column vector
ref
m
s
is given by the uncertainties of the reference mass u(m
ref
) .
Table H4.3 shows the covariance matrix U(I
cal
) which is a diagonal matrix having on the
diagonal the square values of U(I
cal
).
At the first step no contribution is considered for U(mod) (s
m
= 0).
As the number of test points is n = 9 and the number of parameters is n
par
= 1, the
degrees of freedom are
= n - n
par
= 8.

EURAMET Calibration Guide No. 18
Version 4.0 (11/2015)
- 113 -
Table H4.1: Matrix X and vector e
X/g e/mg
0 0,000
50,000 067 0,061
100,000 100 0,213
150,000 233 0,274
200,000 267 0,254
250,000 100 0,181
300,000 200 0,200
350,000 267 0,261
400,000 400 0,390
Table H4.2: Covariance matrix U(m
ref
)
0,000 0,000 0,000 0,000 0,000 0,000 0,000 0,000 0,000
0,000
2,01710
-4
3,27410
-4
5,29410
-4
5,45710
-4
7,50310
-4
8,73610
-4
1,07710
-3
1,09110
-3
0,000
3,27410
-4
5,31610
-4
8,59610
-4
8,86010
-4
1,21810
-3
1,41810
-3
1,74910
-3
1,77210
-3
0,000
5,29410
-4
8,59610
-4
1,39010
-3
1,43310
-3
1,97010
-3
2,29410
-3
2,82910
-3
2,86510
-3
0,000
5,45710
-4
8,86010
-4
1,43310
-3
1,47710
-3
2,03010
-3
2,36410
-3
2,91510
-3
2,95310
-3
0,000
7,50310
-4
1,21810
-3
1,97010
-3
2,03010
-3
2,79210
-3
3,25010
-3
4,00910
-3
4,06010
-3
0,000
8,73610
-4
1,41810
-3
2,29410
-3
2,36410
-3
3,25010
-3
3,78510
-3
4,66810
-3
4,72810
-3
0,000
1,07710
-4
1,74910
-3
2,82910
-3
2,91510
-3
4,00910
-3
4,66810
-3
5,75610
-3
5,83110
-3
0,000
1,09110
-4
1,77210
-3
2,86510
-3
2,95310
-3
4,06010
-3
4,72810
-3
5,83110
-3
5,90610
-3
Table H4.3: Covariance matrix U(I
Cal
)
1,73510
-3
0,000 0,000 0,000 0,000 0,000 0,000 0,000 0,000
0,000
2,62010
-3
0,000 0,000 0,000 0,000 0,000 0,000 0,000
0,000 0,000
2,77610
-3
0,000 0,000 0,000 0,000 0,000 0,000
0,000 0,000 0,000
3,03710
-3
0,000 0,000 0,000 0,000 0,000
0,000 0,000 0,000 0,000
3,40110
-3
0,000 0,000 0,000 0,000
0,000 0,000 0,000 0,000 0,000
3,87010
-3
0,000 0,000 0,000
0,000 0,000 0,000 0,000 0,000 0,000
4,44310
-3
0,000 0,000
0,000 0,000 0,000 0,000 0,000 0,000 0,000
5,12010
-3
0,000
0,000 0,000 0,000 0,000 0,000 0,000 0,000 0,000
5,90110
-3

EURAMET Calibration Guide No. 18
Version 4.0 (11/2015)
- 114 -
Table H4.4: Covariance matrix U(e) with s
m
= 0
1,73510
-3
0,000 0,000 0,000 0,000 0,000 0,000 0,000 0,000
0,000
2,82210
-3
3,27410
-4
5,29410
-4
5,45710
-4
7,50310
-4
8,73610
-4
1,07710
-3
1,09110
-3
0,000
3,27410
-4
3,30810
-3
8,59610
-4
8,86010
-4
1,21810
-3
1,41810
-3
1,74910
-3
1,77210
-3
0,000
5,29410
-4
8,59610
-4
4,42710
-3
1,43310
-3
1,97010
-3
2,29410
-3
2,82910
-3
2,86510
-3
0,000
5,45710
-4
8,86010
-4
1,43310
-3
4,87810
-3
2,03010
-3
2,36410
-3
2,91510
-3
2,95310
-3
0,000
7,50310
-4
1,21810
-3
1,97010
-3
2,03010
-3
6,66210
-3
3,25010
-3
4,00910
-3
4,06010
-3
0,000
8,73610
-4
1,41810
-3
2,29410
-3
2,36410
-3
3,25010
-3
8,22810
-3
4,66810
-3
4,72810
-3
0,000
1,07710
-3
1,74910
-3
2,82910
-3
2,91510
-3
4,00910
-3
4,66810
-3
1,08810
-2
5,83110
-3
0,000
1,09110
-3
1,77210
-3
2,86510
-3
2,95310
-3
4,06010
-3
4,72810
-3
5,83110
-3
1,18110
-2
H4.4 Results
Applying (C2.2-6) and (C2.2-9), the results are
a
1
= 0,00083 mg/g
The covariance matrix
a
ˆ
U
is
5,10910
-8
(mg/g)
2
from which
u(a
1
)= 0,00023 mg/g
From (C2.2-8)
2
obs
=12,5
As in this case the
2
test (C2.2-2a) fails, an uncertainty contribution s
m
is added.
Considering s
m
= 0,05 mg, the correspondent covariance matrix U(mod) is given by a
diagonal matrix 9x9 having
2
m
s
=0,05
2
on the diagonal. Table H4.5 shows the
correspondent covariance matrix U(e).
Table H4.5: Covariance matrix U(e) evaluated with
m
s
=0,05 mg
4,23510
-3
0,000 0,000 0,000 0,000 0,000 0,000 0,000 0,000
0,000
5,32210
-3
3 3,27410
-4
5,29410
-4
5,45710
-4
7,50310
-4
8,73610
-4
1,07710
-3
1,09110
-3
0,000
3,27410
-4
5,808E-03
8,59610
-4
8,86010
-4
1,21810
-3
1,41810
-3
1,74910
-3
1,77210
-3
0,000
5,29410
-4
8,59610
-4
6,92710
-3
1,43310
-3
1,97010
-3
2,29410
-3
2,82910
-3
2,86510
-3
0,000
5,45710
-4
8,86010
-4
1,43310
-3
7,37810
-3
2,03010
-3
2,36410
-3
2,91510
-3
2,95310
-3
0,000
7,50310
-4
1,21810
-3
1,97010
-3
2,03010
-3
9,16210
-3
3,25010
-3
4,00910
-3
4,06010
-3
0,000
8,73610
-4
1,41810
-3
2,29410
-3
2,36410
-3
3,25010
-3
1,07310
-2
4,66810
-3
4,72810
-3
0,000
1,07710
-3
1,74910
-3
2,82910
-3
2,91510
-3
4,00910
-3
4,66810
-3
1,33810
-2
5,83110
-3
0,000
1,09110
-3
1,77210
-3
2,86510
-3
2,95310
-3
4,06010
-3
4,72810
-3
5,83110
-3
1,43110
-2

EURAMET Calibration Guide No. 18
Version 4.0 (11/2015)
- 115 -
The new results are
a
1
= 0,00084 mg/g
The covariance matrix is
5,63710
-8
(mg/g)
2
from which
u(a
1
)= 0,00024 mg/g
and
2
obs
=7,3
In this case, the
2
test (C2.2-2a) passes. The plot of the result is shown in Figure H4-1.
Figure H4-1: Measured errors of indication E and the linear fitting function with the
associated uncertainty bands
The residuals and the uncertainties associated with the calibration points are calculated
by (C2.2-7) and (C2.2-11) respectively, and are shown in Table H4.6.

EURAMET Calibration Guide No. 18
Version 4.0 (11/2015)
- 116 -
Table H4.6: Calculated error, residuals and uncertainties associated to the calibration
points
I /g E /mg E
appr
/mg
Residual
/mg
u(E
appr
)
/mg
U(E
appr
)
/mg
Residual Test
(C2.2-2b)
0 0,000 0,000 0,000 0,000 0,000 YES
50,000 067 0,061 0,042 -0,019 0,012 0,024 YES
100,000 200 0,113 0,084 -0,029 0,024 0,047 YES
150,000 267 0,240 0,126 -0,114 0,036 0,071 NO
200,000 267 0,254 0,168 -0,086 0,047 0,095 YES
250,000 200 0,081 0,210 0,129 0,059 0,119 NO
300,000 200 0,200 0,252 0,052 0,071 0,142 YES
350,000 267 0,261 0,293 0,032 0,083 0,166 YES
400,000 400 0,390 0,335 -0,055 0,095 0,190 YES
If the alternative method given with (C2.2-2b) is followed, which is much more restrictive,
the residual test fails in two points according to Table H4.6.
In order to obtain the goodness of the fit according to the condition (C2.2-2b), it is
necessary to consider a contribution s
m
= 0,25 mg and therefore a new matrix U(e) is
calculated, which is given in Table H4.7.
Table H4.7: Covariance matrix U(e) evaluated with s
m
=0,25 mg
6,42310
-2
0,000 0,000 0,000 0,000 0,000 0,000 0,000 0,000
0,000
6,53210
-2
3,27410
-4
5,29410
-4
5,45710
-4
7,50310
-4
8,73610
-4
1,07710
-3
1,09110
-3
0,000
3,27410
-4
6,58110
-2
8,59610
-4
8,86010
-4
1,21810
-3
1,41810
-3
1,74910
-3
1,77210
-3
0,000
5,29410
-4
8,59610
-4
6,69310
-2
1,43310
-3
1,97010
-3
2,29410
-3
2,82910
-3
2,86510
-3
0,000
5,45710
-4
8,86010
-4
1,43310
-3
6,73810
-2
2,03010
-3
2,36410
-3
2,91510
-3
2,95310
-3
0,000
7,50310
-4
1,21810
-3
1,97010
-3
2,03010
-3
6,91610
-2
3,25010
-3
4,00910
-3
4,06010
-3
0,000
8,73610
-4
1,41810
-3
2,29410
-3
2,36410
-3
3,25010
-3
7,07310
-2
4,66810
-3
4,72810
-3
0,000
1,07710
-3
1,74910
-3
2,82910
-3
2,91510
-3
4,00910
-3
4,66810
-3
7,33810
-2
5,83110
-3
0,000
1,09110
-3
1,77210
-3
2,86510
-3
2,95310
-3
4,06010
-3
4,72810
-3
5,83110
-3
7,43110
-2
With this approach the result is
a
1
= 0,00084 mg/g
The covariance matrixis
1,745 10
-7
(mg/g)
2
Therefore
u(a
1
)= 0,00042 mg/g
The plot of the results is shown in Figure H4-2. The calculated residuals and the
uncertainties associated to the calibration points are shown in Table H4.8.
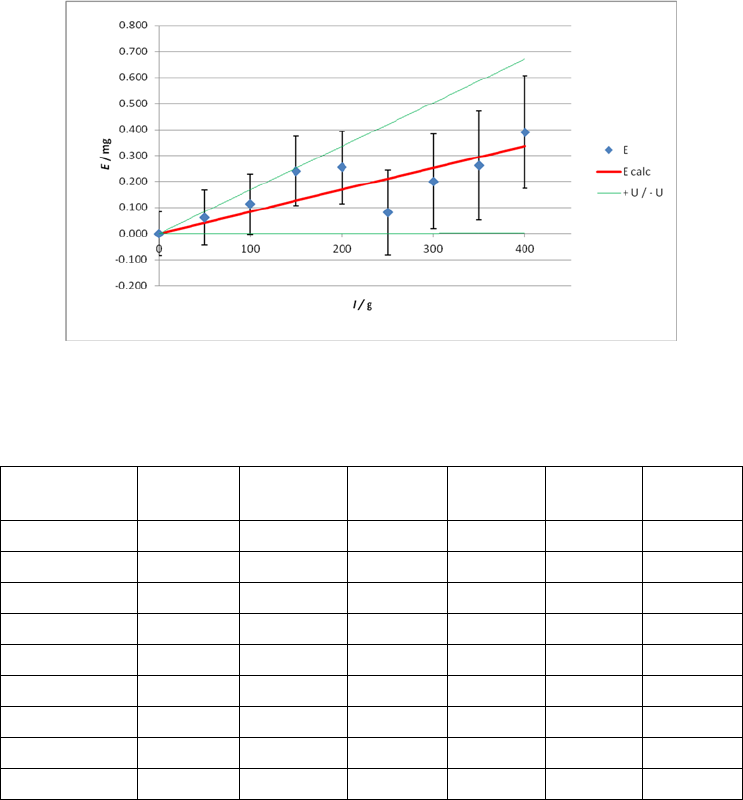
EURAMET Calibration Guide No. 18
Version 4.0 (11/2015)
- 117 -
Figure H4-2: Measured errors of indication E and the linear fitting function with the
associated uncertainty bands
Table H4.8: Calculated error, residuals and uncertainties associated to the
calibration points
I
/g
E
/mg
E
appr
/mg
Residual
/mg
u(E
appr
)
/mg
U(E
appr
)
/mg
Residual
Test
0 0,000 0,000 0,000 0,000 0,000 YES
50,000 067 0,061 0,042 -0,019 0,021 0,042 YES
100,000 200 0,213 0,084 -0,029 0,042 0,084 YES
150,000 267 0,274 0,126 -0,114 0,063 0,125 YES
200,000 267 0,254 0,168 -0,086 0,084 0,167 YES
250,000 200 0,181 0,210 0,129 0,104 0,209 YES
300,000 200 0,200 0,252 0,052 0,125 0,251 YES
350,000 267 0,261 0,294 0,033 0,146 0,292 YES
400,000 400 0,390 0,336 -0,054 0,167 0,334 YES

EURAMET e.V.
Bundesallee 100
38116 Braunschweig
Germany
EURAMET e.V. is a non-profit association under German law.
Phone: +49 531 592 1960
Fax: +49 531 592 1969
E-mail: [email protected]
