
DOCUMENT RESUME
ED 415 993
PS 026 177
AUTHOR
Brown, Brett V.
TITLE
Family Functioning and Adolescent Behavior Problems: An
Analysis of the National Survey of Families and Households.
INSTITUTION
Child Trends, Inc., Washington, DC.
SPONS AGENCY
Department of Health and Human Services, Washington, DC.
PUB DATE
1993-07-00
NOTE
59p.
CONTRACT
DHHS-100-92-0015
PUB TYPE
Reports
Research (143)
EDRS PRICE
MF01/PC03 Plus Postage.
DESCRIPTORS
*Adolescents; *Behavior Problems; *Child Behavior;
Comparative Analysis; Definitions; Family Environment;
*Family Influence; Family Structure; Multivariate Analysis;
National Surveys; Nuclear Family; One Parent Family;
*Predictor Variables; Sex Differences; Stepfamily; Test
Reliability
IDENTIFIERS
Family Functioning; National Survey of Families and
Households
ABSTRACT
This study used data from the National Survey of Families
and Households (NSFH) to explore the relationship between family functioning
and adolescent behavior problems. The data covered five family types:
married, two-biological parent families (TP); stepfamilies;
divorced/separated female-headed families (DSF); never married female-headed
families (NM); and single male headed families. The total sample included
over 2,300 households with adolescents between 12 and 18 years. Data were
collected through in-person surveys and self-administered questionnaires
completed by respondent and spouse. Findings indicated that there was
significant variation across family types in the ways in which family
functioning measures related to adolescent behavior problems, with measures
operating poorly for NM families. The TP families generally scored higher
than other types on family strength measures. One-parent families attempted
to compensate by reaching out to extended kin, friends, and neighbors,
although these activities were not related to reduced adolescent behavior
problems. Internal measures of family functioning were more important than
external measures of family functioning in predicting adolescent problem
behaviors. Marital conflict and depression were very powerful predictors of
adolescent behavior problems in two-biological parent families, and marital
conflict was a powerful predictor in step-families. Family functioning
measures were about equal in predictive power to sociodemographic measures in
predicting two of the three behavior problem measures. There were clear
differences in the level of reporting by parent. (Seven tables detail
findings. An appendix provides definitions of measures. Contains 15
references.)
(KB)
********************************************************************************
*
Reproductions supplied by EDRS are the best that can be made
*
*
from the original document.
*
********************************************************************************

U.S. DEPARTMENT OF EDUCATION
Office of Educational Research and Improvement
EDUCATIONAL RESOURCES INFORMATION
CENTER (ERIC)
This document has been reproduced as
received from the person or organization
originating it.
Minor changes have been made to
improve reproduction quality.
Points of view or opinions stated in this
document do not necessarily represent
official OERI position or policy.
FAMILY FUNCTIONING AND ADOLESCENT BEHAVIOR PROBLEMS: AN
ANALYSIS OF THE NATIONAL SURVEY OF FAMILIES AND HOUSEHOLDS
July 1993
by
Brett V. Brown, Ph.Z.
Research Associate
Child Trends, Inc.
2100 M. Street, N.W.
PERMISSION TO REPRODUCE AND
DISSEMINATE THIS MATERIAL
HAS BEEN GRANTED BY
CoorlA
A.
erm
s
Washington, D.C. 20037
TO THE EDUCATIONAL RESOURCES
INFORMATION CENTER (ERIC)
Prepared under DHHS contract 100-92-0015,
Delivery Order 02
The author gratefully acknowledges the programming assistance
of Charles Halla and Thomas Stief, the typing assistance of
Fanette Jones, and the helpful comments of Drs. Donna Ruane
Morrison and Kristin Moore.
2
BEST COPY AVAILABLE

INTRODUCTION
A growing body of literature is exploring the ways in which both positive and negative
family functioning affect the health and well-being of family members, particularly children.
With rare exceptions, such research has been based on small, narrow and unrepresentative
samples of families (for exceptions, see Furstenburg et. al. 1983, Zill et al. 1991, Zill et. al.
1993. Buchannon, Maccoby and Dornbusch 1992).
In this paper. we use the National Survey of Families and Households, a recent large
random sample of U.S. families containing a wealth of family process and social support
measures, to go beyond economic and demographic measures and systematically explore the
relationship between family functioning and adolescent behavior problems.
QUESTIONS PURSUED IN THE ANALYSIS
The primary focus of the analysis will be on the relationship between family function
and family type. Within this area, we will focus on the following questions.
To what extent are family functioning measures equally appropriate for all family
types?
There has been a great deal of criticism within the child development
literature that existing measures of family process and child behaviors may suffer
from significant race/ethnicity and class biases. Groups may face distinct challenges
from the environment, and draw on distinct cultural traditions which call for different
family functioning strategies to maximize the well-being of children. This may result
in significant variations in both the reliability and validity of such measures across
groups. This critique is easily extended to the social dimension of family type. While
different family types may not possess distinct cultural traditions, they do face distinct
internal and external stressors which may produce differences in the reliability and
validity and impact of family functioning measures.
1
How do the levels and mix of positive and negative family functioning characteristics
differ by family type? Different types of families differ both in the stresses they
experience which can produce poor family functioning, and in the resources available
to them to build family strengths. Single parent families of all sorts have one less
parent to contribute to the raising of children and the financial support of the family.
Step-families may have to deal with a third parent, the ex-spouse, and face unique
challenges in defining the relationship between step-parents and children. These and
other factors may be expected to produce both different levels of functioning, and
different strategies to build family strength.
How might the effects of these family functioning characteristics on adolescent
behavior problems differ by family type?
The relationship between a family
functioning measure and an adolescent behavior measure may differ across family
types for two reasons. First, the particular family functioning measure may be
measuring different things for different family types (a validity issue). Second, it is
likely that the origins of adolescent behavior problems vary by family type. For
example, both a divorce and the introduction of a step-parent, defining characteristics
of two common family types, may themselves be unique sources of behavior
problems.
In addition to family type issues, we will explore the following broad issues:
How important are family functioning measures in explaining adolescent behavior
problems, relative to conventional economic and sociodemographic measures?
Presently, family functioning measures are relatively rare and not always of the best
quality in existing large scale surveys. If their inclusion adds substantially to our
understanding of the behavior of family members, they should be further developed
and included in more large federal surveys. The analyses for this project will not be
definitive regarding this question. but will add important new information.
What dimensions of family functioning are the most important in determining
adolescent behavior?
For the analysis, family functioning measures have been
divided into internal and external measures. Internal measures refer to the processes
and value orientations which operate within the immediate family. External measures
indicate the relationship of the family to the outside world including extended kin,
friends and neighbors, and organizations within the community. The ecological model
described by Bronfenbrenner suggests that both will have important impacts on child
development (Bronfenbrenner 1979). In the analysis, we will evaluate the relative
importance of these two types of measures and, within these types, the importance
of individual measures.
2
BEST COPY AVAILABLE

What is the relative importance of family dysfunction and positive family strengths
in determining adolescent behavior? The family strengths literature is founded on
the notion that it is just as important to identify positive family strengths as it is to
identify family dysfunction (Stinnett and DeFrian 1985).
Also, it is suggested that
distinct measures can and should be developed for each (Dunst and Trivette, 1992).
For the present analysis we examine two negative measures, family conflict and
parental depression. The remaining
family functioning
measures
are
operationalizations of constructs found in the family strengths literature (for a review
of this literature. see Krysan et. al., 1990).
Does it matter who you ask? In families with more than one parent, reports of
behavior problems and family strengths may vary by the gender of the parent, and
by whether the parent is the biological step-parent of the child. Both potential
sources of variation are explored in the analysis. These results may have important
implications for choice of respondent in future Federal surveys.
DATA
The data set for this analysis is the National Survey of Families and Households
(NSFH), a large representative sample of U.S. households taken in 1987. The total sample
size is 13.014, including over 2,300 households containing adolescents between the ages of
twelve and eighteen. In-person surveys were conducted with a randomly chosen adult within
the household (a parent in our sub-sample), and with self-administered questionnaires
completed by both respondent and spouse. The survey was designed to support a wide
variety of family-oriented research efforts. A five year follow-up survey has just been
completed, and will be available for analysis in January of 1994.
The NSFH has a number of characteristics which make it particularly valuable in
pursuing the research agenda outlined above. First, its large sample size allows us to
perform comparative analyses which include less common family types such as never
married female heads and single male heads. Second, it contains what is by large survey
3
BEST COPY AVAILABLE

standards a wealth of data from which a wide variety family functioning measures can be
produced.
The survey also has several limitations which should be noted. First, the data are
cross-sectional. which limits our ability to model the causal direction of the relationship
between family strength measures and adolescent behavior problems. This is an important
issue for analyses of adolescent behaviors, since adolescents are more likely than younger
children to have direct impacts on the functioning of the family (Hetherington, personal
communication).
Second. no information was gathered directly from the adolescent, a shortcoming that
has been corrected in the five year follow-up survey. A previous analysis has shown child
reports of some family functioning measures to be more closely related to adolescent
behavior than parent reports (Zill et. al.. 19911.
VARIABLES
Outcome Measures
We have constructed three outcome measures covering different aspects of
adolescent behavior problems. Taken together. they allow us to evaluate the impact of
family functioning measures across a broad spectrum of behaviors. The first measure,
Behavior Problems I.
is a seven-item scale composed of a subset of questions from the
Behavioral Problems Index (Zill. 1991). The
scale is comprised of everyday behaviors
associated with anti-social acting out. hyperactivity, and depression-withdrawal. The second
measure. Behavior Problems II. is a five-item scale composed of major events indicating
4
BEST COPY AVAILABLE
more serious problem behaviors and includes running away, school suspension, parent-
teacher conferences over behavioral problems in school, trouble with the police, and seeing
a psychologist or therapist. The third measure is a seven item scale that
reflects the degree
of conflict between parent and adolescent child in the following areas: dress, friends, staving
out late. helping around the house. money, school. and getting along with other family
members. For a detailed description of these and other measures used in the analysis, see
.- Appendix A.
Family Functioning Measures
As we noted above. measures of family functioning have been categorized as internal
or external for this analysis. Internal measures of family functioning include encouraging
independence. commitment to family, spending time together, marital conflict, and parental
depression. The first three constructs has been identified in the literature as measures of
positive family functioning, and the last two as dysfunctional for the developinent of
children.
The first two of these measures are abstract values measures reflecting degree of
commitment to marriage and children. and to encouraging independence in one's children.
The time together scale reflects the amount of time one spends with one's children eating
meals. playing, working on projects. having private talks. helping with reading or homework,
and engaging in leisur,.:- activities outside the home. The marital conflict scale is a seven item
cumuiative measure of the freauency of disagreement between spouses on the following
tonics: household tasks. money. spending time together. sex, the in-laws, the children, and
BEST COPY AVAILABLE

about having another child. The parental depression measure is a twelve item version of the
standard CES-D depression scale.
External measures of family functioning were chosen to reflect the availability of
social support networks (family, friends, and religious institutions), and parental involvement
with organizations which serve youth. We use five external measures of family functioning
in ail: two measures of relationships with extended kin (geographical and emotional
closeness), frequency of socializing with friends and neighbors, attending religious services,
and involvement in youth organizations (PTA. team sports, religious and community youth
2roucts). All are based on the activities of the parent(s), not the adolescent. Social support
measures were defined in terms of availability rather than actual support behaviors, since
actual support behaviors reflect need as well as actual available support.
It is hypothesized that all family functioning measures with the exception of marital
conflict and depression. will be negatively associated with adolescent behavior problems.
That is. higher scores on these measures should be associated with fewer behavioral
problems. We expect the opposite relation for the marital conflict and parental depression
measures.
Not all of the important constructs of family functioning could be operationalized
using this data set. Important constructs not operationaiized for this analysis include styles
of family communication and conflict resolution. adaptability, cohesion, and the expression
of appreciation among family members (see Krvsan et. ai. 1990 for a review of these and
other constructs). Consequently. the analysis is not a comprehensive examination of family
functioning measures in general. but oniy an exploration of representative constructs.
6
BEST COPY AVAILABLE
THE ANALYSIS PLAN
In our analyses, we begin by examining measurement reliability and raw correlations
between family functioning measures and outcome measures of adolescent behavior
problems. These are performed for the full sample, and separately by family type.
Comparisons are also made by sex of adult respondent and, in the case of step-families.
whether the parent was the biological or step parent. Next, we look at the mean values of
both functioning and outcome measures by family type, to see how the levels and mix of
family strengths and family difficulties differs across family types.
This is followed by a series of nested multivariate models for the entire sample which
allow us to explore important questions discussed above which are not directly related to
family type issues (e.g. the overall importance of family functioning measures, the relative
importance of internal versus external measures of functioning). Finally, we compare the
results of fully specified models (those with the full complement of measures explored in
these analyses) across family types.
The analyses focus on five family types:
married, two biological parent families:
step-families:
divorced/separated female headed families (DSF);
never married female headed families:
single male headed families.
BEST COPY
AVAILABLE

Due to small sample sizes, our analyses of the two least common family types, never
married female and single male headed families. must be limited to descriptive analysis.
Multivariate analyses are carried out for the remaining three family types.
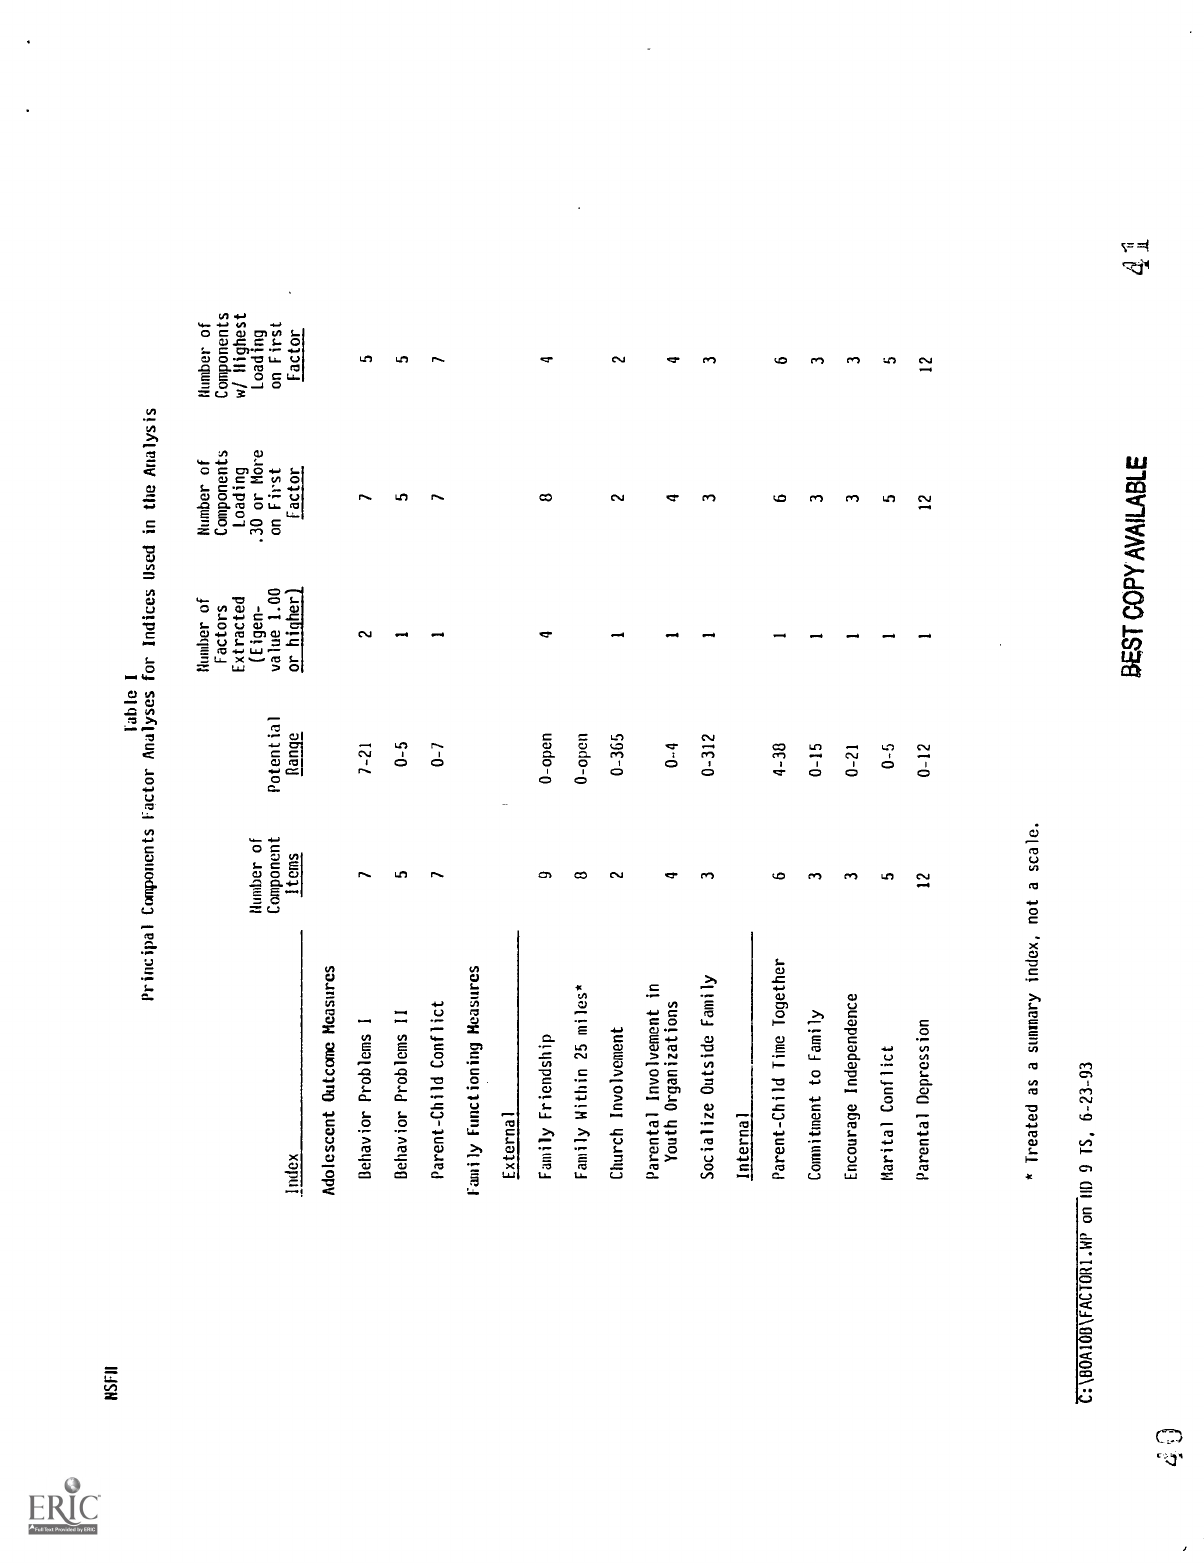
CREATING THE SCALES
All of the outcome and most of the family functioning measures that we are using
in the analyses are multi-item scales representing unitary constructs. In creating these scales,
factor analyses were performed to test whether the potential components of the scales all
loaded reasonably well on at least one factor. Through this method a final set of component
items were identified for each scale. The basic characteristics of each scale, including
number of items, value range, and results from the final set of factor analyses are displayed
in Table I.
SCALE RELIABILITY
One of the means of determining the quality of such scales is to assess their
reliability. Reliability measures the extent to which a scale can be expected to yield stable
results across repeated research trials or surveys. Measures with poor general reliability are
to be avoided or, if marginal, to be used with appropriate caution. When making statistical
comparisons across groups, it is important for purposes of interpretation that the level of
reliability be similar across those groups. For these analyses we are using Cronbach's alpha
as our reliability measure.
8
BEST COPY AVAILABLE

In assessing reliability we have concentrated on three issues:
What is the reliability of each measure within the general population?
To what extent does reliability differ by family type?
To what extent does reliability differ according to which parent is the respondent?
There are several reasons to expect that a measure's reliability may differ significantly
by family type. First. the scales may actually be measuring somewhat different things for
different types of families. For example, what it means to "encourage independence" among
one's children may be significantly different between single and two parent families. Where
a parent in the two-parent family may be thinking of independence in the abstract, a single
parent may be thinking more in terms of concrete activities which will help the family to
function on a day to day basis. Second, if the range of values of the measure is much
more
restricted for certain family types (for example if certain types of behavior are rare for
certain family types) it will tend to be a less reliable measure for that group even though
it is measuring the same construct.
An awareness of differences in the reliability of a measure across family types is very
important for proper interpretation of analysis results, since differences in the effects of the
measure may be due in part to differences in reliability rather than differences in the way
the construct actually operates within different types of families.
Measures may also differ in reliability according to the gender or the step versus
biological parent status of adult respondents within the same family types. Interactions
between parent and child differ significantly along both dimensions. Women and biological
9
BEST COPY
AVAILABLE

parents appear to have a greater awareness of what is going on in the lives of their
adolescent children. Such differences may result in lower measurement reliability from men
and step parents, whose lesser knowledge could introduce more error and less variation to
the measure.
Table II lists Cronbach's alpha scores of reliability for all of the scales used in our
analysis. Scores are shown for the full sample and for each of the five family types. Separate
scores are also shown for husbands and wives within two-biological parent families, and for
biological mothers and step-fathers within step families.
For the total sample, all of the adolescent outcome measures and all but two of the
family functioning measures have alphas in the .6 and .7 range or higher. This is a
satisfactory degree of reliability, particularly for survey data (see Nunnaly 1978). Many of
these measures are based on five or fewer items. The addition of appropriate additional
items could significantly enhance their reliability. Though such additional items do not exist
in this data base. the items in these scales could form the basis for even more reliable scales
in future surveys.
Two of the scales, "socializing outside of family" and "commitment to family", showed
marginal reliability scores of .44 and .54, respectively. While this suggests that they may not
adequately represent the constructs which they are meant to represent, we use them in
subsequent analyses given that we have no alternatives within the NSFH.
Across family types, there is surprisingly little variation in measurement reliability,
and generally favorable reliability levels were observed for each family type. For most
measures. variations in the alphas are no greater than .10. Several measures (parent-child
10
BEST COPY
AVAILABLE
212

conflict, parent-child time together, parental depression and marital conflict)
were
particularly consistent across family types. This indicates that it may not be necessary to
operationalize family functioning constructs differently for different family types, though of
course there are other reasons in addition to variation in reliability for doing so. In addition.
it means that the generally favorable reliability levels observed for the full sample also exist
for each family type.
There are, however, a few notable exceptions to this general pattern of consistency.
The reliability measure for "Behavior Problems II", the scale of
more serious
behavior problems, is considerably smaller for adolescents from two-biological parent
families than for teens from other family types (.48 versus .62 for the full sample).
It is not clear why this should be so. As we shall see in Table IV, such children show
a very low mean value for this measure compared to children from other family types
(.23 versus .54 or higher). The restricted range of values for children from
two-
biological parent families may account for its relatively poor performance.
The "family friendship" measure, a measure of emotional closeness of the parent with
adult extended kin, appears to be more reliable for two-biological parent families
than for other types of families (.66 versus .48-.56). Unlike most of the other family
types, most two-biological parent families have not had a major family disruption
which could alter relationships with extended family members and friends. In
addition. such families may be more traditional, placing greater emphasis
on family
relationships. Both factors may account in part for the greater reliability of the
measure for two-biological parent families.
The "socialize outside of family" measure, which showed the lowest overall reliability,
also showed great variation by family type (.32 to .51) with the highest reliability
again for two-biological parent families.
Within two-biological parent families, the reports of mothers and fathers have similar
reliability levels for both adolescent outcome and family functioning
measures across the
board. Within step-families, however, there are several large and puzzling differences in
reliability between step-fathers and biological mothers, all in favor of the step-father. For
11
BEST COPY AVAiLABLE

"Behavior Problems I", the outcome measure requiring the most knowledge of the daily life
of the child, step-fathers have alphas of .73 versus .58 for biological mothers. For
"family
friendship" and socialize outside of family", the spread is twice
as large. For all three
measures. step-fathers had the highest reliability score of the subgroups. While the
reason
for this is unclear, it may be that step-fathers more critically scrutinize the behavior
of their
non-biological offspring and develop more consistent and perhaps less flexible impressions.
CORRELATIONS BETWEEN MEASURES OF FAMILY FUNCTIONING
Some work within the family functioning literature
seems to suggest that family
functioning measures will be fairly highly correlated with
one another (Olson 1989, Stinnett
and DeFrain 1985). This also appeals to
common sense; families who operate well in one
dimension of family life will tend to operate well in other dimensions, while
the converse
might be true for dysfunctional families. On the other hand, within
the family therapy
literature there is a growing acknowledgement that
even troubled families often have
significant strengths to draw upon in addressing particular dysfunctions, indicating
a certain
independence across dimensions of family functioning. Some researchers
have gone so far
as to develop separate measures of strength and dysfunction for what
are usually treated
as single theoretical constructs (Dunst and Trivette, 1992).
An analysis of such correlations is. then, important in itself for the light it sheds
on
how dimensions of family functioning may affect each other. This
also has specific
implications for the analyses to follow. If the correlations
are low, or are high only for
selected pairs of measures, then it may be possible to
say something useful about the total
12
BEST COPY AVAILABLE

effect of a measure both directly, and indirectly through its relation with other dimensions
of family functioning.
If many of these measures are highly correlated, however, we are
limited to a discussion of direct effects. Alternatively, high correlation may indicate the
desirability of constructing and examining a single family strengths scale.
Table III shows a correlation matrix for all measures of family functioning used in
the analysis. All significant correlations are in the expected direction, with the exception of
the relationship between "family within 25 miles" and "marital conflict". This is nevertheless
an interesting exception, possibly indicating that family proximity can be something of a
mixed blessing.
The most notable finding in Table III is the surprisingly low correlation between
most measures. There is no correlation higher than .27, and most are in the single digits and
teens. Many of the measures are statistically independent from one another.
There are a number of interesting and noteworthy patterns of relationships. First,
there is the surprising lack of relationship between the negatively defined family functioning
measures (marital conflict and parental depression) and the remaining measures of family
strengths. They are reasonably well correlated with each other at .22.
But parental
depression is significantly correlated with only two of the remaining eight measures, and
those correlations are very modest (.05 or below). Marital conflict is correlated with more
measures, but again they are very modest, the highest being the correlation with
"commitment to family" at -.13. This seems to bear out the observation of those theorists
and family therapists who believe family dysfunctions and strengths often exist within the
13
BEST COPYAVAILASLE
same family. Moreover, they suggest that the several constructs are indeed tapping different
dimensions of family functioning.
Second, the 'family friendship" scale. representing the emotional closeness of the
parent to adult kin outside the household, is at least marginally significantly associated with
all of the other measures, though the level of correlation is often modest. It is, perhaps not
surprisingly, most strongly correlated with the measure for geographic proximity of extended
adult kin (the family within 25 miles measure) at .27, and the "commitment to family"
measure at .17.
This finding invites a number of possible interpretations. It may indicate
the central importance of the support (emotional, financial, and/or practical) offered by a
strong extended family system for the proper functioning within the immediate family.
Alternatively, it may reflect a learning effect. namely that adults who come from loving
families possess the skills and attitudes needed to create well-functioning families of their
own.
Third. there are many significant correlations between the more positively
constructed internal and the external measures of family functioning. External measures
particularly related to these internal measures include family friendship, involvement with
religious institutions, and parental involvement in youth organizations. These relations are
to some extent definitional. For example, the relatively high correlation between parent/child
time together and parental involvement in youth organizations is explained in part by the
fact that the former "internal" measure includes joint activities outside the home (though
the measures do not contain any overlapping items). Overall, however, this demonstrates
a clear relation between internal family functioning processes and persons and organizations
14
BEST COPY AVAILABLE

beyond the immediate family. What cannot be determined with this cross-sectional data is
causality, i.e.
whether well-functioning families are more integrated into the wider
community, or community involvement (including extended kin) promotes good family
functioning, or both. Further research using longitudinal data is needed to determine the
causal nature of this relationship.
LEVELS OF FAMILY FUNCTIONING AND ADOLESCENT BEHAVIOR PROBLEMS:
VARIATIONS BY FAMILY TYPE
In this section, we explore differences in the incidence of both behavior problems and
family functioning measures by family type. It has been amply demonstrated in previous
research that the incidence of child behavior problems differ by family type. Further, we are
interested to see how the availability and mix of family strengths, and the burden of family
dysfunctions (conflict, depression), differs by family type.
Adolescent Behavior Problems
Table IV contains the mean values for each adolescent outcome and family
functioning measure used in the analyses, for the full sample and separately by family type.
For all three measures of adolescent behavior problems there is clear variation by family
type. Children from two-biological parent families are reported to have the fewest problems
for all measures. The difference is particularly striking for "Behavior Problems II", where
the report of serious behavior problems is one half or less of what it is for other family
types. Across the remaining family types. it is important to note that children from step-
families are reported to exhibit problem behaviors at a rate closer to children from single
15
BEST COPY AVAILABLE

parent families than to those from two-biological parent families. In fact, when comparing
the reports of biological mothers from step-families with those from both types of female
headed families. levels of problem behavior are at least
as high for children from step-
families as for children from female-headed families.
It is interesting that step-fathers are considerably less likely than biological
mothers
in step-families to report serious adolescent behavior problems (Behavior
Problems II). This
may have to do with the fact that four of the five component measures for that scale require
knowledge of the child's actions since
age twelve (which a step-father may not possess),
whereas the other two scales are related to behaviors around the time of
the survey. Clearly,
within step-families it
is preferable to gather retrospective data of this
sort from the
biological parent.
It bears pointing out that the rate of behavior problems
vary within a very restricted
range across family types. Though the differences between some family types
may be large
proportionally, in absolute terms the differences
are surprisingly modest. For example,
though the ''Behavior Problems I" measure has
a range from seven to twenty-one, the largest
difference in mean scores across family types
was .83, less than a single point.
Family Functioning Measures
In examining the mean distribution of family functioning
measures (Table IV), we
are interested in differences across family types within measures, and differences in the mix
of family functioning resources that each family
type has to draw upon. First, as a general
observation, the two-biological parent family, which reports the fewest
adolescent behavioral
problems. also has the most family strengths to draw
upon and the fewest family
16
BEST COPY AVAILABLE
0
0

dysfunctions to deal with. Parents from such families are much less likely to be depressed,
even after controlling for the gender of the parent. Marital conflict is also much lower for
parents in two-biological parent families than those from step-families. Parents from two-
biological parent families also attend religious services and activities more often, have
more
close relationships with extended kin, and are much more likely to be involved in youth
organizations.
Second, we do observe what may be compensatory patterns of external support
seeking for single parents in general, and for never married female heads in particular. All
three single parent family types show much higher rates of socializing outside of the family,
indicating that they may have a larger support network of friends outside the kinship
system.
In addition. never-married female heads have considerably more adult kin living close by
than parents from other family types; almost one person
more than mothers within two-
biological parent families.
In part this may reflect a cultural
preference, since a
disproportionate number of these women are African-American (see Stack, 1974). It
may
also reflect a deliberate strategy to remain close to kin who
can provide support and
assistance, or may be associated with the lower ages at birth and
more limited resources
associated with out-of-wedlock childbearing.
Beyond these general patterns. there are notable differences (and lack of differences)
across family types in the mean levels of particular family functioning measures.
Though parents from two-biological parent families show the highest
score on the
family friendship measure, the differences between them and the never married
female and single male head families are surprisingly small given that single parents
do not have the spouse's family to draw upon.
17
BEST COPY
AVAILABLE
Involvement with organizations within the community (both religious and youth-
related) is much higher for two-biological parent families than for other family types.
The gap is particularly large between single parent and two-biological parent families
where involvement in youth organizations is concerned, perhaps reflecting the role
overload experienced by single parents. This may be cause for concern, since these
are precisely the types of organizations within the community (religious and youth
organizations) that could be most helpful in supporting single parents and involving
their children in constructive activities.
Across the internal measures of family functioning, there is a notable consistency
across family types in the values for "parent/child time together". This is both
surprising and encouraging, since it indicates that any increased time pressures
experienced by single parents do not seem to translate into less parent/child
involvement in the day-to-day activities covered by this measure. It bears mentioning
that this lack of variation across family types may not exist to the same extent for
very young children, since parents (usually mothers) from two parent families are
more likely to stay at home when there are young children in the house.
Parental depression is extremely high among never married female heads (1.46)
relative to other family types, particularly compared with parents in two-biological
parent families (.61). This gulf remains even when controlling for gender effects:
mothers in two-biological parent families still score very low (.68). The measures for
the remaining family types fall about half way in between these two extremes. There
may be several sources of this variation including selectivity into certain family types,
and differences in income by family type. It seems likely, however, that pressures
associated with parenting for single parent and step-families give rise to depression,
which may in turn have negative impacts on children.
18
BEST COPY AVAILABLE

CORRELATIONS BETWEEN FAMILY FUNCTIONING MEASURES AND ADOLESCENT
BEHAVIOR PROBLEMS
In this section of the analysis we look at the correlations between our ten family
functioning measures and the three outcome measures of adolescent behavior problems. We
look at these bivariate relations for the total sample, and separately for each family type.
These correlations should tell us whether the family functioning measures are behaving
roughly as anticipated in terms of impact and direction, and whether they operate similarly
across family types. Table V shows bivariate correlations for the full sample and separately
by family type. There is a separate page of the table for each of our three outcome
measures.
Results for the Total Sample.
Looking at the first column in each table containing correlations for the full sample,
each of the family functioning measures is significantly related (.05 level) to at least one of
the three behavior problem measures. There was a great deal of variation, however, in terms
of the strength of impact and the number of outcomes to which a measure was significantly
related.
Three of the five "internal" measures of family functioning, (commitment to family,
marital conflict. and parental depression) and one of the external measures (family
friendship) are significantly related to all three outcomes. Four of the measures (parental
involvement in youth organizations, socializing outside of the family, parent-child time
together, and encouraging independence among one's children) are significantly related to
two outcomes. Two of the measures (family within 25 miles, and involvement in religious
19
BEST COPY AVAILABLE

institutions) are significantly related to only one of the outcome measures, and when
significant the correlations were small (.04 and .09 respectively).
For two of the three behavior problem measures, marital conflict and adult
depression (the two negatively defined measures of family functioning), are the most
strongly correlated with the behavior problem measures. Correlations are particularly strong
for marital conflict, running from .28 to .35. For the scale representing more serious
behavior problems, "Behavior Problems II",
the correlations are much smaller both
absolutely (.06 and .08), and relative to other family functioning measures in the model.
One of the measures of family functioning behaved counter to what had been
expected. The bivariate correlations indicate that higher rates of parental socializing outside
family are associated with more adolescent behavior problems for two of the three
outcome measures (Behavior Problems II and parent/child conflict). This would indicate
that an active social life on the part of parents. whatever the benefits gained by him or her,
-may sometimes come at the expense of children. Alternatively, it may be that parents with
troubled children have greater need for social contact and support.
Results by Family Type.
In general, family functioning measures seem to operate rather consistently across
three of the five family types: two-biological parent. divorced/separated female (DSF), and
single male headed families (Table V). Few of the coefficients for single male heads are
significant. but they are similar in size and direction to those of the other two family types
leading one to conclude that the main difficulty here is sample size. Between the two-
BEST COPY AVAILABLE
20

biological parent and the divorced/separated female headed families, only two measures
seem to operate somewhat differently. The parental depression measure is always
significantly correlated with adolescent behavior problems for two-biological parent families.
The correlation is smaller and never significantly correlated for DSF families. In addition,
the family friendship measure is significantly related to one of the behavior problem
measures (Behavior Problems II) for DSF families, but is never significant for two-biological
parent families.
For step-families, several of the measures operate somewhat differently than they do
for other family types. The correlations for "family friendship" are small and insignificant
for all three outcomes in step-families, whereas they are often significant for two-biological
parent and DSF families. Conversely, the "encourage independence" scale, which measures
the importance the parent attaches to encouraging independence in his or her children, is
large and positively correlated with Behavior Problems I and II for step-families, but not
for two-biological parent or DSF families. It may be that this construct takes on a different
content in the case of step-families due to the often problematic relationship between step-
parents and their step-children (Hetherington et. al, 1981).
The family functioning measures performed poorly as predictors of adolescent
behavior problems for never married female headed families. For only one outcome,
"Behavior Problems I", were any correlations significant at the .05 level. Parental depression
and "socializing outside of the family" were both strongly and positively correlated with that
outcome. To some extent this lack of significance undoubtedly results from the small sample
sizes for this family type. But among the remaining correlations their size and direction are
21
BEST COPY AVAILABLE
LTh
j..,)

often at odds with those from other family types, leading to the conclusion that many of
these scales may not be particularly appropriate for families headed by never married
mothers.
The very high correlation between parental depression and adolescent "Behavior
Problems I" for never married female headed families bears particular mention. The
correlation is .43, nearly three times the size of the correlation for two-biological parent
families (the only other family type for which it was significant). Recall that these parents
had much higher depression levels than parents in other family types, which may explain the
higher correlation.
It may be that a much greater proportion of these mothers are
experiencing high levels of depression, and it is this high level of depression which is
associated with behavior problems in their adolescent children. This relation merits further
investigation using longitudinal data so that clear causal inferences can be made.
In sum, we have found that, with a few notable exceptions, family functioning
measures correlate similarly to adolescent behavior problems for three family types: two-
biological parent, divorced/separated female head, and single male headed families.
Measures operated somewhat differently for step-families,
but in ways which are
understandable given the unique stresses within such families. Finally, these family
functioning measures operated poorly for families of never-married mothers, indicating that
efforts should be made to produce alternative measures for such families.
BEST COPY
AVAILABLE
22
FULL SAMPLE MULTIVARIATE ANALYSES RELATING FAMILY FUNCTIONING TO
ADOLESCENT BEHAVIOR PROBLEMS.
Table VI displays the results of a sequence of five models for each of the three
outcomes. The models are nested, and have been designed to allow us to explore the
following questions:
To what extent are the associations between family type and adolescent behavior
problems attributable to differences in other sociodemographic characteristics?
Are there significant effects for individual measures of family functioning once
economic, sociodemographic, and other family functioning measures have been
controlled?
If so. how important are family functioning measures in explaining adolescent
behavior problems relative
to conventional economic and sociodemographic
variables?
What is the relative importance of internal versus external measures of family
functioning with regard to adolescent behavior problems?
To what extent are the effects of other family functioning measures attributable to
the effects of parental depression?
Model One is a simple regression which includes only family structure. Each
coefficient represents a comparison between the family type listed and a two-biological
parent family. As expected, the coefficients are large and positive for all family types. The
coefficients are not significant for never-married female and single male heads for two of
the three outcomes, probably a result of their small sample sizes. In terms of the predictive
power of family structure alone, variance explained is quite modest ranging from 1.6 percent
to 4.2 percent for parent/child conflict and Behavior Problems II, respectively.
In Model Two, we add the remaining economic and sociodemographic variables to
the regressions. These include many characteristics which we would expect to be related
23
BEST COPY AVAILABLE

both to family type and adolescent behaviors, thus potentially reducing the direct impact of
family structure. Such characteristics include family income, public assistance receipt, family
size, parental educational attainment, and race. The introduction of these variables does
increase the predictive power of the model for all three outcomes, but the reduction in the
size of the coefficient for family structure is quite small, being proportionately the largest
for the parent-child conflict outcome. Nor are their reductions for all family types.
Surprisingly, coefficient sizes actually increase for never married female and single male
heads in several cases in the presence of controls. For Behavior Problems I and parent-child
conflict, the inclusion of these control variables reduces the coefficient for single male
headship to marginal significance.
In Model Three, we expand the analysis by introducing all of the internal family
functioning measures except for parental depression. In order to include marital conflict in
this model. it was necessary to combine the marital status and conflict measures, creating
separate high and low conflict versions for two-biological parent and step families. The
omitted family type, that is, the one to which all other family types are compared, is the
two-biological parent low conflict family.
The purpose of this model is to gauge the importance of such measures relative to
the economic and sociodemographic measures included in the previous model. The results
show moderately large increases in the predictive power of Model Three over Model Two
for Behavior Problems I (.067 to .110) and parent/child conflict (.072 to .131), and a more
modest increase for Behavior Problems II (.077 to .091). For two of the three outcomes, the
24
BEST COPY AVAILABLE

predictive power of the model is nearly doubled when these internal family functioning
measures are introduced.
Overall, then, these analyses indicate that the inclusion of family functioning
measures, particularly those assessing internal family processes,
in future surveys may
significantly enhance our understanding of adolescent behavior problems. These models are
based on cross-sectional data and therefore we do not know the causal direction of the
effects running between family functioning and adolescent behavior problem
measures. Of
the three internal measures included in model three, only the "commitment to family"
variable is unlikely to be much affected by adolescent behavior problems. To solve this
problem satisfactorily requires the proper longitudinal data. Such analyses will be feasible
once data from the five year follow-up of the NSFH become available early next year.
Of the four family functioning variables included in model three (parent/child time
together, commitment to family, encouraging independence in one's children, and marital
conflict), three were significant for each outcome. All coefficients
are in the expected
direction. Interestingly, it was a different three in each case.
In Model Four, we add the external measures of family functioning to the model.
These measures add very little to the overall explanatory power of the model and
are
usually not significant. The coefficients for the internal measures were little affected by the
introduction of the external measures. In Table Five we saw that many of these external
measures were significantly correlated with the behavioral outcomes. This leaves open the
possibility that such external factors may be having an indirect effect through their impact
on internal family processes. For example religious involvement may be indirectly affecting
25
BEST COPY
AVAILABLE
parent/child conflict and the behaviors captured in the "Behavior Problems I" measure by
encouraging parent/child time together and an increased commitment to family on the part
of parents. Further research would be needed to clarify the relationship between these
internal and external factors.
In Model Five, we add the parental depression measure to the model. We are
interested in the extent to which the coefficients for other family functioning measures are
reduced by the introduction of this variable. Parent depression shows significant direct
effects on the Behavior Problems I and parent/child conflict outcome measures. The only
independent variables in the model affected by the introduction of this variable are the
family type/conflict measures. The coefficients for these variables are reduced across the
board. though the reduction is never more than 20 percent. Comparing the variance
explained between Model Five and Model Two (the economic and sociodemographic
model) we find a doubling of the R-square for the Behavior Problems I and parent-child
conflict outcomes. and a more modest increase of about 25 percent for Behavior Problems
II. Clearly, family functioning measures are. as a group, important for our understanding
of adolescent behavior problems.
Looking at the impact of individual measures in Model Five, we see that all of the
internal family functioning measures, including parental depression, showed significant
impacts for at least two of the three adolescent outcome measures: marital conflict was
significant for all three. Among the external measures, parental involvement in youth
organizations has a sizeable direct relation to the Behavior Problems I scale, and religious
involvement has a modest but significant relation to the Behavior Problems II scale. There
26 BEST COPY
AA/fix/as

were no other significant direct impacts of external measures. For the total sample, then,
internal measures of family functioning are more closely and systematically related to
adolescent behavior than external measures, at least in terms of their direct effects.
Of the three outcomes, family functioning measures appear to have the smallest impact on
the scale measuring serious behavioral problems. This is interesting since it implies that,
when it comes to the more serious "acting out" kinds of behaviors that most impact the
community, family functioning is a relatively less important factor than it is for the day-to-
day behavioral problems captured in the other two measures.
MULTIVARIATE MODELS RELATING FAMILY FUNCTIONING TO ADOLESCENT
BEHAVIOR PROBLEMS: VARIATIONS BY FAMILY TYPE.
For our final analyses we have run the full model from the previous table (minus the
family type indicators) separately by family type. These runs were performed for three
-
family types: two-biological parent. step-parent. and separated/divorced female headed
families. Small sample sizes for single male and never married female headed families
precluded us from estimating multivariate models for these groups. For the sake of
consistency with the full sample model, the marital conflict variable remains in the "family
type' section of the table. Again, separate analyses were performed for each of the family
types.
In analyzing the correlations in Table Five, we noted the different patterns of
relationships between family functioning and adolescent outcome measures which exist for
different family types. In this table we explore the same issues in a multivariate context. This
27
4.
(-)
.7)
BEST COPY AVAILABLE

will allow us to evaluate differences controlling for economic and sociodemographic
measures, and for other measures of family functioning.
Across the three outcomes, several distinct patterns of relationships appear by family
type. First, parental depression is a strong predictor of adolescent behavior problems for
two-biological parent families, but is small and insignificant for the other family types. It is
unclear why this should be so. It may be that the causes of adolescent behavior problems
differ across family types. Alternatively, and thinking in the other direction causally, it may
be that adolescent misbehavior is a relatively more important determinant of depression
among parents in two-biological parent families, since parents in other family types may face
additional many additional life stresses which affect their emotional health.
Second, encouraging independence in one's children is a significant predictor of
problems in several of the models for step-families (Behavior Problems I and II) and
families headed by divorced or separated mothers (Behavior Problems II), but has no
measurable impact among two-biological parent families. The effects seem particularly
strong for step-families. It is reasonable to posit an increased need on the part of step and
single parents for independence among their children. Single parents, lacking a spouse to
share the load, are under increased time pressures, and may have a greater need for their
children to be independent in their day-to-day activities. Parents in step-families may require
more time to build the spousal relationship than two- biological parent parents. In addition,
the special tensions which often exist between step-parents and their children, which can
themselves lead to behavioral difficulties, may be minimized if the adolescent can achieve
a degree of independence from parents. These unique needs may translate into differences
28
3D
BEST COPY AVAILABLE

in the meaning of the measure itself across family types, since parents in different family
types may have different notions of what constitutes "independence" given their distinct
needs in this area.
Third, parental conflict is a significant predictor of all three behavior outcomes for
both two-biological parent and step-families. For Behavior Problems II and parent/child
conflict, the effect is very large. This large impact of parental conflict indicates that high
conflict married households may be equally or more detrimental for children than single
parent households, a point which has been made in the literature for some time (Zill, 1983).
What is lacking from the present and previous analyses, and what is clearly needed, is
some
measure of adult domestic conflict within single parent households. It is likely that many
single parents have regular interactions with boyfriends and girlfriends, partners, and
extended kin who live in the household or are regular visitors. To do truly adequate
comparisons across these family types, such a measure, which is critical to understanding
the dynamics of married couple families, should be developed for single parent families
as
well.
Fourth, for the one outcome (Behavior Problems I) in which parental involvement
in youth organizations was a significant predictor for the total sample, significance is lost
for all but divorced/separated female headed households. Here the size of the effect is
substantial, though the significance is marginal at .10. It is difficult to say whether this is in
fact a true difference by family type, or is instead a matter of gender. It
may be that it is
the involvement of mothers in such organizations that is the critical factor; the gender
specific correlations in Table Five appear to bear this out. Regardless, it suggests that when
29
'17)
01-.0
BEST COPY AVAILABLE
single mothers are involved in community organizations, their children have fewer behavior
problems.
CONCLUSIONS
In this analysis we have explored a number of important issues related to family
functioning measures in general and, in particular, to the ways in which they operate across
distinct family types. The major findings of the paper are as follows:
There is a great deal of consistency in the reliability of the composite scales of family
functioning across family types.
Nevertheless, there is also significant variation across family types in the ways in
which these measures relate to adolescent behavior problems. :=Available measures
seemed to operate particularly poorly for never married female heads of household.
There are significant differences across family types in terms of access to positive
family strengths, and differences in levels of family dysfunction as well (particularly
depression), with two-biological parent families generally higher on the measures of
family strengths. Nevertheless, there was some evidence that single parent families
attempt to compensate by reaching out to extended kin and to friends and neighbors.
It is unclear whether such compensating strategies in fact operate to reduce the
behavior problems of their adolescent children, however, since the measures were
not positively related to reduced behavior problems for adolescents from such
families in the multivariate analyses.
With the few important exceptions noted above, the effects of external measures of
family functioning are indirect at best, through their impact on internal family
processes. Internal measures appear to be the most important, at least in terms of
direct impacts on adolescent behaviors.
The more negatively defined measures of family functioning (marital conflict,
depression) were very powerful predictors of adolescent behavior problems in two-
biological parent families both in themselves and relative to the impact of more
positively constructed measures. Marital conflict was a powerful predictor for step-
families as well.
30
BEST COPY AVAILABLE
Family functioning measures showed themselves to be about equal in predictive
power to sociodemographic measures in predicting two of the three behavior
problem measures. Clearly measures of this sort merit serious consideration for
inclusion in future federal surveys.
Which parent one interviews in a survey appears to be important for specific
measures in the analysis. There were clear differences in the level of reporting by
gender. In addition, some measures, such as that for involvement in youth
organizations, perform differently by gender in both correlational and multivariate
analyses. Among step-families, there appears to be less knowledge of a child's
behavioral history among step-parents.
RECOMMENDATIONS
Based on the findings presented
in this
paper, we have the
following
recommendations:
The measures of family functioning constructed here indicate that such measures,
particularly those we have termed "internal" measures, predict to adolescent behavior
problems and thus merit inclusion in future large scale sample surveys. We
recommend that work be done to further develop these types of measures for use in
future large scale surveys.
New work should be done to develop measures for never-married female headed
households. Many of the measures explored here did not work as well for this group
as they did for other family types. This is of some importance to the Federal
government, particularly in light of plans to reorganize the welfare system. Such
plans can benefit from a knowledge of what constitutes strong never married female
headed families.
A new measure of domestic conflict should be developed for single parent
households. Conflict is a very important predictor of child well-being in married
couple households, and we hypothesize that conflict with partners and/or resident
adult kin may be similarly important for single parent families as well where
significant conflict exists.
When possible, surveys should interview both parents, and the child as well.
Differences in reporting by both gender and biological/nonbiological status of the
parent which were found in this analysis indicate that this would provide valuable
additional information. In addition, as was demonstrated in the analysis of the
31
4.0,
-7)
kir
,
BEST COPY AVAILABLE

National Survey of Children also conducted for this project, child reports are often
superior for topics such as adolescent behavior problems, child activities and the
parent/child relationship.
Further work should be done using longitudinal data for this sort of analyses (for
existing efforts see accompanying papers). Such work can be done using the NSFH
once data from the second wave of interviews becomes available in early 1994.
Analyses similar to these should be performed for younger age groups. It is very
likely that what constitutes a family strength differs according to the child's age and
stage of development.
32
BEST COPY AVAILABLE

REFERENCES
Bronfenbrenner, U. (1979)
The ecology of human development.
Cambridge, MA:
Harvard University Press.
Buchanan, Christy M., Maccoby, Eleanor E., and Dornbusch 1991. Caught Between Parents:
Adolescents' Experience in Divorced Homes. Child Development 62: 1008-1029.
Dunst, Carl J. and Carol M. Trivette 1992. Measuring Family Functioning as an Outcome
of Social Action Programs: A Framework and Relevant Indicators. A position paper
on family functioning outcomes prepared for the PEW Charitable Trusts, as part of
the Comprehensive Children's Services Initiative.
Furstenberg, F. F., Jr., Nord, C. W., Peterson, J. L., & Zill, N. (1983). The life course of
children of divorce: martial disruption and parental contact. American Sociological
Review, 48(10): 656-668
Hetherington, E.M., Cox, M. and Cox, R. Divorce and remarriage. Paper presented at the
meeting of the Society for Research in Child Development, Boston, April 1981.
Krysan, M., Moore, K. A., & Zill N. (1990, May).
Identifying successful families: An
overview of constructs and selected measures. Paper presented at conference of the
Assistant Secretary for Planning and Evaluation, U.S. Department of Health and
Human Services, Washington, DC.
Nunnaly, Jum C. 1978. Psychometric Theory. New York: McGraw-Hill Book Company.
Olson. D. H., Russell, C. S., & Sprenkle. D. H. (eds.) (1989). Circumplex model: Systemic
assessment and treatment of families. New York: Haworth Press.
Stack. C. (1974).
All our kin:
Strategies for survival in a black community. New York:
Harper and Row.
Stinnett, N., De Frain, J. (1985). Secrets of strong families. Boston: Little, Brown & Co.
Swihart. J. (1988). "Characteristics of strong families." Unpublished
paper, International
Family Center, Logos Research Institute.
Zill, N. (1983, 22 and 24 March). Divorce. marital conflict, and children's mental health:
Research findings and policy recommendations. Testimony before Broken Families:
Hearings before the Subcommittee on Family and Human Services. Senate Hearing,
98-105.
33
BEST COPY AVAILABLE

Zill. N. (1991). The behavior problems index:
Descriptive material.
Washington, DC:
Child Trends.
Zill, N., Morrison, D. R.. & Coiro, M. J. (in press). Long -term effects of parental divorce
on parent-child relationships, adjustment, and achievement in young adulthood.
Journal of Family Psychology, special issue on Families in Transition.
Zill, N., & Rhoads. A. (1991). Assessing family strengths in a national sample of families
with adolescent children. Washington, DC: Child Trends
BEST COPY AVAILABLE
34

APPENDIX A
DEFINITIONS OF FAMILY FUNCTIONING AND ADOLESCENT BEHAVIOR
PROBLEM MEASURES USED IN THE NSFH ANALYSES
ADOLESCENT BEHAVIOR PROBLEM MEASURES
1. Adolescent Behavior Problems I
A seven-item additive scale of responses to the following questions (with each
item on a scale of 1-3 ranging from "often true" to "not true"):
Child often:
1. is irritable or sad (reverse coded)
2. loses temper (reverse coded)
3. is cheerful
4. is fearful (reverse coded)
5. bullies other children (reverse coded)
6. does what you ask
7. gets along with other kids
2. Adolescent Behavior Problems II
A five-item scale with range of 0-5, with one point for an answer of "yes" to each
of the following questions:
1.
child ever suspended/expelled from school since age 12?
2.
child ever run away since age 12?
3. child ever in trouble with police since age 12?
4. child ever see a doctor for emotional problems since age 12?
5. met with teacher/principal concerning behavior problems of child in
last year?
3 Parent/child conflict.
A seven-item scale, with a range of 0-7, which reflects the degree of conflict
between parent and adolescent child in the following areas: dress, friends, staying
out late, helping around the house, money. school, and getting along with other
family members.
IN 1 ERNAL FAMILY FUNCTIONING MEASURES
1. Parent-Child Time Together
This is a simple additive scale of the following measures:
1. number of times last week ate breakfast with child.
2. number of times last week ate dinner with child.
35
BEST COPY AVAILABLE
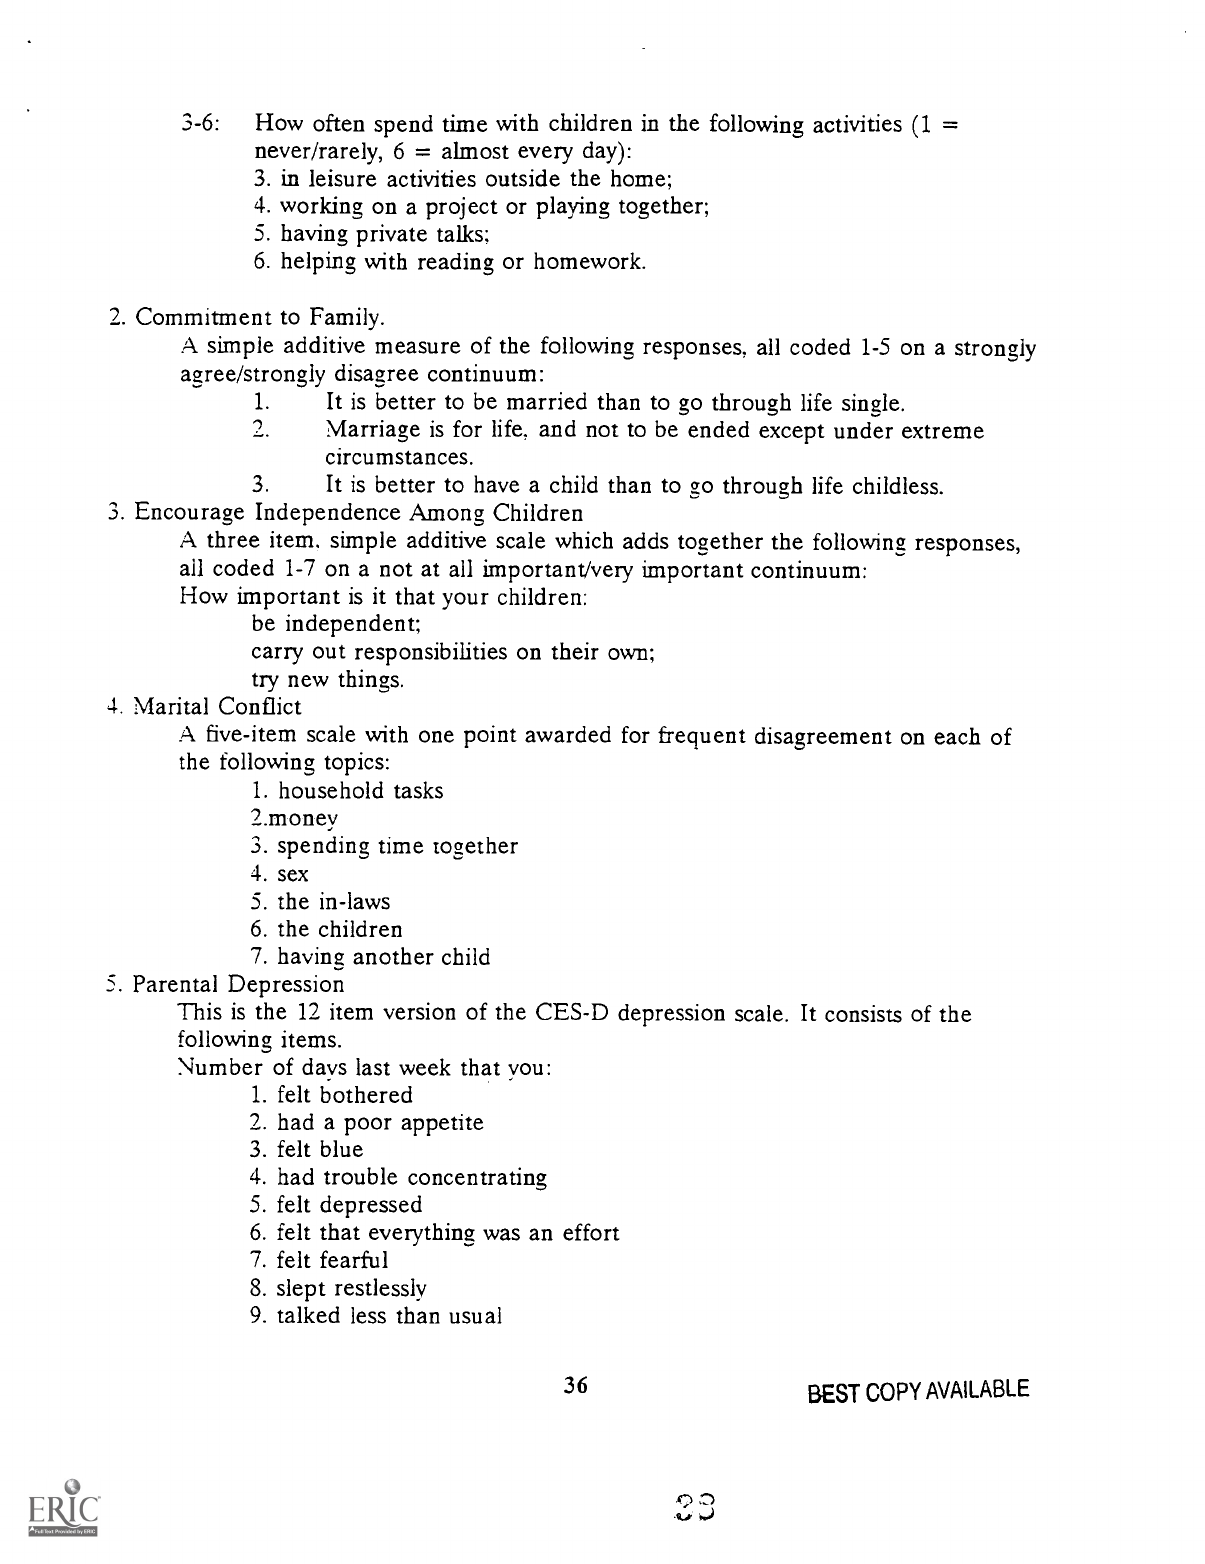
3-6:
How often spend time with children in the following activities (1 =
never/rarely, 6 = almost every day):
3. in leisure activities outside the home;
4. working on a project or playing together;
5. having private talks;
6. helping with reading or homework.
2. Commitment to Family.
A simple additive measure of the following responses, all coded 1-5 on a strongly
agree/strongly disagree continuum:
1.
It is better to be married than to go through life single.
Marriage is for life, and not to be ended except under extreme
circumstances.
3.
It is better to have a child than to go through life childless.
3. Encourage Independence Among Children
A three item, simple additive scale which adds together the following responses,
all coded 1-7 on a not at all important/very important continuum:
How important is it that your children:
be independent;
carry out responsibilities on their own;
try new things.
4. Marital Conflict
A five-item scale with one point awarded for frequent disagreement on each of
the following topics:
1. household tasks
2.money
3. spending time together
4. sex
5. the in-laws
6. the children
7. having another child
5. Parental Depression
This is the 12 item version of the CES-D depression scale. It consists of the
following items.
Number of days last week that you:
1. felt bothered
2. had a poor appetite
3. felt blue
4. had trouble concentrating
5. felt depressed
6. felt that everything was an effort
7. felt fearful
8. slept restlessly
9. talked less than usual
36
BEST COPY AVAILABLE

10. felt lonely
11. felt sad
12. couldn't get along.
One point was given for each time the answer was four days or more.
EXTERNAL FAMILY FUNCTIONING MEASURES
1. Extended Family Friendship
An additive scale with one point for each adult extended family with whom
one is
very close emotionally. This includes parents. siblings, spouses of siblings, of both
the respondent and spouse.
2. Extended Family living within 25 miles
Number of adult extended family members living within 25 miles of respondent.
This includes parents, siblings, spouses of siblings, of both the respondent and
spouse.
3. Parental Church Involvement
Number of days per year that adult respondent attends services
or a social
function at a religious institution.
4. Parental Involvement in Youth Organizations
A four item measure reflecting regular involvement of respondent
or spouse in
the following types of organizations:
PTA or school activity;
Religious youth group;
Community youth group;
team sports/athletic clubs.
One point is given for involvement in each type of organization.
5.
Socialize Outside Family
Number of days per year that adult respondent socializes in the evening with
friends, neighbors, or co-workers.
37
BEST COPY AVAILABLE
MSFII
table
Principal Components Factor Analyses for Indices Used in the Analysis
Index
Number of
Component
Items
Potential
Range
Number of
Factors
Extracted
(Eigen-
value 1.00
or higher)
Number of
Components
Loading
.30 or More
on First
Factor
Number of
Components
w/ Highest
Loading
on First
Factor
Adolescent Outcome Measures
Behavior Problems I 7 7-21 2 7
5
Behavior Problems II 5
0-5
1 5
5
Parent-Child Conflict 7 0-7
1 7
7
Family Functioning Measures
External
Family Friendship
9
0-open 4
8
4
Family Within 25 miles*
8 0-open
Church Involvement
2
0-365
1
2
2
Parental Involvement in
Youth Organizations
4 0-4 1
4
4
Socialize Outside Family 3
0-312
1
3
3
Internal
Parent-Child Time Together
6
4-38 1
6
6
Cannitment to Family
3
0-15
1
3
3
Encourage Independence
3
0-21 1
3
3
Marital Conflict
5
0-5
1
5
5
Parental Depression
12
0-12 1
12
12
* Treated as a sumnary index, not a scale.
C:\BOA10B\FACTOR1.14V on HD 9 TS, 6-23-93
4 3
REST COPY AVAILABLE

NSFH
Table II
Measurement Reliability by Family Type: Cronbach's Alpha (Unstandardized)
Index
All
Family
Types
Major Family Type
Sex and Biological/Step Status
of Married Adult Respondent
Divorced/
Separated
Female
Head
Never-
Married
Female
Head
Single
Male
Head
Married,
Both Bio
Parents
Married,
Bio+Step
Parents
Married,
Married,
Married,
Married, Bio+Step
Bio+Step
Both Bio
Both Bio Bio-
Step-
Male R
Female R
Female R
Male R
Adolescent Outcome Measures
Behavior Problems 1
.66 .70
.67
.66
.61
.64
.57
.63
.58
.73
Behavior Problems II
.62
.63 .58
.65
.48
.64
.44
.50
.66
.68
Parent-Child Conflict
.72
.74
.74
.73
.69
.72 .73
.66 .69 .75
Family Functioning Measures
External
Family Friendship
.60
.52
.48 .56
.66 .51
.67
.64
.34
.69
Family Within 25 miles*
Church Involvement
.62 .66
.66
.48
.56
.68
.60
.54
.67
.72
Parental Involvement in
Youth Organizations .63
.68 .57 .60
.61
.62 .61
.61
.56
.67
Socialize Outside Family .44 .34
.32 .38
.51
.42 .57 .46 .34
.61
Internal
Parent-Child Time Together
.72
.73
.69
.72
.71 .77
.66
.71 .69
.80
Commitment to Family
.54 .47
.42
.44
.54
.54
.54
.51
.56
.49
Encourage Independence
.61 .60
.69
.70
.60
.60 .63
.57
.58
.67
Marital Conflict
.71
.70
.14 .66
.72 .77
.71
Parental Depression
.89
.89
.87 .89 .88 .87
.90
.87 .87
.82
Sample Size Range
Minimum
1,100
394
56 82 704
289
305
399 137
87
Maximum
2,463
567
103 113
1,118
432 480
638
209
131
* Treated as a summary index, not a scale.
C:\BOA10B\ALPHAS3.WP on HD 9E., 6-23-93
BEST COPY
AVAILABLE

NSFII
Table III
Correlation Coefficients between Family Strength Measures:
Pearson's Who
Parental
Involve-
ment in
Parent-
family Family Church
Youth
Socialize
Child Conmit-
Encourage
Friend- Within
Involve- Organiz- Outside
Time ment to
Independ- Marital
Parental
Index
ship
25 Miles ment ations
Family
Together
Family ence
Conflict
Depression
Family Functioning Measures
External
Family Friendship
1.00
Family Within 25 miles
.27*** 1.00
Church Involvement
.07***
-.02 1.00
Parental Involvement in
Youth Organizations
.04+ -.01
.20***
1.00
Socialize Outside Family
internal
.07**
-.02
.05*
.08***
1.00
Parent-Child Time Together
.05**
.00
.11***
.25*** .09***
1.00
Conniitment to Family
.17*** .05+
.15*** .06** -.03
.03 1.00
Encourage Independence
.07***
.02
.00 .07** .07
.08***
.02
1.00
Marital Conflict
-.05+
.06*
-.02
.02
.07
-.02
-.13***
-.04+ 1.00
Parental Depression
-.05**
.03 .01
.00 .05
.03
-.02
.01
.22***
1.00
BEST COPY AVAILABLE
Legend:
+
s.10
*
s.05
**
s.01
***
s.001
C:\80A10B\CORR1.WP on HD 9 TS, 6-23-93
4, 4
45

NSFII
Table IV
Mean Values for Adolescent Outcome and Faintly Functioning Indices, by Family Type (Weighted)
Index
All
Family
Types
Major Family Type
Sex and Biological/Step Status
of Married Adult Respondent
Divorced/
Separated
Female
Head
Never-
Married
Female
Head
Single
Male
Head
Married,
Both Bio.
Parents
Married,
Bio+Step
Parents
Married,
Both Bio
Male R
Married,
Both Bio
Female R
Married,
Bio+Step
Bio-
Female R
Married,
Blo+Step
Step-
Male R
Adolescent Outcome Measures
Behavior Problems I
10.00
10.62 10.25
10.00
9.79 10.58
9.70 9.87
10.60 10.75
Behavior Problems II
.41 .77 .55 .57
.28
.54
.26
.31
.68 .39
Parent-Child Conflict
1.50
1.91
1.96
1.49 1.37
1.75 1.23 1.50
1.95
1.50
Family Functioning Measures
External
Family Friendship
3.88
3.09
3.63 3.73
4.05 3.80
4.21
3.91 3.61 3.95
Family Within 25 miles
2.72
2.19 3.39 2.46
2.84 2.76
3.22
2.48
2.77
2.74
Church Involvement
49.65 45.70 44.65 32.19
52.50 42.12
46.11
58.40
48.54
36.77
Parental Involvement in
Youth Organizations
1.12
.81 .73 .71
1.23 1.02
1.22 1.24
.99
1.03
Socialize Outside Family
42.13
54.73 51.57 68.04
39.63 37.86
40.29 38.99
39.98
38.00
Internal
Parent-Child Time Together
22.78
23.07 23.72
22.08
22.84 22.33
21.02 24.53
24.23
18.85
Commitment to Family
10.51
9.49 9.75 10.55
10.86
9.79
11.38 10.39
9.41
10.24
Encourage Independence
17.59
18.05 17.85 17.44
17.56 17.44
17.37 17.73
17.73
17.16
Marital Conflict
1.00
.97
1.21
.95
.99
1.28
1.22
Parental Depression
.74
1.11
1.46
1.09
.61 .93
.54 .68
1.11
.72
BEST COPY AVAILABLE
C:\BOA100\MEANEWP on HD 9 TS, 6-23-93
4 S
47

HSFII
Table V
Correlations Between Fiunily Functioning Measures and Adolescent Outcomes
All
Family
Page 1
of 3:
Behavior Problems I
Major Family Type
Divorced/
Separated
Female
(lever-
Married
Female
Single
Male
Married,
Both Rio.
Married,
Bio+Step
Index Types
Head Head
Head
Parents Parents
Family Functioning Measures
External
Family Friendship
-.05*
-.04 .13 .15
-.10** .02
Family Within 25 miles
-.01
.00
.26+
-.12
-.03** .01
Church Involvement
-.041
-.03
.11
-.00
-.02 -.05
Parental Involvement in
Youth Organizations
-.10*** -.09+ -.10 -.22*
-.09* -.04
Socialize Outside Family
.01
.00 .29* -.16
.00
-.01
Internal
Parent-Child Time Together -.11***
-.15** .19 -.29**
-.08* -.06
Commitment to Family
-.07"
-.06 .09 -.06
-.08*
.05
Encourage Independence
-.09***
-.04
-.12 -.23*
-.07+
-.20***
Marital Conflict
.28***
.28***
.28***
Parental Depression .12***
.08 .43*** .10
.15*** -.00
Sample Size Range
Minimum
1,103
394 56 28
706 289
Maximum
1,807
463 72 92
837 315
Legend:
+
s.10
*
s.05
**
5.01
***
s.001
C:\BOA10B\CORR2-1.WP on HD 9 1S, 6-24-93
4 a
BAST Cc)?\'! AVNLADLE
Sex and Biological/Step Status
of Married Adult Respondent
Married,
Married,
Married,
Married,
Bio+Step
Bio+Step
Both Rio
Both Bio
Bio-
Step-
Male R
Female R
Female R
Male R
-.12*
-.09+
.13
.03
.07
-.09* .14+
.01
-.01
-.03 -.01
-.09
-.09+
-.09+ -.03
-.02
-.03
.03
.00
-;09
-.09+
-.10* -.06
-.03
-.11* -.05
.15+
.06
-.10+
-.04
-.15+
-.24*
.31***
.26***
.26**
.29**
.18***
.13** .13
-.11
306
400
137
87
354 483
151
97

NSF11
Table V
Correlations Between Family Functioning Measures and Adolescent Outcomes
All
Family
Page 2 of 3:
Behavior Problems II
Mador Family Type
Sex and Biological/Step Status
of Married Adult Respondent
Divorced/
Separated
Female
Never-
Married
Single
Married,
Female
Male
Both Rio.
Married,
Bio+Step
Married,
Both Bio
Married,
Both Bio
Married,
Bio+Step
Bio-
Married,
Bio+Step
Step-
Index
lypes
Head Head
Head
Parents Parents
Male R Female R
Female R
Male R
Family Functioning Measures
External
Family Friendship
-.07*** -.10*
-.10 -.11
-.00 -.02
-.00 -.00
.01
-.01
Family Within 25 miles
-.04** -.05
-.01 -.11
.00 -.02
.03 -.01
-.04 -.03
Church Involvement
-.09***
-.08+
-.07
-.08 -.09**
-.04
-.10*
-.09*
-.06
-.08
Parental Involvement in
Youth Organizations
-.11***
-.09*
.05
-.09 -.10**
-.10+
-.03
-.15*** -.02 -.12
Socialize Outside Family
.04**
.04
.06 -.13
.02 .04
.01 .02
.10
-.06
Internal
Parent-Child Time Together
-.11***
-.17***
.08
-.13
-JO*" -.02
-.09+ -.13**
-.10 -.12
Commitment to Family
-.12***
-.14***
-.02 -.20*
-.08** .02
-.01 -.12**
.08
.11
Encourage Independence
-.02
-.04
.12
.06
-.01 -.13*
.01 -.02
-.16*
-.24**
Marital Conflict
.08**
.11***
.04 .08+ .13**
.03
.08
Parental Depression
.06** -.01
.14
-.05
.08* .06
.06
.09* .02 -.03
Sample Size Range
Minimum
1,488
489 80 101
955
387 410 545 187
116
Maximum
2,463
567 103 113
1,118
432
480 638 209
131
Legend:
+
s.10
*
s.05
**
s.01
***
s.001
C:\BOA1OB\C0RR2-2.WP on HD 9 TS, 6-24-93
50
BEST COPY AVAILABLE

NS111
lable V
Correlations Between Family Functioning Measures and Adolescent Outcomes
All
Family
Page 3 of 3:
Parent/Child Conflict
Major Family Type
Divorced/
Separated
Female
Never-
Married
Female
Single
Male
Married,
Both Rio.
Married,
Bio+Step
Index Types Head
(lead Head
Parents
Parents
Family Functioning Measures
External
Family Friendship
-.10***
-.08+
.17 -.11 -.13***
.01
Family Within 25 miles -.02
-.02
.08 -.08
-.03 .10t
Church Involvement
-.04+
-.06 -.14 .01
-.04 .04
Parental Involvement in
Youth Organizations
-.02
.02
.05
.02
-.04 -.02
Socialize Outside Family .07**
.09t .17
-.II
.05 .11+
Internal
Parent-Child Time Together -.01
-.05 -.05 .01
-.02 .08
Caonitment to Family -.12***
-.07 .01 -.14
-.13*** -.06
Encourage Independence
-.07**
-.11* .04 -.21i -.061
-.08
Marital Conflict
.35***
.36***
.34***
Parental Depression
.14***
.08
.28 .26
.19*** .01
Sample Size Range
Minimum
1,100
394 56 82
704
289
Maximum
1,883
463
71 92
835
314
Legend:
+
1.10
*
1.05
**
1.01
***
1.001
C:\O0A10B\CORR2-3.WP on III) 9 TS, 6-24-93
BEST COPY AVAILABLE
Sex and Biological/Step Status
of Married Adult Respondent
Married,
Married,
Married,
Married,
Bio+Step Bio+Step
Both Bio
Both Bio
Bio-
Step-
Male R
Female R
Female R
Male R
-.14'
-.12** .14'
-.05
.04 -.07
.22**
-.00
-.09+ -.03
.14i
-.08
-.06
-.02 .04
-.05
-.03
.10* .23**
-.01
-.03
-.05
.06
.06
-.08
-.14** .06
-.10
-.13*
-.01 .01
-.08
.35***
.37***
.37***
.29**
.14*
.22***
.01
-.02
305 399 137
87
353 482
151
96
Q". r"),
td tJ

MSFH
Table VI
Family Functioning and Adolescent Behavior Problems:
Full Sample Models
Page 1 of 3: Behavior Problems I
Independent Variable
Model 1
Model 2
Model 3
Model 4
Model 5
Socio-Oemographic Controls
Family Noe
Divorces /Sep. Female Heaa .651*** .536**
.753***
.656***
.615**
Never-Married Female Heaa
.562+
.597
.809*
.701+
.607+
Single Male Head .437
.581+ .824** .693*
.610+
Step-Family .771*** .633***
Two-bio, High Conflict
.950*** .952***
.880***
Step, High Conflict 1.280*** 1.362***
1.323***
Step, Low Conflict
.559** .515**
.499*
Sex of Child
-.062
-.034
-.039
-.036
male
Age of Child
-.002 -.028 -.039
-.039
Sex of Resoonoent
Male
-.077
-.170
-.149
-.121
Age of Respondent
-.034**
-.035***
-.037***
-.036***
Race /Ethnicity of Respondent
Black
-.758*** -.722*** -.640***
-.630***
Hispanic
-.353
-.220
-.230
-.213
Other -.484
-.424
-.367
-.399
Total Income
Amount
-.004**
-.004*
-.004**
-.004*
Imputed -.075
-.092
-.090
-.082
Combined Parental Education
.252 .168 .179
.187
riion-Scnoot Graa or Above
Public Assistance (Amount)
.191***
.197*** .193***
.185***
Number of Persons in Household
.125*
.120*
.124*
.120'
External Family Functioning
Family Frienaship
-.011
-.008
Family within 25 miles
-.024 -.028
Church Involvement
-.000
-.000
Parental Involvement in
Youth Organizations
Level of Involvement
-.133*
-.141*
Imputed
.172 .178
Socialize Outside Family
.000 .000
Internal Family Functioning
Parent-Child Time Together
-.034***
-.029**
-.030**
Commitment to Family
-.039
-.032
-.034
Encourage Independence
-.075**
-.072** -.070**
Parental Deoression
.103**
R-squared (Unadjusted)
.022
.057
.110 .116 .121
Legena:
,
1.10
* =.05
** 1.01
*** =.001
C:\BOA10B\REG1-1.WP on HD 9 TS, 6 -23-93
BEST COPY AVAILABLE:

NSFH
Table VI
Family Functioning and Adolescent Behavior Problems:
Full Sample Models
Page 2 of 3:
Behavior Problems II
Independent Variable Model 1
Model 2
Model 3
Model 4
Model 5
Socio-Benographic Controls
Family Type
Divorcea/Sep. Female Heaa .410***
.391***
.397***
.365***
.360***
Never-Married Female Heaa
.310** .386***
.390***
.345**
.339**
Single Male Head .448***
.434*** .458***
.427***
.420***
Step-Family
.229*** .209***
Two-bio, High Conflict
.122+ .121+
.114+
Step, High Conflict
.333***
.326***
.320***
Step, Low Conflict
.165*
.156*
.153*
Sex of Child
Male
.204***
.215*** .216***
.216***
Age of Child
.047*** .040***
.038**
.038***
Sex of Respondent
-.063
-.064
-.076
-.074
male
Age of Respondent
-.003
-.003 -.002
-.002
Race/Ethnicity of Respondent
-.177**
-.172**
-.148*
-.147*
31acx
Hispanic
-.142+
-.112
-.129
-.127
Other
.155 .175
.196
.194
Total Income
Amount
-.000
-.000 -.000
-.000
Imoutea
.113*
.109+
.108+
.109+
Combinea Parental Education
Hign-Scnool .,1rao or Above
-.045
-.069 -.055
-.053
Public Assistance (Amount)
-.018
-.015 -.015
-.016
Number of Persons in Housenoid
-.010
-.004 -.001
-.001**
External Family Functioning
Family Frienasnip
-.003
-.003
Family Within 25 miles
.001
.001
Church Involvement
-.001*
-.001*
Parental Involvement in
Youth Organizations
Level of involvement
-.028 -.028
Imputed
.137
.137
Socialize Outside Family
.001
.001
Internal Family Functioning
Parent-Child Time Together
-.008**
-.006*
-.006*
Commitment to Family
-.028**
-.024**
-.024**
Encouraae Independence
-.010
-.010
-.010
Parental Depression
.009
R-squared (Unadjusted)
.042 .077
.091
.098
.098
Legend:
+ :5.10
* 11.05
- .01
*** ts .001
C:\BOA10111\REG1-2.WP on HO 9 TS, 0 -23-93
BEST COPY AVAILABLE

!ISFH
Table VI
Family Functioning and Adolescent Behavior Problems:
Full Sample Models
Page 3 of 3:
Parent/Child Conflict
Independent Variable
Model 1
Model 2
Model 3
Socio-Demographic Controls
Family Type
.482***
.344**
.590***
0ivorcea/Sep. Female Heaa
Never-Married Female Heaa
.357
.296 .547*
Single Male Head
.210 .373+
.599**
Step-Family
.282*
.156
Two-bio, High Conflict
.951***
Step, High Conflict
1.120***
Step, Low Conflict
.133
Sex of Child
Male
.358 * **
.382***
Age of Child
-.040+
-.043+
Sex of Respondent
Male
-.254* -.246*
Age of Responaent
-.023**
-.020**
Race/Ethnicity of Respondent
Black
-.298*
-.292*
Hispanic
-.357*
-.281+
Other
-.532
-.621
Total Income
Amount
-.002+ -.002
Imputed
-.102
-.088
Combined Parental Education
Hign-Scnooi Graa or Above
.375** .311*
Public Assistance (Amount)
.050
.056
lumber of Persons in Housenold
.069*
.054
External Family Functioning
Family Frienasnip
Family Within 25 miles
Church Involvement
Parental Involvement in
Youth Oraanizations
Level of involvement
Imputed
Socialize Outside Family
Internal Family Functioning
Parent-Child Time Together
-.007
Commitment to Family
-.038*
Encourage Independence
-.039*
Parental Depression
R-squared (Unadjusted)
.016
.072
.131
Legend:
5.10
*
5.05
ter
.01
***
.001
C:\BOA10El\REG1-3.WP on HO 9 TS, 6-23-93
Model 4
Model 5
.518***
.485***
.474+
.398
.495*
.428*
.931***
.873***
1.108***
1.077***
.114
.101
.383***
.386***
-.047*
-.048*
-.260*
-.237*
-.017*
-.017*
-.244*
-.235+
-.235
-.221
-.601
-.627
-.002+
-.002
-.077
-.072
.330*
.337*
.063+
.057
.058+
.055
-.012
-.009
-.001
-.004
-.001
-.001
-.037
-.043
-.218
-.213
.002+
.002+
-.005
-.006
-.031
-.033+
-.038*
-.037*
.084***
.137
.145
BEST COPY AVAILABLE
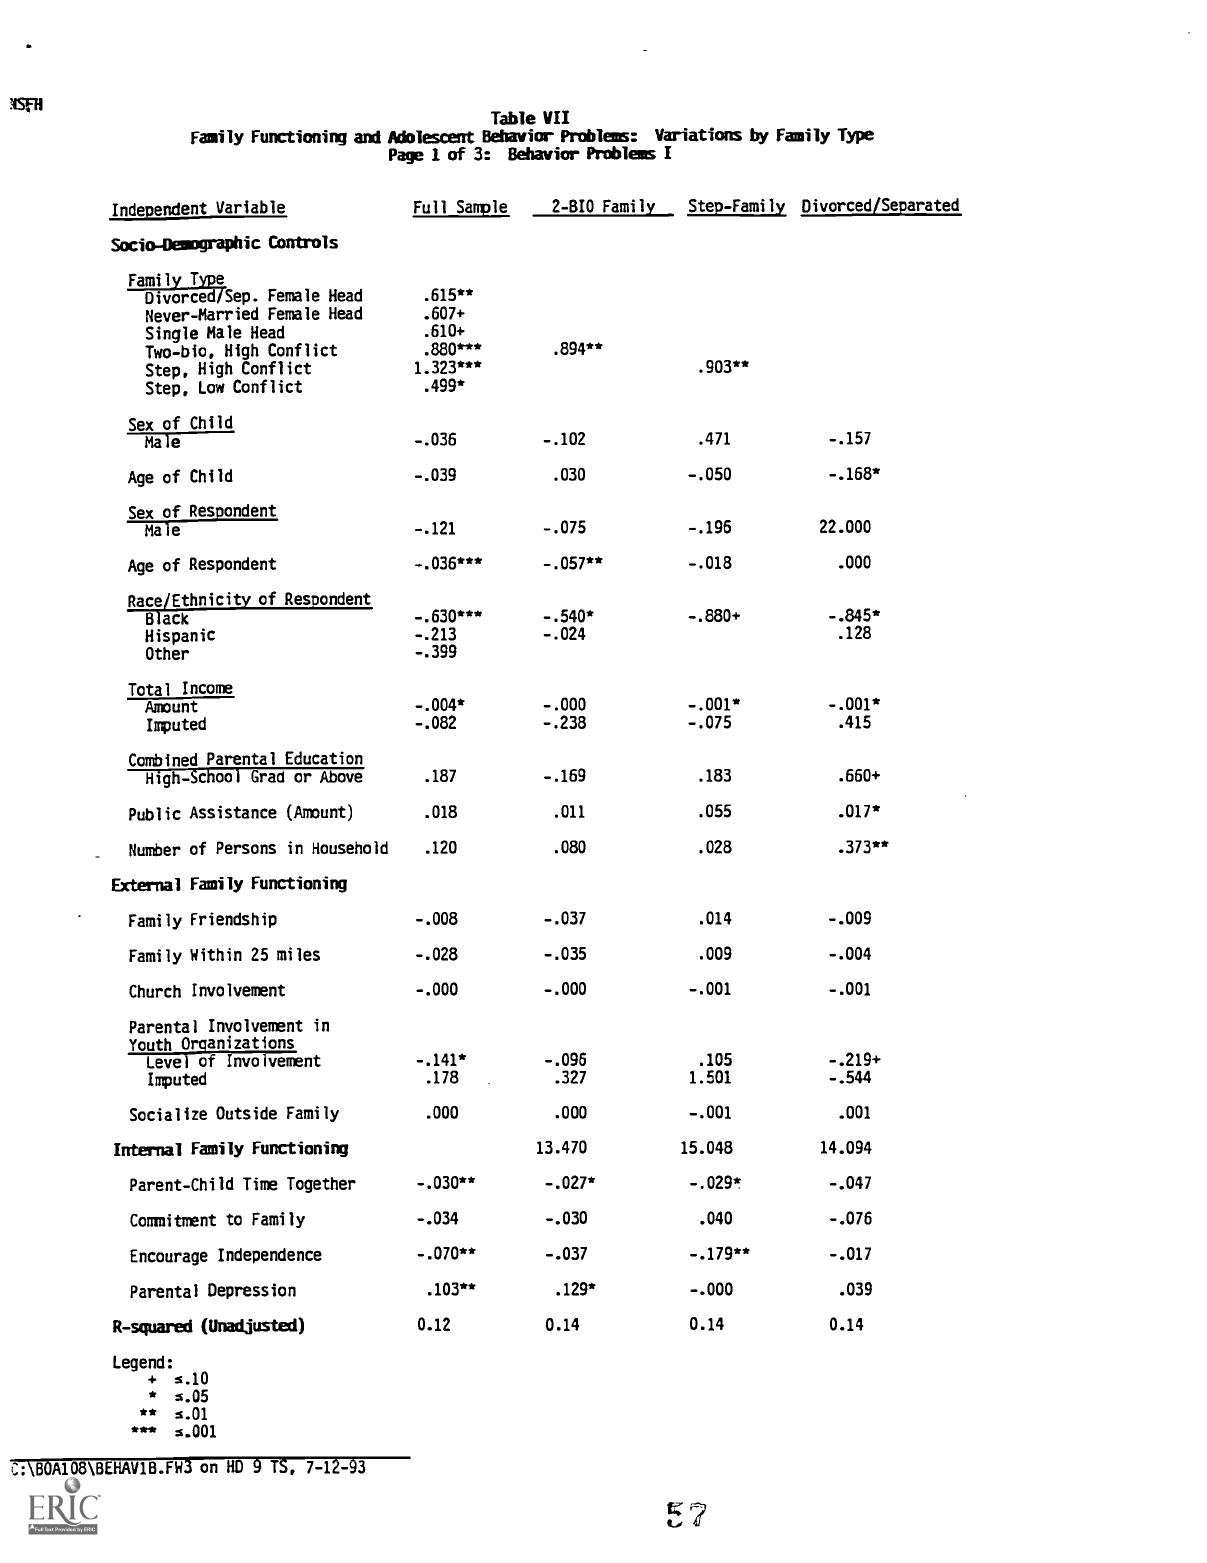
Table VII
Family Functioning and Adolescent Behavior Problems:
Variations by Family Type
Page 1 of 3:
Behavior Problems I
Independent Variable
Full Sample
2 -BID Family
Step-Family
Divorced/Separated
Socio4Demographic Controls
Family Type
Divorced/Sep. Female Head
.615**
Never-Married Female Head
.607+
Single Male Head
.610+
Two-bio, High Conflict
.880***
.894**
Step. High Conflict
1.323***
.903**
Step, Low Conflict
.499*
Sex of Child
-.036
-.102
.471
-.157
Ma e
Age of Child
-.039
.030
-.050
-.168*
Sex of Respondent
-.121 -.075
-.196
22.000
Male
Age of Respondent
-.036*** -.057**
-.018
.000
Race/Ethnicity of Respondent
Black
-.630***
-.540*
-.880+ -.845*
Hispanic
-.213
-.024 .128
Other
-.399
Total Income
Amount
-.004* -.000
-.001*
-.001*
Imputed
-.082 -.238
-.075 .415
Combined Parental Education
.187
-.169
.183 .660+
High-School Grad or Above
Public Assistance (Amount)
.018
.011 .055 .017*
Number of Persons in Household
.120
.080 .028 .373**
External Family Functioning
Family Friendship
-.008
-.037 .014 -.009
Family Within 25 miles
-.028 -.035 .009
-.004
Church Involvement
-.000
-.000
-.001
-.001
Parental Involvement in
Youth Organizations
Level of Involvement
-.141*
-.096 .105 -.219+
Imputed
.178
.327 1.501 -.544
Socialize Outside Family
.000 .000
-.001
.001
Internal Family Functioning
13.470 15.048
14.094
Parent-Child Time Together
-.030**
-.027*
-.029* -.047
Commitment to Family
-.034
-.030
.040 -.076
Encourage Independence
-.070**
-.037 -.179** -.017
Parental Depression
.103** .129*
-.000
.039
R-squared (Unadjusted)
0.12
0.14
0.14
0.14
Legend:
+
s.10
*
s.05
**
s.01
+,,,,
s.001
C:\BOA108\BEHAV1B.FW3 on HD 9 TS. 7-12-93

SRI
Table VII
Family Functioning and Adolescent Behavior Problems:
Variations by Family Type
Page 2 of 3:
Behavior Problems II
Independent Variable
Full Sample
2-810 Family
Step-Family
Divorced/Separated
Socio4lemographic Controls
Family Type
;ivorcea/Seo. Female Head
.350***
Never-Married Female Head .339**
Single Male Head
.420*"
Two-bio, High Conflict
.114+
.105*
Step. High Conflict .320***
.242*
Step. Low Conflict .153*
Sex of Child
.216*** .138***
.345***
.240*
;Iale
Age of Child
.038**
.024*
.064* .028
Sex of Respondent
-.074
-.037
-.207+
:laie
Age of Respondent
-.002 -.006
.008 .012
RaceiEthnicity of Respondent
-.147*
-.045
-.137
-.230+
3lacx
Hispanic
.127
-.096
-.284
.010
Other .194
Total Income
Amount
-.046
-.044
-.000
.000
Imputea
.109+
.038.
.042
.466**
Combined Parental E2.:cation
-.053 -.164* -.078
.038
sign-Scnool Graa
:-..... Above
Public Assistance (Amount)
-.002
-.002
-.003
.000
Number of Persons in Household -.001
.002
-.067
.073+
External Family Functioning
Family Friendship
-.003 .006
-.002
-.023
Family Within 25 miles
.001 .001
-.002
-.001
Church Involvement
-.001'
-.000
-.001
-.001
Parental Involvement in
Youth Organizations
Level or involvement
-.028
-.021
-.081+
-.009
Imputed
.137
-.195*
.225 .517*
Socialize Outside Family
.001
.000
.002
.001
Internal Family Functioning
Parent-Child Time Tcaether
-.006* -.008*
.009
-.017*
Commitment to Family
-.024**
-.024*
.033
-.050*
Encourage Independence
-.010 -.008
-.040*
-.004
Parental Depression
.009 .013
.019
.002
R-squared (Unadjusted)
0.10 0.07
0.12
0.12
Legend:
+
s.10
* s.05
** s.01
S.001
:.,60A108\8EHAV28.FW3 on HO 9 TS. J-12-93
1~8
BEST COPY AVAILABLE

ISM
Table VII
Family Functioning and Adolescent Behavior Problems:
Variations by Family Type
Page 3 of 3:
Parent/Child Conflict
Inaepenaent Variable
Full Sample
2 -810 Family,
Step-Family Divorced/Separated
Socio-lAmmigraphic Controls
renily Type
jiyorcea/Secl. Female Head
.;85***
lever-Marriea Female Heaa
.398
S!ngie Male Head
.128
"do-oio, High Conflict
.373*
.338***
Step. Hign Conflict
1.077***
1.121**
Step, Low Conflict
.101***
Sex of Child
.336***
.298*** .152
.312"*
:Tale
;ge of Child
-.048*
-.059+
-.047
-.036
Sex of Despondent
-.237
-.1_18+
-.334
-.016
:.!ale
4ge of Resoonaent
-.017
-.J15
-.012
:ace/Ethnicity of Pesponaent
-.235 -.391
-.423
-.215
5iacx
'-iisoanic
-.221
-.063
.717
-.519
Other -.527
7otal
'!-Icome
-.300
-.300
-.012
-.001
;mount
1moutea
-.372
-.128 -.170
.029
":cmoinea Parental Education
.337"
.214
.538+
.418
lign-cnool Grad or ,,,pove
:ubiic Assistance (Amount)
.006
.303
.015
-.001
'lumoer of Persons in Housenoid
.055
.321
-.087
.265**
External Family Functioning
Family Frienasnio -.009
-.331+
.023
-.037
Family Within 25 miles
-.004
-.007
.051
-.050
Churcn involvement
-.001
-.001
-.001
-.001
Parental Involvement in
voutn Organizations
-.043
-.076
.006
.022
_eves or involvement
:mputea
-.213 .016
-.211
-.320
Socialize Outside Family
.002.
.300
.004+
.003+
Internal Family Functioning
Parent-Child Time Toaetner
-.006
-.015+
.016
.001
Commitment to Family
-.033+
-.032
.011
-.026
Encouraae Inclepermence
-.037* -.322
-.019
-.098**
Parental Depression .084***
.131"*
-.051
.021
R-squared (Unadjusted)
0.14
0.18
0.17
0.16
Leaena:
.:.80AIMPARENT3.FW3 on HO 9 TS.
:-25-93
BEST COPY AVAILABLE

(9/92)
U.S. DEPARTMENT OF EDUCATION
Office of Educational Research and Improvement (OERI)
Educational Resources Information Center (ERIC)
NOTICE
REPRODUCTION BASIS
ERIC
This document is covered by a signed "Reproduction Release
(Blanket)" form (on file within the ERIC system), encompassing all
or classes of documents from its source organization and, therefore,
does not require a "Specific Document" Release form.
This document is Federally-funded, or carries its own permission to
reproduce, or is otherwise in the public domain and, therefore, may
be reproduced by ERIC without a signed Reproduction Release
form (either "Specific Document" or "Blanket").
Psoab
