
United States
Department of
Agriculture
Forest Service
Forest
Products
Laboratory
Research
Paper
FPL 462
The Moisture-
Excluding
Effectiveness
of Finishes
on Wood Surfaces
William C. Feist
James K. Little
Jill M. Wennesheimer

Abstract
Permeability to water vapor is one of the more important
properties affecting the performance of coatings and other
wood finishes. Often, one of the main purposes of finishing
wood is to restrict moisture movement from the
surroundings. We evaluated the moisture-excluding
effectiveness (MEE) of 91 finishes on ponderosa pine
sapwood, using the Forest Products Laboratory method in
which finished and unfinished wood specimens in equilibrium
with 30 percent relative humidity (RH) at 80 °F are weighed
before and after exposure to 90 percent RH at 80 °F.
Finishes with the best MEE were pigmented, nonaqueous
(solvent-borne) finishes. Two-component epoxy paint
systems had MEE values greater than 85 percent after
14 days when three coats were put on the wood. Molten
paraffin wax and a sheathing grade, two-component epoxy
material with no solvent were the very best finishes found in
this study for controlling moisture vapor movement into
wood. The MEE is a direct function of the number of coats
of finish applied to the wood (film thickness) and the length
of time of exposure to a particular humidity. Only 11 finishes
were found to retard moisture vapor movement into wood
with any degree of success over the relatively short time of
14 days, and then only when two or three coats were
applied.
These studies include evaluations of MEE by finish type,
number of coats, substrate type, sample size, and time of
exposure, and describe the effect on MEE of repeated
adsorption/desorption cycles.
This paper should be useful to builders, architects, wood
furniture manufacturers, those who make wood finish
formulations, and anyone else interested in controlling water
vapor movement into or out of wood. The information will
benefit those who need to select wood finishes with specific
moisture-excluding effectiveness.
Keywords: Water vapor, moisture exclusion, paints, coatings,
wood finishes, adsorption, desorption.
December 1985
Feist, William C.; Little, James K.; Wennesheimer, Jill M. The moisture
excluding effectiveness of finishes on wood surfaces. Res. Pap. FPL 462
Madison, WI: U.S. Department of Agriculture, Forest Service, Forest
Products Laboratory; 1985. 38 p.
A limited number of free copies of this publication are available to the public
from the Forest Products Laboratory, One Gifford Pinchot Drive, Madison, WI
53705-2398. Laboratory publications are sent to over 1,000 libraries in the
United States and elsewhere.
The Laboratory is maintained in cooperation with the University of Wisconsin.

United States
Department of
Agriculture
Forest Service
Forest
Products
Laboratory
Errata
The Moisture-
Excluding
Effectiveness
of Finishes
on Wood Surfaces
Research
Paper
FPL 462 Errata
January 1986
The two figures on page 37 are reversed.
That is, the figure shown with the
caption labeled "Figure 11"
should be with the caption labeled "Figure 12,"
and the figure shown with the caption labeled “Figure 12" should be with the
caption labeled "Figure 11."
Feist, William C.; Little, James K.; Wennesheimer,
Jill M. The moisture-excluding effectiveness of
finishes on wood surfaces. Res. Pap. FPL 462.
Madison, WI: U.S. Department of Agriculture, Forest
Service, Forest Products Laboratory, 1985. 38 p.

Contents
Earlier Work
....................................
Evaluation Method
..............................
Moisture-Excluding Effectiveness (MEE)
.........
Finishes
......................................
MEE of Finishes on Standard Wood Specimens
Results and Discussion
..........................
MEE of Wood Finishes
........................
MEE and Finish Characteristics
.................
MEE and Film Thickness (number of coats of
finish)
......................................
MEE of Aluminum Flake-Pigmented Varnish
.....
MEE of Combination Finishes
..................
MEE of Paraffin Wax Treatments
...............
MEE for Brush vs. Dip Application
..............
MEE of Wood Finishes as a Function of Repeated
Adsorption/Desorption Cycles
................
MEE and the Role of the Substrate
.............
Test Procedures, Materials, Methods
............
Specimens
.................................
Finishes
...................................
Equipment
.................................
Methods
...................................
Tests
......................................
Summary and Conclusions
......................
Literature Cited
................................
Appendix A-Description of Wood Finishes Used in
These MEE Studies
...........................
Appendix S-Composition of Finishes
.............
Appendix C-Adjustment of MEE Values for Wood
Density
. . . . . . . . . . . . . . . . . . . . . . . . . . . . . . . . . . . . . .
Page
2
2
2
3
3
10
10
10
14
16
17
18
19
19
23
26
26
27
27
28
29
29
31
33
34
36
i

The Moisture-
Excluding
Effectiveness
of Finishes
on Wood Surfaces
William C. Feist, Supervisory Research Chemist
James K. Little, Mathematical Statistician
Jill M. Wennesheimer, Physical Science Technician
Forest Products Laboratory, Madison, WI
The primary objective of the work reported here was to
measure the moisture-excluding effectiveness of a wide
range of commercially available surface treatments and
finishes on wood. We studied the important variables of film
thickness, wood species and substrates (plywood,
hardboard, flakeboard, etc.), and time. Our studies were
restricted to the measurement of the effectiveness of
finishes on wood against water vapor between 30 and
90 percent relative humidity (RH) at 80 °F.
Data in the tables and Appendices of this report have been
condensed as far as possible for the convenience of the
reader. Complete data and descriptions of the finishes used
can be obtained by contacting the U.S. Department of
Commerce, National Technical Information Service (NTIS),
5285 Port Royal Road, Springfield, VA 22161 (phone: (703)
487-4650 or (703) 487-4700 (RUSH)). The information is
listed with NTIS by the same authors under the title: ‘The
moisture-excluding effectiveness of finishes on wood
surfaces-support data”(8
).
a
Water is a prime factor in the environment of many finished
products and permeability to water (as liquid or vapor) is
therefore a property of major importance in most finish
applications, protective or decorative. With metal substrates,
the usual aim in applying a coating (finish) is to protect
against wet corrosion; with masonry and other porous
inorganic structures, coatings are applied to minimize water
seepage and “breathing” of moisture vapor; with wood
substrates, the protective function of coatings and other
finishes is to minimize deterioration of the underlying
structure by the combined action of moisture, sunlight,
oxygen and microorganisms.
a
Italicized numbers in parentheses refer to literature cited at the end of this
report.
Moisture affects the shrinking and swelling of wood (
22,25
);
a coating on wood therefore serves a desirable function if it
controls moisture sorption by the wood. Although paints and
other coatings (hereafter called finishes) have many other
important functions and properties, an understanding of the
moisture-excluding effectiveness (MEE) of finishes and its
measurement is essential because of the importance of
dimensional stability to many wood applications, both
indoors and outdoors.

Earlier Work
Evaluation Method
It has long been recognized that coatings of paint and other
finishes can prevent rapid changes in the moisture content
(MC) of wood (
3,4,12,22,26,27
). The ability of finishes to
protect wood against weathering depends partly upon the
property of moisture exclusion (
6,7,11,15,18,19,23
).
Moisture exclusion is also a valuable property of many
interior finishes for wood (
1,10,14,26
).
Michaels (14) has shown that in homogeneous polymers
(such as paint resins), water permeability is governed by the
concurrent processes of water adsorption and diffusion,
which are determined by the polarity of the polymer, and
such polymer structural features as chain-stiffness,
crystallinity, and cross-link density. Low-polarity polymers of
high crystallinity, stiffness, and/or cross-linkage are the best
water-barriers. Fillers and pigments added to the polymer
films (i.e. paints) can significantly improve water-barrier
properties when the particles are properly dispersed and of
suitable size and shape. With latex-derived coatings,
moisture permeability is often high and is affected by the
composition and concentration of surfactants and stabilizers
in the latex.
Various methods are used to evaluate the moisture
permeability of finishes. Some methods use isolated films
(
1,5,10,14,28-30
). Others apply the finish directly to wood
(
3,4,12,15-21,23,24
). The Forest Products Laboratory
(FPL) method used in early investigations of moisture-proof
finishes (3,4,12,25 ) measured the moisture (water vapor)
gain of wood protected on all sides by the finish and
exposed to a controlled atmosphere of high humidity.
We used the FPL method in the studies reported in this
paper because it represents a “real world” situation under
non-steady-state conditions. The finishes to be evaluated
were applied by brush to selected specimens of clear
ponderosa pine (Pinus ponderosa) sapwood measuring
3 x 5 x 5/8 in. (tangential x longitudinal x radial
dimensions), and having carefully rounded edges and
corners (fig. 1). Three replicates were used. The specimens
were conditioned to 30 percent RH at 80 °F, finished with
the appropriate material, dried, and reconditioned at
30 percent RH and 80 °F to equilibrium. The specimens
were then weighed and exposed to 90 percent RH and
80 °F for various time periods. Each finished specimen was
accompanied by an end-matched, uncoated control
conditioned and handled in exactly the same way. All
specimens were weighed at appropriate intervals (1,7,14,
21 days and longer as needed). Complete experimental
details and methods are shown in the Test Procedures,
Materials, Methods section at the end of this publication.
Additional studies were conducted on other wood substrates.
Moisture-Excluding
Effectiveness (MEE)
The amount of moisture vapor passing through the finishes
and adsorbed by the wood was determined from the gain in
weight of the sample between 30 and 90 percent RH after
different intervals of exposure. The MEE against water vapor
for the various finishes was calculated by comparison with
the weight of moisture adsorbed by the uncoated panels
(3,4):
MEE =
U-C
x 100
U
where U = weight of moisture adsorbed by uncoated wood
C = weight of moisture adsorbed by finished wood.
Measurements are readily made by this method with a good
degree of accuracy. Furthermore, the experimental
conditions are such that the results express the combined
effect of the permeability of the finish and the adsorption
characteristics of the wood. However, even with careful
selection of the wood specimens, the possibility of natural
variation in wood structure and adsorption characteristics is
not removed. Variations in the adsorption characteristics of
the wood may not seriously affect the amounts of moisture
adsorbed by the finished specimens, but they do seriously
affect the MEE values. This is because MEE values are
based on the amount of moisture adsorbed by the uncoated
wood, and different bare wood specimens (the controls)
adsorb different amounts of moisture. This aspect of the test
is discussed in detail in the section entitled Effect of Density
of the Wood Specimen.
A further difficulty is that the conditions of the test for MEE
are empirical. As the wood approaches its fiber saturation
point the rate of diffusion of moisture through the finish
decreases (20,22), so that the longer the exposure to high
humidity, the lower is the apparent MEE of the finish. The
countervailing advantages of the test are that it does
2

represent service conditions of finished wood and does
MEE of Finishes on
reflect the degree of interaction between the substrate and
the finish and any stresses placed on the finish as the wood
Standard Wood Specimens
expands during wetting.
The MEE of the finishes selected for this study were
Finishes
determined for one, two, and three coats of each finish on
ponderosa pine clear sapwood between 30 and 90 percent
RH at 80 °F (table 1 and (
8
)). Values were determined after
For these studies we selected a wide range of commercially
1, 7, and 14 days. The test for MEE was continued beyond
available finishes and several laboratory prepared finishes
14 days until the observed value fell below 50 percent.
whose descriptions and compositions are summarized in
Since MEE changes with time, all MEE values are discussed
Appendices A and B, and given in detail in (
8
). For
in terms of the day of measurement (e.g. MEE
14
, stands for
convenience we grouped the selected finishes under a
the measurement at 14 days) and, unless specified
descriptive classification based on the suggested use and
otherwise, are the average of three determinations.
composition of the finishes (interior/exterior/combination,
pigmented/unpigmented and aqueous/nonaqueous) as set
out in Appendix A. The finishes were applied by brush. From
one to six coats were applied to the conditioned wood
surface. Several finishes were used in combinations.
Figure 1.—Ponderosa pine test specimen pairs in exposure rack.
3

---------------------------
Table 1.—Moisture–excluding effectiveness (MEE
t
) of finishes on ponderosa pine sapwood (after t days exposure at 90 pct
relative humidity, average of three replicates)
Number
Finish
a
of
Coverage Wood MEE
t
for—
coats 1 coat
2 coats 3 coats
density
t=1
t=7 t=14 t=21
t=28
t=35
t=60
-----------
Ft
2
/gal ----------- Lb/ft
3
Pct
---------------------------
EXTERIOR, UNPIGMENTED, NONAQUEOUS FINISHES
2
1
1 303
— — 24.8 48
6
–0 — — —
—
1
2
304
494 — 24.6 90
66 46 — —
—
—
1
3
303
517
510 24.9 94
81
6 6 58 47
——
————
1
408
— — 24.9
13
–0 –2
—
—
——
3
1 436
—
— 23.0
12
–0
–1
3
2 433
679
—
23.4 46
2
–1
——
——
——
3
3 408
729
868 21.5 78
27
11
——
——
4
1
320
— — 22.9 59
13 3
——
——
4
2 317
327 — 22.9 81
38
17
——
—
—
4
3 287
324
345
22.7 88
51
29
——
COMBINATION EXTERIOR/INTERIOR, UNPIGMENTED, NONAQUEOUS FINISHES
5
1
302
——
24.9
71
8
3
————
5
2
325
265
—
24.6 90
36
2
————
5
3
317
255
261
24.5 94
60
16
————
6
1 256
—
—
26.1
93
73
54 40
———
6
2
247 444
—
26.2
98
93
88
83
79 74
61
6
3 346
422
387 27.7
98
95
91
88
84
81
70
7
1 552
—
—
23.9
45
4
–1
—
———
7
2 546
791
—
23.5
79
32
15
—
———
7
3 526
789
948
23.8
87
51 31
—
———
8
1 529
—
—
22.2 34
0
–1
—
—
—
—
—
—
—
—
—
8
2 547
778
22.7 46
2
–1
8
3
580
750
844 22.8
52 6
2
—
—
—
—
9
1
325
——
24.5
58
10
2
————
9
2 349
497
—
24.6
87
53 33
————
9
3
354 537
400
25.4 95
78
63 52
———
10
1
355
—
—
25.2 28
1
–0
—
———
10
2
357
497
—
25.6
64
19
6
—
—
—
—
10
3
341
473 438 25.6 85
51
29
—
—
—
—
11
1
392
—
—
22.4
12
–4
–5
—
—
—
—
11
2
423
579
—
22.5 22 – 2
–4
—
—
—
—
11
3 532
603 872
24.1
33 2
–0
—
—
—
—
12
1
561
—
—
25.3 7 –1 –1
—
—
—
—
12
2 546
803
—
25.6
15
21
———
—
12
3
514
649
768 25.6
18
0–1
———
—
13
1 505
—
—
24.5 55
10 2
———
—
13
2
507
635
—
24.5 83
43 23
—
———
13
3 497
580 559 25.2 89 64 4 4
—
———
14
1
554
—
—
26.2 48
60
—
———
14
2 573
867
—
25.9 80 36 15
—
—
—
—
14
3 539 884
776 26.3 87 53
30
—
—
—
—
15
1
526
—
—
25.3 60 24
11
—
—
—
—
15
2
547
741
—
25.2 87 56
36
—
—
—
—
15
3
575
744 1016
24.5
89 63 44
—
———
16
1 518
—
—
24.7
56
11
2
—
———
16
2 545
626
—
24.6 84 46 27
—
—
—
—
16
3
570
635
936 24.5 88 58
37
—
—— —
Page 1 of 6 pages
4

-----------
---------------------------
Table 1.—Moisture–excluding effectiveness (MEE
t
) of finishes on ponderosa pine sapwood (after t days exposure at 90 pct
relative humidity, average of three replicates)–con.
Number
Finish
a
of
Coverage Wood
MEE
t
for–
coats
1 coat
2 coats
3 coats
density
t=1 t=7 t=14 t=21 t=28 t=35
t=60
Ft
2
/gal -----------
Lb/ft
3
Pct
---------------------------
INTERIOR, UNPIGMENTED, NONAQUEOUS FINISHES
17
1
—
—
—
22.6
-1 -1 - 1
—
—
——
18
1
382
—
—
23.3 40
4
1
—
—
—
—
18
2
390
451
—
23.1
70 22
8
—
—
—
—
18
3
380 460 392 23.4 79 37
19
—
—
——
19
1
616
——
23.5 52
8
3
—
—
—
—
19
2
630
781
—
24.0
81
38 18
—
—
—
—
19
3
635
708
922 24.8 87
53
31
———
—
20
1
512
——
25.7 35
6
2
——
——
20
2
532
706
—
26.3
78 39
21
—
—
—
—
20
3
522
708
758
25.3
86 53
31
—
——
—
21
1
573
——
22.4 77
18
4
—
—
——
21
2
608 639
—
23.0
89
49
21
—
—
—
—
21
3
627 626
647
22.4
93
65
36
—
—
—
—
22
1
457
—
—
25.7
59
9
2
—
——
—
22
2
474 580
—
25.6 86 47
25 —
—
—
—
22
3
416
651 631
25.7 91 67
46
—
—
—
—
23
1
405
—
—
23.4
65
11
3
—
—
—
—
23
2
469 509
—
23.6
84 43
20
—
—
—
—
23
3
422
515
480 24.4 91
63
42 —
——
—
24
1
552
——
26.0
54
11
3
—
———
24
2
505
683
—
22.5
87 54
34
——
—
—
24
3
487
695
729 22.4 92
69
50
37
—
—
—
25
1
576
——
22.5
31
1
-1
—
—
—
—
25
2
564
713
—
22.5 80
37
18
—
—— —
25
3
569 774
821
23.2
88
56
35
— ——
—
26
1
550
—
—
25.6
53
9
1
—
—
—
—
26
2
554
640
—
25.8
87 53
28
—
—
—
—
26
3
535
699
760 25.6
91
66
44
—
—
—
—
27
1
585
——
25.8
48
7
1
—
—
——
27
2
594 724
—
26.2 79
35
14
—
——
—
27
3
598
671
587
26.6
88
55
32
—
—
—
—
28
1
596
—
—
22.2
71
22
8
—
—
—
—
28
2
644 752
—
22.1
86
52
29
—
—
—
—
28
3
664 824
819
22.5
90
64 43
—
—
——
29
1
—
—
—
26.9
-1
0
0
—
—
—
—
29
2
—
—
—
26.9
-1 1
1—
——
—
29
3
—
—
—
26.5
2
1
0
—
—
—
—
30
1
330
—
—
21.8
97
83
69
60
52
46 27
31
1
416
——
23.1
-4
-6
-6
——
—
—
31
2
423 472
—
23.7
-1
-5
-5
—
—
—
—
31
3
477
466
673
24.4
2
-1
-2
—
—— —
32
1
—
—
—
22.3 6
-2
-2 —
—
——
32
2
—
—
—
23.5
11
-2 -3
—
—
—
—
32
3
—
—
—
23.9
17
-0
-1
———
—
33
1
503
—
—
24.4
24
3
1
—
——
—
33
2
507 688
—
24.0
77
33
13
—
—
—
—
33
3
483 734 802
24.3 85 52
31
—
—
—
—
—
34
1
644
—
27.3 66 20
8
—
—
——
—
34
2
597
831
26.4
85 49
27
—
—
—
—
34
3
632 846
734 25.9
90 63
41
—
—
——
—
—
35
1
360
24.4
58
15
7—
——
—
—
35
2
336
422
25.2
80
45
24
—
——
—
35
3
379 405
378 25.2
88
61
40
—
—
—
—
Page 2 of 6 pages
5

Table 1.—Moisture–excluding effectiveness (MEE
t
) of finishes on ponderosa pine sapwood (after t days exposure at 90 pct
relative humidity, average of three replicates)–con.
Number
Finish
a
of
Coverage
Wood
MEE
t
for–
coats
1 coat 2 coats
3 coats
density
t=1 t=7
t=14 t=21 t=28 t=35 t=60
-----------Ft
2
/gal-----------
LB/ft
3
----------------------------Pct----------------------------
INTERIOR, UNPIGMENTED, AQUEOUS FINISHES
36 1
485
— — 23.3
44
-1
-1
—
—
——
36 2
503
62
6
607 — 23.5
6
——
—
—
36 3
509
660
750 24.4
68 24
10
—
—
——
37
1
500
——
23.1
38 2 - 1
——
—
—
37 2 468
690
— 23.3
58
12 5
——
—
—
37 3 514 687 702 23.3
65
14
2
—
—
—
—
38 1 622
—
— 24.6
25
0
-1
—
—
—
—
38 2 624 862 — 27.4
61
11
3
—
—
—
—
38 3
570
783
795
24.1
70 22
11
——
—
—
39 1 463 — — 22.2
-1 -1 -1
—
—
—
—
39 2
466
597 — 21.6
5-3-3
——
—
—
39 3 456
25
640
811
21.0
-2 -4
—
—
—
—
EXTERIOR, PIGMENTED, NONAQUEOUS FINISHES
40
1 545
——
23.4 88 55 32
—
—
—
—
40
2 492
545
—
23.6
97
87
76
68 60
37
54
40 3
505 504
618 24.1 98
91
84 78 72
53
67
41 1 498
——
23.3 91 64 43
——
—
—
41
2
519
621
—
24.0 9 6 85 72
63 55
48
—
41
3
499
652
594
23.6
98 90
81
74
68
45
62
42 1
529
——
23.5
90 60 39
—
—
—
—
42 2
534
598
—
23.6
97 85 74
63 55
—
47
42
3
515
571
554
24.0 98
91
84 77
71
49
65
43 1 523
—
—
23.5
92
61
41
—
—
—
—
43
2
514
591
—
24.2 97 87
77
68
60
53
36
43
3
476 577
713
24.3 98
91
84
78
72
66
51
44 1 494
——
25.1
91
66
44
—
—
—
—
44 2 480 755
—
25.3
94
79 62
53
—
—
—
44 3 459
686
827
25.3
96 86
74
67
58
49
—
45 1
691
——
26.8
22 1 - 0
67
—
—
—
45
2
677
831
—
24.5
76 28
12
—
—
—
—
45
3
597 797
1047
24.9 8 9 57
32
—
—
—
—
46 1 665
——
27.6 61
16 6
—
—
—
—
46
2
670
791
—
26.8
85
51
30
—
—
—
—
46
3
658
677
815
26.7
90 66
46
—
—
—
—
47 1 682
—
—
26.9
79 38
18
—
—
—
—
47 2 662
699
—
27.0
91
66
46
——
—
—
47
3
625
791
849 27.3 93
74
57 44
—
—
—
48
1
544 —
—
24.9
77
37
18
——
—
—
48 2 496
807
—
25.1
89 62
41
——
—
—
48 3 516 630
842
25.2
92
71
53 45
—
—
—
49 1 444
——
24.6 66
21
10
——
—
—
50 1 616
—
—
26.3
62
14
3
——
—
—
50 2 678
1066
—
25.2 70
21
6
——
—
—
50
3
614
1085
1061
25.5 76
30
11
——
—
—
51
1
519
—
—
25.2 69 20
6
——
——
51
2
594
1132
—
25.3
87
55 32
——
—
—
51
3 597
1078 1090 25.8
91
69 49
——
—
—
52
1 649
—
—
25.5
37
2
-1
——
—
—
52
2
620
468
—
25.4 87 52 28
——
——
5 2 3 612
505 554 25.6
93 70 48
—
—
—
—
53 1
651
——
24.5 82 39
16
—
—
—
—
53 2
621
648
—
24.1
93 70 48
30
—
——
53 3
612
588
645
23.7 95 80 64
49
38
——
Page 3 of 6 pages
6

-----------
---------------------
Table 1.—Moisture–excluding effectiveness (MEE
t
) of finishes on ponderosa pine sapwood (after t days exposure at 90 pct
relative humidity, average of three replicates)-con.
Number
Finish
a
of
Coverage Wood MEE
t
for–
coats 1 coat 2 coats 3 coats
density
t=1 t=7 t=14
t=21 t=28 t=35 t=60
Ft
2
/gal -----------
Lb/ft
3
Pct ---------------------
EXTERIOR, PIGMENTED, NONAQUEOUS FINISHES—con.
———
54
1
576 — — 25.7
75
30
12
—
54
2
561
639
—
26.0
88
59 36
—
54
3 536
599 647 26.0
91 69 48 35
—
—
—
55
1
622
—
—
25.5
7
–1
–1
—
———
55
2
662
961
—
24.7
13
–2
–3 —
———
55
3
670
991
987
24.8
21
1
–0 —
———
———
——
—
56
1
659
——
27.1
45
7
1
—
56
2
647
878
—
26.7
84 48
26
—
56
3 626 868 820 27.0 90
64 42 —
——
—
57
1
586
——
25.1
72 23 8
—
—
—
—
57
2
553
671
— 25.0 86
52
29 —
——
—
57
3
592 654
771 25.1
90
63
41
—
——
—
58
1
557
— — 23.7 85 46
24
—
——
—
58
2 527
659
—
23.4
93
70 50
—
——
—
58
3
487
702
621
23.4
95 78
62
50
42
——
COMBINATION EXTERIOR/INTERIOR, PIGMENTED, NONAQUEOUS FINISHES
59
1
—
——
439
23.4
82 37
18
—
—
—
59
2
—
397
480
22.9
93 69
49 36
—
—
—
59
3
444 474
443
22.6 94 76 59
47
—
—
—
60
1
——
—
—
23.9
91
67
44
—
—
—
60
2
—— —
24.0
95
81
65
54
45
—
—
60 3
—— —
24.0
96 85
73
64
56
50
—
61
1
542
—
—
21.1
83
27
7
—
—
—
—
61
2
538
705
—
21.2
94
63
32
———
—
—
——
——
—
61
3
492
708
728
21.2
96 75 52 30
62
1
521
——
24.4 80 31
15
—
—
—
—
—
—
——
—
62
2
534 766
23.7
89
53
35
———
—
62 3 562 699 888
23.4
92 63
45
63
1
436
—
—
25.3
93
77
53
38
——
—
—
63
2
429 532
26.2
98
90
82
74
67 60 40
63 3 426 467 498
25.6
98
93
87
82 76
71
57
—
64
1
353
—
25.8
94
77
59
44
—
—
—
—
64
2
342 353
26.0
97
91
83
76 69
62
42
64
3
333
351
387
26.2
98
94
88
83
78
74
58
65
1
490
——
21.5
88
48
25
——
—
—
65
2
493
877
21.8
94
73
54
40
65
3
477 914 945
21.9
96 80 65 52
42
—
—
66
1 428
——
22.0
89
56
33
———
—
66
2 412 835
—
22.1
95
77
61
47
———
66
3 434
757 980
22.5 96 83
70
58 48
——
67
1 429
——
23.6
93
69
50 38
———
67
2
413 672
—
24.0
96 83 70 60
50
42
—
67
3
397 608 534
24.2
97
89
80
72
65
58
41
68
1 466
—
—
24.1
78 35
16
————
—
————
—
———
68
2 456
610
24.5
88 58
37
——
—
—
68 3 458 639
728
24.7
91
66
47
—
69
1
435
—
21.7
93 64
39
—
—
—
—
—
69 2
411
383
21.6
98 88
78
69
60
52 30
69
3 400 377 554
21.2
98 90
83
75
68
62
43
—— ——
—
—
70 1
371
23.7 86 45 23
———
—
—
70 2
357
469
23.8
91
65 43
———
70
3
399
495 502
24.5
93 72
52
40
Page 4 of 6 pages
7

-----------
---------------------------
Table 1.—Moisture–excluding effectiveness (MEE
t
) of finishes on ponderosa pine sapwood (after t days exposure at 90 pct
relative humidity, average of three replicates)—con.
Number
Finish
a
of
Coverage Wood MEE
t
for—
coats 1 coat 2 coats 3 coats
density
t=1
t=7 t=14 t=21
t=28
t=35
t=60
-----------
Ft
2
/gal
Lb/ft
3
Pct
---------------------------
COMBINATION EXTERIOR/INTERIOR, PIGMENTED, NONAQUEOUS FINISHES—con.
71
1 510
—
—
22.7 80 35
13
—
—
—
—
71
2
458 884
—
22.5
97 87
76
67
58 50
—
71
3
513 915
938
22.9
98 91
82
74 68
61
45
72
1
541
—
—
24.4
72 27
11
————
72
2
572 757
—
24.3
84
48 27
————
72
3
566
715
1082 24.2
58 58
37
—
—
——
73
1
330
——
25.9
91 62
41
————
73
2
343
396
—
25.1
94
77
61
49
———
73
3
370
358
378 25.2 96 82
70
59
51
—
—
74 1
460
——
22.9 79
35
16
—
—
—
—
74 2
461
659
—
23.3 89 61
38
—
—
—
—
74 3
454
666
589 23.2 92 70
50
36
—
—
—
75
1
388
—
—
23.6
88 51
28
————
75
2 385
475
—
23.7
94
75 56 42
———
75
3
382
449 510 22.6 96 82 67 55
46
—
—
INTERIOR, PIGMENTED, NONAQUEOUS FINISHES
76
1
341
——
25.2
9
–1
–2
————
76
2
303
378 — 25.5 25
2
–1
—
—
—
—
76
3
290
383 375 25.8
37
5
–1
—
—
——
77
1
407
— — 25.8 83
45 25
—
—
—
—
77
2 468
666 — 26.2
91
64
43
—
—
—
—
77 3
396
599
567 25.7 94
76
59
46
—
——
78
1 365
— — 22.4 92
71
52
39
—
——
78
2 357
506
— 22.4 95
83
71
60
52 44
—
78
3 362
523 493
22.1
97
88
78
69
62
55 38
EXTERIOR, PIGMENTED, AQUEOUS FINISHES
79
1 248
— — 24.6 43
6
1
—
—
——
79
2
218
359 — 24.4 67
14
2
——— —
79
3
236
289
382
25.3 72
20 4
—
—
——
80
1 495
— — 24.8 52
12
5
—
—
——
80
2
471
609 — 24.4 77
28
11
—
—
——
80
3
478
528
541
24.5
84
39
16
—
—
——
81
1 446
——
23.1
28
1–1
—
—
——
81
2
445
697 —
22.9
50
62
—
—
——
81
3
421
660
663
23.4 59
10
5
——— —
82
1 428
——
23.3
43
2
–0
——— —
82
2 423
710
—
23.8
53
2
–3
——
—
—
82
3
454
654 686 22.8 60
8
2
—
—— —
83
1
455
——
26.5
5
–1
–1
—
—
—
—
83
2 460
544 —
26.0
38
4
–0
——— —
83
3
497
551
549 26.2
50
6
–0
84
1
—
415
——
23.4
30
3
0
—— —
84
2
—
459
599 —
23.3
48
11
5
—— —
84
3
—
456
615 686
22.6
45
11
5
—— —
COMBINATION EXTERIOR/INTERIOR, PIGMENTED, AQUEOUS FINISHES
——— —
—— —
85
1
322 — — 25.5
50
10
3
—
—— —
85
2
328 426 — 25.9
66
17
5
—
—— —
85 3
303 427 419 25.6
73
26
10
—
—— —
86
1
424 — — 27.3 29
3
–1 —
—— —
86
2
415
602
—
27.1 38
8
2
—
—— —
86 3
374
635
599 27.3 44
8
1—
Page 5 of 6 pages
8

-----------
---------------------------
Table 1.—Moisture–excluding effectiveness (MEE
t
) of finishes on ponderosa pine sapwood (after t days exposure at 90 pct
relative humidity, average of three replicates)—con.
Number
Finish
a
of
Coverage Wood
MEE
t
for—
coats
1 coat 2 coats 3 coats
density
t=1 t=7
t=14 t=21 t=28 t=35 t=60
-----------Ft
2
/gal
Lb/ft
3
Pct---------------------------
INTERIOR, PIGMENTED, AQUEOUS FINISHES
87 1 408
——
24.4 23
1
–0
—
—— —
87 2
422
620 —
24.3
45
5–1
—
—— —
87 3 396
567 578
25.4 49 8
–0
—
—— —
88
1
465
——
24.8 40
62
—
—— —
88 2
442
532 —
25.1
51
92
—
—— —
88 3 439
541
570
25.6 58
11
2
—
—— —
89
1
406
——
25.7 36
3
–1
—
—— —
89
2
433
596
—
25.9 44
5
–0
—
—— —
89
3
413
533
611
26.1
48
11
3
—
—— —
90 1 314 — —
22.7 78
37
20
—
—
—
—
90 2
312
439
—
21.0
86
47 27
—
—— —
90 3 304
441
413
21.5 88
55
33
—
—— —
91
1
355
——
24.5 5
–5
–5
—
——
—
91
2
315
440
—
24.2
11
–6
–6
—
—— —
91
3
364
423
464
23.8
22
–3
–3
—
—— —
a
For complete data, see (8).
Page 6 of 6 pages
9

Results and Discussion
The protection afforded by finishes excluding moisture from
wood depends on a great number of variables (
4, 23, 25
).
Among them are finish film thickness, type and amount of
pigment, chemical composition and amount of the vehicle,
volume ratio of pigment to vehicle, vapor-pressure gradient
across the film, and length of exposure period. Under
outdoor conditions, the age of the weathered finish is very
important (
12, 23
). We investigated particularly the effects of
varying film thickness (number of coats), length of exposure
time, and chemical composition of the finish system.
Additional studies included the effect of sample size, role of
cycling humidity, effect of substrates (different woods and
wood panel products), and brush versus dip application of
the finish.
MEE of Wood Finishes
The data in table 1 show the wide range of MEE values
found on ponderosa pine at 90 percent RH for the
91 finishes in the study. MEE always decreases with
exposure time and always increases with greater film
thickness (i.e. two coats of a finish are better than one, and
three are better than two). The effects of finish type, number
of coats, and exposure time on MEE are shown in figures 2
and 3 for several of the finishes evaluated (see also section
on MEE and Film Thickness). The sheathing epoxy finish
(finish 6, fig. 2) was very effective and had a relatively high
MEE
35
of 74 and 81 percent when the finish was applied in
two or three coats. This is an unusual finish in that it is
composed of virtually 100 percent solids (Appendix B) while
the other finishes range from 20 to 80 percent solids.
In contrast to the epoxy sheathing compound (finish 6, fig. 2)
a latex house paint (finish 80) and a nitrocellulose lacquer
(finish 18, both in fig. 3) had low MEE values even with
three coats. These permeable filmforming finishes do have a
degree of protection against moisture vapor after 1 day at
90 percent RH, but the MEE falls very rapidly after that.
MEE and Finish Characteristics
As shown in Appendix A, this study included 16 aqueous (or
water-borne) and 75 nonaqueous (solvent-borne) finishes;
52 were pigmented (opaque) and 39 were unpigmented
(transparent). The finishes were also described as exterior
grade, interior grade, or combination exterior/interior grade.
These characteristics were important in determining the
MEE of the finish when applied to wood surfaces.
The finishes were ranked from highest to lowest MEE for
each day of measurement by the number of coats applied.
For convenience, only the first 30 finishes in each ranking at
each period of exposure are considered here. From table 2
it can be seen that the dominant characteristics of the
30 finishes with highest MEE are nonaqueous, pigmented,
and either exterior grade or combination exterior/interior
grade.
Table 2.—Distribution of finish characteristics for the 30 finishes with highest moisture-excluding effectiveness
Number of finishes
Duration
of test
Days
Number
of
coats
Combination
Pigmented +
Aqueous +
exterior/
+ Exterior +
lnterior
unpigmented
nonaqueous
interior
11
16
+
10 +
4
28 + 2 1 + 29
12
17
+
11 +
2
27 + 3 0 + 30
13
16
+
11 +
3
26 + 4 0 + 30
71
17
+
9 + 4 27 + 3 1 + 29
72
17
+
11 +
2
27 + 3 0 + 30
73
16
+
11 +
3
26 + 4 0 + 30
14
17
+
9+
4
28 + 2 1 + 29
1
2
17
+10+
3
26 + 4 0 + 30
14
14
3
17
+10+
3
25 + 5 0 + 30
10

Figure 2.—Moisture-excluding effectiveness (MEE) of wood finishes on ponderosa
pine sapwood at 90 percent relative humidity and 80 °F as a function of time.
Number of coats is displayed at right of cuves. A. Finish 6: Two-component
sheathing epoxy; B. Finish 64: Two-component epoxy/polyamide paint: C. Finish
43: Aluminum-pigmented varnish; D. Finish 60: Pigmented flat shellac; E. Finish
44: Two-component polyurethane gloss paint: F. Finish 58: Tall maleic alkyd/soya
alkyd flat primer paint.
11

Figure 3.—Moisture-excluding effectiveness (MEE) of wood finishes on ponderosa
pine sapwood at 90 percent relative humidity and 80 °F as a function of time.
Number of coats is displayed at right of curves. A. Finish 77: Soya alkyd gloss
enamel; B. Finish 54: Soya/silicone alkyd gloss enamel: C. Finish 51:
Semitransparent linseed oil-based stain; D. Finish 5: Modified butyl-acrylo-styro
epoxy finish; E. Finish 80: Acrylic latex flat house paint; F. Finish 18: Nitrocellulose
semi-gloss lacquer.
12

In table 3 a ranking of finishes with MEE
14
>
70 percent
regardless of the number of coats of finish shows a
predominance of pigmented, nonaqueous, exterior or
combination exterior/interior finishes. The best finishes
(finishes 30 and 6) were special systems in that they did not
contain any solvent. Also, finish 30 (paraffin wax) was
applied by dipping or brushing the melted material. This
special finish is discussed in a separate section.
The individual conventional finishes with the best MEE
14
were the two-component epoxies (finishes 63, 64 and 69),
aluminum-pigmented varnishes (finishes 40-43), an
aluminum paint (finish 71) and a soya-tung alkyd satin
enamel paint (finish 67). The two-component epoxy/
polyamide paints or enamels in gloss, or satin finish had a
higher MEE
14
than the two-component polyurethane (finish
73). Generally, two-component epoxies were far better than
two-component polyurethanes whether pigmented or
unpigmented (table 1).
Of the 91 finishes used in this study, 87 were applied and
evaluated as 1, 2, or 3 coats. The overall effectiveness of
the 87 finishes against water vapor is illustrated in table 4
where the MEE values have been separated into four
ranges. After 1 day at 90 percent RH, 31 of the 87 finishes
had an MEE of 75 to 100 percent: with three coats, 63
finishes had MEE
1
of 75 to 100 percent. After 14 days there
were no finishes with an MEE of 75 to 100 percent when
one brush coat was applied, 7 with two coats, and only 11
with three brush coats of the finish. Thus, only 11 out of 87
commercial finishes were found to retard moisture vapor
movement into wood between 30 and 90 percent RH with
any degree of success over the relatively short time of
14 days and only when two or three coats were applied.
On the low end of the MEE ranges, 69 finishes had an
MEE
14
of 0 to 24 percent when only one coat was applied
(table 4). Twenty-eight finishes were in this MEE range even
with three coats.
Table 3.—Ranking of finishes with moisture-excluding effectiveness MEE
14
>
70 percent after
14 days exposure at so percent relative humidity. All finishes were nonaqueous.
Number
Finish
of
Finish characteristics
MEE
14
a
Standard
error
coats
Pct
30
b
1 Combination exterior/interior, unpigmented 95 3.7
6
3
Combination exterior/interior, unpigmented
91
0.7
6
2
Combination exterior/interior, unpigmented
88
1.4
64
3
Combination exterior/interior, pigmented 88 0.6
63
3
Combination exterior/interior, pigmented 87 0.3
43
3 Exterior, pigmented
84
1.1
40
3
Exterior, pigmented
84
1.1
42
3
Exterior, pigmented
84
1.7
69
3
Combination exterior/interior, pigmented
83
2.0
63
2 Combination exterior/interior, pigmented 82 0.5
71
3 Combination exterior/interior, pigmented
82
2.6
41
3 Extetior, pigmented
81
1.0
67
3
Combination exterior/interior, pigmented 80
1.4
64
2 Combination exterior/interior, pigmented 79
1.5
78
3
Interior, pigmented 78 2.3
69
2
Combination exterior/interior, pigmented 78 2.7
43
2 Exterior, pigmented
77 0.8
71
2
Combination exterior/interior, pigmented 76 2.9
40
2 Exterior, pigmented
76
1.7
42
2 Exterior, pigmented
74
2.1
44
3 Exterior, pigmented
74
1.8
60
3
Combination exterior/interior, pigmented 73 2.0
41
2 Exterior, pigmented
72
3.8
78
2 Interior, pigmented
71
3.2
67
2
Combination exterior/interior, pigmented
70 1.7
66
3
Combination exterior/interior, pigmented
70 3.9
73
3
Combination exterior/interior, pigmented
70
1.1
a
Mean of three observations.
b
Melted paraffin wax, dip applied.
13

Table 4.—Finishes in four ranges of moisture–excluding ef-
fectiveness (MEE) as a function of coat number and time al
90 percent relative humidity and 80 °F
Number
Number of finishes
a
in MEE ranges of—
Duration
of
75-100
50-74
25-49 0-24
of test
coats
pct
pct pct pct
11
31 21
21
14
260
11
8
8
3
63
11
7
6
7
1
2
14 16
55
2
16
23
21
27
324 36 5 22
14 1
05
13
69
2
7
11
27 42
3
11
18
30 28
a
Data from table 1. Eighty-seven finishes were applied to ponderosa
pine in 1, 2, and 3 coats.
Figure 4.—Moisture-excluding effectiveness (MEE) of
one to six coats of an aluminum flake-pigmented
varnish (finish 43) on ponderosa pine sapwood at
90 percent relative humidity and 80 °F as a function
of time. Number of coats is displayed to right of
curves.
MEE and Film Thickness
(Number of Coats of Finish)
The amount of finish applied to the wood surface is very
important to MEE values, as shown in figures 2 and 3.
Generally, the first and second coats are the most important
in the overall MEE of the finish. The first coat serves to seal
the wood but it is generally impossible to produce a totally
defect-free uniform film over the wood. Also some
penetration of resins or oils undoubtedly occurs (3,5,10
).
The second coat covers any defects of the first coat, and
doubles the film thickness. Each succeeding coat increases
MEE but, compared to the MEE produced by the first and
second coats, later increments are relatively small and
uniform even up to six coats (fig. 4). These small but
uniform increases result from the fact that film thickness is
doubled for the second coat but is increased only by
one-third for the third, by one-fourth for the fourth and so on.
We investigated the effect of increasing film thickness
(number of coats) up to six coats of finish for eight of the
finishes described earlier (table 5). The results for aluminum
flake-pigmented varnish (finish 43) illustrate the effect of six
coats of a finish with an excellent MEE. At the opposite end,
the acrylic latex house paint (finish 84) was quite porous to
moisture vapor and had MEE
14
of only 11 percent after six
coats of finish were applied (table 5). The butadiene/styrene
latex flat wall paint (finish 90) had an MEE
14
of 20 percent
for one coat and increased only to 45 percent for six coats.
This paint is recommended by the manufacturer as a vapor
barrier paint for interior walls (plaster, sheet rock, etc.).
The low values of MEE
14
for latex finishes stand in contrast
to those of the shellac-, varnish-, or paint-based finishes that
we evaluated. A white shellac (alcohol solvent) (finish 23)
with an MEE
14
of 73 percent for six coats was less effective
than a pigmented flat shellac (also alcohol solvent)
(finish 60) which had MEE
14
of 83 percent. For each coat
applied the MEE increase was greater for the white shellac
than for the pigmented shellac. This greater increase in MEE
with each successive finish coat for a nonpigmented versus
pigmented finish was also observed with the gloss urethane
varnish (finish 13) and the aluminum flake-pigmented
varnish (finish 43). Increases in MEE for the paints
(finishes 67 and 77) were similar to those for the pigmented
varnish and shellac. Browne (
4
) has done an extensive
study on the variations of MEE for a linseed oil paint
according to the nature of the pigment. In general,
pigmented finishes have much higher MEE than
unpigmented finishes for any specific resin system.
14

--------------------------------------------
Table 5.—Coverage and moisture-excluding effectiveness (MEE
t
) of six coats of finish on ponderosa pine sapwood (after
t days exposure at 90 percent relative humidity, average of three replicates)
Number
Wood
Coverage MEE
t
Finish
of
coats
density
1 coat 2 coats 3 coats 4 coats 5 coats 6 coats
t=1 t=7 t=14 t=21 t=28 t=35 t=60 t=90
Lb/ft
3
13
1 24.5 505
——
13
2
24.5
507
635
—
13
3
25.2 497
580
559
13
4 25.1
501
643
719
13
5 23.5
493
675
680
13
6
23.5
490
619
656
23
1
23.4
405
—
—
23
2 23.6
469
509
—
23
3
24.4 422 515
480
23
4
23.9 465 568
526
23
5
24.3
455
560
513
23 6 25.8
508
573
575
43
1 23.5
523
—
—
43
2
24.2
514
591
—
43
3
24.3 476
577
713
43
4
25.3
503
583
658
43
5
25.4
508
564
632
43
6
25.1
480 572
627
60
1 23.9
—— —
60
2
24.0
—— —
60
3
24.0
—— —
60
4
26.0 338
401
444
60
5
25.6 336
385
398
60
6
26.4
330
376 393
67
1
23.6 429
——
67
2
24.0 413 672
—
67
3
24.2 397 608 534
67
4
25.3 427
517
492
67 5
25.4 438
464
487
67
6 26.0 406
475
456
77
1
25.8 407
——
77
2
26.2 468 666
—
77
3
25.7
396
599
567
77
4
25.5
452
535
629
77
5
25.6
413 514
586
77
6
24.0
407 485
539
Ft
2
/gal
----------------------
——
—
—
—
—
———
774
—
—
—
812
784
816
802
793
—
—
—
—
—
—
—
—
—
—
—
562
—
599
641
637
704
537
——
—
——
—
——
—
—
—
623
—
668
743
714 679
691
—
—
—
—
—
—
—
—
—
—
—
348
383
447
—
385
412
481
—
—
—
———
——
—
592
—
—
459
449
—
476
490
465
———
——
—
——
—
663
—
—
674 518
—
559
555
732
84
1
23.4
415
———
—
—
84
2
23.3
459 599
——
—
—
84
3
22.6
456
615 686
—
—
—
84
4
26.4
415
589 657 677
—
—
84
5
26.5 386
659 536 608
666
—
84 6
26.6
395
585 623
570
566
582
90
1
22.7
314
——
——
—
90 2
21.0 312
439
——
—
—
90
3
21.5 304
441
413
——
—
90
4
23.9
454
662
656 683
—
—
90
5
23.9
474
645
654 702 688
—
90
6
26.3
466
621
665 668 706
665
Pct
----------------------
—————
55 10 2
—————
83 43 23
—————
89 64 44
———
91
68
51 39
—
—
———
93
72 57
45
———
93 76 62 50 42
65 11
3
—— — — —
—————
84 43 20
—————
91 63 42
———
93 75 58
45 —
———
94 81 67
56
47
——
95 85 73 64 55 49
92 61 41
—————
97 87 77 68 60
53
36
—
98 91 84
78 72
66
51
38
98 93 87
82
76
71
56 42
98 94 89
84
79 75 62 49
98 95 90
86 82 79 67 55
—————
91 67 44
———
95 81 65
54 45
——
96 85 73
64
56 50
—
96 88 79
71
64 57 36
—
97 89 81
74 67
61
42
—
97 90 83
76
71
65
47
93 69 50 38
—
———
96 83 70 60 50
42
——
97 89 80 72 65
58
41
—
98 92 85
79 74
69
53 40
98 93 88 83
78
74
61
49
98 94 89 85
81
77
65
54
—— — — —
83 45 25
—— — — —
91
64
43
—
—
—
94 76 59 46
—
———
95 80 65 52 43
—
96 84 72 61 53 46
—
—
96 85 74
64
56 49
—
30
30
—— —
—
—
—— —
—
—
48
11 5
—— —
—
—
45 11
5
—— —
—
—
61 19 1 0
—— —
—
—
63 19 10
—— —
—
—
65 20 11
78 37 20
—— —
—
—
86 47 27
——
—
—
—
88 55 33
——
—
—
—
90 57 36
—— —
—
—
90 60 39
—— —
—
—
92 66 45
—— —
—
—
15

-------------------
We investigated the dependence of MEE
14
on the amount of
material deposited on the surface of the specimen. Grouping
finishes according to the three finish characteristics
described earlier, we have six groups of nonaqueous
finishes with average three-coat MEE
14
>
50 percent:
Number of
finishes in
Characteristics
the group
Unpigmented
Exterior
1
Combination exterior/interior
2
Interior
1
Pigmented
Exterior
8
Combination exterior/interior
14
Interior 2
To represent the amount of material deposited on the wood
specimen, we calculated the total number of gallons applied
per square foot and multiplied by the percent solids that
each finish contained.
Scatter plots, for one, two, and three coats, showed that the
relation between MEE
14
and material deposited was
strongest for one coat and comparable for two and three
coats. The exterior grade pigmented finishes showed the
most consistent positive relationship between MEE
14
and
material deposited, but clusters of finish types (finish 41, 43,
44 near one point, 47 and 48 near another) prevent a simple
inference.
We calculated the correlation between MEE
14
and the
amount of material deposited for one, two, and three coats
as follows, using data for all finishes that had three-coat
MEE
14
>
50 percent:
Number of coats
Correlation
1
0.592
2
0.402
3
0.405
MEE of Aluminum
Flake-Pigmented Varnish
The effectiveness of aluminum flake pigments in varnish or
paint systems has been recognized for a long time
(
3,4,12,25,27
). We investigated the effect of adding several
different aluminum flake pigments in paste form (2 lb/gal) to
an exterior/interior grade polyurethane gloss varnish (finish
13, table 6). The MEE of the aluminum flake-pigmented
varnishes (finishes 41-43) was highest for those prepared
from flake pigments with the highest nonvolatile content and
those with the highest leafing content (finishes 40 and 43,
table 1). The role of film thickness in MEE was discussed
earlier (fig. 4) for finish 43.
Table 6.—Aluminum leafing pigments used In preparing
aluminum-pigmented varnishes
Aluminum leafing pigment property
Finish
a
Retention on
Nonvolatiles
Leafing
Bulking
325-mesh screen content
value
Pct
-------------------
Gal/lb
40 0.35
73.1
70
0.084
41
0.5
65.0
60-65
0.082
42 0.2
65.0
65-70 0.084
43 4.0
67.0
70-80 0.081
a
Pigment added to a gloss urethane varnish (finish 13) to give a
final composition of 2 pounds aluminum paste per gallon of varnish.
See Appendices A and B for description of finishes.
16

MEE of Combination Finishes
Paints and other finishes are often applied to wood surfaces
as combinations of finishes, e.g. a sealer, primer, and a
topcoat. Several different finish combination systems were
evaluated for MEE (table 7). An all-acrylic latex house paint
system (finishes 79 and 80) was found to have higher MEE
1
for the combination system than for the individual finishes
and slightly higher MEE
7
but the MEE
14
was virtually
unchanged. The MEE
14
for the combination primer/topcoat
system (three coats) was essentially the same as the MEE
14
for three coats of either finish (finishes 79 and 80, table 1).
As noted earlier this observation is true of latex systems in
general.
When the first coat (primer paint) was alkyd-based
(finish 56) with a reasonably good MEE, the application of
two coats of acrylic latex topcoat (finish 84) over the alkyd
primer paint did not have any measurable effect on MEE.
Thus, permeable latex paints have no effect on the MEE of
less permeable alkyd finishes when the permeable paint is
applied over the less permeable finish.
Table 7.—Moisture-excluding effectiveness (MEE
t
) of combination wood finishes after t days exposure at 90 percent relative
humidity (average of three replicates)
1st Coat
2nd Coat
3rd Coat
4th Coat 5th Coat Mee
t
for—
Finish
a
Coverage Finish Coverage Finish Coverage Finish Coverage Finish Coverage t=1 t=7 t=14
Ft
2
/gal Ft
2
/gal Ft
2
/gal
Ft
2
/gal Ft
2
/gal
-------
Pct
-------
79
248
— — —
— — — — —
44
4
–1
80
495
— —
— — — — — —
52
12
5
79
221
80
651
— — — — — —
71
15
5
80
471
80 609
— — — — — —
77 28
11
79
231
80
638
80 724
— — — —
76
20
5
58
557
————
—
— —
—
89
55
31
84
415
—————— — —
30 3
0
58
453 84
612
———— — —
90
58
34
84
459 84 598
———— — —
48
11
5
58
483
84 602 84
637
— — — —
88
53
30
2
441
——
———— — —
13
0
–2
49
444
——
———— — —
66
21
10
2
441
49 538
———— — —
86
51
35
46
669
46
791
———— —
—
85
51
30
2
434 49 490 46
968
46 603
— —
97
90
82
47
662 47 699
—————
—
91
66
46
2
454
49 486
47
851
47
716
—
—
98
92
87
48
496
48 807
—
——
—
—
—
89
62
41
2
467 49
535 48
721
48 685
— —
97
91
85
25
564
25 713 80 37
18
32
——
—— —— —— —
6
–2 –2
—— —— —
25
589 25 783 32
89
57
34
16
545
16
593
——————
84 46 27
29
—
29
—— —— —— —
1
11
16
689
16 976
29
—
29
—— —
81
41
19
35
379 35 405
35
378
————
88
61
40
35
360 35 394 35
491
29
—
29
—
86 54
31
a
See Appendices A and B for description of finishes used.
17

Finishes 2 and 46-49 are recommended by the manufacturer
for marine uses, particularly on boats. They are intended to
be used as combination finish systems. The
phenol-formaldehyde/linseed-tung wood sealer (finish 2) had
a very low MEE for a one-coat flnish. The soya-linseed alkyd
flat undercoat paint (finish 49) was only somewhat better
(table 7). In combination, however, the MEE was better than
the sum of the two finishes alone. When topcoat paints were
applied over the sealer/primer combination (finishes 46-48)
MEE was significantly increased and the four-coat system
had MEE
14
’s of 82, 87, and 85 percent, respectively. These
topcoats were soya alkyd or alkyd marine enamels
(Appendix A).
A paste wood wax (finish 32) does not provide protection
against water vapor but does help improve the MEE of a
two-coat phenolic/tung wood floor sealer (finish 25) (table 7).
When two coats of a spray furniture polish (finish 29) were
applied over either two coats of a polyurethane gloss varnish
(finish 16) or three coats of a nitrocellulose/alkyd lacquer,
the MEE
14
was reduced slightly as were the other MEE
values. The spray furniture polish by itself did not affect
MEE at all even with two-coat application.
MEE of Paraffin Wax Treatments
Paraffin wax (finish 30) gave especially interesting results
when the finish was melted and applied on the wood surface
either by brushing or by dipping. Molten paraffin wax brush
treatment gave the highest MEE
1
of all the 91 finishes
investigated (table 1). MEE declined fairly quickly with time
as was true for most one-coat finishes and MEE
14
for one
coat was 69 percent, still the highest MEE of all the
one-coat finishes in the study. The results for a molten
paraffin wax dip were even more impressive (fig. 5).
MEE
1
was 100 percent and MEE
14
, 95 percent; MEE
90
was
still 70 percent. This method of applying paraffin wax gave
the best results of any of the finishes investigated,
regardless of the number of coats (tables 1 and 5). The
presence of a near-perfect hydrophobic barrier on the wood
surfaces produced very high MEE values (table 8).
Table 6.—Moisture-excluding effectiveness (MEE
t
) of brush- and dip-applied finishes on ponderosa pine sapwood after
t days exposure at 90 percent relative humidity (average of three replicates)
Finish
Application
Number
of
coats
Coverage
1 Coat 2 Coats 3 Coats
MEE
t
for—
t=1 t=7 t=14 t=21
t=28 t=35 t=60
------------ Ft
2
/gal ------------
--------------------------Pct--------------------------
13
Brush
1 505 — —
55
10
2————
13
Brush 2
507 635 —
83 43
23 — — — —
13 Brush 3 497 580 559
89
64 44 — — — —
13
Dip
1
188
——
83
44 24 — — — —
13 Dip
2 214 268 —
91
66
46 — — — —
13
Dip 3
220
289
292
94
78
63 51 42 — —
Brush
Brush
2
567
94 76 59 46 — — —
1
407
468
77
77
83
45
64
25
43
—
—
—
———
—
—
—
666
—
—
91
Brush 3 396 599
77 Dip
1
199
——
93
76 59 46 — — —
30 Brush
1 330 — —
97 83 69 60 52 46
27
30
Dip
1 448 — —
100 97
95 92 90 87 79
18
77

MEE for Brush Versus Dip Applications
The results for dipping versus brushing of molten paraffin
wax prompted additional studies on how the two application
methods affect MEE. The study was brief (table 8) and
included one-, two-, and three-dip coats of an exterior grade
polyurethane gloss varnish (finish 13) and a one-dip coat of
a soya alkyd gloss enamel (finish 77). Results are also
shown for the paraffin wax (finish 30), brushed and dipped.
We found that one-dip coat was equal to two-brush coats of
the gloss varnish, but one-dip coat of the paint was equal to
three-brush coats. MEE
14
for the one-dip coat of paint was
identical to that of three-brush coats on the ponderosa pine
sapwood specimens. This beneficial effect of dipping is no
doubt due to the fact that more finish material is applied to
the wood surface (see coverage values in table 8), and
because dipping for 30 seconds in the finish (whether paint,
varnish, or molten paraffin wax) increases penetration and
provides greater sealing of the end-grain of the wood.
Figure 5.—Moisture-excluding effectiveness of one
coat of paraffin wax (finish 30) applied by dipping or
brushing of molten material on ponderosa pine
sapwood at 90 percent relative humidity and 80 °F as
a function of time. Method is displayed to right of
curves.
MEE of Wood Finishes as a Function of
Repeated Adsorption/Desorption
Cycles
All of the discussion so far has dealt with the
moisture-excluding effectiveness of relatively new or fresh
finishes on wood surfaces. Normally, only 3 to 6 weeks time
elapsed between applying the finish, equilibrating the
finished specimens to 30 percent RH and then starting the
MEE evaluation at 90 percent RH. The question arises, what
happens with longer times? Does MEE change with time?
What happens to MEE when the finished specimen goes
through repeated cycles between 30 and 90 percent RH?
The effects of outdoor weathering on MEE have been
addressed by earlier workers (3,4,12,19,23
). We wanted to
look at the effects of adsorption/desorption cycles between
30 and 90 percent RH and the accompanying effects of time
in the test for MEE.
MEE and Noncontinuous
Adsorption/Desorption Cycles
Generally, from 4 to 8 weeks elapsed between the time a
new finish was applied to the wood surface and the time the
MEE test was started at 90 percent RH. This was the time
frame required for the sample to reach equilibrium moisture
content (EMC) at 30 percent RH. This means that the finish
was curing and drying for this duration before the test was
begun. The MEE was then determined and the specimens
stayed in test at 90 percent RH until MEE values fell below
50 percent (table 1). The specimens were then returned to
30 percent RH.
We selected 13 representative finishes with varying degrees
of MEE to study the effects of repeat adsorption/desorption
cycles on MEE (table 9). The first adsorption cycle varied
from 2 to 17 weeks at 90 percent RH followed by a
desorption cycle of 8 to 20 weeks at 30 percent RH to EMC.
The second and third adsorption cycles were stopped after
14 days in test at 90 percent RH and the samples returned
to 30 percent RH for equilibration. The specimens were
brought to EMC at 30 percent RH between the second and
third adsorption cycles just as before the first cycle. Thus,
the minimum time that elapsed between the start of the first
and third adsorption cycles was 18 weeks; maximum
elapsed time was 59 weeks. The finished specimens with
the highest MEE took longer to come to EMC between
cycles than did the finished samples with lower MEE.
19

1
2
3
4
5
6
1
2
3
4
5
6
1
2
3
4
5
6
Table 9.—Repeated adsorption cycles: effect on the
moisture-excluding effectiveness (MEE
t
) of finishes on
ponderosa pine sapwood (after t days exposure at
90 percent relative humidity, average of three replicates)
MEE
t
for—
Finish
Number
Cycle 1 Cycle 2 Cycle 3
of coats
t=1 t=7 t=14 t=1 t=7 t=14 t=1 t=7 t=14
---------------------Pct---------------------
13
13
13
13
13
13
23
23
23
23
23
23
30
43
43
43
52
52
52
53
53
53
54
54
54
57
57
57
59
59
59
65
65
65
67
67
67
77
77
77
77
77
77
90
90
90
1
1
2
3
1
2
3
1
2
3
1
2
3
1
2
3
1
2
3
1
2
3
1
2
3
1
2
3
55
10
2
57
13
5
57
14
5
83 43
23 85 49 29
84
51
32
89
64
44 91 68 50
90 69 52
91 68 51 91 69 51 92 70 52
93 72 57 92 73 57 93 74 58
93 76 62 93 77 61
94 77 62
65
11
3
48
9
3
46
8
3
84
43
20
85
48
27
86
48
28
91
63
42 93
72 55
94
74 57
93 75
58 94
80 65
96
82 69
94
81
67 96 85
73
97 87
76
95 85
73 97 88 79
97 90
81
97 83
69
94 77
62
94 74
59
92
61
41 91
66
49
90 65 48
97 87
77
97
89
82
98 90 83
98
91
84 98
93
88
98 93 89
37
2
–1 40
62
39
5
1
87 52 28 89 56 30 90 57 31
93 70 48 92 71 47 93 71 47
82 39 16 84 43 19 85 44 21
93 70 48 94 73 51
94 74 54
95 80 64 96 83 67 96 83 69
75 30 12 76 32 16 75 32 16
88 59 36 89 61 41
88 61 41
91 69 48 93 72 51
92 71 53
72 23 8 76 28 12 76 29 12
86 52 29 87 55 34 88 56 34
90 63 41
91 64 45 90 65 45
82 37 18 82 42 19 75 23 6
93 69 49 96 82 67 97 84 71
94 76 59 97 85 74 98 88 78
88 48 25 87 49 28 88 49 27
94 73 54 94 73 54 95 74 54
96 80 65 96 81 66 96 81 67
93 69 50 93 74 56 94 76 59
96 83 70 97 86 76 97 84 77
97 89 80 98 92 85 98 92 87
83 45 25 85 51 31
85 53 33
91 64 43 91 69 50 91 71 53
94 76 59 94 80 64 95 81 68
95 80 65 95 83 71
95 83 71
96 84 72 96 87 77 96 87 77
96 85 74 97 88 80 96 88 80
78 37 20 89 52 31
90 55 32
86 47 27 96 76 56 96 77 59
88 55 33 96 78 60 95 78 60
MEE was found to increase through each new adsorption/
desorption cycle for nearly all the 13 finishes examined
(table 9). Even one-coat finishes generally showed an
increase in MEE in going from one cycle to the next. The
largest increases in MEE were usually observed between
the first and second cycles. This increase in MEE with time
and repeat adsorption/desorption cycles is most likely
caused by the continued curing of the finish and loss of any
last small amounts of solvent that could be trapped in the
finish film. The stresses placed on the film by the swelling
and shrinking of the wood during adsorption and desorption
were not sufficient to create any micro-crazing of the finish.
This means permeability is not affected even for a relatively
brittle finish like shellac (finish 23) and alkyd paints
(finish 52) and MEE is not reduced. Even relatively thick
films caused by applying six coats of finish (finishes 13, 23,
and 77) were found to have slowly increasing MEE with
each adsorption/desorption cycle.
Two of the finishes (a one-component epoxy enamel,
finish 59, and a butadiene/styrene latex primer paint,
finish 90) were found to have significantly higher MEE on
the second adsorption cycle (figs. 6 and 7). These two
finishes apparently undergo quite slow final cure of the resin
in the finish, and the permeability of the finish film decreases
with time and thus MEE increases. The increase in MEE
was much smaller between cycles two and three, as it was
with all the other finishes examined. These results show #at
several weeks to several months may be required before
any finish reaches its maximum MEE.
MEE and Continuous Adsorption/Desorption Cycles
In monitoring noncontinuous cycles we observed that
moisture vapor movement through the finish when the
humidity was increasing from 30 to 90 percent RH
(adsorption) was greater than when decreasing from
90 to 30 percent (desorption) (fig. 8). For example,
100 days were required for a finished specimen to adsorb
approximately 9 g H
2
O/100 g ovendried (OD) wood at
90 percent RH but even after 170 days at 30 percent RH,
only 7 g H
2
O/100 g OD wood had been desorbed. Such
behavior would be expected from the sorption hysteresis
observed for wood and other cellulosic materials (22).
Additionally, the vapor diffusion resistance of both wood and
finish depends on the moisture content (MC) and the
moisture gradient. These change with the different cycles
studied.
Since water vapor movement through a finish is slower
during desorption than during adsorption (fig. 8), a
continuous regular cycling of the RH (such as would be
found between summer and winter seasons, for example)
could cause an overall increase in the wood moisture
content if the adsorption/desorption periods were similar.
Three of the finishes used in the noncontinuous adsorption/
desorption studies were selected to demonstrate the effect
of continuous humidity cycles on wood MC. New wood
specimens were coated with one, two, or three coats of a
20

Figure 6.—Moisture-excluding effectiveness (MEE) of a one-component n epoxy
enamel (finish 59) on ponderosa pine sapwood at 90 percent relative humidity (RH)
and 80 °F as a function of time and for repeat adsorption cycles with equilibration
to 30 percent RH and 80 °F between each cycle. Number of coats is displayed to
right of curves.
Figure 7.—Moisture-excluding effectiveness (MEE) of a butadiene/styrene latex
primer paint (finish 90) on ponderosa pine sapwood at 90 percent relative humidity
(RH) and 80 °F as a function of time and for repeat adsorption cycles with
equilibration to 30 percent RH and 80 °F between each cycle. Number of coats is
displayed to right of curves.
21
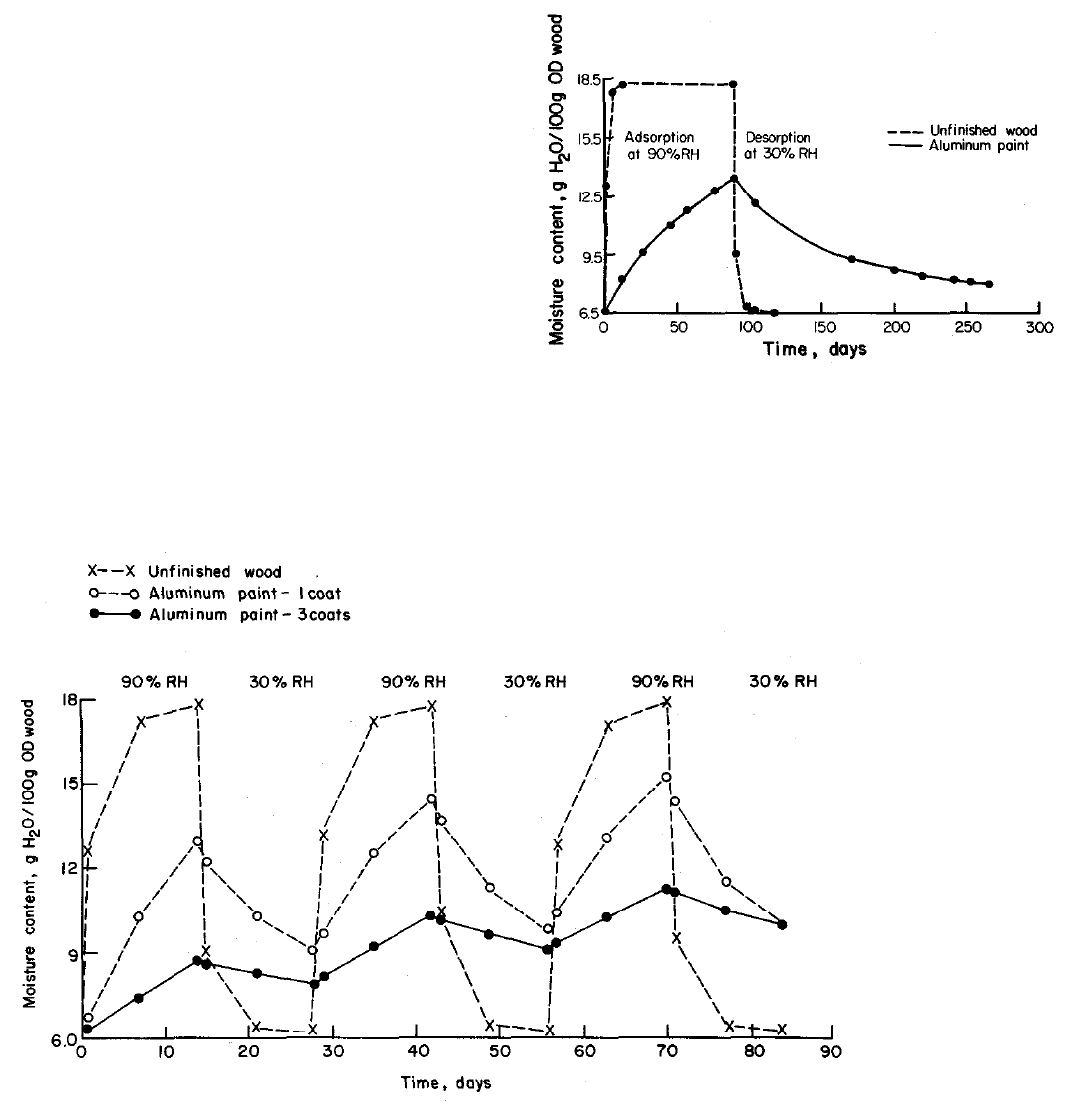
white shellac (finish 23), an aluminum-pigmented metal and
masonry paint (finish 65), or a soya alkyd gloss enamel
paint (finish 77). The coated wood specimens and their
uncoated controls were conditioned to 30 percent RH for
30 days and then exposed to alternating cycles of 14 days
at 90 percent and 14 days at 30 percent RH for three
complete cycles (28 days per cycle, 84 days total).
The MC changes found for wood finished with the aluminum
paint have been chosen to illustrate the results of the test
(fig. 9). The uncoated wood was very near equilibrium after
14 days at either 30 or 90 percent RH and the second and
third adsorption/desorption cycles caused only slightly more
moisture in the specimens than the first. With one coat of
finish however, the MC at the end of each 14-day period at
either 30 or 90 percent RH was higher than that found for
the previous cycle at the same RH. The effect was similar
with three coats of finish except that the amount of moisture
in the specimen was less because the finish had a higher
MEE. These results show that the MC of a piece of wood
finished with a high MEE finish slowly increases as RH
increases and decreases over time periods that are not long
enough for the piece to come to EMC. The times to reach
EMC are very long for finishes with high MEE (figs. 7-9).
Figure 8.—Change in moisture content of ponderosa
pine sapwood finished with three coats of aluminum
paint (finish 65) when exposed to 90 percent and
30 percent relative humidity at 80 °F compared to
unfinished wood.
Figure 9.—Change in moisture content of ponderosa pine sapwood finished with
one and three coats of aluminum paint (finish 65) when exposed to alternating
cycles of 30 percent and 90 percent relative humidity at 80 °F.
22

MEE and the Role of the Substrate
Different Wood Species and
Composite Wood Specimens
All of the results reported thus far have been for finishes on
ponderosa pine sapwood. The MEE of any finish depends,
in part, on the type of substrate to which the finish is
applied. We investigated nine solid or composite wood
substrates to determine the contribution of the substrate to
MEE. A polyurethane gloss varnish (finish 13), soya-tung
alkyd enamel (finish 67) and molten paraffin wax (finish 30,
dip application) were chosen as finishes for this study. For
convenience, only the MEE
14
results are discussed
(table 10).
The substrate and the related amount of finish (coverage)
applied to the substrate have a significant effect on MEE for
a given finish. This is best illustrated by comparing the
results for western redcedar and hard maple. The varnish
was applied in nearly equal amounts to these two solid
wood substrates but the MEE on hard maple was greater
than that on western redcedar by a factor of 10 for one-coat
application. This large dfference decreased as more coats
were applied but three-coat MEE
14
on western redcedar was
48 percent compared to 78 percent on hard maple. This low
MEE on western redcedar is probably related to the high oil
content of this species compared to the other species
investigated. Similar results were found for the enamel but
the differences in MEE were not as large.
Table 10.—Moisture-excluding effectiveness (MEE
14
) of three finishes on different substrates after 14 days at 90 percent
relative humidity
a
Coverage
Wood substrate
MEE
14
1
coat
2 coats
3 coats
1st 2nd 1st
2nd 3rd
1 coat 2 coats
3 coats
----------------------------Ft
2
/gal----------------------------
FINISH
13
Ponderosa pine
484
458
510
473
563 534
Southern pine
574
543
726 577
724
888
Red oak
387
369
397
363
419
377
Douglas-fir plywood
412
374
498
378 504
464
Flakeboard
450
456 671
481
611
880
Western redcedar
358 339
390
313
356
435
Hard maple
361
357
381 422
376 427
Particleboard
307
317
469
294 459
419
Hardboard
314
324
424
307
450
438
FINISH
67
Ponderosa pine
411
382
463
366
379
444
Southern pine
Red oak
560
498
512
513
845
711
497
483
853
760
776
830
Douglas-fir plywood
Flakeboard
342
486
344
498
525
787
348
449
525
712
471
819
Western redcedar
564
507
851
547
787
917
Hard maple
Particleboard
585
328
548
316
797
468
513
319
815
474
747
431
Hardboard
391
347 523
360
513
498
-----------------Pct-----------------
9
41
55
29
65 77
38
64 72
29
60 74
15
43
60
5
28
48
57
73
78
22
40
62
36
55
64
56
77
85
62
81
87
52
70
76
74
83
88
65
76 82
37
58
66
63
78
84
67
79
85
64
76
81
a
All values are averages of three replicates. For complete details see (8).
23
Red oak is a ring porous hardwood (25) and it was
expected that the large vessels would be difficult to seal.
Thus, one-coat MEE
14
on red oak for the varnish was
38 percent compared to 57 percent on the diffuse porous
hard maple at nearly equal coverages but three-coat MEE
14
was nearly the same for both species (table 10). Even
though more enamel was applied to the red oak than to the
hard maple (i.e. coverage was lower for red oak), all MEE
values (one, two, or three coats) for red oak were lower than
that for hard maple.
The MEE of the varnish (finish 13) on the four composite
wood products (Douglas-fir plywood; Douglas-fir flakeboard
(
13); particleboard; and hardboard) was influenced by the
surface texture of the substrate especially for one and two
coats of finish. The smooth-surface hardboard and
Douglas-fir plywood had the highest one-coat MEE and the
rough-surface flakeboard and particleboard, the lowest.
Differences in MEE were less for two and especially for
three coats. Similar trends were found for the enamel
(finish 67) but the differences for this pigmented finish were
much less than for the unpigmented varnish.
The MEE
14
of one coat of paraffin wax (finish 30) applied
by dipping, was affected by the general structure of the
specimen. The results were as follows:
Ponderosa pine
62
Southern pine
90
Red oak
82
Douglas-fir plywood
42
Flakeboard
65
Western redcedar
89
Hard maple
99
Particleboard
53
Hardboard 89
Composite wood products that had surface and/or edge
irregularities (Douglas-fir plywood, flakeboard, particleboard)
had the lowest MEE; smooth specimens the highest
(hardboard, southern pine, hard maple, western redcedar).
The MEE of red oak was lower than that for hard maple,
reflecting the difficulty of sealing the large red oak vessels.
The western redcedar could be effectively sealed with
paraffin wax and the oils and other extractives in western
redcedar apparently did not disrupt the ability of the wax to
prevent the penetration and adsorption of water into the
wood. The MEE value for ponderosa pine was unexpectedly
low (62 pct) as compared to the value of 95 percent found
earlier for different samples (table 6).
Different Size Specimens
The size (3 x 5 x 5/8 in.) and shape of the specimens used
in these studies were chosen to represent a typical
predominantly flat-grained surface and for convenience.
Since water is adsorbed more rapidly through the end grain
of the wood (22,25) the size and shape of the wood
specimen are expected to have an effect on MEE, as is the
amount or ratio of end grain to lateral surface (tangential
and radial). Ease of application and the size and shape of
edges must also be important factors in determining the
MEE of any finish.
We did only one brief study on shape and size of
specimens. The soya-tung alkyd enamel (finish 87) was
applied in one, two, or three brush coats to ponderosa pine,
southern pine, red oak, Douglas-fir plywood, and Douglas-fir
flakeboard wood specimens. Specimen sizes were 3 x 5
x 5/8 in. and 6 x 10 x 5/8 in. (tangential x longitudinal
x radial). This means the flat grain (tangential) surface was
increased by a factor of four while the end grain and vertical
grain (radial) surfaces were increased by a factor of two in
going from the small to the large specimens.
The results of this study (table 11) show that the MEE is
affected most by the amount of finish (coverage) applied to
the wood surface. The greater the amount applied (the lower
the coverage in ft
2
/gal), the greater the MEE. We found we
could not consistently apply equal amounts of finish to the
surfaces by brushing. In one case (ponderosa pine) the
finish was applied at lower coverage for the small (3 x 5 in.)
versus the large (6 x 10 in.) specimens. For three others
(southern pine, red oak, flakeboard) the opposite was true.
Only in the Douglas-fir plywood specimens were relatively
equal quantities of finish applied to the surfaces. In this case
the MEE
14
found for the finish was only slightly higher for
the large specimens than for the small specimens (for
convenience only MEE
14
values are shown in table 11, other
MEE values were similar).
The overriding effects on MEE of coverage or amount of
material applied to the wood surface are illustrated in
figure 10. The MEE for each substrate for one, two, or three
coats of finish is plotted against the total coverage of the
finish. Each set (one, two, or three coats) shows a fairly
close relationship between MEE and total or cumulative
coverage (individual coverage values were added together
for two- and three-coat applications). Assuming a linear
relationship between MEE and coverage, regression
analysis gave squared correlation coefficient (R
2
) values for
one, two, and three coats of 61, 48, and 47 percent,
respectively.
24

Table 11.—Effect of specimen size and finish coverage on the moisture-excluding effectiveness (MEE
14
) of finish 67 on dif-
ferent wood substrates after 14 days exposure at 90 percent relative humidity
Coverage
Wood subtrate
Specimen
Size
1 coat
2 coats
3 coats
1st
2nd 1st 2nd 3rd
MEE
14
1 coat 2 coats 3 coats
In.
----------------------Ft
2
/gal-----------------------
--------------Pct--------------
3 x 5
429
413
672
397
608
534
56 77
85
6 x 10
575
586
667
575
628
759
43
67
77
3 x 5 560 512 845
497 853 776
62
81
87
6 x 10 419
417
495 390
472
493
73 85
90
3 x 5
498
513
711
483
760
830 52
70 76
6 x 10
415 403
437
422
436
453 60 80 86
3 x 5
342 344
525
348 525
471
74 83
88
6 x 10
331
345
424
325
443
510
77 87 90
3 x 5
486 498
787
449
712
819
65
76
82
6 x 10
297 316
396
327
386 437
72
83 86
Ponderosa pine
Southern pine
Red oak
Douglas-fir plywood
Flakeboard
Figure 10.—Linear regression lines for
moisture-excluding effectiveness (MEE) of 1, 2, and
3 coats of a soya-tong alkyd enamel (finish 67) as a
function of coverage. For each coat number, each
point derives from a different substrate.
25
Test Procedures, Materials, Methods
Effect of Density of the Wood Specimen
In general, all other factors being constant, the higher the
density of a wood specimen, the higher will be the nominal
MEE of the finish applied to it. This dependence is roughly
linear but changes with time from treatment–the slope gets
steeper with the lapse of time. The dependence of MEE on
density also weakens as the number of coats increases.
We investigated the relationship between wood density and
MEE with scatter plots. Using a simple statistical model, we
made an adjustment for the density of the wood specimens.
Details of this adjustment are given in Appendix C.
However,
when we ranked the MEE values adjusted for the density of
the wood specimens used in this study, we found only minor
differences from the ranking of unadjusted values. For
example, ranked by either type of MEE, the same finishes
fell in categories excellent (>75 pct MEE) and good (50 to
75 pct MEE). There was one switch from fair (25 to 50 pct
MEE) using unadjusted MEE’s to poor (<25 pct MEE) using
adjusted MEE’s. To reduce the effect of density our
experimental procedure called for three wood specimens as
replicates, one each of low, medium, and high density, for
each finish coat combination. This procedure seems to have
been adequate.
Variability of MEE
The variation in MEE comes from several sources. Variation
in density and variation in finishing are two major sources
easy to identify. The contribution of density varies from finish
to finish and, within finish, from one coat to two coats to
three coats.
The finishes that show relatively little variance may be
particularly impermeable to water. This seems likely for three
coats of finishes 6, 63, and 64; for these, wood density
should have little effect on MEE (see the right-hand column
of table 3) The other identifiable component of MEE
variability, coverage (equivalently, volume of finish applied),
can decrease MEE variability as well as increase it. From
plots and summary statistics, it seems that the small
variation in coverage seen in this study usually has a small
impact on MEE when only one substrate is considered. (In a
few cases, notably finish 41, the relatively large amount of
finish applied to the least dense specimens for one coat and
three coats may reduce the variability that one might expect
from considering only the effects of density.)
26
The MEE of modern surface finishes (paints, lacquers,
varnishes, etc.) and intrasurface coatings (water repellents
and wood sealers) was evaluated on clear ponderosa pine
(
Pinus ponderosa) sapwood. This substrate was used to
determine the rate of vapor transmittance for all the finishes
and combination of finishes used in these studies, and was
the reference medium for extensions to other substrates. A
diversified selection of commercially available finishes was
evaluated.
Specimens
The degree of protection obtained from a finish as a vapor
retarder is governed by the size and species of the
specimen (3,4,12). The effects on MEE of nine wood
substrates and two sample sizes were evaluated. All solid
wood specimens were cut from flat-grained lumber of
differing densities. A representative pair from each of three
density ranges (high, medium, and low) was used to
evaluate each coating.
Standard Specimens
Ponderosa pine sapwood was chosen as a representative,
commercially available softwood substrate. The 3-inch
(tangential) by 5-inch (longitudinal) by 5/8-inch (radial) clear
specimens had the corners, ends and edges rounded to a
1/4-inch radius by routing and then sanding. This shape
decreased application difficulties and damage due to
handling of the finished surfaces (fig. 1).
Specimens from Other Substrates
Nine wood substrates were used to evaluate differences
between species of a few selected finishes. The specimens
were cut from the following substrates. (Note exceptions to
the standard ponderosa pine dimensions for some of the
wood composite products):
1. Douglas-fir plywood.–Commercial, exterior-grade
Douglas-fir (
Pseudotsuga menziesii
) heartwood plywood
(3 x 5 x 5/8 in.).
2. Hardboard.–Commercial, sanded, exterior-grade
hardboard (3 x 5 x 3/8 in.).
3. Particleboard.–Commercial, exterior-grade, softwood,
particleboard (3 x 5 x 5/8 in.).
4. Flakeboard.–Structural flakeboard manufactured from
Douglas-fir at the Forest Products Laboratory, Madison,
WI (
13) (3 x 5 x 1/2 in.).
5. Southern pine.-Southern pine (Pinus sp.) sapwood
(3 x 5 x 5/8 in.).
6. Western redcedar.–Western redcedar (Thuja plicata)
heartwood (5 x 5 x 5/8 in.).
7. Ponderosa pine.–Ponderosa pine (Pinus ponderosa
)
sapwood (3 x 5 x 5/8 in.).
8. Red oak.–(Quercus sp.) heartwood (3 x 5 x 5/8 in.).
9. Hard maple.-Hard maple (Acer sp.) heartwood
(3 x 5 x 5/8 in.).
Large Specimens
Southern pine, red oak, Douglas-fir plywood, flakeboard, and
ponderosa pine as described above were cut into 6-inch
tangential by 10-inch longitudinal specimens with respective
radial measurements. The corners, edges, and ends were
rounded to a 1/4-inch radius by routing and sanding.
Finishes
A wide variety of wood finishes, both commercially available
and laboratory prepared, were evaluated in this study.
Appendix A and (8) list the individual finishes with
classification by manufacturer according to use. Composition
details are shown in both Appendices and in (8).
Combinations of these individual finishes were also
evaluated (table 7).
Equipment
Belt Sander
An 18-inch belt sander equipped with 100-grit cloth belts
was used for the preliminary sanding of all specimens.
Exposure Racks
To achieve optimum vapor transmittance, it was necessary
to use exposure racks in which the specimens were able to
hang freely. The racks were made of 5/8-inch plywood to fit
the appropriate size specimen. Each rack held
18 specimens (fig. 1). Three pairs of specimens
(pair = finished plus unfinished, end-matched control) for
each one-, two-, and three-coat applications of that finish
were hung 5/8-inch apart on screw eyes.
Relative Humidity Rooms
Specimens were conditioned, tested, and weighed in three,
walk-in, humidity-temperature rooms; 30 percent RH/80 °F;
90 percent RH/80 °F; and 44 percent RH/72 °F.
Balance
An electronic balance with a 1,200-gram capacity was used.
This balance was maintained in the 44 percent RH/72 °F
room where the specimens were weighed to the nearest
0.01 gram. Specimens were kept in polyethylene
bags while being transported from the 30 and 90 percent RH
rooms to the 44 percent RH weighing room.
27
Methods
Specimen Preparation and Selection
Specimens cut from both lumber and sheets of wood
composite products were prepared in the same manner.
Each board or sheet was abrasive planed with 50- then
80-grit paper, ripped longitudinally into 3-inch or 6-inch strips
that were then cut tangentially into their respective lengths,
5 or 10 inches. The comers, edges, and ends of all
specimens were routed to a 1/4-inch radius using a steel
carbide router. A 3/32-inch hole was drilled in the center top
of each specimen. Final sanding of the specimens began
with one quick pass of the face surface and rounding of the
routed edges and ends of each specimen on a belt sander.
The smoothing of edges, ends and corners was done by
hand using 120-grit paper. All specimens were vacuumed
using an industrial-size vacuum with a brush attachment,
tied into bundles according to board designation, and with
end grain exposed preconditioned at 30 percent RH/80 °F
for a minimum of 4 weeks. The average conditioned weight
per specimen per board was recorded.
For each finish in test, three pairs of end-matched
specimens were selected from boards with different
densities for each of one-, two-, and three-coat applications.
This yielded a total of 18 specimens per finish tested. The
three pairs were selected with as large a weight difference
as possible to guarantee that each would represent a
different range of density being tested (high, medium, or
low).
Finish Application
An aluminum hook was screwed into the predrilled hole at
the top of each preconditioned specimen following selection
for test. One specimen from each pair was labeled as the
control and placed on an exposure rack for further
conditioning. The other member of the pair was labeled by
attaching a cardboard tag to the hook, wrapped in a plastic
bag, and taken to the laboratory for finishing.
A 1-1/2-inch nylon or natural bristle brush was used to seal
the specimen completely with the finish while holding it by
the hook. All ends and edges were coated first and the
excess material worked into the face surfaces. Uniform
brushing was maintained. Wet weights applied (±0.01 g)
were determined by weighing the brush and finish container
before and after application. A small selection of finishes
was also applied using a 30-second dip. Excess finish was
allowed to drip off the specimen and back into the dipping
receptacle. Approximate wet weights applied were again
recorded. The average finish coverage par coat for three
specimens in ft
2
/gal was calculated (table 1).
The finished specimens were air dried in a laboratory hood
while hanging on an exposure rack for a minimum of
24 hours before applying the next coat or returning them to
30 percent RH/80 °F.
Conditioning, Cycling, and Recycling
Preliminary testing was done to determine the type and
extent of exposure to be used in this study. Prior to test, the
finished specimens and their matching controls were brought
to EMC at 30 percent RH/80 °F. The three pairs of
specimens per number of coats for a finish (total of six
specimens) were always tested simultaneously. Preferably,
one-, two-, and three-coat applications of each finish (total of
18 specimens) were tested together. This procedure
eliminated the slight variability in humidity room conditions
(±1 pct) for comparing the effectiveness between coats. To
minimize additional error, the specimens were individually
wrapped in plastic freezer bags for transportation from
humidity room to humidity room, thereby preventing
exposure to the uncontrollable ambient conditions. The
exposure racks used in test were transferred from one
humidity room to another along with the bagged specimens.
As the same specimens were recycled, identical techniques
were used.
Weightng Techniques
Weights recorded in this study were taken from an electronic
balance in a 44 percent RH/72 °F room. Exposure of the
specimens to these conditions was brief. Weights were
taken at days 1, 7, and 14 from the time the specimens
entered each humidity.
28
Summary and Conclusions
Tests
Original and Noncontinuous Cycles
The standard and the large specimens of every substrate
were all exposed to 90 percent RH/80 °F until MEE was
50 percent or less while in the adsorption phase of the first
test cycle. This procedure was designated the original test
cycle. The specimens were weighed after 1, 7, and 14 days
without exception and every 7 days thereafter while at
90 percent RH/80 °F until MEE reached 50 percent. Once
this MEE was reached, the specimens were returned to
30 percent RH/80 °F for re-equilibrating.
Various finishes that performed moderately well to very well
on the standard specimens in the original test cycle (table 9)
were selected and recycled through two more adsorption/
desorption cycles. In each cycle, the specimens were first
equilibrated at 30 percent RH/80 °F, then transferred to
90 percent RH/80 °F for 14 days of adsorption and
immediately returned to the 30 percent RH/80 °F for 14 days
of desorption, followed by re-equilibrating. This form of
recycling, equilibrating-testing-equilibrating, is referred to as
noncontinuous cycling of specimens.
Continuous Cycles
To monitor the effects of continual humidity changes, three
new pairs of duplicate standard specimens for each of one,
two, and three coats were prepared using one of the
following finishes: an unpigmentad white shellac (finish 23),
a pigmented enamel (finish 77), or an aluminum-pigmented
paint (finish 65). The specimens were tested for three
continuous cycles of 14 days of adsorption at 90 percent
RH/80 °F followed by 14 days of desorption at 30 percent
RH/80 °F, followed immediately with the next adsorption
cycle at 90 percent RH. The specimens began the cycling
after being brought to EMC at 30 percent RH/80 °F.
This report presents results of investigations made to
increase knowledge of the degree to which wood can be
stabilized in MC with protective finishes. Wood finishes are
generally regarded as inefficient stabilizing devices because
they merely retard the rate of change in MC without
changing the equilibrium that will finally be reached under
any given conditions of temperature and humidity. Our work
demonstrates that some effective modern finishes limit the
changes in MC of wood to a fraction of the changes that
take place in unprotected wood.
These studies deal with wood while it is undergoing changes
in MC. They are not directly concerned with the equilibrium
MC of wood in an environment of constant dampness or
dryness because finishes have no effect on such
equilibrium. Our interest was in how long it takes the wood,
with and without finishes, to change from the initial to the
final equilibrium MC or to change some fraction of the
difference between the two equilibriums, when the dry wood
was exposed to damp air. In other words, we are concerned
with variable state not with steady-state conditions. Under
variable-state conditions, some factors that are relatively
unimportant under steady-state conditions become
significant; size of test specimens is an example; the
permeability of the finish taken by itself is not enough to
determine the results obtained.
The moisture-excluding effectiveness described in our
studies is a measure of the moisture gain (from water vapor)
of wood protected on all sides by the finish, as compared to
the moisture gain of unfinished wood, when both pieces of
wood are exposed to a controlled atmosphere of 90 percent
RH/80 °F for a given time after being brought to equilibrium
at 30 percent RH/80 °F. For example, compared with the
unprotected wood, three coats of an aluminum
flake-pigmented varnish on ponderosa pine wood were
84 percent effective in controlling moisture vapor movement
after 14 days; after 60 days, the MEE was still 51 percent. In
contrast, one coat of the pigmented varnish was only
41 percent effective after 14 days while a three-coat
penetrating water-repellent finish was only 11 percent
effective after 14 days.
29
The most effective moisture-resistant finishes found for wood
were two finishes not usually considered for use on wood.
The first, an epoxy sheathing compound (two-component) is
essentially an adhesive consisting of 100 percent solids.
Most of the commercial finishes used in our studies had
some solvent or dispersant ranging from 20 to 50 percent of
the weight of the finish. The second finish was molten
paraffin wax applied to the wood by dipping (brushing was
also used but was not as effective). One coat of the epoxy
finish gave an MEE of 54 percent after 14 days; three coats
gave an MEE of 91 percent after 14 days, and 70 percent
after 60 days. The paraffin wax finish gave an MEE of
95 percent after 14 days and 79 percent after 60 days.
When brushed on, the paraffin wax effectiveness was
69 percent after 14 days and 27 percent after 60 days.
With the exception of the two finishes described above, both
of which were unpigmented, the wood finishes found most
effective in excluding moisture were pigmented products with
nonaqueous solvents or dispersants in their compositions
such as mineral spirits, alcohol, or turpentine. The MEE of a
transparent finish was improved markedly by the addition of
pigments. For example, a polyurethane varnish
(one-component) was improved by adding 2 lb/gal of an
aluminum flake pigment; its three-coat MEE, originally
44 percent after 14 days, rose to 84 percent after the
addition. Corresponding MEE values for an unpigmented
and pigmented shellac were 42 and 73 percent.
The most effective of the commercially available pigmented
finishes were two-component epoxy enamel paints,
aluminum flake-pigmented varnishes (already mentioned), a
soya-tung alkyd enamel, and a soya-linseed alkyd enamel.
These studies illustrate the MEE of many commercially
available finishes for wood ranging from transparent,
penetrating-type finishes (sealers, waxes, oils) to pigmented
film-forming ones (paints, sealer shellacs, primers). The
effects of cycling humidity conditions and different wood
substrates are illustrated. Time effects and coating thickness
are discussed in detail.
It is clearly shown that any use of paints and other finishes
as a moisture vapor retarder for wood must take exposure
conditions into account. Good moisture barriers may almost
completely insulate wood from short-cycle humidity
variations, and at the same time be ineffective against
long-term seasonal cycles. Time is an extremely important
factor in determining not only the extent but also the
character of the response of wood to humidity change.
Few seem to realize the effect that finishes may have on
wood warping. In many kinds of goods, the front surface of a
wood panel is finished with a coating very effective against
moisture movement while no attention is paid to the back or
even the edges. When moisture changes take place, the
gain or loss of moisture is much greater on the unprotected
side than on the finished side and, if the changes occur
rapidly, warping is almost sure to result. Such difficulties
could be avoided by applying to the back and edge of the
wood any coating that will balance the front coating in
moisture resistance. This practice would not only reduce the
rate of change in MC but permit better equalization of
adsorbed moisture. The results of these studies should help
in the selection of finishes, whether for the similarity of their
moisture vapor resistance or for very high
moisture-excluding effectiveness.
30
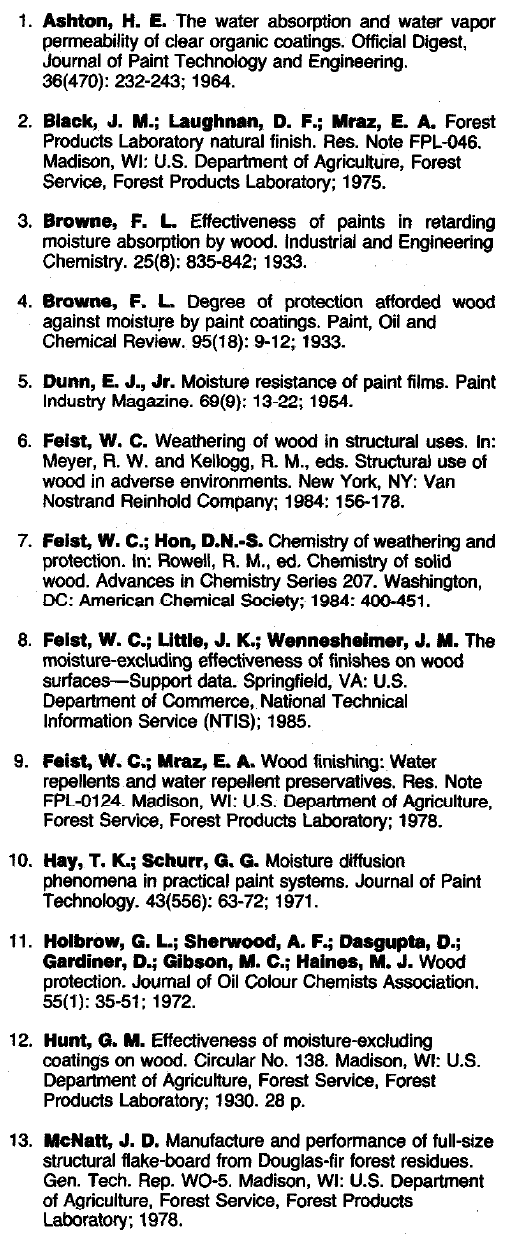
Acknowledgments
Literature Cited
Edward A. Mraz (retired) and Peter G. Sotos, physical
science technicians at Forest Products Laboratory, gave
helpful suggestions and technical assistance in this study.
31

32

Appendix A
Description of Wood Finishes Used in
These MEE Studies
The information in table Al is as supplied by the manufac-
turer on the container label. A complete description of fin-
ishes used in these studies is available (8).
Table A1—Finish numbers and description
Finish Description
EXTERIOR, UNPIGMENTED, NONAQUEOUS
(4 FINISHES TESTED)
1
Two-component, polyurethane, clear gloss finish
2
Phenol-formaldehyde/linseed-tung wood sealer
3
Water repellent (9)
4
Polymeric roof coating
COMBINATION EXTERIOR/INTERlOR, UNPIGMENTED,
5
6
7
8
9
10
11
12
13
14
15
16
17
18
19
20
21
22
23
24
25
26
27
28
29
30
31
32
33
34
35
NONAQUEOUS (12 FINISHES TESTED)
Modified butyl-acrylo-styro epoxy finish
Two-component sheathing epoxy (adhesive)
Polyurethane gloss varnish
Tung oil
Two-component polyurethane sealer
Two-component polyurethane sealer
Linseed oil
Linseed oil in mineral spirits
Polyurethane gloss varnish
Soya alkyd/phenolic/tung gloss varnish (spar)
Polyurethane gloss varnish
Polyurethane gloss varnish
INTERIOR, UNPIGMENTED, NONAQUEOUS
(19 FINISHES TESTED)
Lemon oil furniture polish with silicone
Nitrocellulose semigloss lacquer
Polyurethane satin varnish
Soya alkyd/maleic/China wood oil gloss wood finish
Linseed alkyd/maleic/China wood oil satin wood finish
Orange shellac
White shellac
Epoxy gloss varnish
Phenolic/tung floor sealer
Linseed/phenolic/tung floor sealer
Soya alkyd gloss wood finish
Alkyd satin wood finish
Spray furniture polish (lemon creme, wax, and silicone)
Paraffin wax
Wallpaper sealer
Brazilian Carnuba paste wax
Soya epoxy gloss floor and trim sealer
Polyurethane satin varnish
Nitrocellulose/alkyd lacquer
Table A1—Finish numbers and description—con.
Finish
Description
EXTERIOR, UNPIGMENTED, AQUEOUS
(NO FINISHES TESTED)
COMBINATION EXTERIOR/INTERIOR, UNPIGMENTED,
36
37
38
39
40
41
42
43
44
45
46
47
48
49
50
51
52
53
54
55
56
57
58
59
60
61
62
63
64
65
66
67
68
69
70
71
72
73
74
75
AQUEOUS (NO FINISHES TESTED)
INTERIOR, UNPIGMENTED, AQUEOUS
(4 FINISHES TESTED)
Acrylic gloss varnish
Acrylic satin varnish
Alkyd varnish
Acrylic gloss wood finish
EXTERIOR, PIGMENTED, NONAQUEOUS
(19 FINISHES TESTED)
Aluminum-pigmented polyurethane gloss varnish-l
Aluminum-pigmented polyurethane gloss varnish-2
Aluminum-pigmented polyurethane gloss varnish-3
Aluminum-pigmented polyurethane gloss varnish-4
Two-component polyurethane gloss paint
Soya alkyd flat marine enamel
Soya alkyd gloss marine enamel
Soya alkyd semigloss marine enamel
Alkyd (monopoxy) gloss enamel
Soya-linseed alkyd flat undercoat paint
Semitransparent linseed oil-based stain (2)
Semitransparent linseed oil-based stain
Soya alkyd/linseed flat paint
Soya alkyd flat primer paint
Soya/silicone alkyd gloss enamel
Semitransparent linseed oil-based stain
Solid color linseed oil-based stain
Tall alkyd/soya alkyd gloss house paint
Tall maleic alkyd/soya alkyd flat primer paint
COMBINATION EXTERIOR/INTERIOR, PIGMENTED,
NONAQUEOUS (17 FINISHES TESTED)
Epoxy resin gloss paint
Pigmented Hat shellac
Sealer-primer flat finish
Phenolic alkyd floor and deck gloss enamel
Two-component epoxy/polyamide gloss paint
Two-component epoxy/polyamide satin paint
Aluminum-pigmented ester gum/vegetable oil metal and ma-
sonry paint
Aluminum-pigmented petroleum resin utility paint
Soya-tung alkyd satin enamel
Soya-linseed alkyd gloss floor and deck enamel
Two-component epoxy/polyamide gloss enamel
Pigmented sealer-primer flat shellac
Linseed-phenolic/menhaden-phenolic aluminum paint
Linseed-menhaden alkyd gloss paint
Two-component polyurethane gloss enamel
Soya alkyd gloss enamel
Primer/sealer paint
33

Appendix B
Composition of Finishes
a
Table A1—Finish numbers and description—con.
This listing provides quantitative measures of the
Composition of the 91 finishes investigated in this study,
Finish Description
which are grouped according to their finish characteristics.
INTERIOR, PIGMENTED, NONAQUEOUS (3 FINISHES TESTED)
Table B1.—Composition of finishes
a
.
76 Soya alkyd flat paint
77 Soya alkyd gloss enamel
Solids
78
Soya-linseed alkyd semigloss enamel
Total
Total
Total
Finish
Surface
b
Finish
Manu-
pigment
resin
oil
density
Meas-
fac-
EXTERIOR, PIGMENTED, AQUEOUS (6 FINISHES TESTED)
79
Acrylic latex flat primer paint
80
Acrylic latex Hat house paint-1
81
Acrylic latex flat house paint-2
82
Acrylic latex flat house paint-3
83
Acrylic latex solid color stain
84
Acrylic latex/soya alkyd flat house paint
COMBINATION EXTERIOR/INTERIOR, PIGMENTED, AQUEOUS
(2 FINISHES TESTED)
85
Acrylic latex/epoxy ester concrete floor paint
86
Pigmented acrylic shellac primer
INTERIOR, PIGMEMED, AQUEOUS (5 FINISHES TESTED)
87
Vinyl acetate-acrylic latex enamel undercoat
88
Acrylic latex satin enamel
89
Acrylic latex flat enamel
90
Butadiene-styrene latex flat primer paint
91
Vinyl acrylic latex flat wall paint
34
ured
turer
Lb/gal
------------------Pct------------------
EXTERIOR, UNPIGMENTED, NONAQUEOUS
1
Gloss
8.22
43.6 34.7 0.0 34.7
0.0
2
Satin
7.14
20.3
22.5
0.0
10.4
12.1
3
—
6.71 12.6 10.9
0.0 9.8
0.0
4
— 7.52 31.5 38.4 6.9 26.2 0.0
COMBINATION EXTERIOR/INTERIOR, UNPIGMENTED, NONAQUEOUS
5
Flat
8.39
29.0
—
0.0
29.0
0.0
6
Goss
8.80
99.0
—
0.0 99.0
0.0
7
Gloss
7.51
50.7
47.5
0.0
47.5
0.0
8
—
7.79 99.9
99.9 0.0
0.0
99.9
9
Gloss 8.24
46.2
40.0
0.0
40.0
0.0
10
Gloss
7.98 40.7
40.0
0.0
40.0
0.0
11
— 7.78 99.9
99.9 0.0
0.0 99.9
12
—
7.11 52.1 50.0
0.0 0.0 50.0
13
Gloss 7.63 53.5 49.5 0.0 49.0 0.0
14
Gloss 7.55 59.0 54.3 0.0 47.6 6.7
15
Gloss 7.37 55.3 45.6 0.0 45.3 0.0
16
Gloss 7.52
54.1
52.0 0.0 52.0 0.0
INTERIOR, UNPIGMENTED, NONAQUEOUS
17
—
———
0.0
—
—
18
Satin 7.59
19.0
21.5
0.0 21.5 0.0
19
Satin
7.74 51.3 44.8
0.0
44.8 0.0
20 Gloss
7.43 43.9 40.3
0.0
38.5
1.8
21
Satin
7.75
44.7
39.1
8.0
28.4 2.7
22 —
7.54
31.0 30.7 0.0
30.7 0.0
23 —
7.52
30.0 30.7 0.0 30.7 0.0
24
GIoss
7.18 42.7 40.8
0.0 39.6
0.0
25 — 7.04 37.2 33.6 0.0
13.3
20.3
26 — 7.32 52.0 48.3
0.0 41.1 7.2
27 Gloss
7.50
43.1
41.5
0.0
41.5 0.0
28
Satin 7.20 33.7 29.5
7.6
21.9 0.0
29
—
—
4.5 —
0.0
——
—
30 — — 99.9 0.0 0.0 0.0
31
—
8.47
19.0
—
0.0
——
—
—
———
32 — 0.0
33
Gloss 7.02
30.4 31.5
0.0
30.0 0.0
34
Satin
7.41
46.7 45.0
2.0
43.0 0.0
35 GIoss
7.60
25.5 31.0
0.0
25.4 2.5

Table B1.—Composition of finishes
a
—con.
Table B1.—Composition of finishes
a
—con.
Solids
Solids
Finish
Surface
b
Finish
Manu-
Total
Total Total
Finish
Surface
b
Finish
Manu-
Total
Total
Total
density
Meas-
fac-
pigment
resin
oil
ured
turer
Lb/gal
---------------------Pct---------------------
INTERIOR, UNPIGMENTED, AQUEOUS
36 Gloss 8.63 36.7 28.2 0.0 28.2 0.0
37 Satin 8.75 38.0 29.5
1.5
28.0 0.0
38 Gloss
9.33 44.4 44.0 4.0 40.0 0.0
39 Gloss
8.88 39.6 37.0 0.0 33.0 0.0
EXTERIOR, PIGMENTED NONAQUEOUS
40
Gloss
8.32 63.3 54.0
13.8 40.1
0.0
41
Gloss
8.29 63.8 54.0
13.5
39.2 0.0
42
Gloss 8.28 62.6 54.0
13.5
39.2 0.0
43
Gloss 8.30 64.5 54.0
13.6
39.5
0.0
44 Gloss
10.32 63.5 52.1
42.1
29.4 0.0
45
Flat
10.58
66.4 61.4
42.1 19.1
0.0
46
Gloss
9.66 69.2 65.7
28.6
36.7
0.0
47 Satin
10.73
71.8
70.2
40.5
29.4 0.0
48
Gloss
9.74 63.2
61.1
30.0
29.2 0.0
49
Flat
11.74
75.3 70.9 52.7
16.6 0.0
50
— 7.96 75.5 75.7
8.4
0.0 61.0
51
— 7.90 77.9 — —
——
52
Flat
10.57
73.0
62.1
42.2
13.5
6.4
53
Flat
10.61
70.0 63.7 44.0
19.7
0.0
54
Gloss 9.49
65.1
62.5 25.6
35.1
0.0
55
—
6.91
20.5 — —
56
— 9.48 59.6 — —
——
57
Gloss 9.10
67.3 65.0 26.0 38.0
0.0
58
Flat
11.40 78.5 74.0
45.0
28.0 0.0
COMBINATION EXTERIOR/INTERIOR, PIGMENTED, NONAQUEOUS
59
Gloss 9.69 43.0
41.1 18.1
23.0 0.0
60
Flat
9.92
53.7
53.2 31.7
21.5 0.0
61
Flat 10.14
63.3 71.2 40.0
30.0
0.0
62 Gloss
7.88
57.0
83.4 24.0
59.4 0.0
63 Gloss
10.27
64.1
61.0 28.3 32.7 0.0
64 Satin
10.66
65.6 65.0 28.3
32.7
0.0
65
Satin 8.09 61.0
59.2 19.3
4.8
35.1
66 Gloss 7.97
56.0 57.4
14.4
43.0 0.0
67 Satin
12.36
79.3 73.9
50.8
23.1
0.0
68
Gloss
9.11
66.8 56.4 24.9 31.5 0.0
69
Gloss
10.25
63.0
58.4
24.1
34.3
0.0
70 Flat 9.90 52.8
53.4
34.0
19.4
0.0
71
Gloss
7.86
47.0 49.3
13.0
36.3
0.0
72
Gloss
9.23
60.0 60.9 26.7
34.2 0.0
73
Gloss
10.10
63.7
—— —
0.0
74
Gloss
9.45
67.3 61.5 26.9 34.6 0.0
75
Flat
10.30
55.6
——
——
density
Meas-
fac-
pigment
resin oil
ured
turer
Lb/gal
---------------------Pct---------------------
INTERIOR, PIGMENTED, NONAQUEOUS
76
Flat
12.46
72.2 69.2 61.5 7.7 0.0
77
Gloss
10.39 71.1
69.5 34.6 34.9 0.0
78
Satin
10.74
68.3 69.0 46.2 22.8 0.0
EXTERIOR, PIGMENTED, AQUEOUS
79
Flat 9.76 52.0
51.0
21.0 28.0 0.0
80
Flat
10.93
53.0
50.0
29.0
19.0
0.0
81
flat
11.02
58.7
57.2
35.6 21.6 0.0
82
Flat
11.28
59.1
57.5
37.4
20.1
0.0
83 —
10.43 45.1
—
———
84
Flat 11.27 52.2
50.0 33.0
17.0
0.0
COMBINATION EXTERIOR/INTERIOR, PIGMENTED AQUEOUS
85
Satin
10.76
56.0 49.4 27.9 21.5 0.0
86 Flat
10.65 52.3
50.0 29.6
20.4
0.0
INTERIOR. PIGMENTED, AQUEOUS
87
Flat
11.20
51.4 55.7 41.3
14.4
0.0
88
Satin
10.60
51.1
49.2 26.6 22.6 0.0
89
Flat
11.03
53.5 48.0
28.2 19.8
0.0
90 Flat
10.67
56.0 57.0 31.9
23.1
0.0
91
Flat
11.09
51.0 49.5 38.0
11.5
0.0
a
For names of finishes and additional composition information see(8 ).
b
Satin = Semigloss.
35

Appendix C
Adjustment of MEE
Values for Wood Density
If an investigator wishes to compare finish performance
precisely yet knows that the effect of wood density has not
been controlled, then one way to take account of density is
by an analysis of covariance. A simpler approach, in the
same spirit as analysis of covariance, involves inserting an
emperical factor in the formula for MEE. For example, the
small ponderosa pine specimens all have the same volume.
We inserted a correction factor in the change-in-weight ratio
that appears in the MEE formula. The unadjusted MEE
(percentage) at time t is given by:
MEE
t
= (1 - ∆W
Tt
/∆
W
Ut
) x 100
where
∆
W
Tt
is the change in weight of the finished specimen
between time zero and time t and
∆
W
Ut
is the corresponding
change in weight of the matched control specimen. If
R
t
=
∆
W
Tt
/
∆
W
Ut
and A = W
UTo
/W
ref
where W
UTo
is the
equilibrium weight of the control specimen at time zero and
W
ref
is some reference weight for the uncoated specimens,
then adjusted MEE (percentage) is given by:
MEE
adj·t
= (1 - R
t
·A) x 100
For a reference weight, we used W
Uto
, the average at time t
o
of the 852 uncoated specimens in this part of the study.
Figures 11 and 12 are scatter plots respectively of the
unadjusted MEE
14
values plotted against wood density
(three replicate specimens) for each of 9 finishes.
Comparison of the figures shows that adjustment eliminates
much of the dependence of MEE on density.
A simple linear relationship (with average = a and slope = b)
seems to characterize the dependence of ordinary MEE on
density when we exclude the poor finishes. We used this
equation to relate MEE
t
to density d for k coats:
MEE
tkij
=a
tki
+ b
tk
(d
tokij
-d
tok
)
where i is finish number and j is replicate number (1, 2, or
3). Then MEE
tkij
is MEE
t
with k coats of finish i for the j-th
replicate; a
tki
is the average MEE
t
with k coats of finish i
when the corresponding density is at its average value; b
tk
is
the slope of MEE
t
on “centered” density at time t with k
coats; d
tokij
is
the density at time zero of the control
specimen before k coats of the i-th finish are applied to the
j-th replicate matching treated specimen; d
tok
is the average
density at time zero over all finishes and replicates having k
coats. Specimens with any good finish of k coats at time t
fall on one of a set of parallel lines when MEE is plotted
versus wood density. The particular finish of the specimen
determines on which line the specimen falls.
Table Cl shows the results of fitting the above equation to
data from good finishes. (The table gives our definition of
the “good” finishes used in fitting the equation. Thus, a good
l-coat finish has MEE
14
at least 25 pct for all three
replicates.) As the equation indicates, we fitted a separate
regression for each time and coat combination, for time = 1,
7, and 14 days and coats = 1, 2, and 3. The number of
observations used depends on the number of good finishes
for each coat, and thus varies with coat number. For
example, for 1 coat, we have 13 good finishes, and three
replicates for each finish; thus we have n = 39 observations
for our regression for t = 1 day, t = 7 days, and t = 14 days.
Each yields the same picture: 13 noncoincident parallel
levels. With these 13 levels plus one common slope we
have p = 14 parameters. Because p/n is about 1/3 in each
of the regressions, we report an R
2
that is adjusted for the
relatively large number of parameters.
The table shows two patterns involving the b
tk
defined in the
above equation. First, for any particular number of coats k,
the slope b
tk
gets steeper as time increases from t = 1 to
t = 14 days. This pattern follows from the definition of MEE
t
:
for any particular good finish, the ratio R
t
tends to be larger
for low-density specimens and smaller for high-density
specimens. We see this tendency in R
t
because the
denominator W
Ut
increases linearly with density while the
numerator W
Tt
remains relatively unaffected by density.
Second, for any particular time t, the common slope gets
smaller as the number of coats increases. This pattern
makes sense because the thicker the finish layer, the less
effect the wood specimen has as a sponge to draw in
water-poor sponges and good sponges alike will be
hindered by a thick coating.
The values of R
2
reported in table Cl should be viewed with
a bit of caution. If there were no relationship between wood
density and MEE but very good finishes were applied to
high-density specimens and merely good finishes were
applied to low-density specimens, one could still obtain a
high R
2
. We examined plots and regressions of MEE versus
density for each finish and for days 1, 7, and 14. The
general comments made above about the common slope
regression models appear valid in light of these individual
finish results.
36
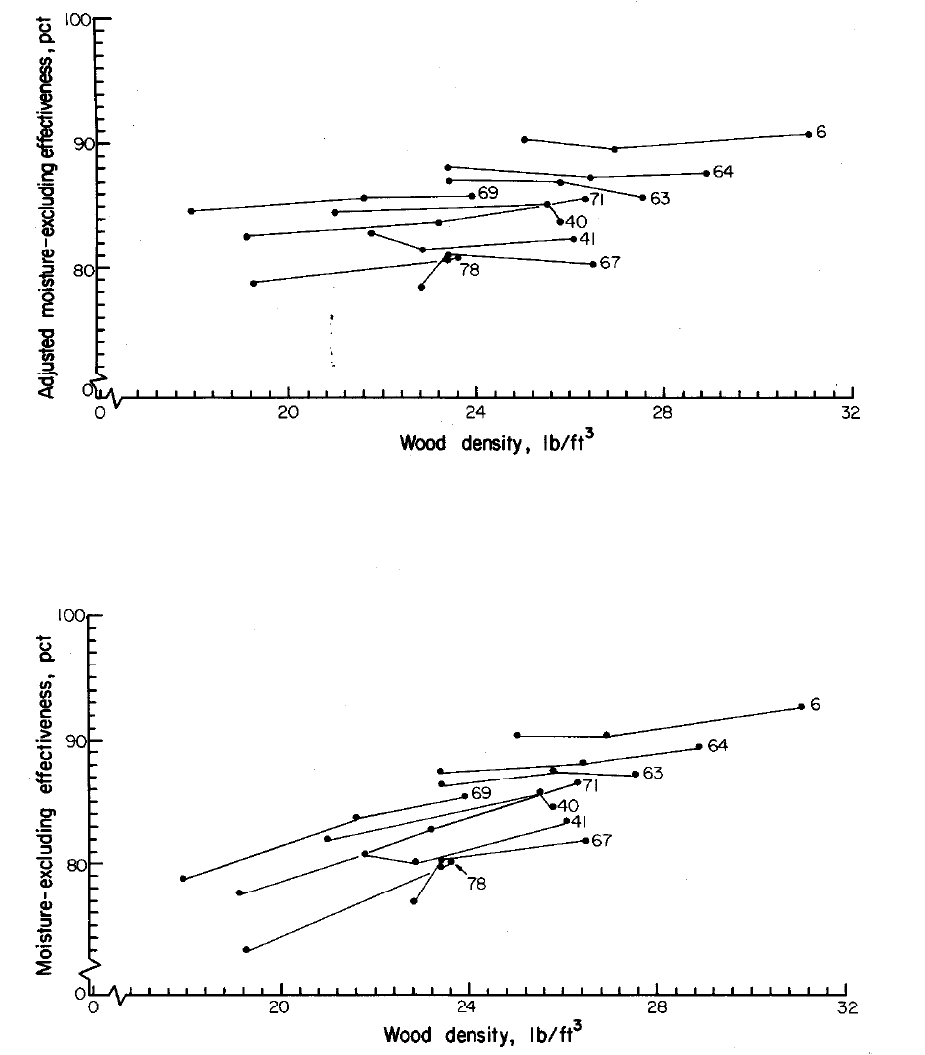
Figure 11.—Moisture-excluding effectiveness (MEE) of 9 finishes on ponderosa
pine sapwood (specimens of low, medium, and high density) after 14 days at
90 percent relative humidity and 80 °F.
Figure 12.—Adjusted moisture-excluding effectiveness (MEE) of 9 finishes on
ponderosa pine sapwood (specimens of tow, medium, and high density) after
14 days at 90 percent relative humidity and 80 °F.
37

Table C1.—Regression of moisture-excluding effectiveness (MEE) on wood density for three
thicknesses of coat and three times of exposure
1 Coat
a
Slope = b
t1
(standard R
2
adj
2 Coats
a
3 Coats
a
Slope = b
t2
Slope = b
t3
(standard
R
2
adj
adj
s
(standard R
2
error)
Duration
of test
bc
s
s
error)
error)
Days
1
0.34
39
1.94
0.14
96
0.45
0.10
94
0.36
(0.158)
(0.025)
(0.022)
7
1.80 80 3.92
1.00
97
1.53
0.69
97 0.98
(0.320)
(0.084)
(0.058)
2.46
82
4.34
1.67
96
2.45
(0.355)
1.13
98
1.50
(0.135)
(0.010)
a
1 coat: 39 observations, 3 replicates of 13 good finishes (MEE >
25 pct for every replicate, excluding finishes 1 and 6)
2 coats: 60 observations, 3 replicates of 20 good finishes (MEE >
37 pct for every replicate, excluding finish 6)
3 coats: 63 observations, 3 replicates of 21 good finishes (MEE >
50 pct for way replicate, excluding finishes 1 and 6)
b
Adjusted correlation coefficient (R
2
) is related to ordinary R
2
by this equation:
R
2
adj
= (n - 1)R
2
/(n - p) - (p - 1)/(n - p)
where n = number of observations in the regression and p = number of parameters fitted.
C
s
is the square root of the mean square error of regression and gives a summary measure of variability of regression. Values of s within the same column
are directly comparable.
3.0-12/85
38
14

The Forest Products
Laboratory (USDA Forest
Service) has served as the
national center for wood
utilization research since
1910. The Laboratory, on the
University of Wisconsin-
Madison campus, has
achieved worldwide
recognition for its
contribution to the knowledge
and better use of wood.
Early research at the
Laboratory helped establish
U.S. industries that produce
pulp and paper, lumber,
structural beams, plywood,
particleboard and wood
furniture, and other wood
products. Studies now in
progress provide a basis for
more effective management
and use of our timber
resource by answering critical
questions on its basic
characteristics and on its
conversion for use in a variety
of consumer applications.
Unanswered questions remain
and new ones will arise
because of changes in the
timber resource and
increased use of wood
products. As we approach the
21st Century, scientists at the
Forest Products Laboratory
will continue to meet the
challenge posed by these
questions.
