
State of Discipline:
2016-17 School Year
Sub-header

Table of Contents
INTRODUCTION 5
FINDINGS 8
SUSPENSIONS AND EXPULSIONS FOR THE 2016-17 SCHOOL YEAR 8
STUDENT POPULATION INCLUDED IN 2016-17 DISCIPLINE ANALYSIS 8
OVERVIEW OF IN-SCHOOL SUSPENSIONS, OUT-OF-SCHOOL SUSPENSIONS AND EXPULSIONS 9
DISCIPLINARY ACTIONS OVER TIME 10
IN-SCHOOL SUSPENSIONS 11
EXPULSIONS 12
REMOVALS TO AN INTERIM ALTERNATIVE EDUCATION SETTING 19
SUSPENSIONS AND EXPULSIONS FOR PRE-K STUDENTS 19
OUT-OF-SCHOOL SUSPENSIONS 20
FREQUENCY AND LENGTH OF OUT-OF-SCHOOL SUSPENSIONS 21
DISPROPORTIONALITY IN RATES OF OUT-OF-SCHOOL SUSPENSIONS: EXAMINATION OF SPECIFIC GROUPS OF STUDENTS 25
DIFFERENCES IN OUT-OF-SCHOOL SUSPENSION RATES ACROSS SCHOOLS 44
DISCIPLINARY ACTION AND STUDENT MOBILITY 46
DISCIPLINARY ACTION AND TRUANCY 46
EXAMINATION OF REASONS FOR DISCIPLINARY ACTION 50
RESTORATIVE JUSTICE 53
APPENDIX A: DATA METHODOLOGY 56
DEFINITIONS 56
DATA SOURCES 56
DATA CLEANING AND LIMITATIONS 56
BUSINESS RULES 57
COUNTS OF DISCIPLINARY ACTIONS 57
STUDENT-LEVEL ANALYSES 57
ANALYSIS BY DISCIPLINARY REASON 57
APPENDIX B: TABLES BY LEA/SCHOOL 58
COUNTS OF DISCIPLINARY ACTIONS BY LEA 58
IN-SCHOOL AND OUT-OF-SCHOOL SUSPENSION RATES BY LEA 59
DURATION OF OUT-OF-SCHOOL SUSPENSIONS BY LEA 61
COUNTS OF DISCIPLINARY ACTIONS BY SCHOOL 62
IN-SCHOOL AND OUT-OF-SCHOOL SUSPENSION RATES BY SCHOOL 68
DURATION OF OUT-OF-SCHOOL SUSPENSIONS BY SCHOOL 74
APPENDIX C: INTERIM REMOVALS 81
INTERIM REMOVALS BY LEA 81

INTERIM REMOVALS BY SCHOOL 81
APPENDIX D: IN-SCHOOL SUSPENSIONS AND ATTENDANCE 82
DISCREPANCIES BETWEEN SCHOOL-REPORTED ATTENDANCE DATA AND DISCIPLINE DATA 82
APPENDIX E: VERIFIED AND UNVERIFIED LEAS REPORTING ZERO ACTIONS 83
UNVERIFIED: LEAS REPORTING ZERO ACTIONS 83
VERIFIED: LEAS REPORTING ZERO ACTIONS 83

SCHOOL YEAR 2016-17 DISCIPLINE REPORT
4

SCHOOL YEAR 2016-17 DISCIPLINE REPORT
5
Introduction
The Bowser Administration, through the Office of the State Superintendent of Education (OSSE), has
taken critical steps to support schools in rethinking discipline and ensuring that every student has the
opportunity to attend school every day.
Overall, fewer students received disciplinary actions in 2016-17 compared to the 2015-16 school year.
Compared to 2015-16, 143 fewer students received an out-of-school suspension. Similarly, fewer
students in 2016-17 received an in-school suspension.
During the 2016-17 school year, 7.4 percent of District’s more than 96,000 students received at least
one out-of-school suspension, 0.6 percent of students received at least one in-school suspension, and
0.1 percent were expelled, representing a slight decline in suspensions since the 2015-16 school year.
Support and Guidance for Educators
OSSE provides training and support to local education agencies (LEAs) to address the root causes of
behavioral issues in the classroom. This report shows that one of the top reasons for disciplinary action
is disruptive or disrespectful behavior. Partnering with the Department of Behavioral Health (DBH) and
the Child and Family Services Agency (CFSA), OSSE provides the District’s educators with trainings on
positive behavioral interventions and supports, trauma informed care, youth mental health first aid, and
nonviolent crisis prevention.
In 2016, OSSE released non-regulatory guidance to assist LEAs in designing and implementing discipline
practices that are non-discriminatory in nature and application. The guidance provides
recommendations that help schools adopt comprehensive, appropriate, and effective school discipline
policies and practices that reduce disruption and misconduct while supporting positive behavior and
character development in students.
Alternatives to Suspension
To reduce disciplinary actions that result in exclusion from the learning environment, some District
schools have implemented alternative approaches to discipline and behavior management. Restorative
justice is one such approach that focuses on repairing harm through inclusive practices, responsibility,
and relationship-building, rather than punishment.
During the 2015-16 school year, OSSE launched Restorative DC to provide customized, on-site support
to specific schools in implementing restorative practices. The pilot schools reported a shift in school
culture marked by a greater sense of safety, belonging, and community.
During the 2016-17 school year, Restorative DC grew from five to eight schools: Ballou High School*,
Luke C. Moore Alternative High School*, the Columbia Heights Education Campus*, Hart Middle

SCHOOL YEAR 2016-17 DISCIPLINE REPORT
6
School*, Cesar Chavez Parkside Middle School, Kelly Miller Middle School, Neval Thomas Elementary
School, and SEED Public Charter School.
1
To provide support to more schools and educators, OSSE also hosts a state Restorative Justice
Community of Practice as well as monthly trainings focused on the implementation of restorative
practices in DC schools that are open to all LEAs and community stakeholders. Participants engage with
other educators for peer support and professional development, while experiencing how restorative
justice circles can help build community and resolve issues collectively. Guided by participants' interests,
topics include: staff buy-in, trauma awareness and resilience, restorative conversations (nonviolent
communication), implicit bias/cultural sensitivity, and special education.
Collecting and Sharing Data
OSSE continues to support LEAs in collecting and reporting data about school discipline. The Pre-K
Student Discipline Amendment Act of 2015 sought to improve data collection by establishing annual
reporting requirements related to suspensions and expulsions in pre-K through 12
th
grade. OSSE shares
this data with DC residents and the general public through this report, annual School Equity Reports, and
OSSE will include discipline data in the District’s school report cards.
Going forward, schools will continue to identify new ways to support students, and OSSE will continue to
provide support. This school year, OSSE will work directly with schools participating in Restorative DC to
collect school climate data from students, staff, parents, and families to analyze schools’ success with
the program. The Culture of Excellence & Ethics Assessment (CEEA), developed through a U.S.
Department of Education funded grant, will measure (a) whether the school climate is safe; (b) whether
faculty and staff are intentional in fostering an academically rigorous and socially engaging environment
for students; (c) whether students show positive learning habits; (d) whether students experience
positive relationships with peers and staff; (e) whether faculty and staff engage in supportive collegial
relationships; and (f) the extent to which the school engages students and families in support of student
learning and social development. OSSE will develop a report for each school and collaborate with school
leadership to develop pathways for improvement.
About the Report
Beginning in the 2015-16 school year, the Pre-K Student Discipline Act of 2015 (D.C. Law 21-12; D.C.
Official Code § 38-236) requires the Office of the State Superintendent of Education (OSSE) to publicly
report on the state of suspensions and expulsions in the District. In its second year of implementation,
the school discipline report is based on data submitted by LEAs and community-based organizations
(CBOs) from the preceding school year.
The Act requires LEAs and CBOs to collect and report to OSSE important demographic and discipline data
to assist in a critical analysis of school discipline practices. OSSE uses the data not only for this report,
but to fulfill federal data reporting obligations pursuant to federal laws including the Individuals with
1
An asterisk denotes that the school participated in whole school programming in restorative justice for school
year 2015-16.

SCHOOL YEAR 2016-17 DISCIPLINE REPORT
7
Disabilities Education Act (IDEA), 20 U.S.C. § 1400 et. seq. and the Every Student Succeeds Act (ESSA), 20
U.S.C. § 6301 et. seq.
Definitions
The District does not have standardized legal definitions or requirements for in-school suspensions, out-
of-school suspensions, or expulsions; instead, this report uses agreed-upon definitions used on the
Discipline Collection Template that LEAs use to submit discipline data to OSSE. Further, LEAs and schools
set their own discipline policies, which include their respective codes of conduct and methods for
addressing disciplinary infractions. In order to achieve some consistency, this report uses the following
definitions:
In-school suspension: Instances in which a student is temporarily removed from his/her regular
classroom(s) for disciplinary purposes but remains under the direct supervision of school
personnel. Direct supervision means school personnel are physically in the same location as
students under their supervision.
Out-of-school suspension: Instances in which a student is temporarily removed from his/her
regular school for disciplinary purposes to another setting (e.g., home, behavior center). This
includes both removals in which no individual education program (IEP) services are provided
because the removal is 10 days or less as well as removals in which the child continues to
receive services according to his/her IEP.
Expulsion: An action taken by the LEA removing a student from his/her regular school for
disciplinary purposes for the remainder of the school year or longer in accordance with LEA
policy.
Disciplinary Action: An in-school suspension, out of school suspension, or expulsion.

SCHOOL YEAR 2016-17 DISCIPLINE REPORT
8
Findings
Suspensions and Expulsions for the 2016-17 School Year
Student population included in 2016-17 discipline analysis
The student population for the 2016-17 discipline analysis includes 96,431 students attending 66 LEAs
and 231 schools.
2
This student population includes all students for whom a public LEA is responsible
during the 2016-17 school year, ranging from grades PK3-Adult with the following exclusions. OSSE does
not collect discipline data from non-public schools and therefore students that only attended non-public
schools during the 2016-17 school year are excluded. Students attending the New Beginnings Youth
Development Center, Youth Services Center, the Incarcerated Youth Program, C.H.O.I.C.E Academy and
residential schools were also excluded from this report.
3
LEAs verified enrollment and demographics for
the student population analyzed in this report as part of the comprehensive demographic verification
process.
Throughout this report there are two main types of analyses: analyses at the disciplinary action level and
analyses at the student level. Analyses at the student level include detail on all disciplinary incidents for
all students (thus students can be counted multiple times if they have multiple disciplinary incidents)
enrolled during the 2016-17 school year across all schools and sectors. This methodology differs from
the methodology used for student-level analyses in the 2016-17 Equity Reports. In the 2016-17 Equity
Reports, a disciplinary action was only reported if (a) the student was in the audited population
(enrolled on Oct. 5) and (b) the disciplinary action occurred at the audited school for that audited
student. The broader student population and attribution of disciplinary actions used throughout this
report are consistent with the specifications OSSE must follow for federal reporting. For more details
about the data limitations and methodology applied see Appendix A: Data Methodology.
2
Where relevant, the data also includes discipline information from the 2015-16 school year which included
94,053 students attending 63 LEAs and 223 schools
3
“C.H.O.I.C.E. Academy Middle and Senior High School provides a specialized alternative setting for student grades
6-12 who are in a long-term suspension or expulsion status.”

SCHOOL YEAR 2016-17 DISCIPLINE REPORT
9
Overview of in-school suspensions, out-of-school suspensions and expulsions
Examination of the suspension and expulsion data reported by LEAs and PCSB to OSSE reveals that of
the 96,431 students ever enrolled in the 2016-17 school year, 7,181 received at least one out-of-school
suspension, 613 were reported as having received at least one in-school suspension, and 100 were
expelled.
4
Figure 1 shows the number of students with at least one of each type of disciplinary action.
Appendix B provides detail on the suspension and expulsion rates reported to OSSE at the LEA- and
school-level.
In the 2016-17 school year, 7.4 percent of students received at least one out-of-school suspension, 0.6
percent of students received at least one in-school suspension and 0.1 percent were expelled.
Figure 1. Number of students disciplined by disciplinary action type
4
Some students are counted more than once in the disciplinary action categories. If a student was suspended in-
school, out-of-school, and expelled, they are counted in each column.
7,181
613
100
88,919
-
10,000
20,000
30,000
40,000
50,000
60,000
70,000
80,000
90,000
100,000
Number of Students
Students Receiving Out-of-School Suspensions Students Receiving In-School Suspensions
Students Receiving Expulsions No Disciplinary Actions

SCHOOL YEAR 2016-17 DISCIPLINE REPORT
10
Disciplinary actions over time
Figure 2 provides details on how many students received disciplinary actions over the past two years.
Overall, fewer students received disciplinary actions in 2016-17 compared to the 2015-16 school year.
Compared to 2015-16, 143 fewer students received an out-of-school suspension. Similarly, fewer
students in 2016-17 received an in-school suspension. The total number of students expelled increased
by 1 compared to 2015-16.
Figure 2. Number of students who received disciplinary actions by school year
5
5
Sums do not add for all students because a student could get more than one disciplinary action in a given year.
7,324
883
99
7,888
7,181
613
100
7,514
-
1,000
2,000
3,000
4,000
5,000
6,000
7,000
8,000
9,000
Out-of-School Suspensions In-School Suspensions Expulsions All Students
Number of Students Receiving Disciplinary Actions
2015-2016 2016-2017

SCHOOL YEAR 2016-17 DISCIPLINE REPORT
11
Figure 3 shows the total number of disciplinary actions for the past two school years. Disciplinary actions
are declining. There was a total of 14,114 disciplinary actions reported for the 2015-16 school year and a
total of 13,778 disciplinary actions reported for the 2016-17 school year.
While there were fewer disciplinary actions reported for the 2016-17 school year, there were 202 more
out-of-school suspensions and 7 more expulsions for 2016-17 compared to the previous year. The total
reported number of in-school suspensions for the 2016-17 school year is lower than the previous year.
6
When examined together, Figures 2 and 3 shows that while fewer students received disciplinary actions
in 2016-17, those who were disciplined received more out-of-school suspensions and expulsions than
what was reported in 2015-16.
Figure 3. Counts of disciplinary action types by school year
In-School Suspensions
Far fewer students received in-school suspensions (0.6 percent of students) than received out-of-school
suspensions in the 2016-17 school year. The in-school suspension data reported to OSSE revealed that
in-school suspensions were concentrated in certain LEAs. Of the 66 LEAs and 231 schools included in this
report, only 22 LEAs and 64 schools reported having in-school suspensions. In comparison to 2015-16,
6
See the section on in-school suspensions for more information on why the 2016-17 reported number may be
lower than last year.
12,695
1,320
99
14,114
12,897
775
106
13,778
-
2,000
4,000
6,000
8,000
10,000
12,000
14,000
16,000
Out-of-School Suspensions In-School Suspensions Expulsions Total
Number of Disciplinary Actions
2015-2016 2016-2017

SCHOOL YEAR 2016-17 DISCIPLINE REPORT
12
eight fewer LEAs and seven fewer schools reported in-school suspensions. Furthermore, in-school
suspensions were highly concentrated, with two LEAs accounting for 66.3 percent of all reported in-
school suspensions. DC Public Schools is the largest LEA and had the largest share of in-school
suspensions with 392 (50.6 percent) incidents. Only nine LEAs reported issuing more than ten in-school
suspensions during the 2016-17 school year.
It should be noted that of the 66 LEAs that reported their in-school suspensions, only 56 verified these
numbers. Therefore of the 44 LEAs that reported zero in-schools suspensions, ten did not verify with
OSSE that no incidents occurred and that it is the LEAs policy not to assign in-school suspensions to
students during the 2016-17 school year.
7
Due to the relatively small number of LEAs using in school suspensions as a disciplinary action, OSSE did
not conduct any in-depth analysis of the relationship between in-school suspensions and student factors
more generally at the state level.
Additionally, discrepancies were found between LEA-submitted discipline and attendance data. Nine
LEAs that reported no in-school suspensions in their discipline data submissions had a total of 704 coded
in-school suspensions listed in their attendance data.
8
For a count of in-school suspensions by LEA and
school see Appendix B. OSSE will continue to work with LEAs to improve their data accuracy.
Expulsions
In the 2016-17 school year, 106 expulsions occurred in the District of Columbia. Those 106 expulsions
were given to 100 total students; six of those students were expelled more than once. A student may be
expelled from one school in the District of Columbia, enroll in another school, and be expelled from that
school in the same year. Of the 106 total expulsions, 103 occurred at public charter schools and three
occurred at DCPS. Expulsions were concentrated at 38 schools within 23 LEAs.
7
See Appendix E for a list of these LEAs.
8
See Appendix D for more information.

SCHOOL YEAR 2016-17 DISCIPLINE REPORT
13
Expulsions by grade
Figure 4 shows the number of expulsions by students’ enrollment grade.
9
The majority of students are
expelled in the ninth grade. Tenth graders also share a large proportion of expulsions, indicating most
expulsions happen throughout high school. The third largest number of expulsions happens in adult
education and sixth grade with a total of 10 expulsions each for this year.
Figure 4. Number of students expelled by grade
9
Some grades are omitted for student privacy.
10
12
9
28
22
7
10
0
5
10
15
20
25
30
06 07 08 09 10 11 AE
Number of Expulsions
Grade of Expelled Student

SCHOOL YEAR 2016-17 DISCIPLINE REPORT
14
Expulsions by gender
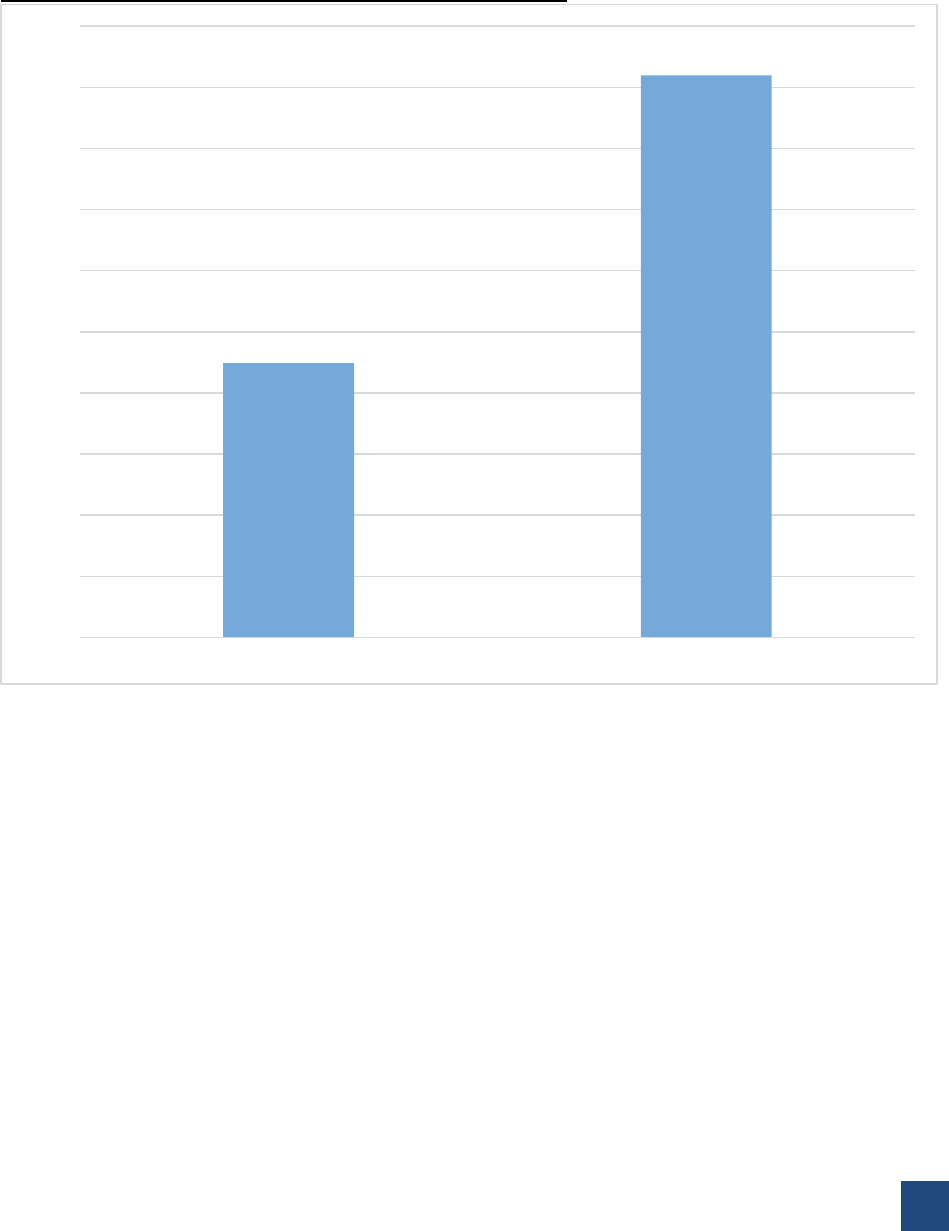
Figure 5 shows the proportion of students by gender who were expelled compared to the proportion of
students who were enrolled during the 2016-17 school year.
10
If all students were expelled at an equal
rate, the proportion of males and females who were expelled during the school year should equal the
proportion of students by gender who were enrolled during the school year. This equality of expulsions
is not what the data show. While the population is split roughly between males and females in the
enrolled population evenly (50.2 percent and 49.8 percent respectively), males count for a total of 66
out of 106 expulsions. The proportion of males in the expelled population is 62.3 percent compared to
50.2 percent of the enrolled population.
Figure 5. Proportion of students expelled by gender
10
6 students have unknown genders and have been excluded from this chart.
37.7%
40
50.2%
48,380
62.3%
66
49.8%
48,045
0% 10% 20% 30% 40% 50% 60% 70% 80% 90% 100%
Number of Expulsions
Enrolled Students
Female Male

SCHOOL YEAR 2016-17 DISCIPLINE REPORT
15
Expulsions by race
Breakdowns by race also depict disproportionate discipline rates for different racial groups for the 2016-
17 school year.
11
Figure 6 shows that of the expelled population, Black/African American students
account for 101 of 106 expulsions. Black/African American students make up 67.6 percent of the
enrolled population, but constitute 95.3 percent of all students receiving expulsions. Those identifying
as other races account for only 5 expulsions and the remaining 4.7 percent of the expelled population.
Figure 6. Proportion of students expelled by race
11
18 students have an unknown race and were excluded from this chart.
95.3%
101
67.6%
65,149
4.7%
5
32.4%
31,264
0% 10% 20% 30% 40% 50% 60% 70% 80% 90% 100%
Number of Expulsions
Enrolled Students
Black/African American Other

SCHOOL YEAR 2016-17 DISCIPLINE REPORT
16
Expulsions by Status as a Student with Disabilities
Figure 7 shows the proportion of students by their status as a student with a disability. Students with
disabilities make up 14.7 percent of the enrolled population and 16.0 percent of students who received
an expulsion. Those who are not identified as a student with a disability compose of 85.3 percent of the
enrolled population and 84.0 percent of the expelled student population.
12
Figure 7. Proportion of students expelled by students with a disability status
12
The total number of students in the enrolled population here is 96,527. This is because some students are
counted in both populations because their status was reported as a student with disabilities by one school, and as
a non-student with disabilities by another school. Both records are kept to give an accurate proportion of the
student body as the schools and LEAs believed at the time.
84.0%
89
85.3%
82,371
16.0%
17
14.7%
14,156
0% 10% 20% 30% 40% 50% 60% 70% 80% 90% 100%
Number of Expulsions
Enrolled Students
Non-Students with Disabilities Students with Disabilities

SCHOOL YEAR 2016-17 DISCIPLINE REPORT
17
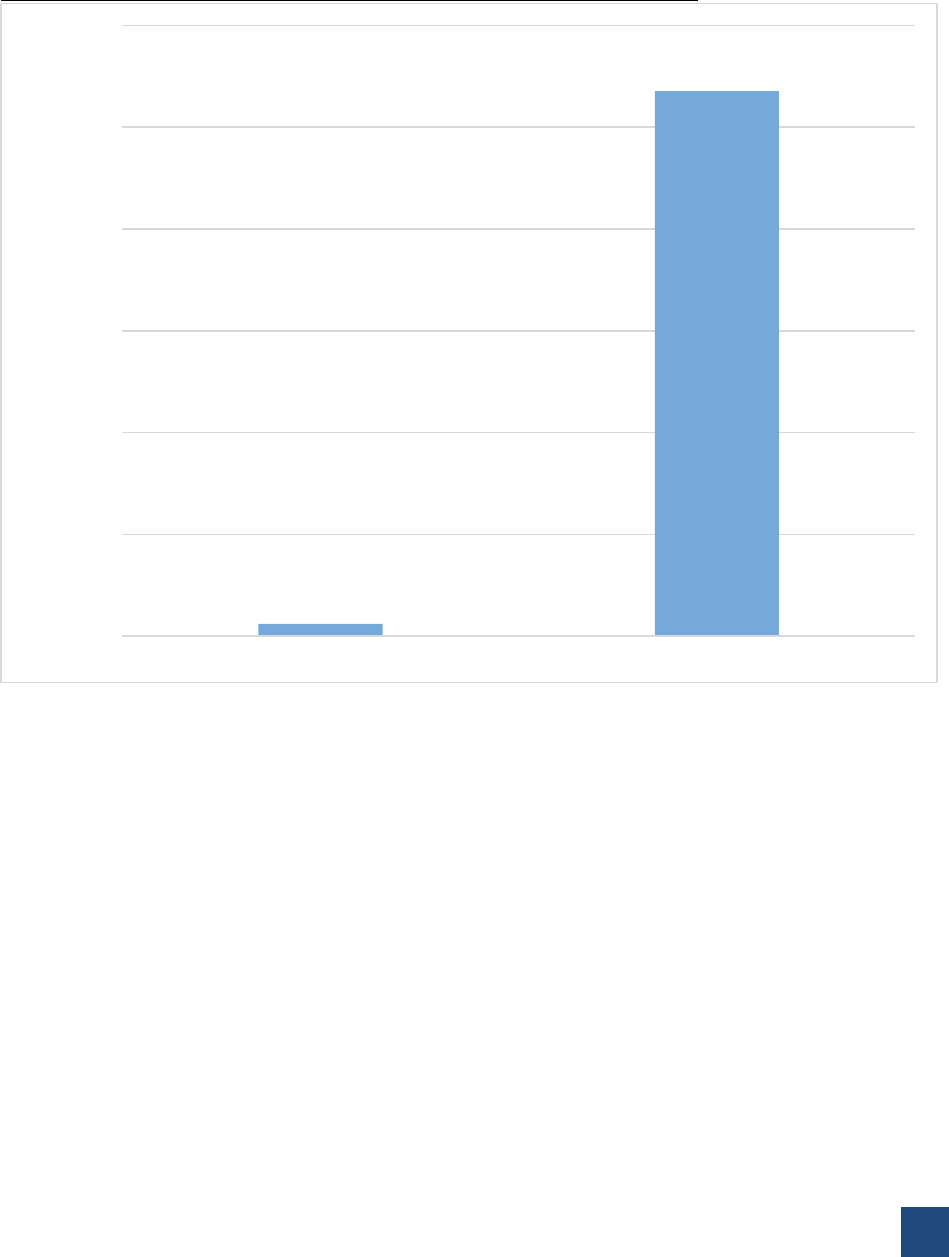
Expulsions by English learner status
Figure 8 shows the proportion of students by their status as an English learner. Students who are
identified as English learners make up 11 percent of the enrolled population and 5.7 percent of students
receiving an expulsion. Those who are not English learners compose 89.1 percent of the enrolled
population and 94.3 percent of the expelled student population.
13
Figure 8. Proportion of students expelled by English learner status
13
The total number of students in the enrolled population here is 96,549. This is because some students are
counted in both populations because their status was reported as an English learner by one school, and as a non-
English learner by another school. Both records are kept to give an accurate proportion of the student body as the
schools and LEAs believed at the time.
5.7%
6
11.0%
10,570
94.3%
100
89.1%
85,979
0% 10% 20% 30% 40% 50% 60% 70% 80% 90% 100%
Number of Expulsions
Enrolled Students
English learner Non-English learner

SCHOOL YEAR 2016-17 DISCIPLINE REPORT
18
Expulsions by At-Risk Status
Figure 9 shows the proportion of expelled students by their identification as at-risk.
14
In the District of
Columbia, “at-risk”
15
refers to a student who possesses one of the following characteristics at any point
during the given school year:
Direct Certification: Temporary Assistance for Needy Families (TANF) or Supplemental
Nutrition Assistance Program (SNAP) enrollment
Homeless: Identification as homeless by the student’s school or other community
partners.
CFSA: Under the care of the Child and Family Services Agency (CFSA)
Overage (high school only): A high school student is overage if he or she is at least one
year older than the expected age for their grade
Students identified as at-risk make up 49.9 percent of students in the enrolled population. Figure 9
shows that students identified as at-risk make up 84 percent of the expelled population and students
who are not identified as at-risk have a total of 17 out of 106 expulsions.
Figure 9. Proportion of students expelled by at-risk status
14
17 students had an unknown status for the at-risk indicator and were removed from this chart.
15
D.C. Code § 38-2901 (2A)
84.0%
89
49.9%
48,063
16.0%
17
50.2%
48,351
0% 10% 20% 30% 40% 50% 60% 70% 80% 90% 100%
Number of Expulsions
Enrolled Students
At-risk Not At-Risk

SCHOOL YEAR 2016-17 DISCIPLINE REPORT
19
Removals to an interim alternative education setting
IDEA provides certain procedural safeguards that apply when a student with a disability (or a student
who is suspected of having a disability) violates a code of student conduct and receives a suspension or
expulsion that results in the student being removed from his or her current educational placement. A
student with a disability who violates a code of student conduct may be removed from his or her current
placement to an appropriate interim alternative educational setting, another setting, or suspension, for
not more than 10 school days.
16
If a student with a disability is removed from his or her current
placement for more than 10 school days (either consecutively or cumulatively totaling 10 days), the LEA
must conduct a meeting to determine if the behavior that gave rise to the violation of the school code is
a manifestation of the student’s disability.
17
However, school personnel are permitted to remove a
student to an interim alternative educational setting for not more than 45 school days without regard to
whether the behavior is determined to be a manifestation of the child's disability if a student:
1) Carries a weapon to or possesses a weapon at school, on school premises, or to or at a school
function under the jurisdiction of OSSE or an LEA;
2) Knowingly possesses or uses illegal drugs, or sells or solicits the sale of a controlled substance
while at school, on school premises, or at a school function under the jurisdiction of OSSE or an
LEA; or
3) Has inflicted serious bodily injury upon another person while at school, on school premises, or at
a school function under the jurisdiction of OSSE or an LEA.
18
There were 31 instances when a student was removed to an interim alternative educational setting
during the 2016-17 school year. Appendix C shows the number of interim removals by LEA and the
number of interim removals by school.
Suspensions and Expulsions for Pre-K Students
The Pre-K Student Discipline Amendment Act of 2015 prohibits the expulsion of Pre-K age students from
publicly funded community-based organizations (CBO) and public schools providing Pre-K care and
education. According to the data OSSE received from LEAs, no students in grades Pre-K 3 or Pre-K 4 were
expelled during the 2016-17 school year.
The Act also prohibits out-of-school suspensions for pre-K age students unless a school administrator
determines that the student willfully caused or attempted to cause bodily injury, or threatened serious
bodily injury to another person, except if the student acted in self-defense. Suspensions given to Pre-K
age students cannot exceed three days for any individual incident. According to the data OSSE received
from LEAs, six Pre-K age students received out-of-school suspensions in the 2016-17 school year. These
six students accumulated a total of nine distinct out-of-school suspensions. The majority of these
suspensions lasted one day. This number is an improvement over the 2015-16 school year, where nine
students accumulated a total of 16 incidents. For 2016-17, some of the nine suspensions were the result
of physical interactions that resulted in minor injury. The majority of out-of-school suspensions for Pre-K
students, however, were caused by disruptive behavior where no injury was reported. In response to
LEAs reporting disciplinary actions in violation of these prohibitions for the 2016-17 school year, OSSE is
16
34 C.F.R. § 300.530(b).
17
34 C.F.R. § 300.530(e).
18
34 C.F.R. §300.530(g).

SCHOOL YEAR 2016-17 DISCIPLINE REPORT
20
developing guidance and technical assistance to support LEAs in understanding their legal and data
collection responsibilities related to discipline of Pre-K students.
Out-of-school suspensions
The following sections of this report provide further detail about out-of-school suspensions in public
schools in the District during the 2016-17 school year. Out-of-school suspensions are reported at higher
rates than in-school suspensions, with over eleven times as many students receiving an out-of-school
suspension as received an in-school suspension; 7.5 percent of students received an out-of-school
suspension compared to 0.1 percent of students who received an in-school suspension.
The following sections will examine:
1. Overall trends in the frequency and length of out-of-school suspensions.
2. Disproportionality in rates of out-of-school suspensions.
3. Differences in out-of-school suspension rates across schools.

SCHOOL YEAR 2016-17 DISCIPLINE REPORT
21
Frequency and length of out-of-school suspensions
Figure 10 shows the percentage of students receiving one, two, three, four, five, or six or more out-of-
school suspensions among students who received at least one out-of-school suspension during the
2016-17 school year.
Of the 7,181 students with at least one out-of-school suspension, over one third (38.1 percent) received
an out-of-school suspension on more than one occasion. Approximately 18.5 percent of students who
were out-of-school suspended received three or more out-of-school suspensions.
Figure 10. Total number of out-of-school suspensions among suspended students
61.89%
4,444
19.65%
1,411
8.93%
641
4.44%
319
2.14%
154
2.95%
212
0% 10% 20% 30% 40% 50% 60% 70% 80% 90% 100%
One Two Three Four Five More than six times

SCHOOL YEAR 2016-17 DISCIPLINE REPORT
22
Out-of-school suspensions by grade
The following figures represent the number of suspensions by grade. In general, these figures show that
middle school and lower high school grades share the most out of school suspensions. Figure 11 shows a
peak in the number of suspensions between middle and high school with a steep drop off after ninth
grade.
Figure 11: Total Number of out-of-school suspensions by grade
9
277
623
754
999
1,125
952
1,593
1,559
1,295
1,625
959
710
378
39
-
200
400
600
800
1,000
1,200
1,400
1,600
1,800
Pre-K KG 01 02 03 04 05 06 07 08 09 10 11 12 Adult
Number of Disciplinary Actions

SCHOOL YEAR 2016-17 DISCIPLINE REPORT
23
Figure 12 depicts a similar story where students with more than one suspension in the middle school
grades of sixth through eighth and the traditional first high school grade, grade 9, receive the most
suspensions.
Figure 12: Students with more than one suspension by grade
66
121
152
199
243
189
349
362
298
370
205
133
46
0
50
100
150
200
250
300
350
400
KG 01 02 03 04 05 06 07 08 09 10 11 12
Number of Students

SCHOOL YEAR 2016-17 DISCIPLINE REPORT
24
Figure 13 shows the total number of instructional days missed by students due to out-of-school
suspensions during the 2016-17 school year.
19
Over half of students receiving at least one out-of-school
suspension (53.7 percent) missed between two and five instructional days as a result of being
suspended during the school year. Less than a fifth of students missed less than two days or between six
and 10 days (19.2 percent and 17.1 percent respectively). A total of 714 students, 9.9 percent of those
suspended, missed 11 or more days of school.
Figure 13. Total instructional days missed due to out-of-school suspensions among suspended
students
19
There were some instances with half days which were rounded up to the next category. For example, a
suspension recorded as lasting 5.5 days is placed in the “Between 6 and 10 days” category.
1,382
3,855
1,230
714
-
500
1,000
1,500
2,000
2,500
3,000
3,500
4,000
4,500
Less than 2 days Between 2 and 5 days Between 6 and 10 days 11+ days
Number of Students

SCHOOL YEAR 2016-17 DISCIPLINE REPORT
25
Figure 14 shows the breakdown of instructional days missed by grade.
20
For each increasing grade year,
the suspensions lasting two days or more take a larger proportion of all suspensions. More than 50
percent of suspensions from first to fourth grade were less than two days. From fifth grade through
twelfth grades, suspensions typically ranged between two and five days. Longer suspensions, in the six
to ten day range, were also more common in the later grades.
Figure 14: Days missed for each out-of-school suspension by grade
Disproportionality in rates of out-of-school suspensions: Examination of specific groups of students
The following section outlines the data trends resulting from a logistic regression analysis which
measures how likely the outcome (i.e., out-of-school suspension) is to occur based on a variety of other
factors (e.g., grade, gender, and race).
21
Because all data is analyzed together in one model, the results represent the independent effect of each
factor. This means, for example, that Black/African-American students are 7.7 times more likely to have
received at least one out-of-school suspension compared to White students irrespective of the students’
20
Some grades are omitted for student privacy.
21
Logistic regression is a type of regression analysis that is used when the outcome variable is binary (i.e., student
received an out-of-school suspension [1] versus student did not receive an out of school suspension [0]).
388
388
516
618
472
522
501
257
331
151
101
57
230
354
468
481
456
968
930
881
1075
683
502
249
12
14
25
22
80
91
121
170
92
86
57
23
37
36
49
33
21
15
22
0%
10%
20%
30%
40%
50%
60%
70%
80%
90%
100%
01 02 03 04 05 06 07 08 09 10 11 12
Less than 2 Days Between 2 and 5 days Between 6 and 10 days 11 days and over 6 days or over

SCHOOL YEAR 2016-17 DISCIPLINE REPORT
26
grade in school, sex, their English learner status, their economic disadvantaged status, their at-risk
status, whether or not they have an Individualized Educational Program (IEP), or whether or not they
attended more than one school during the 2016-17 school year. All likelihoods noted in text are
statistically significant at the 99.9 percent confidence level (p<.001).
Examination of student characteristics associated with out-of-school suspensions revealed several
factors which are strongly associated with a student experiencing a disciplinary action. The following
student factors are most strongly associated with having received at least one out-of-school suspension:
male, Black/African-American, at-risk, receiving special education services or attended more than one
school.

SCHOOL YEAR 2016-17 DISCIPLINE REPORT
27
Out-of-school suspensions by gender
In the 2016-17 school year 9.3 percent of male students and 5.6 percent of female students received at
least one out-of-school suspension.
22
Male students were 1.7 times more likely to receive at least one
out-of-school suspension compared to female students.
Figure 15 shows the proportion of students enrolled during the 2016-17 school year who received at
least one out-of-school suspension by gender. Of those suspended, males make up 62.4 percent of the
population, but only around half of all students.
Figure 15. Proportion of students who received at least one out-of-school suspension by gender
22
Six students have unknown genders and have been excluded from this analysis of out-of-school suspensions by
gender.
37.6%
2,697
50.2%
48,380
62.4%
4,484
49.8%
48,045
0% 10% 20% 30% 40% 50% 60% 70% 80% 90% 100%
Students Receiving Out-of-School Suspensions
All Students
Female Male
SCHOOL YEAR 2016-17 DISCIPLINE REPORT
28
Figure 16 provides more detail on the suspended population by gender. Out of the 7,181 students
receiving suspensions, 2,737 received more than one suspension in the 2016-17 school year. Among
students who received more than one out-of-school suspension, 67.2 percent were male students
compared to 32.8 percent of female students.
Figure 16: Students with more than one suspension by gender
898
1,839
-
200
400
600
800
1,000
1,200
1,400
1,600
1,800
2,000
Female Male

SCHOOL YEAR 2016-17 DISCIPLINE REPORT
29
Figure 17 shows the length of each suspension for the 2016-17 school year. For both genders, most
suspensions last between two and five days. Longer suspensions between six and 10 days, or over 11
days are more uncommon for both males and females.
Figure 17. Length of each suspension by gender
Out-of-school suspensions by race
In the 2016-17 school year 10.2 percent of Black/African-American students, 2.4 percent of
Hispanic/Latino students, 0.5 percent of white students and 1.8 percent of students identifying as
another racial group received at least one out-of-school suspension.
23
Black/African-American students
were 7.7 times more likely to receive at least one out-of-school suspension compared to white students
and 2.8 times more likely to receive at least one out of school suspension compared to Hispanic/Latino
students. Hispanic/Latino students were 2.8 times more likely to receive at least one out of school
suspension compared to white students.
23
18 students have an unknown race and were excluded from this chart.
1,463
2,566
311
81
3,054
4,815
467
140
-
1,000
2,000
3,000
4,000
5,000
6,000
Less than 2 Days Between 2 and 5 days Between 6 and 10 days 11 days and over
Female Male

SCHOOL YEAR 2016-17 DISCIPLINE REPORT
30
Figure 18 shows the proportion of students enrolled during the 2016-17 school year who received at
least one out-of-school suspension by race. Of those suspended, Black/African-American students make
up 92.4 percent of the population, but only 67.6 percent of the entire population.
Figure 18. Proportion of students who received at least one out-of-school suspension by race
Out of the 7,181 of students receiving suspensions, 2,737 received more than one suspension in the
2016-17 school year. Figure 19 shows that among students who received more than one out-of-school
suspension, 2,583 (94.4 percent) were Black/African-American.
92.4%
6,632
67.6%
65,149
6.1%
435
19.0%
18,298
0.9%
63
3.7%
3,585
0.7%
51
9.7%
9,381
0% 20% 40% 60% 80% 100%
Students Receiving Out-of-
School Suspensions
All Students
Black/African American Hispanic/Latino Other White/Caucasian

SCHOOL YEAR 2016-17 DISCIPLINE REPORT
31
Figure 19: Students with more than one suspension by race
2,583
128
18
8
-
500
1,000
1,500
2,000
2,500
3,000
Black/African American Hispanic/Latino Other White/Caucasian
Number of Students

SCHOOL YEAR 2016-17 DISCIPLINE REPORT
32
Figure 20 shows the length of each suspension for the 2016-17 school year. For Black/African-American
and Hispanic/Latino students, most suspensions last between two and five days. The most common
suspension length for white students and students identifying as other races is fewer than two days.
Figure 20. Length of each suspension by race
4,188
248
46
35
6,933
383
41
24
746
20
7
5
207
9
5
-
-
1,000
2,000
3,000
4,000
5,000
6,000
7,000
8,000
Black/African American Hispanic/Latino Other White/Caucasian
Number of Suspensions
Less than 2 Days Between 2 and 5 days Between 6 and 10 days 11 days and over

SCHOOL YEAR 2016-17 DISCIPLINE REPORT
33
Figure 21 shows the distribution of suspensions by race. As the chart below shows, most suspensions for
white students – 54.7 percent of them – last less than two days. More than half of all suspensions of
Black/African American students and Hispanic/Latino students last between two and five days.
Figure 21. Proportion of each suspension by race
Out-of-school suspensions by status as a student with a disability
In the 2016-17 school year, 14.1 percent of students receiving special education services and 6.3 percent
of students not receiving special education services had at least one out-of-school suspension. Students
with disabilities were 1.6 times more likely to receive at least one out-of-school suspension compared to
students not receiving special education services.
24
24
The total number of students in this analysis is 96,527. This is because some students are counted in both
populations because their status was reported as a student with disabilities by one school, and as a non-student
with disabilities by another school. Both records are kept to give an accurate proportion of the student body as the
schools and LEAs believed at the time.
34.7%
37.6%
46.5%
54.7%
57.4%
58.0%
41.4%
37.5%
6.2%
3.0%
7.1%
7.8%
1.7%
1.4%
5.1%
0% 10% 20% 30% 40% 50% 60% 70% 80% 90% 100%
Black/African American
Hispanic/Latino
Other
White/Caucasian
Less than 2 Days Between 2 and 5 days Between 6 and 10 days 11 days and over

SCHOOL YEAR 2016-17 DISCIPLINE REPORT
34
Figure 22 shows the proportion of students enrolled during the 2016-17 school year who received at
least one out-of-school suspension by their status as a student with a disability. The majority of students
who received at least one suspension were not identified as having a disability. However, of those
suspended, students with disabilities make up 27.8 percent of the population, but only 14.7 percent of
the entire population
Figure 22. Proportion of students who received at least one out-of-school suspension by special
education status
Furthermore, students with disabilities are disproportionately represented among students who were
suspended more than once.
72.2%
5,188
85.3%
82,371
27.8%
2,000
14.7%
14,156
0% 10% 20% 30% 40% 50% 60% 70% 80% 90% 100%
Students Receiving Out-of-School Suspensions
All Students
Non-Students with Disabilities Students with Disabilities

SCHOOL YEAR 2016-17 DISCIPLINE REPORT
35
Figure 23 shows that among students who were suspended more than once, 34.9 percent (955 total) are
students with disabilities. This also shows that that 47.8 percent of students with disabilities who
received one suspension were suspended multiple times.
Figure 23: Students with more than one suspension by special education status
1,784
955
-
200
400
600
800
1,000
1,200
1,400
1,600
1,800
2,000
Non-Students with Disabilities Students with Disabilities
Number of Students

SCHOOL YEAR 2016-17 DISCIPLINE REPORT
36
Figure 24 shows the length of each suspension for the 2016-17 school year. For all students, regardless
of special education status, most suspensions last between two and five days. The next most common
duration for students with disabilities and those not identified as students with disabilities is fewer than
two days.
Figure 24. Length of each suspension by special education status
3,022
5,044
552
143
1,495
2,337
226
78
-
1,000
2,000
3,000
4,000
5,000
6,000
Less than 2 Days Between 2 and 5 days Between 6 and 10 days 11 days and over
Number of Suspensions
Non-Students with Disabilities Students with Disabilities

SCHOOL YEAR 2016-17 DISCIPLINE REPORT
37
Out-of-school suspensions by English learner status
In the 2016-17 school year, 2.1 percent of students identified as English learners and 8.1 percent of non-
English learners received at least one out-of-school suspension.
25
English learners were 0.5 times less
likely to receive at least one out-of-school suspension compared to Non-English learner students.
Figure 25 shows the proportion of students enrolled during the 2016-17 school year who received at
least one out-of-school suspension. English learners make up 3.1 percent of the suspended population,
and 11 percent of the entire population.
Figure 25. Proportion of students who received at least one out-of-school suspension by English
learner status
25
The total number of students in this analysis is 96,549. This is because some students are counted in both
populations because their status was reported as an English learner by one school, and as a non-English learner by
another school. Both records are kept to give an accurate proportion of the student body as the schools and LEAs
believed at the time.
3.1%
225
11.0%
10,570
96.9%
6,956
89.1%
85,979
0% 10% 20% 30% 40% 50% 60% 70% 80% 90% 100%
Students Receiving Out-of-School Suspensions
All Students
English learner Non-English learner
SCHOOL YEAR 2016-17 DISCIPLINE REPORT
38
Out of the 7,181 of students receiving suspension, 2,737 received more than one suspension in the
2016-17 school year. Figure 26 shows that among students who received more than one out-of-school
suspension, only 2.4 percent were English learners.
Figure 26: Students with more than one suspension by English learner status
60
2,677
-
500
1,000
1,500
2,000
2,500
3,000
English Learner Non-English Learner
Number of Students

SCHOOL YEAR 2016-17 DISCIPLINE REPORT
39
Figure 27 shows the length of each suspension for the 2016-17 school year. For all students, whether
identified as an English learner or not, most suspensions last between two and five days. The next most
common duration for all students is fewer than two days.
26
Figure 27. Length of each suspension by English learner status
Out-of-School Suspensions by At-Risk Status
In the 2016-17 school year, 10.7 percent of students identified as at-risk and 4.2 percent of students not
identified as at-risk received at least one out-of-school suspension.
27
At-risk students were 1.5 times
more likely to receive at least one out-of-school suspension compared to those students not identified
as at-risk.
26
Data for actions lasting “Between 6 and 10 days” and “11 days and over” are suppressed to protect student
privacy.
27
17 students have an unknown at-risk status and were excluded from this analysis of out-of-school suspensions
by at-risk status.
107
205
4,410
7,176
767
219
0
1000
2000
3000
4000
5000
6000
7000
8000
Less than 2 Days Between 2 and 5 days Between 6 and 10 days 11 days and over
Number of Suspensions
English Learner Non-English Learner

SCHOOL YEAR 2016-17 DISCIPLINE REPORT
40
Figure 28 shows the proportion of students enrolled during the 2016-17 school year who received at
least one out-of-school suspension. Of those suspended, those identified as at-risk make up 71.6
percent of the population, but 49.9 percent of all students.
Figure 28. Proportion of students who received at least one out-of-school suspension by at-risk status
71.6%
5,138
49.9%
48,063
28.5%
2,043
50.2%
48,351
0% 10% 20% 30% 40% 50% 60% 70% 80% 90% 100%
Students Receiving Out-of-School Suspensions
All Students
At-risk Not At-Risk

SCHOOL YEAR 2016-17 DISCIPLINE REPORT
41
Out of the 7,181 students receiving suspension, 2,737 received more than one suspension in the 2016-
17 school year.
Figure 29 shows that among students who received more than one out-of-school suspension, 2,081 (76
percent) were identified as at-risk.
Figure 29: Students with more than one suspension by at-risk status
2,081
656
-
500
1,000
1,500
2,000
2,500
At-risk Not At-Risk
Number of Students

SCHOOL YEAR 2016-17 DISCIPLINE REPORT
42
Figure 30 shows the length of each suspension for the 2016-17 school year. For all students, whether
identified as at-risk or not, most suspensions last between two and five days. The next most common
duration for all students, whether at-risk or not, is fewer than two days.
Figure 30. Length of each suspension by at-risk status
3,132
5,703
590
161
1,385
1,678
188
60
-
1,000
2,000
3,000
4,000
5,000
6,000
Less than 2 Days Between 2 and 5 days Between 6 and 10 days 11 days and over
Number of Suspensions
At-risk Not At-Risk

SCHOOL YEAR 2016-17 DISCIPLINE REPORT
43
Out-of-school suspensions by homeless status
In the 2016-17 school year, 645 students who were identified as homeless received at least one out-of-
school suspension, which represents 9 percent of all students receiving suspensions.
28
Figure 31 shows that over 700 out-of-school suspensions of a student identified as homeless was for at
least two days.
Figure 31. Length of each suspension by homeless status
28
158 students have an unknown homeless status and were excluded from this analysis of out-of-school
suspensions by homeless status.
4,044
6,677
706
202
473
704
72
19
-
1,000
2,000
3,000
4,000
5,000
6,000
7,000
8,000
Less than 2 Days Between 2 and 5 days Between 6 and 10 days 11 days and over
Number of Suspensions
Non-Homeless Homeless

SCHOOL YEAR 2016-17 DISCIPLINE REPORT
44
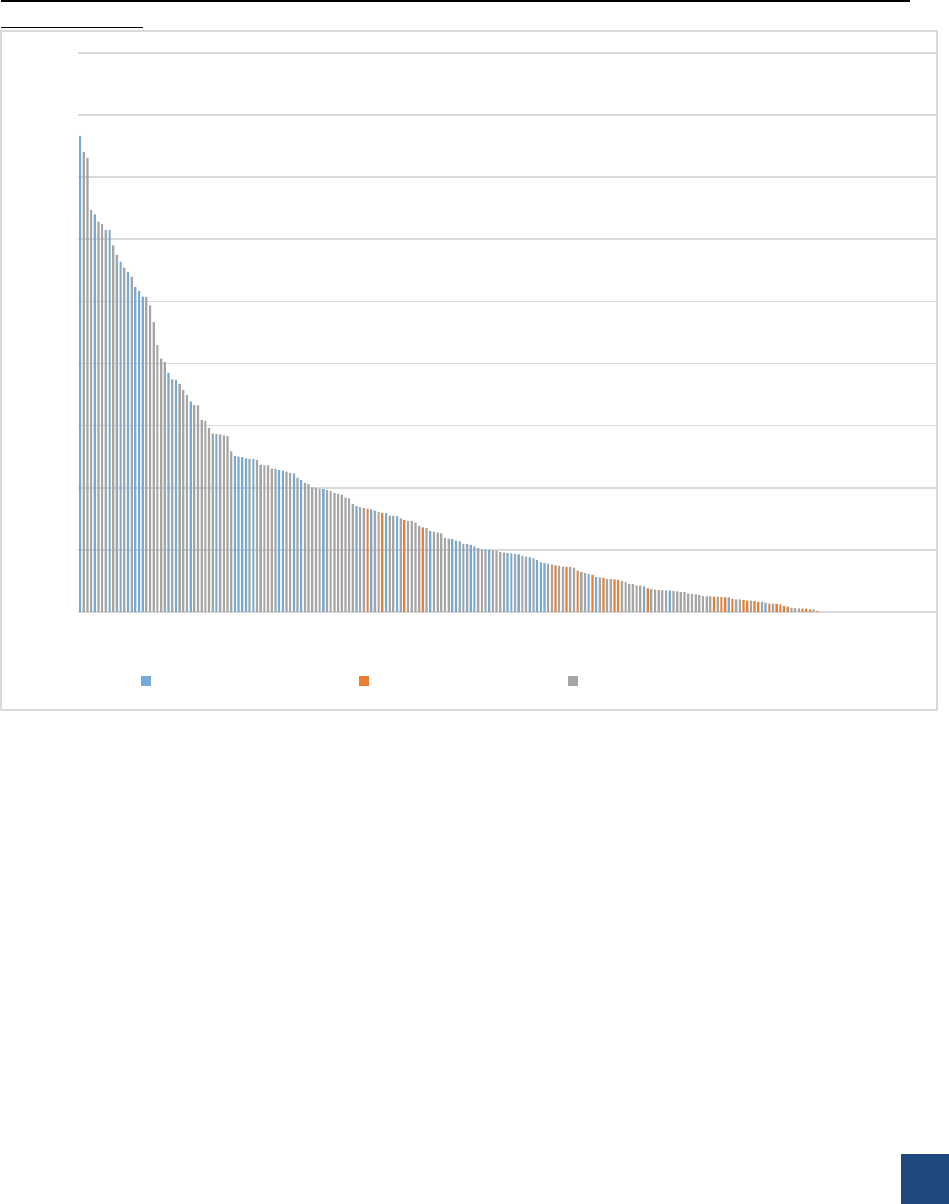
Differences in out-of-school suspension rates across schools
Out-of-school suspension rates varied significantly across schools in the 2016-17 school year.
29
The
median (middle) out-of-school suspension rate was 4.8 percent and the average out-of-school
suspension rate was 7.7 percent. Thirty schools reported they did not give out-of-school suspensions to
any students and therefore had an out-of-school suspension rate of zero percent. The highest out-of-
school suspension rate was 38.3 percent. Nine schools had out-of-school suspension rates at or above
30 percent. Figure 32 shows the out-of-schools suspension rate for every school included in the analysis
throughout this report.
Figure 32: Out-of-school suspension rates varied significantly across schools
As explained in the introduction to this report, LEAs have the authority to define their own disciplinary
policies. Schools also offer different grades and serve different student populations.
Figure 33 shows the same data as Figure 32, but highlights in blue the 50 schools where 75 percent or
more of the student population is identified as at-risk. While the school with the highest out-of-school
suspension rates educates a largely at-risk student population, there is variance in the out-of-school
suspension rates amongst schools with large at-risk populations.
29
The out-of-school suspensions rate is calculated by dividing the number of students suspended by the total
population of the school.
0%
5%
10%
15%
20%
25%
30%
35%
40%
45%
Out-of-school Suspension Rate
Schools
SCHOOL YEAR 2016-17 DISCIPLINE REPORT
45
Figure 33 also highlights in orange the 43 schools where less than 25 percent of the student population
is identified as at-risk. The highest out-of-school suspension rate amongst these schools was 8.3 percent.
The chart below shows a much more limited range of the out-of-school suspension rate for schools
serving a population where less than 25 percent of the students are identified as at-risk.
Figure 33: Out-of-school suspension rates varied significantly across schools with a concentration of
at-risk students
0%
5%
10%
15%
20%
25%
30%
35%
40%
45%
Out-of-school Suspension Rate
Schools
More than 75% At-Risk Less than 25% At-Risk Between 25% and 75% At-Risk

SCHOOL YEAR 2016-17 DISCIPLINE REPORT
46
Disciplinary Action and Student Mobility
In school year 2016-17, 96.7 percent of students attended one school and 3.3 of students attended at
least two schools. Figure 34 shows the out-of-school suspensions for students attending one or more
than one school. Of the students that only attended one school, 7.0 percent had at least one out-of-
school suspension. In comparison, 20.6 percent of students who attended more than one school had at
least one out-of-school suspension and make up 9.2 percent of the suspended population.
All else held constant, students that attended more than one school are on average, 2.7 times more
likely to have had at least one out-of-school suspension.
Figure 34: Students that attend more than one school are two times more likely to have had at least one
out-of-school suspension
Disciplinary Action and Truancy
In the District of Columbia, truancy is defined as the accumulation of 10 or more unexcused absences
across all schools attended by a student in a given year. For the purpose of this analysis, an unexcused
absence counts any full or partially unexcused absence from an instructional day at school. Days missed
by a student due to suspensions do not count towards a student’s truancy status.
96.7%
93,244
90.8%
6,522
3.3%
3,187
9.2%
659
0% 10% 20% 30% 40% 50% 60% 70% 80% 90% 100%
All Students
Students Receiving Out-of-School Suspensions
One school More than one school

SCHOOL YEAR 2016-17 DISCIPLINE REPORT
47
Figure 35 shows proportion of students disciplined for each category of disciplinary action type and by
students’ truancy status.
30
Over 50 percent of students who received an out-of-school suspension or
expulsion were identified as truant in the 2016-17 school year. As the third column in Figure 35 shows,
out of all students who received an out-of-school suspensions, 3,678 were identified as truant. The chart
also shows that the proportion of students identified as truant receive a larger proportion with the
increasing severity in disciplinary actions.
Figure 35: Proportion of students’ disciplinary action type by truancy status
30
This analysis is limited to students that exist in the both 1) the student population used throughout this report
and 2) the attendance data files that OSSE received from the LEAs, which excludes adult students and those in non-
degree granting schools/programs.
27.5%
22,280
41.0%
251
51.6%
3,678
74.0%
71
72.5%
58,775
59.0%
361
48.4%
3,444
26.0%
25
0%
10%
20%
30%
40%
50%
60%
70%
80%
90%
100%
No Disciplinary Actions In-School Suspensions Out-of-School Suspensions Expulsions
Truant Not Truant
SCHOOL YEAR 2016-17 DISCIPLINE REPORT
48
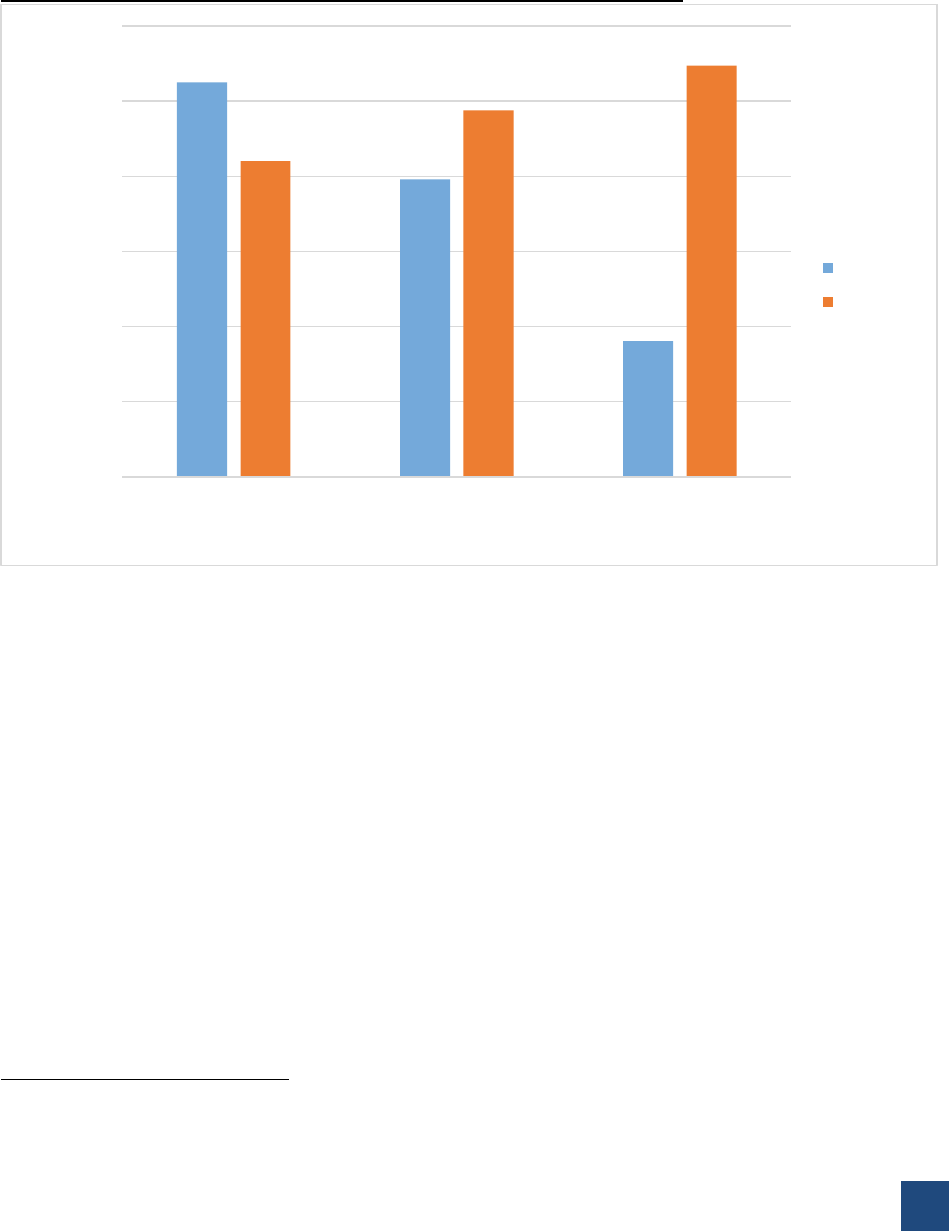
As previously reported, the rate of suspensions increases throughout middle school years into high
school. Figure 36 shows the out-of-school suspension rate for three grade bands by truancy status. The
majority of six through eighth and ninth through twelve grade students who received an out-of-school
suspension were also identified as truant.
31
Figure 36: Out of school suspensions for each grade band by truancy status
The previous analysis demonstrates that the majority of out-of-school suspensions and expulsions are
given to students who are also identified as truant at some point in the school year. It is important to
note that the next section on reasons for disciplinary actions identifies that 390 out-of-school
suspensions were given to students pertaining to issues in their attendance.
31
Absences counted after a student’s eighteenth birthday do not count towards the ten absences that identify a
student as truant.
2,627
1,979
905
2,102
2,440
2,736
-
500
1,000
1,500
2,000
2,500
3,000
KG-05 6-8 9-12
Number of Suspensions
Grade Band
Not Truant
Truant

SCHOOL YEAR 2016-17 DISCIPLINE REPORT
49
With attendance data it is possible to observe a student’s rate of unexcused absence before and after
their first out-of-school suspension.
32
Figure 37 displays the significant difference in the average change
in unexcused absence rates for all students before and after their first disciplinary incident.
33
As with
truancy, the days a student misses school because of a suspension should not be counted as an
unexcused absence and do not count against a student. The average unexcused absence rate for
students who received an out-of-school-suspension was 43.2 percent before their first incident. After
the first out-of-school-suspension, the average rate of unexcused absence for these students increased
to 53.1 percent.
Figure 37: Unexcused Absence rates before and after the first out-of-school-suspension
It should be noted that the average rate of unexcused absence before the first suspension is quite high
for suspended students, as on average they are missing 43.2 percent of instruction. After the first
suspension, this average increases and is significantly different from the unexcused absence rate before
the first incident. However, this does not mean the rate changes because of the initial suspension. A
pattern is evident, but more analysis is needed to determine the cause of the change in unexcused
absence of suspended students.
32
The rate of unexcused absence is calculated by taking the total number of full or partial unexcused absences and
dividing it by the total number of instructional days. The rate of unexcused absence is calculated before and after
the students’ first incident. The day of the incident is not counted in the calculation as they are both present (to
have committed an act) and absent (as they have been suspended from school that day).
33
Significance based on a two-tailed t-test of each group mean at 99.9 percent confidence.
43.2%
53.0%
0%
10%
20%
30%
40%
50%
60%
Absence Rate Before First Suspension Absence Rate After First Suspension
Rates of Unexcused Absence

SCHOOL YEAR 2016-17 DISCIPLINE REPORT
50
Before all suspensions, no matter the length, suspended students on average attend school over 50
percent of the time. Figure 38 shows that the rate of unexcused absence after the first incident
increases with the length of the suspension.
34
The average unexcused absentee rate for students after a
first suspension lasting less than two days is 47.6 percent. If a student’s first suspension is 11 days or
more the average unexcused absentee rate increases to 66.2 percent.
Figure 38: Unexcused Absence rates before and after the first out-of-school-suspension by length of
the first suspension
Examination of Reasons for Disciplinary Action
Due to the variety of disciplinary policies across District of Columbia LEAs, students may receive an in-
school suspension, out-of-school suspension or expulsion for a number of reasons. Figure 39 shows the
number of in-school suspensions, out-of-school suspensions and expulsions by disciplinary reason.
35
,
36
34
The average rate of unexcused absence before and after the first incident for each length category is statistically
significant to 99.9 percent confidence based on a two-tailed t-test.
35
The more generalized disciplinary reason categories shown in Figure 39 were created by OSSE to standardize the
disciplinary reason values provided by the LEAs. The “Other” category includes specific disciplinary reasons that do
not fit into any of the generalized values created (such as “Gambling”.) The “Unknown” category contains
disciplinary reasons provided that could not be used to determine the specific reason for a given disciplinary action
(such as “Documented pattern of persistent Tier 2 behavior.”)
40.2%
44.4%
47.4%
48.7%
47.6%
54.9%
62.8%
66.2%
0%
10%
20%
30%
40%
50%
60%
70%
Less than 2 days Between 2 and 5 days Between 6 and 10 days 11 days or more
Rates of Unexcused Absence
Absence Rate Before First Suspension Absence Rate After First Suspension

SCHOOL YEAR 2016-17 DISCIPLINE REPORT
51
As shown in Figure 39, the most common disciplinary reason for out-of-school suspensions and
expulsions is “Attacks, threats and fighting” with 5,020 total suspensions. The most common disciplinary
reason for in-school suspensions is “Disrespect, insubordination, disruption” with a total of 242
incidents.
Figure 39: Total number of disciplinary actions by reason
Figure 40 shows the proportion of incidents by reason broken out by grade band.
37
The high school
grades share the majority of out-of-school suspensions are “Alcohol/tobacco/pornography related”
(59.3 percent), due to “Attendance, skipping, tardy” (56.2 percent) and “Illicit drug related” (75.4
percent), with the middle and elementary school grades sharing a smaller proportion of these incidents.
The 49.6 percent of out-of-school suspensions that occur due to the reason of “Harassment (including
sexual), bullying” occur in middle school grades of sixth through eighth. The grades of kindergarten
through to fifth share the plurality of incidents that occur due to reasons of “Attacks, threats, fighting”
(41.2 percent) and “Disrespect, insubordination, disruption” (41.5 percent).
36
Some data is suppressed for student privacy.
37
Some grades and reasons are omitted for student privacy.
0 1000 2000 3000 4000 5000 6000
Academic, dishonesty, forgery, tampering
Alcohol/tobacco/pornography related
Attacks, threats, fighting
Attendance, skipping, tardy
Disrespect, insubordination, disruption
Harassment (including sexual), bullying
Illicit drug related
Other
Theft
Tresspassing, vandalism, arson
Unknown
Weapons
Number of Suspensions
Expulsions In-School Suspensions Out-of-School Suspensions

SCHOOL YEAR 2016-17 DISCIPLINE REPORT
52
Figure 40: Out-of-school suspension reasons broken down by grade-band
276
2087
108
1803
115
29
71
88
101
110
343
22
1730
65
1505
204
52
27
94
89
288
100
447
32
1231
217
1027
84
147
100
62
82
117
126
0% 10% 20% 30% 40% 50% 60% 70% 80% 90% 100%
Academic, dishonesty, forgery, tampering
Alcohol/tobacco/pornography related
Attacks, threats, fighting
Attendance, skipping, tardy
Disrespect, insubordination, disruption
Harassment (including sexual), bullying
Illicit drug related
Other
Theft
Tresspassing, vandalism, arson
Unknown
Weapons
Percent of students
KG-05 6-8 9-12

SCHOOL YEAR 2016-17 DISCIPLINE REPORT
53
Restorative Justice
The following section observes five schools that have participated in the Restorative Justice program for
the past two school years. Table 1 shows the make-up of the student body for each school.
Table 1
Student Group
Ballou HS
Columbia Heights
Education Campus
Hart MS
Luke C.
Moore
Maya
Angelou PCS
Female
44.6%
48.9%
47.9%
48.6%
52.4%
Male
55.4%
51.1%
52.1%
51.4%
47.6%
Black/African
American
97.9%
30.2%
98.5%
95.1%
98.0%
Hispanic/Latino
1.7%
67.2%
1.2%
4.9%
2.0%
Other
Race/Ethnicity
n<5
2.6%
n<5
n<5
n<5
At-risk
82.5%
54.5%
84.4%
94.6%
89.5%
English Learners
0.6%
37.4%
n<5
n<5
n<5
Students with
disabilities
25.0%
9.8%
26.7%
13.6%
37.9%

SCHOOL YEAR 2016-17 DISCIPLINE REPORT
54
Table 2 shows the number of discipline actions by each school for the school years 2015-16 and 2016-
17. There has been an increase in actions for Ballou HS, Columbia Heights Education Campus and Maya
Angelou PCS. The total number of expulsions and in-school suspensions has decreased across all schools
from 2015-16 to 2016-17. The number of out-of-school suspensions increased across three of the five
schools.
Table 2
School
Out-of-School
Suspensions
In-School
Suspension
Expulsions
2015-
2016
2016-
2017
2015-
2016
2016-
2017
2015-
2016
2016-
2017
Ballou HS
429
450
44
38
0
0
Columbia Heights
Education Campus
81
93
n<5
0
0
0
Hart MS
233
224
n<5
n<5
0
0
Luke C. Moore
25
14
n<5
0
0
0
Maya Angelou PCS
53
61
0
0
n<5
n<5
Table 3 shows the average length of out-of-school suspensions for each school across the past two
school years. Across four out of five schools, the average length of suspensions has decreased. One
school increased in the average length of suspensions.
Table 3
Average Length of Suspension (Days)
School Name
2015-2016
2016-2017
Ballou HS
4.27
4.70
Columbia Heights Education
Campus
7.05
6.97
Hart MS
5.50
4.85
Luke C. Moore
7.36
6.21
Maya Angelou PCS
4.36
3.92
Figure 41 shows the total number of disciplinary actions by the reason for the action for the past school
year.
38
The two most common reasons for an out-of-school suspension are “Disrespect, insubordination,
disruption” and “Attacks, threats, fighting.” These are the two most common reasons for the rest of the
District schools, but where “Attacks, threats, fighting” is the primary reason for disciplinary actions
throughout the District, “Disrespect, insubordination, and disruption” is the most common reason given
at schools participating in the Restorative Justice program.
38
Some reasons were omitted for student privacy.

SCHOOL YEAR 2016-17 DISCIPLINE REPORT
55
Figure 41: Total number of disciplinary actions by reason for Restorative Justice Schools for school
year 2016-17
0 50 100 150 200 250 300 350
Academic, dishonesty, forgery, tampering
Alcohol/tobacco/pornography related
Attacks, threats, fighting
Attendance, skipping, tardy
Disrespect, insubordination, disruption
Harassment (including sexual), bullying
Illicit drug related
Other
Theft
Tresspassing, vandalism, arson
Unknown
Weapons
Expulsions In-School Suspensions Out-of-School Suspensions

SCHOOL YEAR 2016-17 DISCIPLINE REPORT
56
Appendix A: Data Methodology
Definitions
In-school suspension: Instances in which a child is temporarily removed from his/her regular
classroom(s) for disciplinary purposes but remains under the direct supervision of school personnel.
Direct supervision means school personnel are physically in the same location as students under their
supervision.
Out-of-school suspension: Instances in which a child is temporarily removed from his/her regular school
for disciplinary purposes to another setting (e.g., home, behavior center). This includes both removals in
which no IEP services are provided because the removal is 10 days or less as well as removals in which
the child continues to receive services according to his/her IEP.
Expulsion: An action taken by the LEA removing a child from his/her regular school for disciplinary
purposes for the remainder of the school year or longer in accordance with LEA policy.
Disciplinary action: An in-school suspension, out-of-school suspension or expulsion
Removal to an interim alternative educational setting: An appropriate setting determined by the child’s
IEP team or a hearing officer in which the child is placed for no more than 45 school days. This setting
enables the child to continue to receive educational services and participate in the general education
curriculum (although in another setting) and to progress toward meeting the goals set out in the IEP. As
appropriate, the setting includes a functional behavioral assessment and behavioral intervention
services and modifications to address the behavior violation so that it does not recur.
Data sources
For both DCPS and public charter schools, the student universe and subgroup identification is based on
the Demographic Certification file that schools certified at the end of the2016-17 school year.
Disciplinary action data are based on data provided by LEAs and PCSB. The data files provided by LEAs
and PCSB contained different field names and allowable values. OSSE mapped these datasets to one
consistent format that allowed for state-level reporting. OSSE will engage LEAs over the next year to
help them understand the data collection requirements and definitions to more accurately fulfill federal
and local reporting requirements. Receiving consistent data from LEAs that complies with OSSE’s data
collection template and definitions would allow for more robust analysis at the disciplinary action level
that could inform data-based decision making.
Data cleaning and limitations
Some students in the student population from this report had missing or invalid demographic values for
one or more desired subgroup breakdowns. These students are included in state, LEA and school level
totals but are not included in analyses by subgroup.
Some schools included in the demographic and enrollment data file were excluded from the analyses in
this report. OSSE does not receive disciplinary incidents from non-public schools, so students only
enrolled in non-public schools were excluded from the analyses throughout this report. Students only
enrolled in the following schools were also excluded:

SCHOOL YEAR 2016-17 DISCIPLINE REPORT
57
Youth Services Center
C.H.O.I.C.E. Academy
Incarcerated Youth Program
Residential programs
New Beginnings Youth Development Center
Online programs
Business Rules
Counts of disciplinary actions
Counts of in-school suspensions, out-of-school suspensions, expulsions, removals to an interim
alternative educational setting, and disciplinary actions are derived from the discipline data collected by
OSSE from the LEAs. Each unique student disciplinary action date and disciplinary action type is counted
once.
Student-level analyses
Throughout this report there are various different types of student-level analyses. Student-level
analyses include:
Number of students with at least one out-of-school suspension (out-of-school suspension rate)
Number of out of school suspensions per student
Cumulative duration of out of school suspensions per student
Number of students with at least one in-school suspension (in-school suspension rate)
Number of students with at least one expulsion (expulsion rate)
Logistic regression analysis
At the state level, each student is counted once. At the LEA and school level students are counted once
at each LEA or school where they were verified as enrolled during the 2016-17 school year.
Analysis by disciplinary reason
In the data OSEE received from PCSB and LEAs disciplinary reason values were not used consistently.
OSSE reviewed all of the unique disciplinary reason values provided by the LEAs and mapped these
values to the broader disciplinary reason categories included in this report. Some of the disciplinary
reasons provided (e.g. “Any other Tier 3 behavior”) could not be mapped to any one category and were
therefore mapped to “Unknown.”

SCHOOL YEAR 2016-17 DISCIPLINE REPORT
58
Appendix B: Tables by LEA/School
Counts of Disciplinary Actions by LEA
LEA
Out-of-
School
Suspensions
In-School
Suspensions
Expulsions
District of Columbia Public Schools
5477
392
n<5
Bridges PCS
11
53
0
Capital City PCS
117
19
n<5
Cesar Chavez PCS for Public Policy
285
0
n<5
DC Bilingual PCS
13
0
0
DC Prep PCS
696
0
n<5
E.L. Haynes PCS
205
0
0
Eagle Academy PCS
16
0
0
Early Childhood Academy PCS
21
0
0
Friendship PCS
634
42
22
Hope Community PCS
20
0
0
Howard University Middle School of Mathematics and
Science PCS
61
0
0
Perry Street Preparatory PCS
58
0
0
IDEA PCS
55
0
n<5
Ideal Academy PCS
65
0
0
KIPP DC PCS
1862
0
18
Mary McLeod Bethune Day Academy PCS
27
0
n<5
Maya Angelou PCS
77
0
n<5
Meridian PCS
119
0
0
Paul PCS
325
0
n<5
SEED PCS of Washington, DC
199
0
8
St. Coletta Special Education PCS
0
n<5
0
Thurgood Marshall Academy PCS
140
0
n<5
Two Rivers PCS
47
0
n<5
Washington Latin PCS
70
122
0
Washington Mathematics Science Technology PCHS
28
0
n<5
City Arts & Prep PCS
44
0
0
Achievement Preparatory Academy PCS
184
0
n<5
Center City PCS
135
47
6
Excel Academy PCS
151
0
n<5
Washington Yu Ying PCS
11
0
0
Carlos Rosario International PCS
n<5
0
n<5
National Collegiate Preparatory PCHS
130
0
8
Inspired Teaching Demonstration PCS
32
37
0
Shining Stars Montessori Academy PCS
n<5
0
0

SCHOOL YEAR 2016-17 DISCIPLINE REPORT
59
Richard Wright PCS for Journalism and Media Arts
68
0
0
BASIS DC PCS
38
0
0
Creative Minds International PCS
6
0
0
DC Scholars PCS
65
0
0
LAYC Career Academy PCS
9
0
7
Ingenuity Prep PCS
233
0
0
Sela PCS
7
0
0
Somerset Preparatory Academy PCS
54
0
6
Lee Montessori PCS
n<5
0
0
Academy of Hope Adult PCS
9
0
0
Democracy Prep Congress Heights PCS
782
47
0
Harmony DC PCS
22
0
0
District of Columbia International School
52
15
n<5
Monument Academy PCS
47
0
0
Washington Global PCS
33
0
0
The Children's Guild DC PCS
73
0
0
Goodwill Excel Center PCS
12
0
n<5
Rocketship DC PCS
45
0
0
Washington Leadership Academy PCS
19
0
0
In-School and Out-of-School Suspension Rates by LEA
LEA
Percent of
Students
with Out-
of-School
Suspensions
Percent of
Students
with In-
School
Suspensions
Academy of Hope Adult PCS
1.46%
0.00%
Achievement Preparatory Academy PCS
12.05%
0.00%
AppleTree Early Learning PCS
0.00%
0.00%
Basis DC PCS
3.62%
0.00%
Breakthrough Montessori PCS
0.00%
0.00%
Bridges PCS
1.76%
4.99%
Briya PCS
0.00%
0.00%
Capital City PCS
7.88%
1.60%
Carlos Rosario International PCS
n<5
0.00%
Cedar Tree Academy PCS
0.00%
0.00%
Center City PCS
6.75%
2.77%
Cesar Chavez PCS for Public Policy
14.37%
0.00%
City Arts & Prep PCS
5.44%
0.00%
Community College Preparatory Academy PCS
0.00%
0.00%
Creative Minds International PCS
n<5
0.00%
DC Bilingual PCS
2.64%
0.00%

SCHOOL YEAR 2016-17 DISCIPLINE REPORT
60
DC Prep PCS
14.42%
0.00%
DC Scholars PCS
9.11%
0.00%
Democracy Prep Congress Heights PCS
30.40%
5.66%
District of Columbia International School
6.78%
2.26%
District of Columbia Public Schools
6.27%
0.64%
E.L. Haynes PCS
10.24%
0.00%
Eagle Academy PCS
1.76%
0.00%
Early Childhood Academy PCS
5.75%
0.00%
Elsie Whitlow Stokes Community Freedom PCS
0.00%
0.00%
Excel Academy PCS
11.80%
0.00%
Friendship PCS
10.41%
0.95%
Goodwill Excel Center PCS
1.71%
0.00%
Harmony DC PCS
9.80%
0.00%
Hope Community PCS
1.37%
0.00%
Howard University Middle School of Mathematics and Science
PCS
15.44%
0.00%
IDEA PCS
14.38%
0.00%
Ideal Academy PCS
8.36%
0.00%
Ingenuity Prep PCS
14.32%
0.00%
Inspired Teaching Demonstration PCS
3.74%
5.37%
KIPP DC PCS
15.78%
0.00%
Kingsman Academy PCS
0.00%
0.00%
LAYC Career Academy PCS
2.14%
0.00%
Latin American Montessori Bilingual PCS
0.00%
0.00%
Lee Montessori PCS
n<5
0.00%
Mary McLeod Bethune Day Academy PCS
5.01%
0.00%
Maya Angelou PCS
10.85%
0.00%
Meridian PCS
9.50%
0.00%
Monument Academy PCS
25.27%
0.00%
Mundo Verde Bilingual PCS
0.00%
0.00%
National Collegiate Preparatory PCHS
30.77%
0.00%
Paul PCS
22.67%
0.00%
Perry Street Preparatory PCS
7.58%
0.00%
Richard Wright PCS for Journalism and Media Arts
17.88%
0.00%
Rocketship DC PCS
5.00%
0.00%
Roots PCS
0.00%
0.00%
SEED PCS of Washington, DC
31.66%
0.00%
Sela PCS
2.75%
0.00%
Shining Stars Montessori Academy PCS
n<5
0.00%
Somerset Preparatory Academy PCS
11.66%
0.00%
St. Coletta Special Education PCS
0.00%
n<5
The Children's Guild DC PCS
12.50%
0.00%

SCHOOL YEAR 2016-17 DISCIPLINE REPORT
61
The Next Step/El Proximo Paso PCS
0.00%
0.00%
Thurgood Marshall Academy PCS
21.36%
0.00%
Two Rivers PCS
4.28%
0.00%
Washington Global PCS
14.13%
0.00%
Washington Latin PCS
7.67%
12.07%
Washington Leadership Academy PCS
9.73%
0.00%
Washington Mathematics Science Technology PCHS
7.00%
0.00%
Washington Yu Ying PCS
1.05%
0.00%
Youthbuild PCS
0.00%
0.00%
Duration of Out-of-School Suspensions by LEA
LEA
Less
than 2
Days
Between
2 and 5
days
Between
6 and 10
days
11 days
and
over
Academy of Hope Adult PCS
6
n<5
0
0
Achievement Preparatory Academy PCS
39
143
n<5
0
Basis DC PCS
26
12
0
0
Bridges PCS
10
n<5
0
0
Capital City PCS
45
70
n<5
n<5
Carlos Rosario International PCS
0
n<5
0
n<5
Center City PCS
76
59
0
0
Cesar Chavez PCS for Public Policy
23
238
24
0
City Arts & Prep PCS
11
30
n<5
0
Creative Minds International PCS
n<5
n<5
0
0
DC Bilingual PCS
12
n<5
0
0
DC Prep PCS
668
28
0
0
DC Scholars PCS
39
24
n<5
0
Democracy Prep Congress Heights PCS
438
333
7
n<5
District of Columbia International School
23
28
n<5
0
District of Columbia Public Schools
901
3905
514
157
E.L. Haynes PCS
102
101
n<5
n<5
Eagle Academy PCS
8
8
0
0
Early Childhood Academy PCS
11
10
0
0
Excel Academy PCS
103
44
n<5
n<5
Friendship PCS
108
455
70
n<5
Goodwill Excel Center PCS
n<5
8
0
n<5
Harmony DC PCS
9
13
0
0
Hope Community PCS
n<5
15
0
0
Howard University Middle School of Mathematics and
Science PCS
n<5
49
7
0
IDEA PCS
n<5
44
6
0
Ideal Academy PCS
31
34
0
0

SCHOOL YEAR 2016-17 DISCIPLINE REPORT
62
Ingenuity Prep PCS
196
35
n<5
n<5
Inspired Teaching Demonstration PCS
14
17
n<5
0
KIPP DC PCS
1151
646
38
27
LAYC Career Academy PCS
0
9
0
0
Lee Montessori PCS
n<5
n<5
0
0
Mary McLeod Bethune Day Academy PCS
13
14
0
0
Maya Angelou PCS
6
55
12
n<5
Meridian PCS
29
85
n<5
0
Monument Academy PCS
22
23
n<5
0
National Collegiate Preparatory PCHS
14
100
8
8
Paul PCS
145
151
27
n<5
Perry Street Preparatory PCS
23
32
n<5
0
Richard Wright PCS for Journalism and Media Arts
0
60
8
0
Rocketship DC PCS
36
9
0
0
SEED PCS of Washington, DC
46
149
n<5
0
Sela PCS
n<5
n<5
0
0
Shining Stars Montessori Academy PCS
n<5
0
0
0
Somerset Preparatory Academy PCS
0
38
8
8
St. Coletta Special Education PCS
0
0
0
0
The Children's Guild DC PCS
10
61
n<5
0
Thurgood Marshall Academy PCS
9
126
n<5
n<5
Two Rivers PCS
32
14
n<5
0
Washington Global PCS
n<5
29
n<5
0
Washington Latin PCS
33
34
n<5
0
Washington Leadership Academy PCS
8
11
0
0
Washington Mathematics Science Technology PCHS
n<5
16
9
0
Washington Yu Ying PCS
7
n<5
0
0
Counts of Disciplinary Actions by School
School
Out-of-
School
Suspensions
In-School
Suspensions
Expulsions
Academy of Hope Adult PCS
9
0
0
Achievement Preparatory Academy PCS Wahler Place
Elementary School
53
0
0
Achievement Preparatory Academy PCS Wahler Place
Middle School
131
0
n<5
Aiton ES
16
0
0
Amidon Bowen ES
59
0
0
Anacostia HS
263
n<5
0
AppleTree Early Learning Center PCS Columbia Heights
0
0
0
AppleTree Early Learning Center PCS Lincoln Park
0
0
0

SCHOOL YEAR 2016-17 DISCIPLINE REPORT
63
AppleTree Early Learning Center PCS Oklahoma Avenue
0
0
0
AppleTree Early Learning Center PCS Southeast
0
0
0
AppleTree Early Learning Center PCS Southwest
0
0
0
BASIS DC PCS
38
0
0
Ballou HS
450
38
0
Ballou STAY
36
n<5
0
Bancroft ES at Sharpe
21
0
0
Barnard ES
33
n<5
0
Beers ES
0
0
0
Benjamin Banneker HS
n<5
n<5
0
Breakthrough Montessori PCS
0
0
0
Brent ES
7
n<5
0
Bridges PCS
11
53
0
Brightwood EC
102
n<5
0
Briya PCS
0
0
0
Brookland MS
134
n<5
0
Browne EC
6
0
0
Bruce Monroe ES at Park View
n<5
0
0
Bunker Hill ES
12
12
0
Burroughs ES
6
n<5
0
Burrville ES
14
n<5
0
C W Harris ES
62
9
0
Capital City PCS High School
64
15
n<5
Capital City PCS Lower School
n<5
0
0
Capital City PCS Middle School
49
n<5
0
Capitol Hill Montessori School at Logan
n<5
n<5
0
Cardozo EC
141
n<5
0
Carlos Rosario International PCS
n<5
0
n<5
Cedar Tree Academy PCS
0
0
0
Center City PCS Brightwood
16
20
0
Center City PCS Capitol Hill
42
n<5
n<5
Center City PCS Congress Heights
13
0
n<5
Center City PCS Petworth
32
19
0
Center City PCS Shaw
18
n<5
0
Center City PCS Trinidad
14
0
n<5
Cesar Chavez PCS for Public Policy Capitol Hill
97
0
n<5
Cesar Chavez PCS for Public Policy Chavez Prep
39
0
0
Cesar Chavez PCS for Public Policy Parkside High School
70
0
0
Cesar Chavez PCS for Public Policy Parkside Middle School
79
0
0
City Arts & Prep PCS
44
0
0
Cleveland ES
55
n<5
0

SCHOOL YEAR 2016-17 DISCIPLINE REPORT
64
Columbia Heights EC
93
0
0
Community College Preparatory Academy PCS
0
0
0
Coolidge HS
36
0
0
Creative Minds International PCS
6
0
0
DC Bilingual PCS
13
0
0
DC Preparatory Academy PCS Anacostia Elementary School
52
0
0
DC Preparatory Academy PCS Benning Elementary School
78
0
0
DC Preparatory Academy PCS Benning Middle School
203
0
0
DC Preparatory Academy PCS Edgewood Elementary School
82
0
0
DC Preparatory Academy PCS Edgewood Middle School
281
0
n<5
DC Scholars PCS
65
0
0
Deal MS
69
39
0
Democracy Prep Congress Heights PCS
782
47
0
District of Columbia International School
52
15
n<5
Dorothy I Height ES
n<5
0
0
Drew ES
n<5
0
0
Duke Ellington School of the Arts
17
0
0
Dunbar HS
141
0
0
EL Haynes PCS Elementary School
30
0
0
EL Haynes PCS High School
116
0
0
EL Haynes PCS Middle School
59
0
0
Eagle Academy PCS Capitol Riverfront
0
0
0
Eagle Academy PCS Congress Heights
16
0
0
Early Childhood Academy PCS
21
0
0
Eastern HS
152
14
n<5
Eaton ES
n<5
0
0
Eliot Hine MS
74
7
0
Elsie Whitlow Stokes Community Freedom PCS
0
0
0
Excel Academy PCS
151
0
n<5
Friendship PCS Armstrong
58
14
0
Friendship PCS Blow Pierce Elementary School
68
17
0
Friendship PCS Blow Pierce Middle School
93
7
n<5
Friendship PCS Chamberlain Elementary School
n<5
0
0
Friendship PCS Chamberlain Middle School
15
0
n<5
Friendship PCS Collegiate Academy
236
n<5
12
Friendship PCS Southeast Academy
83
n<5
0
Friendship PCS Technology Preparatory Academy High
School
15
0
n<5
Friendship PCS Technology Preparatory Academy Middle
18
0
n<5
Friendship PCS Woodridge Elementary School
n<5
0
0
Friendship PCS Woodridge Middle School
38
0
n<5
Garfield ES
n<5
0
0

SCHOOL YEAR 2016-17 DISCIPLINE REPORT
65
Garrison ES
0
0
0
General Education Residential Schools
0
0
0
Goodwill Excel Center PCS
12
0
n<5
H D Cooke ES
14
0
0
Hardy MS
62
24
n<5
Harmony DC PCS School of Excellence
22
0
0
Hart MS
224
n<5
0
Hearst ES
n<5
0
0
Hendley ES
79
n<5
0
Hope Community PCS Lamond
n<5
0
0
Hope Community PCS Tolson
16
0
0
Houston ES
25
0
0
Howard University Middle School of Mathematics and
Science PCS
61
0
0
Hyde Addison ES
n<5
n<5
0
IDEA PCS
55
0
n<5
Ideal Academy PCS
65
0
0
Ingenuity Prep PCS
233
0
0
Inspired Teaching Demonstration PCS
32
37
0
J O Wilson ES
38
0
0
Janney ES
n<5
0
0
Jefferson Middle School Academy
177
0
0
Johnson John Hayden MS
179
13
0
KIPP DC AIM Academy PCS
196
0
n<5
KIPP DC Arts and Technology Academy PCS
8
0
0
KIPP DC College Preparatory Academy PCS
496
0
8
KIPP DC Connect Academy PCS
n<5
0
0
KIPP DC Discover Academy PCS
18
0
0
KIPP DC Grow Academy PCS
6
0
0
KIPP DC Heights Academy PCS
96
0
0
KIPP DC KEY Academy PCS
284
0
n<5
KIPP DC LEAP Academy PCS
0
0
0
KIPP DC Lead Academy PCS
77
0
0
KIPP DC Northeast Academy PCS
66
0
0
KIPP DC PCS Promise Academy
139
0
0
KIPP DC Quest Academy PCS
145
0
n<5
KIPP DC Spring Academy PCS
70
0
0
KIPP DC Valor Academy PCS
110
0
n<5
KIPP DC WILL Academy PCS
150
0
n<5
Kelly Miller MS
344
0
0
Ketcham ES
71
0
0
Key ES
8
0
0

SCHOOL YEAR 2016-17 DISCIPLINE REPORT
66
Kimball ES
54
0
0
King M L ES
88
0
0
Kingsman Academy PCS
0
0
0
Kramer MS
196
76
0
LAYC Career Academy PCS
9
0
7
LaSalle Backus EC
45
0
0
Lafayette ES
n<5
0
0
Langdon ES
14
0
0
Langley ES
81
n<5
0
Latin American Montessori Bilingual PCS
0
0
0
Leckie ES
20
0
0
Lee Montessori PCS
n<5
0
0
Ludlow Taylor ES
n<5
n<5
0
Luke Moore Alternative HS
14
0
0
MacFarland MS
n<5
12
0
Malcolm X ES at Green
15
0
0
Mann ES
0
0
0
Marie Reed ES at MacFarland
7
0
0
Mary McLeod Bethune Day Academy PCS
27
0
n<5
Maury ES
0
0
0
Maya Angelou PCS - High School
61
0
n<5
Maya Angelou PCS Young Adult Learning Center
16
0
n<5
McKinley MS
44
24
0
McKinley Technology HS
57
21
0
Meridian PCS
119
0
0
Miner ES
75
0
0
Monument Academy PCS
47
0
0
Moten ES
40
n<5
0
Mundo Verde Bilingual PCS
0
0
0
Murch ES
n<5
n<5
0
Nalle ES
38
16
0
National Collegiate Preparatory PCHS
130
0
8
New Beginnings Vocational Program DC
0
0
0
Noyes ES
25
n<5
0
Orr ES
9
0
0
Oyster Adams Bilingual School
0
n<5
0
Patterson ES
73
n<5
0
Paul PCS International High School
206
0
n<5
Paul PCS Middle School
119
0
0
Payne ES
19
0
0
Peabody ES Capitol Hill Cluster
0
0
0

SCHOOL YEAR 2016-17 DISCIPLINE REPORT
67
Perry Street Preparatory PCS
58
0
0
Phelps Architecture Construction and Engineering HS
21
0
0
Plummer ES
31
0
0
Powell ES
12
0
0
Randle Highlands ES
30
0
0
Raymond EC
12
0
0
Richard Wright PCS for Journalism and Media Arts
68
0
0
River Terrace EC
n<5
0
0
Rocketship DC PCS
45
0
0
Ron Brown College Preparatory High School
7
0
0
Roosevelt HS
123
7
0
Roosevelt STAY
18
n<5
0
Roots PCS
0
0
0
Ross ES
0
0
0
SEED PCS of Washington DC
199
0
8
Savoy ES
42
n<5
0
School Without Walls HS
n<5
0
0
School Without Walls at Francis Stevens
18
0
0
School-Within-School @ Goding
7
n<5
0
Seaton ES
n<5
0
0
Sela PCS
7
0
0
Shepherd ES
0
0
0
Shining Stars Montessori Academy PCS
n<5
0
0
Simon ES
17
0
0
Smothers ES
79
n<5
0
Somerset Preparatory Academy PCS
54
0
6
Sousa MS
98
n<5
0
St. Coletta Special Education PCS
0
n<5
0
Stanton ES
58
0
0
Stoddert ES
n<5
0
0
Stuart Hobson MS Capitol Hill Cluster
75
0
0
Takoma EC
46
0
0
The Children's Guild PCS
73
0
0
The Next Step El Proximo Paso PCS
0
0
0
Thomas ES
39
0
0
Thomson ES
n<5
0
0
Thurgood Marshall Academy PCS
140
0
n<5
Truesdell EC
6
0
0
Tubman ES
55
0
0
Turner ES
46
0
0
Two Rivers PCS 4th St
36
0
n<5

SCHOOL YEAR 2016-17 DISCIPLINE REPORT
68
Two Rivers PCS Young
11
0
0
Tyler ES
12
0
0
Van Ness ES
0
0
0
Walker Jones EC
118
14
0
Washington Global PCS
33
0
0
Washington Latin PCS Middle School
38
61
0
Washington Latin PCS Upper School
32
61
0
Washington Leadership Academy PCS
19
0
0
Washington Mathematics Science Technology PCHS
28
0
n<5
Washington Metropolitan HS
28
0
0
Washington Yu Ying PCS
11
0
0
Watkins ES Capitol Hill Cluster
21
12
0
West EC
11
0
0
Wheatley EC
30
n<5
0
Whittier EC
n<5
0
0
Wilson HS
72
n<5
0
Woodson H D HS
148
n<5
n<5
Youthbuild PCS
0
0
0
In-School and Out-of-School Suspension Rates by School
School
Percent of
Students
with Out-
of-School
Suspensions
Percent of
Students
with In-
School
Suspensions
Academy of Hope Adult PCS
1.46%
0.00%
Achievement Preparatory Academy PCS Wahler Place Elementary
School
5.93%
0.00%
Achievement Preparatory Academy PCS Wahler Place Middle School
18.35%
0.00%
Aiton ES
4.73%
0.00%
Amidon Bowen ES
8.16%
0.00%
Anacostia HS
25.83%
n<5
AppleTree Early Learning Center PCS Columbia Heights
0.00%
0.00%
AppleTree Early Learning Center PCS Lincoln Park
0.00%
0.00%
AppleTree Early Learning Center PCS Oklahoma Avenue
0.00%
0.00%
AppleTree Early Learning Center PCS Southeast
0.00%
0.00%
AppleTree Early Learning Center PCS Southwest
0.00%
0.00%
BASIS DC PCS
3.63%
0.00%
Ballou HS
25.37%
3.40%
Ballou STAY
4.20%
n<5
Bancroft ES at Sharpe
2.49%
0.00%
Barnard ES
3.64%
0.73%

SCHOOL YEAR 2016-17 DISCIPLINE REPORT
69
Beers ES
0.00%
0.00%
Benjamin Banneker HS
n<5
n<5
Breakthrough Montessori PCS
0.00%
0.00%
Brent ES
1.18%
n<5
Bridges PCS
1.76%
4.99%
Brightwood EC
6.75%
n<5
Briya PCS
0.00%
0.00%
Brookland MS
25.36%
n<5
Browne EC
1.36%
0.00%
Bruce Monroe ES at Park View
n<5
0.00%
Bunker Hill ES
2.27%
3.64%
Burroughs ES
n<5
n<5
Burrville ES
2.25%
n<5
C W Harris ES
11.38%
2.40%
Capital City PCS High School
12.32%
3.52%
Capital City PCS Lower School
n<5
0.00%
Capital City PCS Middle School
10.03%
n<5
Capitol Hill Montessori School at Logan
n<5
n<5
Cardozo EC
10.36%
n<5
Carlos Rosario International PCS
n<5
0.00%
Cedar Tree Academy PCS
0.00%
0.00%
Center City PCS Brightwood
4.32%
5.76%
Center City PCS Capitol Hill
11.52%
n<5
Center City PCS Congress Heights
3.83%
0.00%
Center City PCS Petworth
9.54%
6.87%
Center City PCS Shaw
5.91%
n<5
Center City PCS Trinidad
5.70%
0.00%
Cesar Chavez PCS for Public Policy Capitol Hill
17.46%
0.00%
Cesar Chavez PCS for Public Policy Chavez Prep
7.34%
0.00%
Cesar Chavez PCS for Public Policy Parkside High School
14.36%
0.00%
Cesar Chavez PCS for Public Policy Parkside Middle School
18.69%
0.00%
City Arts & Prep PCS
5.45%
0.00%
Cleveland ES
8.70%
n<5
Columbia Heights EC
4.46%
0.00%
Community College Preparatory Academy PCS
0.00%
0.00%
Coolidge HS
7.53%
0.00%
Creative Minds International PCS
n<5
0.00%
DC Bilingual PCS
2.65%
0.00%
DC Preparatory Academy PCS Anacostia Elementary School
8.06%
0.00%
DC Preparatory Academy PCS Benning Elementary School
6.33%
0.00%
DC Preparatory Academy PCS Benning Middle School
23.32%
0.00%

SCHOOL YEAR 2016-17 DISCIPLINE REPORT
70
DC Preparatory Academy PCS Edgewood Elementary School
7.76%
0.00%
DC Preparatory Academy PCS Edgewood Middle School
31.42%
0.00%
DC Scholars PCS
9.14%
0.00%
Deal MS
2.58%
2.32%
Democracy Prep Congress Heights PCS
30.77%
5.73%
District of Columbia International School
6.81%
2.27%
Dorothy I Height ES
0.91%
0.00%
Drew ES
n<5
0.00%
Duke Ellington School of the Arts
3.14%
0.00%
Dunbar HS
14.14%
0.00%
EL Haynes PCS Elementary School
3.72%
0.00%
EL Haynes PCS High School
15.38%
0.00%
EL Haynes PCS Middle School
10.29%
0.00%
Eagle Academy PCS Capitol Riverfront
0.00%
0.00%
Eagle Academy PCS Congress Heights
2.12%
0.00%
Early Childhood Academy PCS
5.75%
0.00%
Eastern HS
12.94%
1.35%
Eaton ES
n<5
0.00%
Eliot Hine MS
18.72%
2.98%
Elsie Whitlow Stokes Community Freedom PCS
0.00%
0.00%
Excel Academy PCS
11.83%
0.00%
Friendship PCS Armstrong
7.33%
2.89%
Friendship PCS Blow Pierce Elementary School
10.62%
3.95%
Friendship PCS Blow Pierce Middle School
24.68%
2.98%
Friendship PCS Chamberlain Elementary School
n<5
0.00%
Friendship PCS Chamberlain Middle School
3.89%
0.00%
Friendship PCS Collegiate Academy
20.39%
n<5
Friendship PCS Southeast Academy
11.43%
n<5
Friendship PCS Technology Preparatory Academy High School
5.86%
0.00%
Friendship PCS Technology Preparatory Academy Middle
6.39%
0.00%
Friendship PCS Woodridge Elementary School
1.59%
0.00%
Friendship PCS Woodridge Middle School
14.29%
0.00%
Garfield ES
n<5
0.00%
Garrison ES
0.00%
0.00%
General Education Residential Schools
0.00%
0.00%
Goodwill Excel Center PCS
1.71%
0.00%
H D Cooke ES
1.67%
0.00%
Hardy MS
8.31%
5.62%
Harmony DC PCS School of Excellence
9.80%
0.00%
Hart MS
27.38%
n<5
Hearst ES
n<5
0.00%

SCHOOL YEAR 2016-17 DISCIPLINE REPORT
71
Hendley ES
8.53%
n<5
Hope Community PCS Lamond
n<5
0.00%
Hope Community PCS Tolson
1.72%
0.00%
Houston ES
4.75%
0.00%
Howard University Middle School of Mathematics and Science PCS
15.44%
0.00%
Hyde Addison ES
n<5
n<5
IDEA PCS
14.79%
0.00%
Ideal Academy PCS
8.36%
0.00%
Ingenuity Prep PCS
14.32%
0.00%
Inspired Teaching Demonstration PCS
3.76%
5.41%
J O Wilson ES
4.84%
0.00%
Janney ES
n<5
0.00%
Jefferson Middle School Academy
30.77%
0.00%
Johnson John Hayden MS
28.19%
3.69%
KIPP DC AIM Academy PCS
29.50%
0.00%
KIPP DC Arts and Technology Academy PCS
n<5
0.00%
KIPP DC College Preparatory Academy PCS
36.55%
0.00%
KIPP DC Connect Academy PCS
n<5
0.00%
KIPP DC Discover Academy PCS
2.79%
0.00%
KIPP DC Grow Academy PCS
1.48%
0.00%
KIPP DC Heights Academy PCS
11.54%
0.00%
KIPP DC KEY Academy PCS
36.99%
0.00%
KIPP DC LEAP Academy PCS
0.00%
0.00%
KIPP DC Lead Academy PCS
9.20%
0.00%
KIPP DC Northeast Academy PCS
12.24%
0.00%
KIPP DC PCS Promise Academy
9.44%
0.00%
KIPP DC Quest Academy PCS
16.62%
0.00%
KIPP DC Spring Academy PCS
10.00%
0.00%
KIPP DC Valor Academy PCS
27.00%
0.00%
KIPP DC WILL Academy PCS
28.73%
0.00%
Kelly Miller MS
32.00%
0.00%
Ketcham ES
12.36%
0.00%
Key ES
1.24%
0.00%
Kimball ES
9.88%
0.00%
King M L ES
11.14%
0.00%
Kingsman Academy PCS
0.00%
0.00%
Kramer MS
38.31%
21.77%
LAYC Career Academy PCS
2.14%
0.00%
LaSalle Backus EC
6.92%
0.00%
Lafayette ES
n<5
0.00%
Langdon ES
3.56%
0.00%

SCHOOL YEAR 2016-17 DISCIPLINE REPORT
72
Langley ES
9.92%
n<5
Latin American Montessori Bilingual PCS
0.00%
0.00%
Leckie ES
2.43%
0.00%
Lee Montessori PCS
n<5
0.00%
Ludlow Taylor ES
1.25%
n<5
Luke Moore Alternative HS
3.07%
0.00%
MacFarland MS
n<5
7.89%
Malcolm X ES at Green
4.00%
0.00%
Mann ES
0.00%
0.00%
Marie Reed ES at MacFarland
1.65%
0.00%
Mary McLeod Bethune Day Academy PCS
5.02%
0.00%
Maury ES
0.00%
0.00%
Maya Angelou PCS - High School
16.94%
0.00%
Maya Angelou PCS Young Adult Learning Center
5.41%
0.00%
McKinley MS
11.79%
9.13%
McKinley Technology HS
8.44%
3.18%
Meridian PCS
9.56%
0.00%
Miner ES
11.19%
0.00%
Monument Academy PCS
26.14%
0.00%
Moten ES
5.47%
n<5
Mundo Verde Bilingual PCS
0.00%
0.00%
Murch ES
n<5
n<5
Nalle ES
4.68%
3.04%
National Collegiate Preparatory PCHS
31.21%
0.00%
New Beginnings Vocational Program DC
0.00%
0.00%
Noyes ES
7.95%
n<5
Orr ES
2.05%
0.00%
Oyster Adams Bilingual School
0.00%
n<5
Patterson ES
8.25%
n<5
Paul PCS International High School
20.12%
0.00%
Paul PCS Middle School
27.71%
0.00%
Payne ES
3.61%
0.00%
Peabody ES Capitol Hill Cluster
0.00%
0.00%
Perry Street Preparatory PCS
7.74%
0.00%
Phelps Architecture Construction and Engineering HS
5.03%
0.00%
Plummer ES
3.94%
0.00%
Powell ES
1.60%
0.00%
Randle Highlands ES
4.95%
0.00%
Raymond EC
1.27%
0.00%
Richard Wright PCS for Journalism and Media Arts
17.88%
0.00%
River Terrace EC
n<5
0.00%
SCHOOL YEAR 2016-17 DISCIPLINE REPORT
73
Rocketship DC PCS
5.00%
0.00%
Ron Brown College Preparatory High School
4.50%
0.00%
Roosevelt HS
10.78%
0.87%
Roosevelt STAY
1.74%
n<5
Roots PCS
0.00%
0.00%
Ross ES
0.00%
0.00%
SEED PCS of Washington DC
32.35%
0.00%
Savoy ES
7.72%
n<5
School Without Walls HS
n<5
0.00%
School Without Walls at Francis Stevens
2.62%
0.00%
School-Within-School @ Goding
n<5
n<5
Seaton ES
n<5
0.00%
Sela PCS
2.75%
0.00%
Shepherd ES
0.00%
0.00%
Shining Stars Montessori Academy PCS
n<5
0.00%
Simon ES
5.13%
0.00%
Smothers ES
12.54%
n<5
Somerset Preparatory Academy PCS
11.80%
0.00%
Sousa MS
19.26%
n<5
St. Coletta Special Education PCS
0.00%
n<5
Stanton ES
6.50%
0.00%
Stoddert ES
n<5
0.00%
Stuart Hobson MS Capitol Hill Cluster
11.28%
0.00%
Takoma EC
6.47%
0.00%
The Children's Guild PCS
12.50%
0.00%
The Next Step El Proximo Paso PCS
0.00%
0.00%
Thomas ES
5.29%
0.00%
Thomson ES
n<5
0.00%
Thurgood Marshall Academy PCS
21.46%
0.00%
Truesdell EC
0.66%
0.00%
Tubman ES
4.79%
0.00%
Turner ES
4.63%
0.00%
Two Rivers PCS 4th St
4.94%
0.00%
Two Rivers PCS Young
2.99%
0.00%
Tyler ES
1.84%
0.00%
Van Ness ES
0.00%
0.00%
Walker Jones EC
12.47%
2.62%
Washington Global PCS
14.21%
0.00%
Washington Latin PCS Middle School
7.42%
12.36%
Washington Latin PCS Upper School
7.96%
11.80%
Washington Leadership Academy PCS
9.73%
0.00%

SCHOOL YEAR 2016-17 DISCIPLINE REPORT
74
Washington Mathematics Science Technology PCHS
7.19%
0.00%
Washington Metropolitan HS
12.30%
0.00%
Washington Yu Ying PCS
1.05%
0.00%
Watkins ES Capitol Hill Cluster
3.33%
2.00%
West EC
1.81%
0.00%
Wheatley EC
4.39%
n<5
Whittier EC
n<5
0.00%
Wilson HS
3.23%
n<5
Woodson H D HS
16.64%
0.72%
Youthbuild PCS
0.00%
0.00%
Duration of Out-of-School Suspensions by School
School
Less
than 2
Days
Betwee
n 2 and
5 days
Betwee
n 6 and
10 days
11
days
and
over
Academy of Hope Adult PCS
6
n<5
0
0
Achievement Preparatory Academy PCS Wahler Place
Elementary School
8
44
n<5
0
Achievement Preparatory Academy PCS Wahler Place Middle
School
31
99
n<5
0
Aiton ES
n<5
12
n<5
0
Amidon Bowen ES
27
31
n<5
0
Anacostia HS
13
198
49
n<5
AppleTree Early Learning Center PCS Columbia Heights
0
0
0
0
AppleTree Early Learning Center PCS Lincoln Park
0
0
0
0
AppleTree Early Learning Center PCS Oklahoma Avenue
0
0
0
0
AppleTree Early Learning Center PCS Southeast
0
0
0
0
AppleTree Early Learning Center PCS Southwest
0
0
0
0
BASIS DC PCS
26
12
0
0
Ballou HS
23
376
38
13
Ballou STAY
6
25
n<5
0
Bancroft ES at Sharpe
16
n<5
0
0
Barnard ES
26
7
0
0
Beers ES
0
0
0
0
Benjamin Banneker HS
0
n<5
n<5
0
Breakthrough Montessori PCS
0
0
0
0
Brent ES
n<5
n<5
0
0
Bridges PCS
10
n<5
0
0
Brightwood EC
22
75
n<5
0
Briya PCS
0
0
0
0

SCHOOL YEAR 2016-17 DISCIPLINE REPORT
75
Brookland MS
25
96
n<5
8
Browne EC
0
n<5
n<5
0
Bruce Monroe ES at Park View
0
n<5
0
0
Bunker Hill ES
7
n<5
0
0
Burroughs ES
n<5
n<5
0
0
Burrville ES
7
n<5
n<5
0
C W Harris ES
18
40
n<5
0
Capital City PCS High School
28
34
n<5
n<5
Capital City PCS Lower School
n<5
n<5
0
0
Capital City PCS Middle School
14
35
0
0
Capitol Hill Montessori School at Logan
n<5
n<5
0
0
Cardozo EC
n<5
122
11
n<5
Carlos Rosario International PCS
0
n<5
0
n<5
Cedar Tree Academy PCS
0
0
0
0
Center City PCS Brightwood
7
9
0
0
Center City PCS Capitol Hill
25
17
0
0
Center City PCS Congress Heights
n<5
11
0
0
Center City PCS Petworth
27
n<5
0
0
Center City PCS Shaw
10
8
0
0
Center City PCS Trinidad
n<5
9
0
0
Cesar Chavez PCS for Public Policy Capitol Hill
11
76
10
0
Cesar Chavez PCS for Public Policy Chavez Prep
n<5
34
0
0
Cesar Chavez PCS for Public Policy Parkside High School
n<5
61
8
0
Cesar Chavez PCS for Public Policy Parkside Middle School
6
67
6
0
City Arts & Prep PCS
11
30
n<5
0
Cleveland ES
28
24
n<5
0
Columbia Heights EC
n<5
67
10
11
Community College Preparatory Academy PCS
0
0
0
0
Coolidge HS
0
27
7
n<5
Creative Minds International PCS
n<5
n<5
0
0
DC Bilingual PCS
12
n<5
0
0
DC Preparatory Academy PCS Anacostia Elementary School
51
n<5
0
0
DC Preparatory Academy PCS Benning Elementary School
77
n<5
0
0
DC Preparatory Academy PCS Benning Middle School
198
n<5
0
0
DC Preparatory Academy PCS Edgewood Elementary School
78
n<5
0
0
DC Preparatory Academy PCS Edgewood Middle School
264
17
0
0
DC Scholars PCS
39
24
n<5
0
Deal MS
16
42
n<5
7
Democracy Prep Congress Heights PCS
438
333
7
n<5
District of Columbia International School
23
28
n<5
0
Dorothy I Height ES
n<5
n<5
0
0

SCHOOL YEAR 2016-17 DISCIPLINE REPORT
76
Drew ES
0
n<5
0
0
Duke Ellington School of the Arts
0
12
n<5
n<5
Dunbar HS
12
94
29
6
EL Haynes PCS Elementary School
26
n<5
0
0
EL Haynes PCS High School
48
67
0
n<5
EL Haynes PCS Middle School
28
30
n<5
0
Eagle Academy PCS Capitol Riverfront
0
0
0
0
Eagle Academy PCS Congress Heights
8
8
0
0
Early Childhood Academy PCS
11
10
0
0
Eastern HS
n<5
109
19
19
Eaton ES
n<5
0
0
0
Eliot Hine MS
n<5
61
7
n<5
Elsie Whitlow Stokes Community Freedom PCS
0
0
0
0
Excel Academy PCS
103
44
n<5
n<5
Friendship PCS Armstrong
15
42
n<5
0
Friendship PCS Blow Pierce Elementary School
21
47
0
0
Friendship PCS Blow Pierce Middle School
22
71
0
0
Friendship PCS Chamberlain Elementary School
0
n<5
0
0
Friendship PCS Chamberlain Middle School
0
8
7
0
Friendship PCS Collegiate Academy
10
184
42
0
Friendship PCS Southeast Academy
13
59
11
0
Friendship PCS Technology Preparatory Academy High
School
0
12
n<5
n<5
Friendship PCS Technology Preparatory Academy Middle
0
13
n<5
0
Friendship PCS Woodridge Elementary School
n<5
n<5
0
0
Friendship PCS Woodridge Middle School
23
13
n<5
0
Garfield ES
0
n<5
0
0
Garrison ES
0
0
0
0
General Education Residential Schools
0
0
0
0
Goodwill Excel Center PCS
n<5
8
0
n<5
H D Cooke ES
n<5
12
0
0
Hardy MS
14
40
7
n<5
Harmony DC PCS School of Excellence
9
13
0
0
Hart MS
n<5
189
21
9
Hearst ES
n<5
0
0
0
Hendley ES
11
67
n<5
0
Hope Community PCS Lamond
0
n<5
0
0
Hope Community PCS Tolson
n<5
11
0
0
Houston ES
15
10
0
0
Howard University Middle School of Mathematics and
Science PCS
n<5
49
7
0
Hyde Addison ES
n<5
n<5
0
0

SCHOOL YEAR 2016-17 DISCIPLINE REPORT
77
IDEA PCS
n<5
44
6
0
Ideal Academy PCS
31
34
0
0
Ingenuity Prep PCS
196
35
n<5
n<5
Inspired Teaching Demonstration PCS
14
17
n<5
0
J O Wilson ES
23
15
0
0
Janney ES
n<5
0
0
0
Jefferson Middle School Academy
16
138
19
n<5
Johnson John Hayden MS
27
139
7
6
KIPP DC AIM Academy PCS
118
76
n<5
n<5
KIPP DC Arts and Technology Academy PCS
n<5
n<5
0
0
KIPP DC College Preparatory Academy PCS
261
191
23
21
KIPP DC Connect Academy PCS
0
n<5
0
0
KIPP DC Discover Academy PCS
12
6
0
0
KIPP DC Grow Academy PCS
n<5
n<5
0
0
KIPP DC Heights Academy PCS
80
16
0
0
KIPP DC KEY Academy PCS
204
71
9
0
KIPP DC LEAP Academy PCS
0
0
0
0
KIPP DC Lead Academy PCS
51
26
0
0
KIPP DC Northeast Academy PCS
9
56
n<5
0
KIPP DC PCS Promise Academy
114
23
n<5
0
KIPP DC Quest Academy PCS
109
35
n<5
0
KIPP DC Spring Academy PCS
45
25
0
0
KIPP DC Valor Academy PCS
70
40
0
0
KIPP DC WILL Academy PCS
69
75
n<5
n<5
Kelly Miller MS
6
264
56
18
Ketcham ES
29
40
n<5
0
Key ES
n<5
n<5
n<5
0
Kimball ES
31
20
n<5
0
King M L ES
7
81
0
0
Kingsman Academy PCS
0
0
0
0
Kramer MS
7
120
60
9
LAYC Career Academy PCS
0
9
0
0
LaSalle Backus EC
12
31
n<5
n<5
Lafayette ES
0
n<5
0
0
Langdon ES
6
8
0
0
Langley ES
19
62
0
0
Latin American Montessori Bilingual PCS
0
0
0
0
Leckie ES
6
13
n<5
0
Lee Montessori PCS
n<5
n<5
0
0
Ludlow Taylor ES
n<5
n<5
0
0
Luke Moore Alternative HS
n<5
10
n<5
n<5

SCHOOL YEAR 2016-17 DISCIPLINE REPORT
78
MacFarland MS
0
n<5
0
0
Malcolm X ES at Green
n<5
11
0
0
Mann ES
0
0
0
0
Marie Reed ES at MacFarland
n<5
n<5
n<5
0
Mary McLeod Bethune Day Academy PCS
13
14
0
0
Maury ES
0
0
0
0
Maya Angelou PCS - High School
n<5
44
9
n<5
Maya Angelou PCS Young Adult Learning Center
n<5
11
n<5
n<5
McKinley MS
7
33
n<5
0
McKinley Technology HS
15
37
n<5
n<5
Meridian PCS
29
85
n<5
0
Miner ES
16
56
n<5
0
Monument Academy PCS
22
23
n<5
0
Moten ES
28
12
0
0
Mundo Verde Bilingual PCS
0
0
0
0
Murch ES
n<5
n<5
0
0
Nalle ES
16
22
0
0
National Collegiate Preparatory PCHS
14
100
8
8
New Beginnings Vocational Program DC
0
0
0
0
Noyes ES
7
15
n<5
0
Orr ES
0
9
0
0
Oyster Adams Bilingual School
0
0
0
0
Patterson ES
26
47
0
0
Paul PCS International High School
103
76
25
n<5
Paul PCS Middle School
42
75
n<5
0
Payne ES
n<5
13
n<5
0
Peabody ES Capitol Hill Cluster
0
0
0
0
Perry Street Preparatory PCS
23
32
n<5
0
Phelps Architecture Construction and Engineering HS
0
15
n<5
n<5
Plummer ES
22
9
0
0
Powell ES
n<5
7
0
0
Randle Highlands ES
9
20
n<5
0
Raymond EC
n<5
7
n<5
n<5
Richard Wright PCS for Journalism and Media Arts
0
60
8
0
River Terrace EC
0
n<5
n<5
0
Rocketship DC PCS
36
9
0
0
Ron Brown College Preparatory High School
0
n<5
n<5
n<5
Roosevelt HS
n<5
72
44
n<5
Roosevelt STAY
n<5
14
n<5
n<5
Roots PCS
0
0
0
0
Ross ES
0
0
0
0
SCHOOL YEAR 2016-17 DISCIPLINE REPORT
79
SEED PCS of Washington DC
46
149
n<5
0
Savoy ES
n<5
37
0
0
School Without Walls HS
0
n<5
n<5
0
School Without Walls at Francis Stevens
0
15
n<5
0
School-Within-School @ Goding
6
n<5
0
0
Seaton ES
0
n<5
0
0
Sela PCS
n<5
n<5
0
0
Shepherd ES
0
0
0
0
Shining Stars Montessori Academy PCS
n<5
0
0
0
Simon ES
7
10
0
0
Smothers ES
37
42
0
0
Somerset Preparatory Academy PCS
0
38
8
8
Sousa MS
12
77
n<5
n<5
St. Coletta Special Education PCS
0
0
0
0
Stanton ES
39
18
n<5
0
Stoddert ES
n<5
0
0
0
Stuart Hobson MS Capitol Hill Cluster
0
68
n<5
n<5
Takoma EC
10
35
n<5
0
The Children's Guild PCS
10
61
n<5
0
The Next Step El Proximo Paso PCS
0
0
0
0
Thomas ES
n<5
37
0
0
Thomson ES
n<5
n<5
0
0
Thurgood Marshall Academy PCS
9
126
n<5
n<5
Truesdell EC
n<5
n<5
n<5
n<5
Tubman ES
18
37
0
0
Turner ES
7
39
0
0
Two Rivers PCS 4th St
23
12
n<5
0
Two Rivers PCS Young
9
n<5
0
0
Tyler ES
n<5
9
0
0
Van Ness ES
0
0
0
0
Walker Jones EC
6
99
12
n<5
Washington Global PCS
n<5
29
n<5
0
Washington Latin PCS Middle School
23
15
0
0
Washington Latin PCS Upper School
10
19
n<5
0
Washington Leadership Academy PCS
8
11
0
0
Washington Mathematics Science Technology PCHS
n<5
16
9
0
Washington Metropolitan HS
0
23
n<5
n<5
Washington Yu Ying PCS
7
n<5
0
0
Watkins ES Capitol Hill Cluster
14
7
0
0
West EC
n<5
10
0
0
Wheatley EC
n<5
23
n<5
n<5

SCHOOL YEAR 2016-17 DISCIPLINE REPORT
80
Whittier EC
0
n<5
0
0
Wilson HS
9
48
10
n<5
Woodson H D HS
10
131
n<5
n<5
Youthbuild PCS
0
0
0
0

SCHOOL YEAR 2016-17 DISCIPLINE REPORT
81
Appendix C: Interim Removals
Interim Removals by LEA
LEA Name
Removal to Interim
Alternative Education Setting
District of Columbia Public Schools
25
Ingenuity Prep PCS
n<5
KIPP DC PCS
n<5
SEED PCS of Washington, DC
n<5
Somerset Preparatory Academy PCS
n<5
Two Rivers PCS
n<5
Interim Removals by School
School Name
Removal to Interim Alternative
Education Setting
Anacostia HS
n<5
Ballou HS
n<5
Cardozo EC
n<5
Columbia Heights EC
6
Coolidge HS
n<5
Deal MS
n<5
Eastern HS
n<5
Hart MS
n<5
Ingenuity Prep PCS
n<5
KIPP DC WILL Academy PCS
n<5
Kelly Miller MS
n<5
Kramer MS
n<5
Roosevelt HS
n<5
SEED PCS of Washington DC
n<5
Somerset Preparatory Academy PCS
n<5
Sousa MS
n<5
Two Rivers PCS 4th St
n<5
Wheatley EC
n<5
Woodson H D HS
n<5

SCHOOL YEAR 2016-17 DISCIPLINE REPORT
82
Appendix D: In-School Suspensions and Attendance
Discrepancies between School-Reported Attendance Data and Discipline Data
39
School Name
In-school-
suspensions
from
discipline
data
In-school-
suspensions
from
attendance
data
Ideal Academy PCS
0
n<5
KIPP DC WILL Academy PCS
0
86
KIPP DC Heights Academy PCS
0
n<5
KIPP DC Valor Academy PCS
0
32
KIPP DC Lead Academy PCS
0
5
KIPP DC PCS Promise Academy
0
n<5
KIPP DC AIM Academy PCS
0
300
KIPP DC Spring Academy PCS
0
5
KIPP DC KEY Academy PCS
0
124
KIPP DC Northeast Academy PCS
0
6
KIPP DC Quest Academy PCS
0
12
KIPP DC College Preparatory Academy PCS
0
16
Two Rivers PCS 4th St
0
n<5
Washington Latin PCS Upper School
61
25
Washington Latin PCS Middle School
61
14
City Arts & Prep PCS
0
n<5
Center City PCS Petworth
19
10
Center City PCS Brightwood
20
8
Center City PCS Capitol Hill
5
n<5
Ingenuity Prep PCS
0
n<5
Somerset Preparatory Academy PCS
0
5
Democracy Prep Congress Heights PCS
47
41
39
In-school suspensions were counted from the attendance data as separate suspensions where the attendance
code indicated an in-school suspension and the incident was 5 or more weekdays apart from another coded
instance of an in-school suspension. This is a conservative estimate of how many in-school suspensions there were
for each school.

SCHOOL YEAR 2016-17 DISCIPLINE REPORT
83
Appendix E: Verified and Unverified LEAs Reporting Zero Actions
Unverified: LEAs Reporting Zero Actions
LEA Name
In-School
Suspensions
Out-of-
School
Suspensions
Expulsions
DC Scholars PCS
0
65
0
Early Childhood Academy PCS
0
21
0
IDEA PCS
0
57
n<5
Ideal Academy PCS
0
65
0
Meridian PCS
0
119
0
Monument Academy PCS
0
47
0
Paul PCS
0
325
n<5
Richard Wright PCS for Journalism and Media
Arts
0
68
0
Sela PCS
0
7
0
Shining Stars Montessori PCS
0
n<5
0
Verified: LEAs Reporting Zero Actions
LEA Name
Academy of Hope Adult PCS
Achievement Preparatory Academy PCS
AppleTree Early Learning Center PCS
Basis DC PCS
Carlos Rosario International PCS
Cesar Chavez PCS
City Arts & Prep PCS
Creative Minds International PCS
DC Bilingual PCS
DC Preparatory Academy PCS
Eagle Academy PCS
EL Haynes PCS
Elsie Whitlow Stokes Community Freedom PCS
Excel Academy PCS
Goodwill Excel Center PCS
Harmony DC Public Charter School
Hope Community Academy PCS
SCHOOL YEAR 2016-17 DISCIPLINE REPORT
84
Howard University Middle School of Math and
Science
Ingenuity Prep PCS
Kingsman Academy PCS
KIPP DC PCS
Latin American Montessori Bilingual LAMB PCS
Latin American Youth Center LAYC Career
Academy
Lee Montessori PCS
Mary McLeod Bethune PCS
Maya Angelou PCS
Mundo Verde Bilingual PCS
National Collegiate Preparatory PCS
Perry Street Prep PCS
Rocketship DC PCS
SEED PCS of Washington DC
Somerset PCS
St Coletta Special Education PCS
The Childrens Guild PCS
The Next Step PCS
Thurgood Marshall Academy PCS
Two Rivers PCS
Washington Global PCS
Washington Leadership Academy PCS
Washington Mathematics Science Technology
PCHS
Washington Yu Ying PCS
Youthbuild PCS
