
Abt Associates Inc. n 4800 Montgomery Lane, Suite 600
Bethesda, Maryland 20814 n Tel: 301/913-0500 n Fax: 301/652-3916
In collaboration with:
Development Associates, Inc. n Harvard School of Public Health n
Howard University International Affairs Center n University Research Co., LLC
Funded by:
U.S. Agency for International Development
Major Applied
Research 6
Technical Report 2
Decentralization of
the Health System
in Zambia
December 2000
Prepared by:
Thomas Bossert, Ph.D.
Harvard School of Public Health
Mukosha Bona Chitah, M.A.
Central Board of Health, Zambia
Maryse Simonet, M.D., M.P.H.
Harvard School of Public Health
Ladslous Mwansa, Ph.D.
University of Zambia
Maureen Daura, M.A.
Independent Consultant
Musa Mabandhala, M.A.
University of Zambia
Diana Bowser, M.P.H.
Harvard School of Public Health
Joseph Sevilla, Ph.D.
Harvard School of Public Health
Joel Beauvais, B.A.
Harvard School of Public Health
Gloria Silondwa, B.A.
District Health Office, Zambia
Munalinga Simatele, M.A.
University of Zambia

Mission
The Partnerships for Health Reform (PHR) Project seeks to improve people’s health in low- and
middle-income countries by supporting health sector reforms that ensure equitable access to efficient,
sustainable, quality health care services. In partnership with local stakeholders, PHR promotes an
integrated approach to health reform and builds capacity in the following key areas:
> better informed and more participatory policy processes in health sector reform;
> more equitable and sustainable health financing systems;
> improved incentives within health systems to encourage agents to use and deliver efficient and
quality health services; and
> enhanced organization and management of health care systems and institutions to support
specific health sector reforms.
PHR advances knowledge and methodologies to develop, implement, and monitor health reforms and
their impact, and promotes the exchange of information on critical health reform issues.
December 2000
For additional copies of this report, contact the PHR Resource Center at [email protected] or visit our
website at www.phrproject.com.
Contract No.: HRN-C-00-95-00024
Project No.: 936-5974.13
Submitted to: USAID/[for what Mission (Capital City)?]
and: Karen Cavenaugh, COTR
Policy and Sector Reform Division
Office of Health and Nutrition
Center for Population, Health and Nutrition
Bureau for Global Programs, Field Support and Research
United States Agency for International Development
The opinions stated in this document are solely those of the authors and do not necessarily reflect the views of
USAID.
Recommended Citation
Bossert, Thomas, Mukosha Bona Chitah, Maryse Simonet, Ladslous Mwansa, Maureen Daura, Musa Mabandhala, Diana Bowser, Joseph Sevilla, Joel
Beauvais, Gloria Silondwa, and Munalinga Simatele. December 2000. Decentralization of the Health System in Zambia. Major Applied Research 6,
Technical Paper No. 2. Bethesda, MD: Partnerships for Health Reform Project, Abt Associates Inc.

Abstract
Zambia’s ambitious process of decentralization after 1995 is examined in this study using the
“decision-space” analytical approach in national level data analysis and in field case studies of nine
districts. The study found that the “deconcentrated” system allowed local choice at the district level over a
“decision space” that permitted moderate choices over expenditures, fees, contracting, targeting and
governance. It allowed very little choice over salaries and allowances and ruled out contributing local tax
revenues to the system. The study recommended consideration of expanding local choice over hiring and
firing and salaries as anticipated in the original legislation.
The analysis of local expenditures showed that the allocation formula appears to have favored poorer
districts and that although the revenues from fees were low, the wealthier districts were much more
successful than poorer districts in raising fee revenue. These findings suggest that more transparency in
the allocation formula and monitoring of local fee collection should be implemented by the Ministry of
Health and the Central Board of Health.
The case studies found that decision-making processes tended to involve local participation as
programmed; however, in the crucial decisions made after budget cuts, the community was not consulted.
Confusion over the status of district boards and failure to encourage communication between district
boards and neighborhood and facility committees limited participation and should be addressed.
To the extent that the studies were able to evaluate performance of the decentralized system, little
variation was found in key indicators—suggesting that decentralization did not lead to the deterioration of
a system that might have suffered from general economic decline and a rise in HIV/AIDS.

Table of Contents vii
Table of Contents
Acronyms..................................................................................................................................xiii
Acknowledgments ......................................................................................................................xv
Foreword..................................................................................................................................xvii
Executive Summary...................................................................................................................xix
1. Introduction and Framework for Analysis ..............................................................................1
1.1 Analytical Frameworks of the Study...............................................................................2
1.2 Methodology ................................................................................................................7
1.3 National Level Data Sources..........................................................................................8
1.4 Questions Addressed by National Level Data..................................................................8
1.5 Field Case Studies.........................................................................................................9
2. Background and Formal Decision-Space Analysis ................................................................11
2.1 Introduction to Decentralization in Zambia ...................................................................11
2.2 Deconcentration, Devolution, and Decision Space at the Local Level.............................14
2.2.1 Financing Functions.............................................................................................16
2.2.2 Service Delivery Function ....................................................................................17
2.2.3 Human Resources Functions.................................................................................17
2.2.4 Targeting.............................................................................................................18
2.2.5 Governance.........................................................................................................18
2.3 Comparative Analysis of Decision Space......................................................................18
3. National Level Data Analysis of All Districts.......................................................................21
3.1 Data Sources...............................................................................................................21
3.2 Allocation Decisions ...................................................................................................22
3.2.1 Revenues from Central Authorities, Medical Fees, and Other Sources.....................22
3.2.2 Budgetary Transfer Grants from Central Authorities...............................................23
3.2.3 Medical Fees .......................................................................................................26
3.3 Local Choices over Expenditures .................................................................................27
3.3.1 Total Health Expenditures ....................................................................................27
3.3.2 Allocation of Expenditure to Primary Level and Other Levels.................................28
3.3.3 Allocations to Budgetary Expenditure Items..........................................................30
3.3.3.1 Personnel allowances.............................................................................31
3.3.3.2 Drugs....................................................................................................32
3.3.4 Conclusion Regarding Local Allocation Choices....................................................32
3.4 Performance of Health System Decentralization............................................................33
3.4.1 Utilization Rates..................................................................................................33

viii Table of Contents
3.4.2 Immunization Trends...........................................................................................33
3.4.3 Conclusion Regarding Performance......................................................................34
4. Field Case Studies of Nine Districts.....................................................................................35
4.1 Introduction................................................................................................................35
4.1.1 Selection of Districts for the Case Studies..............................................................35
4.1.1.1 Population Size.....................................................................................36
4.1.1.2 Degree of Urbanization..........................................................................36
4.1.1.3 Average Household Income...................................................................37
4.1.1.4 Per Capita Grants...................................................................................37
4.1.1.5 District Hospitals...................................................................................38
4.1.2 Methodology of Qualitative Study.........................................................................38
4.1.3 Methodology of Quantitative Data Collection at District Level................................40
4.2 Decision Space Analysis, Innovation, and the Process of Making Decisions and Priority
Setting at the District Level..................................................................................................41
4.2.1 District Board and Community Committee Participation in Decision Making...........42
4.2.2 The Process of Local Decision Making..................................................................44
4.2.3 Decisions at the Local Level.................................................................................45
4.2.3.1 Financing..............................................................................................45
4.2.3.2 Service Delivery....................................................................................52
4.2.3.3 Human Resources..................................................................................54
4.3 Perceptions of Performance Changes............................................................................56
4.4 Performance Indicators of the Health Systems in the Districts........................................59
4.5 General Trends ...........................................................................................................60
4.5.1 Utilization of Health Services ...............................................................................60
4.5.2 Immunizations.....................................................................................................60
4.5.3 Reproductive Health.............................................................................................61
4.6 Summary of Changes in Performance by District...........................................................61
4.7 Conclusion..................................................................................................................62
5. Conclusions and Policy Implications....................................................................................63
5.1 Decision Space............................................................................................................63
5.2 Allocation Decisions ...................................................................................................64
5.3 Decision Making Process at District Levels...................................................................65
5.4 Health System Performance.........................................................................................66
Annex A: Additional Tables and Figures......................................................................................69
Annex B: Explanation of Data Bases and Variables.......................................................................97
Annex C: Bibliography .............................................................................................................105
List of Tables
Table 1. District Mean of Sources of District Income in Constant 1998 Kwacha .............................22

Table of Contents ix
Table 2. Total Grants 1997-1998 by District Population Quintiles..................................................24
Table 3. Grants Per Capita 1997-1998 by District Income and Urbanization Quintiles.....................24
Table 4. Regression of Grants Per Capita 1998 .............................................................................25
Table 5. Total Nominal and Real Total and Per Capita Health Expenditures 1992-1998...................27
Table 6. Total Health Expenditures 1995-1998 by District Population Quintiles..............................28
Table 7. Guidelines for Management of Financial Resources.........................................................29
Table 8. Average Distribution of Expenditure on Primary Care and Other Levels............................29
Table 9. District Guideline on Expenditures (Cost Item Expenditures)............................................30
Table 10. Percent Allocations to Budgetary Expenditure Items ......................................................31
Table 11. Sample Districts by Population Size..............................................................................36
Table 12. Sample Districts by Degree of Urbanization...................................................................36
Table 13. Sample Districts by Average Household Income............................................................37
Table 14. Sample Districts Ranked by Per Capita Grants...............................................................37
Table 15. List of Interviewees by District.....................................................................................39
Table 16. Actual Grant Budgetary Transfers as Percentage of Action Plan Budget ..........................44
Table 17. Sample Districts: Debt as Percentage of Total Health Expenditures.................................46
Table 18. Sample Districts: Allocation of Expenditures to Levels of Service by Percent of Total
Expenditure................................................................................................................................47
Table 19. Sample Districts: Allocation According to Traditional Expenditure Categories.................48
Table 20. Sample Districts: User Fees..........................................................................................51
Table 21. Allocation of Locally Recruited Qualified Personnel......................................................55
Table 22. Composition of District Offices.....................................................................................56
Table 23. Sample Districts: Ranges for Fully Immunized Chile Coverage.......................................60
Table 24. Summary of the Changes in Performance over 1995-1998 by District..............................62
Table 25. Percent Allocated to Medical Fees 1997-1998 by District Population Quintiles................69
Table 26. Percent Allocated to Medical Fees by District Urbanization Quintiles..............................69
Table 27. Percent Allocated to Medical Fees by District Income Quintiles......................................69

x Table of Contents
Table 28. Regression of Percent Allocated to Medical Fees 1998...................................................70
Table 29. Total Health Expenditures 1995-1998 by District Population Quintiles............................70
Table 30. Total Health Expenditures Per Capita 1995-1998 by Weighted District Urbanization
Quintiles ....................................................................................................................................70
Table 31. Total Health Expenditures Per Capita 1995-1998 by Weighted District Income Quintiles .71
Table 32. Regression of THE Per Capita 1996 and 1998................................................................71
Table 33. Allocation to Primary Health Care 1995-1998 by Population Quintiles............................71
Table 34. Percent Allocated to Primary Health Care 1995-1998 by Weighted District Urbanization
Quintiles ....................................................................................................................................72
Table 35. Allocation to Primary Health Care 1995-1998 by Weighted District Income Quintiles.....72
Table 36. Regression of Percent Allocated to Primary Care 1996 and 1998.....................................72
Table 37. Allocation to Communities 1995-1998 by Population Quintiles.......................................73
Table 38. Percent Allocated to Communities 1995-1998 by Weighted District Urbanization Quintiles.
.........................................................................................................................................73
Table 39. Percent Allocated to Communities 1995-1998 by Weighted District Income Quintiles......73
Table 40. Regression of Percent Allocated to Communities 1996 and 1998.....................................74
Table 41. Percent Allocation to Health Centers 1995-1998 by Population Quintiles.........................74
Table 42. Percent Allocated to Health Centers 1995-1998 by Weighted District Urbanization
Quintiles ....................................................................................................................................74
Table 43. Percent Allocated to Health Centers 1995-1998 by Weighted District Income Quintiles....75
Table 44. Regression of Percent Allocated to Health Centers 1996 -1998 .......................................75
Table 45. Percent Allocated to Hospitals 1995-1998 by Population Quintiles..................................75
Table 46. Percent Allocated to Hospitals 1995-1998 by Weighted District Urbanization Quintiles....76
Table 47. Percent Allocated to Hospitals 1995-1998 by Weighted District Income Quintiles............76
Table 48. Regression of Percent Allocated to Hospitals 1996-1998 ................................................76
Table 49. Percent Allocated to District Offices 1995-1998 by Population Quintiles.........................77
Table 50. Percent Allocated to District Offices 1995-1998 by Weighted District Urbanization
Quintiles ....................................................................................................................................77
Table 51. Percent Allocated to District Offices 1995-1998 by Weighted District Income Quintiles...77

Table of Contents xi
Table 52. Regression of Percent Allocated to District Offices 1996-1998........................................78
Table 53. Percent Allocated to Allowances 1995-1998 by Population Quintiles ..............................78
Table 54. Percent Allocated to Allowances 1995-1998 by Weighted District Urbanization Quintiles78
Table 55. Percent Allocated to Allowances 1995-1998 by Weighted District Income Quintiles........79
Table 56. Regression of Percent Allocated to Allowances 1996-1998.............................................79
Table 57. Percent Allocated to Drugs 1995-1998 by Population Quintiles.......................................79
Table 58. Percent Allocated to Drugs 1995-1998 by Weighted District Urbanization Quintiles ........80
Table 59. Percent Allocated to Drugs 1995-1998 by Weighted District Income Quintiles.................80
Table 60. Regression of Percent Allocated to Drugs 1996 and 1998 ...............................................80
Table 61. Outpatient Utilization Per Capita 1995-1998 by Population Quintiles..............................81
Table 62. Outpatient Utilization Per Capita 1995-1998 by Weighted District Urbanization Quintiles81
Table 63. Outpatient Utilization Per Capita 1995-1998 by Weighted District Income Quintiles........81
Table 64. Regression of Outpatient Utilization Per Capita 1996 and 1998.......................................82
Table 65. Percent Immunization Coverage of DPT3 1995-1998 by Population Quintile...................82
Table 66. Percent Immunization Coverage of DPT3 1995-1998 by Weighted District Urbanization
Quintiles ....................................................................................................................................82
Table 67. Percent Immunization Coverage of DPT3 1995-1998 by Weighted District Income
Quintiles ....................................................................................................................................83
Table 68. Percent Immunization Coverage of DPT3 1996 and 1998...............................................83
Table 69. Immunization Coverage for Measles 1995-1998 by Population Quintile..........................83
Table 70. Immunization Coverage for Measles 1995-1998 by Weighted District Income Quintiles...83
Table 71. Immunization Coverage for Measles 1995-1998 by Weighted District Income Quintiles...84
Table 72. Regression of Immunization Coverage for Measles 1996 and 1998..................................84
Table 73. Range of Values for District Income Quintiles (1996)..................................................103
Table 74. Range of Values for Urbanization Quintiles (1996) ......................................................103

xii Table of Contents
List of Figures, Maps, and Boxes
Map 1. Decision Space Map..........................................................................................................4
Box 1. Decision Space Functions...................................................................................................5
Figure 1. “Decision Space” Analytical Framework..........................................................................7
Map 2. Map of Local Decision Space at District Level..................................................................15
Map 3. Comparative Decision Space: Current Ranges of Choice....................................................19
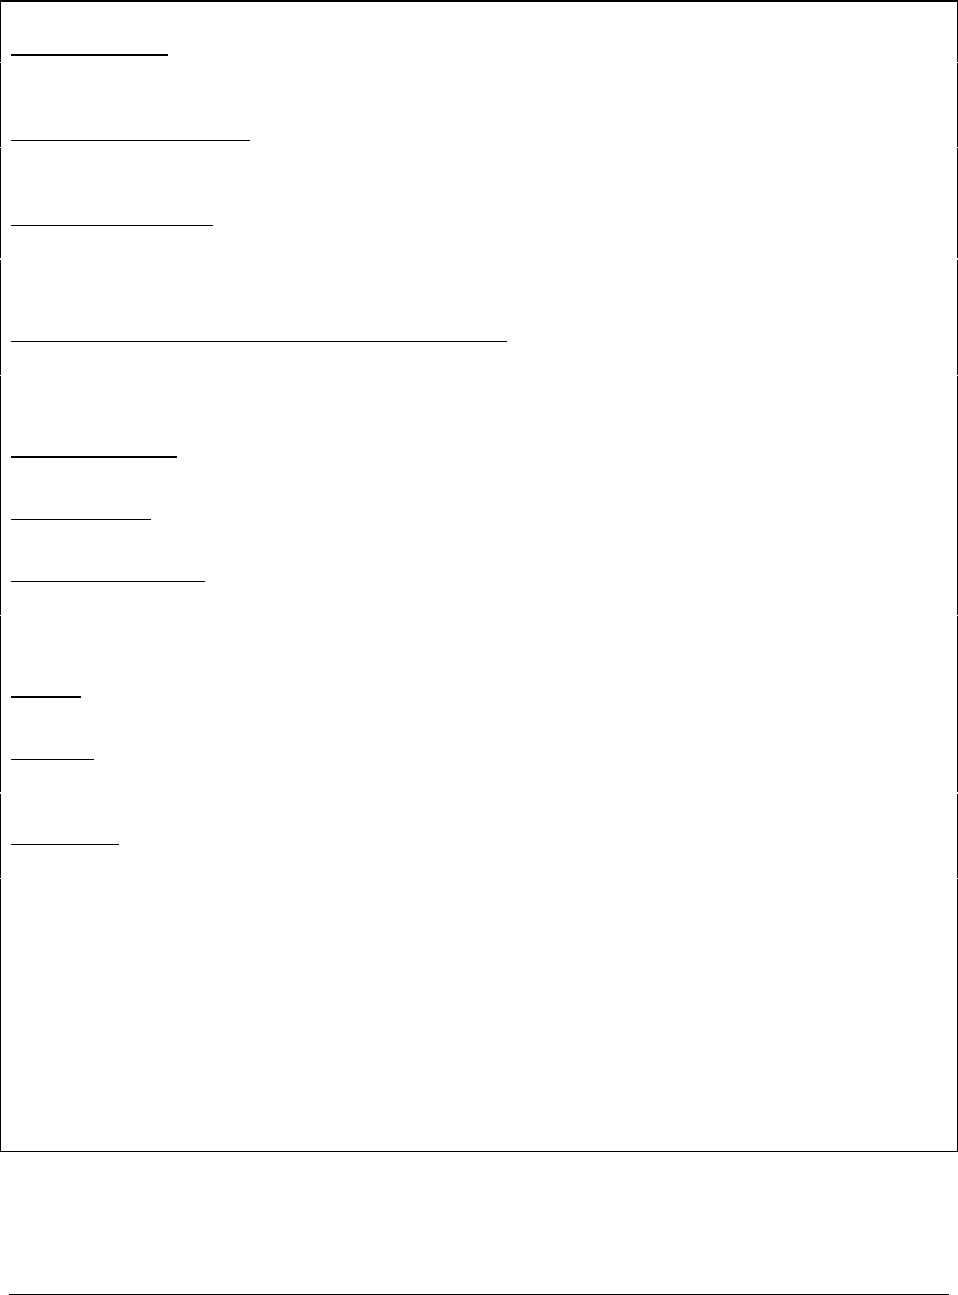
Figure 2. Equity of Grants Per Capita...........................................................................................25
Figure 3. Equity of Medical Fees as Percent of Total District Revenue...........................................26
Figure 4. Equity of Total Health Expenditures Per Capita..............................................................28
Figure 5. Allocation to Primary Care According to Population, Urbanization, and Income...............30
Figure 6. Allocation to Allowances According to Population, Urbanization and Income..................31
Figure 7. Allocations to Drugs According to Population, Urbanization, and Income........................32
Figure 8. DPT3 Coverage 1995-1998...........................................................................................33
Figure 9. Immunization Coverage of DPT3..................................................................................34
Figure 10. Sample Districts: Percent Allocated to District Offices..................................................85
Figure 11. Sample Districts: Percent Allocated to District Hospitals..............................................86
Figure 12. Sample Districts: Percent Allocated to Health Centers...................................................87
Figure 13. Sample Districts: Percent Allocated to Communities.....................................................88
Figure 14. Sample Districts: Percent Allocated to Personnel Costs.................................................89
Figure 15. Sample Districts: Percent Allocated to Drug Costs........................................................90
Figure 16. Sample Districts: Number of Outpatient Visits Per Inhabitant Per Year..........................91
Figure 17. Sample Districts: BCG Coverage (First BCG Per Child under 1 Year Old).....................92
Figure 18. Sample Districts: Percentage of Children under 1 Year Fully Immunized .......................93
Figure 19. Sample Districts: Assisted Deliveries Per Expected Deliveries.......................................94
Figure 20. Sample Districts: Number of Family Planning Visits Per Women in Reproductive Age Per
Year .........................................................................................................................................95

Acronyms xiii
Acronyms
ANC Antenatal Care
BCG Bacillus Calmet-Guerin Vaccine (against tuberculosis)
CBOH Central Board of Health (semi-autonomous public institution (centrally
appointed)
CBD Community-Based Programs
CHW Community Health Worker
CMAZ Churches Medical Association of Zambia
CSO Central Statistical Office
DHB District Health Boards (supervisors and employers of DHMTs)
DHMT District Health Management Teams (technical managers of District Health
Offices)
DHO District Health Office
DPT Diphtheria, Pertussis, Tetanus
EPI Expanded Program on Immunization
EHCP Essential Health Care Package
FAMS Financial, Administrative, and Management System
FMS CBOH Financial Information System
GDP Gross Domestic Product
GRZ Government Republic of Zambia
HIV/AIDS Human Immunodeficiency Syndrome/Acquired Immune Deficiency Syndrome
HCAC Health Center Advisory Committees
HMIS Health Management Information System
LCMS Living Conditions Monitoring Survey
LGA 1991 Local Government Act of 1991
MAR Major Applied Research
MOH Ministry of Health
NHC Neighborhood Health Communities
OPV Oral Polio Vaccine
PHR Partnerships for Health Reform
PMO Provincial Medical Offices
PPAZ Planned Parenthood Association of Zambia

xiv Decentralization of the Health System in Zambia
TBA Traditional Birth Attendant
THE Total Health Expenditures
UNICEF United Nations International Children’s Fund
USAID United States Agency for International Development
WHO World Health Organization
ZIHP Zambia Integrated Health Project

Acknowledgments xv
Acknowledgments
Many authors were involved in this team effort. The principal investigator was Thomas Bossert,
Harvard School of Public Health, who was responsible for the overall design of the project, selection and
coordination of the Harvard and Zambian teams, and much of the final report writing. The head of the
Zambian research team was Mukosha Bona Chitah, Zambian Central Board of Health, who was
responsible for the coordination of the Zambian team and report writing and participated in all phases of
the project. Ladlsous Mwansa, University of Zambia, was responsible for most of the initial national level
data analysis, which had been initially collected by Munalinga Simatele, University of Zambia. Diana
Bowser and Jaypee Sevilla, both of the Harvard School of Public Health, did the final data analysis
combining data from the Zambian team with data from the LCMS. Maryse Simonet, Harvard School of
Public Health, was responsible for the design, implementation, and a synthesis report of the field case
studies. She trained and supervised Maureen Daura and Musa Mabandela, who implemented the field
interviews, and Gloria Siondwa, who did the local level quantitative data collection. Joel Beauvais,
Harvard School of Public Health, did the initial background and decision space analysis.
We would like to thank the many officials of the Central Board of Health and Ministry of Health, and
the District Health Management Teams, District Health Boards, health centers, and neighborhood and
facility committees who assisted us. In particular, we appreciate the assistance and interest of Steve
Mtonga, Bona Sikateyo, Eddie Limbambala, Vincent Musowe, and Director General Gavin Silwamba.
We would also like to thank the Zambia Integrated Health Project (ZIHP) project, especially Yann
Derriennic, Peter Eerens, and Cosmos Musamali for assistance. Thanks also to Sara Bennett, Grace Chee,
Charlotte Leighton, and Peter Berman, of the PHR Project, for support throughout this project and for
comments on earlier drafts of this report.

Foreword xvii
Foreword
Part of the mission of the Partnerships in Health Reform Project (PHR) is to advance “knowledge and
methodologies to develop, implement, and monitor health reforms and their impact.” This goal is
addressed not only through PHR’s technical assistance work but also through its Applied Research
program, designed to complement and support technical assistance activities. The program comprises
Major Applied Research studies and Small Applied Research grants.
The Major Applied Research topics that PHR is pursuing are those in which there is substantial
interest on the part of policymakers, but only limited hard empirical evidence to guide policymakers and
policy implementors. Currently researchers are investigating six main areas:
> Analysis of the process of health financing reform
> The impact of alternative provider payment systems
> Expanded coverage of priority services through the private sector
> Equity of health sector revenue generation and allocation patterns
> Impact of health sector reform on public sector health worker motivation
> Decentralization: local level priority setting and allocation
Each Major Applied Research Area yields working papers and technical papers. Working papers
reflect the first phase of the research process. The papers are varied; they include literature reviews,
conceptual papers, single country-case studies, and document reviews. None of the papers is a polished
final product; rather, they are intended to further the research process—shedding further light on what
seemed to be a promising avenue for research or exploring the literature around a particular issue. While
they are written primarily to help guide the research team, they are also likely to be of interest to other
researchers, or policymakers interested in particular issues or countries.
Ultimately, the working papers will contribute to more final and thorough pieces of research work,
such as multi-country studies and reports presenting methodological developments or policy relevant
conclusions. These more polished pieces will be published as technical papers.
All reports will be disseminated by the PHR Resource Center and via the PHR website.
Sara Bennett, Ph.D.
Director, Applied Research Program
Partnerships for Health Reform

Executive Summary xix
Executive Summary
Zambia implemented an ambitious process of health sector decentralization in the mid-1990s. This
Partnerships for Health Reform (PHR) report studied the type and degree of decentralization of the
districts in Zambia and, using data on the districts available at the national level and field case studies of
nine districts, analyzed the allocation decisions, the local process of decision making, and the
performance of the local health systems.
The type of decentralization can be characterized as both the “delegation” of day-to-day management
responsibilities from the Ministry of Health to a semiautonomous Central Board of Health (CBOH) and
the “deconcentration” to the Ministry offices at the district level (District Health Management Teams
(DHMTs)) and their local health boards (District Health Boards (DHBs)). The Zambian system is not one
in which authority is “devolved” to municipal or district governments. The district level is analyzed in
terms of an innovative framework called the “decision space” approach, which defines the range of choice
over different functions that is given to local officials.
Decision Space at the Local Level
The study found that the decision space allowed for districts in Zambia differed according to
functions and was relatively similar to other countries that have been analyzed using the decision space
approach. The districts had a moderate range of choice over expenditures, fees, contracting, targeting, and
governance. They were quite limited in choices concerning salaries and allowances, and unlike countries
where authority is “devolved” to municipal governments, they did not have control over additional major
sources of revenue, like local taxes. Decision space changed over time with some widening of choice over
personnel and narrowing in governance. The study found that this formal decision space was respected in
practice. In light of the study findings and compared with other countries studied using the decision space
approach, the overall moderate range of choice for the Zambia districts was probably appropriate.
Allocations to Local Districts and Allocation Decisions Made by Districts
Decentralization provided each district with an explicit budgetary transfer, called a “grant.” This grant
covered a significant portion of local expenditures; however, most civil service salaries and major drug
purchases were still paid out of Ministry of Health central budgets. The analysis showed that the formula
for this grant tended to be based on population and to favor poor districts, but it did not clearly favor rural
areas. The formula does not include a measure of district wealth or income (such as an indicator of
average district household income). However, the study showed that, in practice, allocations seem to
favor poorer districts. As a result of this study, it is recommended that district household income be
explicitly and transparently added to the formula and that a more explicit effort be made to use measures
of district income and rurality.
Decentralization allowed the local districts to make decisions regarding the allocation of resources,
user fees levels, and expenditures. The general guidelines for allocation of resources were not respected in
the district offices, where allocations were consistently much higher. However, the study found that some
districts—large urban districts and those without district hospitals—were not using their resources to pay
for the anticipated level of spending in hospitals. The study suggests that the CBOH develop more
explicit guidelines for contracting and more carefully monitor and enforce the contracting of hospital

xx Decentralization of the Health System in Zambia
services in these districts. CBOH should also develop a more appropriate guideline for expenditures in
district offices and enforce it more rigorously. The study did find that guidelines based on traditional
budgetary categories—personnel allowances, drugs, fuel, and capital—were effectively implemented,
suggesting that the guideline mechanism can work with familiar categories.
Wealthier and urban districts were more successful in raising revenue through user fees, although the
proportion of total expenditures that came from user fees was low. Over time, it is likely that user fees in
these communities will be more important revenue sources. Therefore, user fee income should be
carefully monitored, and as disparities in total expenditures grow, poorer rural districts should be
compensated accordingly in the grants formula.
Decision Making at the Local Level
The decision making process at the local level should involve district boards and neighborhood and
facility committees. The field case studies indicated that decisions regarding user fees and development of
action plans did involve these bodies of local participation; however, understanding of the roles,
responsibilities, and selection criteria of boards and committees varied from district to district and
between boards and DHMTs. This study recommends that the boards and committees be reauthorized and
that the roles, responsibilities, and selection processes be more clearly defined and consistently enforced
by the CBOH.
The study found that there was little communication between district boards and the neighborhood
and facility committees, which reduced the potential effectiveness of these committees in the priority-
setting process. The study recommends that district boards have some measure of accountability or at
least that the boards be required to communicate with these committees.
Although the districts appeared to follow the planning process involving the initial action plans,
critical decision points occurred when the initial budgets were cut by the central authorities as
government revenues failed to reach planned levels, and this happened consistently. Neither boards nor
committees had much, if any, involvement in making decisions regarding allocations after cuts, and the
DHMT tended to simply use percentage guidelines rather than set rational priorities for determining
allocations after cuts. This study recommends developing a more participatory and rational process of
allocation decision making at the time of budget cuts.
Performance
Indicators of performance, such as the utilization of health services, immunization coverage, and
family planning activities, could not be compared from before decentralization to the period after
decentralization. However, the study did find that during the period of 1995-1998 indicators for which
data were available did not show significant changes in trends. Although immunization coverage
appeared to decline and family planning activities generally rose, these trends could not be linked to
decentralization.
Overall, the study found no clear evidence that decentralization has weakened the Zambian health
system. Indeed, in the face of economic decline and the rise in HIV/AIDS, the system appears to have
maintained itself with stable utilization rates (except for immunizations) and increases in reproductive
health activities. Decentralization has in some sense probably improved efficiency since the activity levels
have been maintained in the face of recent declines in funding.

Executive Summary xxi
This may not be a favorable conclusion. Advocates of decentralization would have liked to have seen
major improvements since 1995, and critics would have liked to have seen major deterioration that would
confirm their initial biases. The fact that decentralization cannot be clearly linked to improvements or
deterioration may be due to data limitations. However, the findings are consistent with findings in other
countries. Although suggestions on how to improve the effectiveness and processes of decentralization
can be offered, the authors cannot expect this policy lever alone to make major changes in performance.

1. Introduction and Framework for Analysis 1
1. Introduction and Framework for Analysis
In the last two decades, health sector decentralization policies have been implemented on a broad
scale throughout the developing world as part of a broader process of political, economic, and technical
reform (Litvack et al. 1998). This process has been fuelled by “democratization” and, perhaps more
importantly, the neo-liberal “modernization” of the state. These movements combined to promote
accountability to local preferences, as well as introduced competition and cost-consciousness into the
public sector and developed a new role for the state in “enabling” rather than replacing private sector
activities. In the health sector this initiative has been reinforced by many governmental programs such as
the U.S. Agency for International Development (USAID), and multilaterals like the World Health
Organization (WHO), Pan American Health Organization (PAHO), and United Nations International
Children’s Fund (UNICEF). The movement for health reform, including an emphasis on decentralization,
was promoted actively in the World Bank’s 1993 World Development Report, Investing in Health. Swept
up in this movement, Zambia was one of the few African countries to implement a far-reaching process of
decentralization (Bossert, Beauvais, and Bowser 1999). This USAID-funded Partnerships for Health
Reform (PHR) Major Applied Research study is an effort to analyze the process of decentralization and
evaluate its impact on local decision making and on the performance of the health system during the
period of decentralization in Zambia.
This study uses two major frameworks of analysis to define and assess empirical processes of
decentralization. The first is a relatively well-known public administration typology, which distinguishes
four major forms of decentralization: deconcentration, devolution, delegation, and privatization. Zambia
is an example of deconcentration, which transfers new responsibilities to district offices with the Ministry
of Health (MOH), but it also involves delegation in that operational responsibilities at the national level
were transferred to the semiautonomous Central Board of Health (CBOH). The second framework is an
approach developed by Bossert called the “decision space” approach, which builds on the “principal
agent” theory to define the range of choice allowed to local decision makers and the mechanisms of
funding and incentives provided by the central authorities to the local authorities (Bossert 1998a).
Zambian districts have a moderate range of choice over many key functions, and the central authorities
have a variety of mechanisms that are accustomed to restricted choices at the local level. These
approaches will be defined in detail in the following section.
Zambia was chosen for this major applied research (MAR) study after a review of secondary sources
in four countries that had experiences with decentralization: Ghana, Uganda, Zambia, and Philippines.
Zambia was selected in part because it was deemed to be an important case with lessons for other
countries. For a variety of unforeseen reasons, PHR was not able to study the other countries. However,
the principal investigator has implemented studies of decentralization in Latin America using a similar
approach and methodology, and these studies will be used to provide some comparative analysis (Bossert
2000).
The study uses three major methodologies. First, an analysis of the type and degree of choice granted
by the process of decentralization was assessed based on secondary sources, laws, and interviews. The
second methodology used was a national level quantitative analysis of large data sets representative at the
district level; and the third methodology was a field case study of nine districts using quantitative and
qualitative interview data. The quantitative and qualitative data were subject to significant limitations,
which restricted the kinds of questions that the study could answer. Perhaps most important, no
comparable district data were available for the period prior to the initiation or full implementation of the

2 Decentralization of the Health System in Zambia
various phases of decentralization. Therefore, it was not possible to address the question of how
decentralization has changed allocations and performance of district health systems. Rather, this study
addresses issues of the recent status of decentralization and how the current range of choice and type of
decentralization have resulted in specific allocation decisions and performance and how those choices and
performance are related to local conditions such as population size, income, and urbanization. The study
objective was to produce some policy-relevant conclusions about how the degree of decentralization and
the mechanisms used to limit that choice could be altered to improve the equity, efficiency, and quality of
the system.
1.1 Analytical Frameworks of the Study
This study uses the public administration approach and the “decision space” approach as general
analytical frameworks. The following section defines both approaches.
The public administration approach was first introduced by Dennis Rondinelli and G. Shabbir
Cheema for evaluating broad processes of decentralization in developing countries. It was applied to the
decentralization of health systems in a seminal WHO publication by Anne Mills, et al., Health System
Decentralization: Concepts, Issues and Country Experience, in 1990. This approach has wide acceptance
in the international health community today.
This approach has developed a now well-known fourfold typology of different forms of
decentralization: deconcentration, delegation, devolution, and privatization.
> Deconcentration is defined as shifting power from the central offices to peripheral offices of the
same administrative structure (e.g., Ministry of Health and its district offices).
> Delegation shifts responsibility and authority to semiautonomous agencies (e.g., a Board of
Health, a separate regulatory commission, or an accreditation commission).
> Devolution shifts responsibility and authority from the central offices of the Ministry of Health
to separate administrative structures still within the public administration (e.g., local
governments of provinces, states, and municipalities).
> Privatization transfers operational responsibilities and in some cases ownership to private
providers, usually with a contract to define what is expected in exchange for public funding (i.e.,
the conversion of public hospitals to private ownership, contracting out specific services).
In each of these forms of decentralization, significant authority and responsibility usually remain at
the center. In some cases, this shift redefines the functional responsibilities so that the center retains
policy-making and monitoring roles and the periphery gains operational responsibility for day-to-day
administration. In others, the relationship is redefined in terms of a contract so that the center and
periphery negotiate what is expected from each party. A central issue of the public administration
approach has been to define the appropriate levels for decentralizing functions, responsibility, and
authority. The main arenas are usually regions, districts, and local communities.
The weaknesses of this approach are that it does not provide much guidance for analyzing the
functions and tasks that are transferred from one institutional entity to another, and it does not identify the
range of choice that is available to decision makers at each level. There is an implicit assumption that
moving from deconcentration toward privatization is likely to increase the range of choice allowed to
local officials and managers; however, there is no clear analysis of why this should be the case.

1. Introduction and Framework for Analysis 3
The strengths of this approach are that it provides a readily observable typology for identifying the
institutional arrangements of decentralization. It focuses attention on the levels and organizational entities
that are to receive or lose authority and responsibility. The most useful distinction, which is emphasized
throughout this background paper, is the difference between deconcentrated and devolved systems. The
institutional break implied by devolution introduces another set of actors—provincial, state, and
municipal governments—into the process of decision making. These actors are usually harder to predict,
influence, and hold accountable than the ministry officials at the district and regional levels. How this
approach applies to Zambia will be discussed in Sections 3 and 4.
The second approach used in this study is the decision space analytical framework developed by the
principal investigator in studies funded by USAID in the Data For Decision Making Project at Harvard
School of Public Health. This approach is based on a principal agent theory. In this perspective, the MOH
is viewed as setting the goals and parameters for health policy and programs. Through the various modes
of decentralization described above, the central government delegates authority and resources to local
agents—municipal and regional governments, deconcentrated field offices, or autonomous institutions—
for the implementation of its objectives.
This approach acknowledges that local agents often have distinct preferences with respect to the mix
of activities and expenditures to be undertaken, and they respond to a differing set of stakeholders and
constituents than national-level principals. Local institutions, therefore, may have incentives to evade the
mandates established by the central government. Moreover, because agents have better information about
their own activities than does the principal, they have some margin within which to “shirk” centrally
defined responsibilities and pursue their own agendas. The cost to the principal of overcoming this
information asymmetry is often prohibitively high. Within this context, the central government seeks to
achieve its objectives through the establishment of incentives and sanctions that effectively guide agent
behavior without imposing unacceptable losses in efficiency and innovation. Diverse mechanisms are
employed to this end, including monitoring, reporting, inspections, performance reviews, contracts,
grants, and others.
One of the major mechanisms that the principal may use to influence the agents is to selectively
broaden the formal decision space or range of choice of local agents, within the various spheres of policy,
management, finance, and governance (Bossert 1998b).
The central principal voluntarily transfers formal authority to the agent in question in order to
promote its health policy objectives. The degree and nature of this transfer differ by case, and they shape
the function of the principal-agent relationship and the decentralized system as a whole. The nature and
extent of decision space is presented through “maps,” which are complemented by an analysis of the
history and context of decentralization reforms (see Map 1). Box 1 outlines the major issues of each
function in the decision space map.

4 Decentralization of the Health System in Zambia
Map 1. Decision Space Map
Function Range of Choice
Narrow Moderate Wide
Finance
Sources of revenue ⇒ ⇒ ⇒
Allocation of expenditures ⇒ ⇒ ⇒
Income from fees ⇒ ⇒ ⇒
Service Organization
Required programs/norms ⇒ ⇒ ⇒
Hospital autonomy ⇒ ⇒ ⇒
Insurance plans ⇒ ⇒ ⇒
Payment mechanisms ⇒ ⇒ ⇒
Contracts with private ⇒ ⇒ ⇒
Providers
Human Resources
Salaries ⇒ ⇒ ⇒
Contract Staff ⇒ ⇒ ⇒
Civil service ⇒ ⇒ ⇒
Access Rules
Targeting ⇒ ⇒ ⇒
Governance Rules
Local accountability ⇒ ⇒ ⇒
Facility boards ⇒ ⇒ ⇒
Health offices ⇒ ⇒ ⇒
Community participation ⇒ ⇒ ⇒
Source: Bossert 1998
1. Introduction and Framework for Analysis 5
Box 1. Decision Space Functions
Financing and Expenditure Functions
Revenue Sources
Choices about where sources come from: i.e., Are local authorities allowed to assign own source revenue
to health?
Allocations of Expenditures
Choices about how to allocate funds: i.e., Are local authorities allowed to assign funds to different priority
programs? Hospitals vs. primary care
User Fees for Services
Choices about local charges: i.e., Are local authorities allowed to set fees at all, and if so are they allowed
to determine the levels and change them?
Service Organization Functions
Required Programs and Services and Quality Standards
To what degree does the central authority define what programs (e.g., immunization, family planning,
maternity care) and services (e.g., basic benefits package) the local health facilities have to provide?
To what degree does the central authority define service quality standards for facilities?
Hospital Autonomy
Can local authorities grant hospitals autonomy and select the degree of autonomy allowed?
Insurance Plans
Can local authorities create, manage, and regulate local health insurance plans?
Payment Mechanisms
Can local authorities select different means of paying providers? e.g., per capita, salary, or fee for
service.
Human Resources Functions
Salaries
Are local authorities allowed to set different salary levels? Are they allowed to determine bonuses?
Contracts
Are local authorities allowed to contract short-term personnel and set contract terms and compensation
levels?
Civil Service
Are local authorities allowed to hire and fire the permanent staff without higher approvals? Can staff be
transferred by local authorities?
Access Rules
Do local authorities decide who has access to facilities and who is covered by insurance?
Governance Rules
Are local authorities elected by the local population?
Do local authorities have choices about:
Size and composition of hospital boards?
Size and composition of local health offices?
Size, number, composition, and rule of community participation?

6 Decentralization of the Health System in Zambia
The central authorities have a major role in determining the resources available to the local decision
makers by deciding how to allocate national budgetary funds to those localities. These funds are called
“intergovernmental transfers” in cases of devolution. In cases of deconcentration, they are the budgetary
funds directly assigned to the locality. There are other channels of control that the central government can
use to shape or override local decisions. The central government may offer incentives to local decision
makers to encourage them to make choices in favor of national priorities. These incentives can be in the
form of matching grants in which the national government will provide funding for a priority activity if
the local district will provide counterpart funding and implement the activity. Incentives can come in the
form of guidelines—for instance, model fee schedules—and other forms of technical assistance to
upgrade local capacity and to influence local decisions. Incentives may also come in the form of specific
training and skill development in the areas that would strengthen central priorities. There may also be
mechanisms for special recognition of achievements in priority areas, such as competitions for highest
immunization rates among municipalities. Finally, the central government can simply provide services
that are centrally directed, such as continuing to provide malaria control programs and vaccination
campaigns that it runs and funds.
Once the range of choice allowed at the local level is established, the next question is, what choices
do local governments make? To determine this, the study examined the allocation choices that are made
at the local level in response to choices allowed over central government transfers and with the locality’s
own source revenues. Choices made at the local level concerning human resources were also examined.
In addition, the choices made about service delivery and coordination among local governments were
examined.
Finally, the different characteristics of the districts are expected to influence the choices made and the
performance of the health care system. To determine this, the study first examined how the wealth or
income of districts shapes allocation decisions, other choices, and performance. In addition, population
size, degree of urbanization, and other characteristics were measured by the Living Conditions
Monitoring Survey (LCMS)—a household survey that looked at level of education, access to health
facilities, and percentage of children under five. It was anticipated that these variables might influence
both choice and performance.
A central question, however, is how do the different choices allowed at the peripheral level affect the
performance of the system? Often, health sector reforms are expected to produce improvements in equity,
efficiency, quality, and the financial soundness of the health system (Bossert 1998). Figure 1 is a graphic
display of the general analytical framework described above. How this approach applies to Zambia will
be discussed in Section 2.

1. Introduction and Framework for Analysis 7
Figure 1. “Decision Space” Analytical Framework
Central Authorities Define: District Authorities Performance:
Choose:
1.2 Methodology
The public administration and decision space frameworks suggest a series of key questions to be
examined empirically in Zambia. First, the Zambian system must be categorized according to the
typologies of the frameworks. The study reviewed secondary literature, laws, and reports to define the
Zambian system according to these two frameworks. In general, the study found that Zambia is an
example of what the public administration framework denotes as “deconcentration,” which transfers new
responsibilities to district offices within the MOH. In part, however, it also involves “delegation,” in that
operational responsibilities at the national level were transferred to the semiautonomous CBOH. Applying
the decision space framework, the study found that Zambia has a generally moderate range of decision
space choice over many functions—similar to other countries that are devolved to municipal
governments. Zambian central authorities, however, have strong control over major budgetary sources
and have mechanisms of allocation that both define the funding available to the district and limit the
range of choice over expenditures at the district level. This analysis is presented in Section 2.
Although it would have been ideal to analyze the health system choices and performance both before
and after decentralization, no data were available from the periods before significant decentralization
Decision Space for
Local Authorities
Budgetary Transfers
to Districts and
Other Incentives
Financing
Choices
Human
Resources
Choices
Service
Delivery
Choices
Local Characteristics
Population
Urbanization
Income
Capacity
Equity
Efficiency
Quality
Financial
Soundness
Targeting and
Governance
Choices

8 Decentralization of the Health System in Zambia
initiatives to assess changes at the district levels. Data from the period before decentralization were not
disaggregated to the district levels. Therefore, the study was not able to directly address the question of
the changes—both allocation decisions and performance variables—that were brought about by the
process of decentralization. As a result, the study could not address how specific changes in decision
space affected allocation choices that local decision makers made and how these different choices might
have resulted in different performances.
The study does, however, address questions of what choices are made during the period of
decentralization, what local conditions seem to shape those choices, and what performance seems to be
related to those choices. Sources of data varied and the quality of the data varied, as will be explained in
each detailed section. The central issues to be addressed are as follows:
> How are resources allocated in the decentralized system?
> Are these allocation decisions related to local characteristics such that some types of districts
have more advantages during decentralization than do other districts?
> Are differences in performance along the dimensions of equity, efficiency, and quality related to
differences in local allocation choices and local characteristics?
> Are different processes of decision making at the local level related to different allocation
decisions and different performance?
To address these questions, data at the national level and in nine district case studies were analyzed.
The data available for both these types of studies were more limited than expected, and these limitations
are discussed in the sections that follow. The national level data gave an overview of the national
situation, and the case studies provided more in-depth information, both quantitatively and qualitatively.
Although this report, for purposes of presentation, treats the two studies separately, the studies address the
same themes when possible and they have produced remarkably consistent findings.
1.3 National Level Data Sources
The national level data analysis was based on a series of data sources, including data from the CBOH
financial information system (FMS) and health management information system (HMIS). These data
were supplemented by data from the 1995 and 1998 LCMS household surveys, which were representative
at the district level. Section 3 and Annex B provide details on these sources.
1.4 Questions Addressed by National Level Data
The first set of questions the report addresses are as follows: What allocation decisions were made by
the central authorities in providing resources to the districts? Did these allocation decisions result in
greater or lesser equity of resources among districts? These are issues decided by the “principal,” but
which have profound impact on what the district “agents” can decide and perform. For instance, in some
cases of decentralization, the process of decentralization required that the central authorities allocate
funding to local authorities according to a formula based on population. This requirement has been shown
in studies of decentralization in Latin America to have improved the equity of allocations to localities. If
the center is not allocating according to a formula that improves equity, then the policy implication is to
redesign the formula so that the central authorities are forced to improve the equity of allocations to
districts or other local authorities.

1. Introduction and Framework for Analysis 9
The second set of questions asks what the local district decision makers did with their expanded
decision space. In addressing this question, researchers first analyzed the allocation decisions made by
local district teams. Were they able to increase the resources available by raising significant user fee
income? If so, were some types of localities—larger, more urban, or higher income—better able to raise
fees than others? In other words, were some local choices constrained by inequities of local conditions? If
this question can be answered, it may suggest changes in the allocation formula from the center to
compensate for those areas that have lower capacity to generate local user fees.
The next question addressed is how did the local districts allocate resources to health sector priorities?
The decision space allowed for allocating expenditures provided a range of choice to local districts. Did
the local districts respect this range? What local conditions explain why some districts allocate more to
priorities such as primary care than do others? For instance, do rural areas allocate more to primary care
or to hospitals when compared with urban areas? This information can be used to target more attention to
those districts that are not reflecting national level priorities, or explain why different conditions may
require different allocation choices.
Finally, differences in performance of the system in terms of utilization rates and immunization rates
were examined to see if decisions about allocations affected utilization and immunization and to assess
how local conditions might have shaped those effects. As a result, the study was able to relate utilization
and immunization rates to differences in allocations and the local conditions of each district.
1.5 Field Case Studies
The field case studies allowed researchers to explore the above questions in more depth and to
analyze issues that were not addressed by national level data: quantitative data on personnel, budget
shortfalls, and existing facilities as well as qualitative data on processes of decision making, especially the
role of district boards and community committees, and perceptions of performance.
The nine field cases were selected for their range of local characteristics—in income, urbanization,
and population, as well as their responsibilities for hospitals and other characteristics. Quantitative data on
revenues, personnel, and infrastructure were collected and semi-structured, open-ended interviews were
conducted with key participants (District Health Management Team (DHMT) members, board members,
clinic members, and community committees).
In the case studies, researchers went beyond the questions asked for the national level data to assess
the process of decision making and the participation of different actors, especially the district boards, and
other instances of local participation. Researchers were also able to gain insight into the participants’
perceptions of change since decentralization had been implemented (although they were less successful in
this endeavor than they had hoped). Then, because additional quantitative data could be collected at the
district level, researchers were able to assess the quantitative issues of allocation and performance in more
depth than in the national level analysis.
Finally, in the conclusions, researchers attempted to draw on the findings of the definition of
Zambia’s formal decision space compared with the decision space of other countries. They also used the
empirical findings of both the national level data and the field case studies to make tentative policy
recommendations for Zambia and for other experiments in decentralization.

2. Background and Formal Decision-Space Analysis 11
2. Background and Formal Decision-Space
Analysis
2.1 Introduction to Decentralization in Zambia
Zambia has attracted considerable attention in recent years for its ambitious program of health sector
“decentralization.” Although the national government initiated and then restricted a process of political
decentralization to the municipalities, the health sector decentralization followed its own separate process.
The roots of the current reform program date back to the Medical Services Act of 1985, which provided
for the creation of semiautonomous hospital management boards for all major hospitals (more than 200
beds). The hospital boards were appointed by the Minister of Health in 1992, and they have authority to
set fees and manage staff (Mpuku and Zyuulu 1997). In 1992, further legislation was passed requiring the
districts to establish District Health Boards (DHBs) to oversee the districts.
In 1993, DHMTs were established as the technical managers of the district health offices in each of
the country’s 58 (now 72) districts. This same year saw the establishment of the Health Reform
Implementation Team (HRIT) at the national level to act as a coordinating body to promote the full
implementation of the legislated reforms. This body was established outside the Ministry of Health and
had a close association with foreign technical assistance, giving it greater flexibility and autonomy in
exercising its mandate. In 1994, the DHMTs were followed by the creation of the DHBs, which were to
act as the supervisors, and ultimately, employers of the DHMTs. The DHBs were set up side by side with
the pre-existing hospital boards, but the relationship between the two remains somewhat unclear
(Comprehensive Review 1997).
In 1995, the National Health Service Act was passed, calling for significant changes in the role and
structure of the MOH and for the establishment of an essentially autonomous health service delivery
system. The MOH Directorate of Medical Services was replaced by the semiautonomous CBOH, which
was to “monitor, integrate, and coordinate the programs of the Health Management Boards” (Mpuku and
Zyuulu 1997: 116). The transition to CBOH has entailed a reduction in management personnel at the
central level. The MOH headquarters staff has been cut from 400 to 67, and the new CBOH headquarters
will have a staff of 118 when fully implemented (Feilden and Nielsen 1998).
The “new” MOH was to be primarily a policymaking and regulatory institution and its directorates
have been reduced to three: Human Resources and Administration, Planning, and Development. The
MOH was to have no direct health service delivery responsibilities and would instead contract these
services to the CBOH. The CBOH, for its part, was to have responsibility for executive functions related
to health service delivery, including commissioning health services; regulating health services; directly
administering failing district or hospital management boards; implementing quality assurance;
implementing human resource policy; conducting planning and management; and conducting budgetary
administration and management (Foltz 1997).

12 Decentralization of the Health System in Zambia
The organization of the health service delivery system is based on four distinct levels:
> The Central Board of Health, operating as the national coordinator of health service delivery
with four technical directorates:
Î Technical Support Services – responsible for conducting performance audit of the
health boards, monitoring and providing technical support to service provision, and
capacity building of the health boards
Î Clinical Care and Diagnostic Services – responsible for planning, monitoring, and
evaluating provision of diagnostic and pharmaceutical services
Î Public Health and Research – responsible for developing guidelines on epidemiology,
environmental health, health promotion, and mental health, for developing and
maintaining the HMIS, and for facilitating research on all health activities
Î Health Services Planning – responsible for the planning and contracting of health
services, providing financial management, developing partnerships in health, and
providing national level human resource planning and training.
> The Provincial Health Offices, of which there are nine, serving as liaisons between the CBOH
and the district level health offices, providing supervision, human resource management,
technical assistance, and training to the latter.
> The District Health Management Team and first-level hospital and secondary- and tertiary-level
major hospitals governed by the DHBs and hospital management boards, respectively. Under the
coordination of the CBOH, the district and hospital boards acts as supervisors of DHMT and
hospital management units. The boards are expected to be the employers of both management
teams under the planned “delinkage” of personnel from MOH to districts; however, this process
has been only partially implemented. The DHMT is to be responsible for policy implementation
and service provision through a network of health facilities.
> Health centers providing services under the supervision of DHMTs and DHBs. There are plans
to convert smaller health centers into health posts, each with a single professional staff member.
Health centers have facility committees and neighborhood committees to encourage community
participation.
The reform program also provides for the creation of a number of structures for popular participation,
including area health boards, health center advisory committees (HCACs), and neighborhood health
committees (NHCs).
The new organization of the MOH/CBOH forms the basis for a significant decentralization of health
expenditures. Under the new system, the DHMTs prepare costed, district annual work plans on the basis
of inputs from constituent health facilities from the neighborhood and facility committees and approved
by the District Board of Health. District budgets and work plans must be approved by the CBOH, and
budget transfers are made directly to the district level on a monthly basis, contingent upon satisfactory
quarterly performance audits by the provincial offices and a review by the district basket steering
committee (Feilden and Nielsen 1998).
In complement to fiscal decentralization, user fees have been reintroduced as one of the cornerstones
of the health reforms. Districts and hospitals are permitted to set their own fee levels. National exemption
guidelines are set for certain diseases, age groups, and services. Districts do have control over the
implementation of the exemptions for the poor. Some DHMTs, i.e., Lusaka and Kitwe, go to district

2. Background and Formal Decision-Space Analysis 13
councils to get approval for fee increases. Current user fee policy requires health center revenues to be
submitted to the district-level offices for accounting. A large portion of the fees is then to be redistributed
to the facilities, but the accounting procedures and current practices for allocations are not transparent.
While the management of cost-sharing revenues differs significantly from district to district, there does
not seem to be any correlation between the level of fees generated by a facility and those redistributed to
it by the district. Official policy dictates that 10 percent of fee revenue from the health centers is to be
retained by the district level, but there is confusion in many facilities as to the level of revenues to which
they are entitled (Daura et al., 1998).
The impact of introducing user fees has generally been a short-term decrease in utilization followed
by a gradual recovery of previous utilization levels. There have been exceptions, however, where
utilization levels have been depressed over the longer term (Daura et al., 1998). In addition, several
districts and hospitals have initiated prepayment plans and in-kind payment in an attempt to diversify
cost-sharing and cost-recovery mechanisms.
Another innovation within the health reform program has been the establishment of an Essential
Health Care Package (EHCP), based on calculations of Zambia’s burden of disease and the relative cost-
effectiveness of health interventions (Feilden and Nielsen 1998). The EHCP specifies those primary care
services that are to be offered to all users of the public sector health system, including services for child
health, reproductive health, AIDS and sexually transmitted diseases, treatment of tuberculosis, malaria,
and drinking water/sanitation. Protocols have been developed for at least 20 conditions and the EHCP has
been used as the basis for reform of the training curriculum (Feilden and Nielsen 1998). However, it has
been noted that the EHCP has not been fully exploited as the basis for standardization of drug supply,
referral guidelines, and treatment protocols, nor have the results of the EHCP policy been adequately
disseminated to the DHMTs (Sukwa and Chabot 1997). Interestingly, while the district level health
offices are required to provide the EHCP in their health service programming, it has been noted that the
cost of the package exceeds available district resources by US$7-20 per capita (Sukwa and Chabot 1997;
Feilden and Nielsen 1998). It is unclear what effect this disproportion between responsibilities and
resources has on district decision space.
The current reform program also incorporates a number of further elements relevant to
decentralization, including the following:
> The decentralization of the Essential Drugs Program, replacing centralized drug distribution
system with district-level selection and purchase through the central procurement apparatus. This
policy was approved in 1996, but it has had difficulties in being implemented due to drug
shortages.
> The creation of a unified Financial, Administrative, and Management System (FAMS), with
uniform and transparent financial and progress reporting, and a national HMIS to monitor health
inputs, outputs, and outcomes data. FAMS and the HMIS are operational in all districts and in
some lower level facilities and are being extended to the hospital sector.
Initial results of the decentralization reforms on health sector performance have been mixed. As
discussed below, the degree of fiscal decentralization has been considerable, and some analysts consider
this to have significantly improved service delivery at the local level (Visshedijk, Liywalii, and
Oosterhout 1995). In the context of the 1997 independent review of the Zambian health reforms, Foltz
(1997) identifies a notable improvement in the districts as a result of the reforms, specifically with respect
to facility maintenance and health care worker morale. Daura et al. (1998), however, provide an analysis
of cost-sharing that appears to contradict these favorable reports, indicating that there is considerable

14 Decentralization of the Health System in Zambia
variation in the service quality between districts and facilities and that in many districts service quality,
drug and supply availability, and worker motivation remain quite low.
More recently, the viability of the reforms has come into question in the context of major public
upheaval. Since mid-1998, the Zambian public health sector has been rocked by a series of work
slowdowns, protests, and strikes organized by the Zambian National Union of Health and Allied Workers.
The organization has decried the deterioration of health facilities and supplies and is demanding payment
of delayed salaries and benefits. These upheavals centered on a nine-day strike at the University Teaching
Hospital in Lusaka in June 1998, but they have been widespread and ongoing throughout the country. A
simultaneous crisis has developed concerning district and hospital management boards, several of which
were dismissed by the Minister of Health in the second half of 1998. The dismissal occurred amidst
allegations of financial mismanagement by the boards and counter-allegations of discrimination and
autocracy on the part of the minister. Despite the absence of any more systematic information, these
journalistic accounts appear to indicate a profound crisis in the functioning of board management in
human resources in the Zambian health sector and constitute a threat to the viability of the reforms.
2.2 Deconcentration, Devolution, and Decision Space at the Local Level
Applying the public administration framework to the decentralization process in Zambia is not easy.
It is clear that the creation of the CBOH and the transfer of major responsibilities for the day-to-day
operations to that body is a case of delegation of authority to a semiautonomous agency. The transfer of
responsibilities to the DHMTs, which are still under the administrative preview of the central authorities,
can be seen as a process of deconcentration. However, the granting of some authority to the local
representatives on DHBs and local community committees can be seen as an attempt to provide local
accountability similar to processes of devolution. In a strict sense, since the transfer of authority is not to a
local government body—like the municipal councils—it is not considered devolution. The introduction
of this measure of local accountability is more than is usually implied in other national processes of
deconcentration. It is this kind of ambiguity that makes the public administration framework somewhat
weak as a framework of analysis. Nevertheless, for the purposes of this study, the Zambian case was
considered primarily one of deconcentration and delegation.
Applying the decision space framework to the local decision making at the district level, the Zambian
case is a case of relatively moderate ranges of choice but considerable variation among the different
functions, as summarized in Map 2.

2. Background and Formal Decision-Space Analysis 15
Map 2. Map of Local Decision Space at District Level
Range of Choice
Function
Narrow Moderate Wide
Finance
Sources of revenue
DHMT and DHB almost
totally dependent on central
allocations, but currently
receiving ~50% of
MOH/CBOH budget
Expenditure allocation DHMT and DHB develop
and manage budget plans
with central review, but
restrictions on % spent on
admin., capital, % allocated
to different levels
Income from fees and
contracts
DHMT & DHB set user fees
and exemptions for the poor
(exemption according to
disease is set nationally) and
receive 25% of fees,
Service Organization
Required norms and
programs
There are some required
norms and programs but
often loosely enforced
Hospital autonomy Major hospitals managed
by centrally appointed
boards. Facility committees
composed of health
workers and community
reps. Facility action plan
and budget prepared with
tech support from DHMT,
and approved by DBH and
CBOH
Insurance plans
Prepayment
schemes allowed in
all districts
Payment mechanisms
Districts allowed and
encouraged to use
variety of payment
mechanisms
including per capita,
as well as accepting
prepayments and in-
kind payments
Contracts with private
providers
Contracting with mission
health assistance providers
initiated

16 Decentralization of the Health System in Zambia
Human Resources
Salaries
Salaries and allowances
centrally determined
Contracts Contracting of non-
permanent staff
Civil service District health boards have
hire/fire authority only for
delinked personnel (which
applies to non-professional
certified staff only after
1997)
Access Rules
Targeting Explicit targeting from
MOH/CBOH with respect to
delivery of EHP Services,
but latitude within EHP
Governance Rules
Local government
accountability
District councils
democratically elected but
little representation or
authority in DHMTs
Facility boards District and hospital boards
appointed by Minister of
Health
Health offices (DHMT) Appointment by DHB but
rules centrally determined
Community participation Neighborhood Health
Committees and Facility
Committees usually
democratically elected,
2.2.1 Financing Functions
The financing function has three major subcategories: control of revenue sources, expenditures, and
fees. For revenue sources, the districts are mainly dependent on the central budgetary transfers (which
combine national budgetary sources with donor funding in what is called the “basket” of funding), and,
other than locally generated fees and some nonmedical enterprises like canteens, they have almost no
direct ability to add new, significant sources of revenue. This contrasts with devolved systems where local
tax revenues often can be added to the central budget transfers at the discretion of the local governments.
The districts are allowed a moderate range of choice over expenditures. They are given earmarked
ranges of choice over the allocation of their expenditures (central, local fees, and any other sources),
which limit their choices on allocations to district offices, hospitals, health centers, and community
activities as well as to the traditional expenditure categories of personnel, transportation, drugs, and
capital costs (see Section 3). The choices over personnel are limited at the district level in that the
Ministry of Finance pays salaries directly and the MOH hires and fires the permanent professional staff.
There was an attempt to “delink” this staff and to have them hired and fired by the district authorities, but

2. Background and Formal Decision-Space Analysis 17
this effort was resisted and only implemented in a few isolated cases. Beginning in 1998, delinkage did
occur for the low-salary nonprofessional staff. However, salary levels and the levels of allowances
continue to be determined by the center. Drug supplies are also significantly controlled by the center in
that drug kits are provided directly to the districts and do not appear on the district budgets.
District choice regarding fees for use of services and exemption rules is moderate in that the DHMT
must gain local board and community committee approval for new fee schedules and those fees must also
be approved by the CBOH. Guidelines specify some ranges and exemption policies for some activities
and suggest bypass fees to discourage first use of hospital services without referral. However, unlike in
other national systems, the districts do not have to apply a single national fee schedule.
2.2.2 Service Delivery Function
The norms and standards of the MOH include the EHCP described above. Although there is some
range of choice allowed in the EHCP, there are no clear guidelines on how to make those choices, and as
described in the following paragraphs, districts do not seem to make choices about types of services
offered; rather, they let scarcity of resources dictate expenditures within the categories of levels of care
and budgetary categories previously described. Sets of district guidelines were distributed in 1997-1998,
and although elaborate protocols exist and some training has occurred, it appears that the lack of clear
enforcement of these standards allows some range of choice to the districts.
Hospital autonomy is not a decision made at the local level. The central authorities have defined how
the hospitals are to be managed through boards that are selected by the Ministry itself.
The payment mechanisms beyond salaries and allowances are not specified by the center, which
allows, and even encourages, a range of choice including per capita, in-kind payments, prepayments, and
fee for services.
Contracts with private providers are formally allowed, and in many cases the CBOH insists on the
district’s allocating funding to contracts with mission hospitals and health centers. Although this choice is
to be formally made by the districts, it is often imposed by the CBOH.
2.2.3 Human Resources Functions
As noted in the section on financing, the MOH and the Ministry of Finance at the center define and
pay salaries of permanent professional staff, and they did so for nonprofessional staff until 1998 when
these staff members were “delinked” to the districts. The central control extends also to allowances paid
to all types of personnel.
Districts are, however, allowed to contract additional staff on their own and can pay their personnel in
a variety of payment mechanisms and at salaries they determine. This choice is somewhat limited in that
personnel expenditures have a ceiling and most contracted professional staff are in a temporary phase of
waiting to be incorporated in the permanent staff of the MOH.
The initial attempt to delink professional staff to the districts would have given districts a different
role and allowed a significant shift from civil service constraints. Delinkage has only been partially
applied, however, and civil service restrictions remain largely enforced, except for the nonprofessional
“certified” staff.

18 Decentralization of the Health System in Zambia
2.2.4 Targeting
The center exercises several mechanisms to control targeting, including guidelines for exemptions
from fees for specific types of services, the establishment of the EHCP, and the percentage earmark range
for primary health care facilities. Each of these targeting devices has some moderate flexibility granted to
the district authorities.
2.2.5 Governance
The local district councils are democratically elected and therefore formally accountable to the local
population. However, although the district councils have been given greater autonomy and authority over
district personnel, they have little influence over the health sector except through their minimal
representation on the DHBs.
District and hospital management boards are formally appointed and dismissed by the Minister of
Health. The selection of the boards is made locally and approved by the Ministry, and one minister in
particular exercised this right to dismiss boards. However, this ministerial power has in practice
significantly reduced the effective autonomy of the boards. Although the boards are ultimately supposed
to be the employers of the DHMTs, according to the 1997 independent review, they were generally
considered to have an advisory role. The boards have received little training, often do not meet, and
appear unsure about their role and relationship with the DHMTs.
The central authorities have defined the activities and roles of the DHMT, the boards, and the
neighborhood and facility committees. These definitions are vague enough, however, to allow for
significant local choice in who is proposed to be appointed by the Ministry, how they are selected, and
how long they serve, except in cases where the Ministry actively decides to dissolve them.
To provide a comparative view of how the Zambian decision space compares with the decision space
of other countries, this report presents the results of prior studies of countries that have been analyzed by
the Harvard School of Public Health using the decision space framework.
2.3 Comparative Analysis of Decision Space
In terms of the traditional distinction between devolved and deconcentrated systems of
decentralization, Zambia is closest to a deconcentrated system with the districts still basically within the
structure of the MOH and not assigned to the local governments. In contrast, the Ghanaian system is one
of delegation to another relatively centralized institution, and all five of the other countries analyzed could
be classified as systems in which responsibility and authority were devolved to local governments.
In addition to Zambia, the decision space framework was used to assess the decision space available
to six other countries that were studied using a similar methodology. Four of the countries—Ghana,
Uganda, Zambia, and the Philippines—were analyzed using secondary sources as a preliminary phase in
the current study. The other three—Chile, Colombia, and Bolivia—were studied in the USAID-funded
Data For Decision Making Project of the Harvard School of Public Health as part of USAID’s Latin
America and the Caribbean (LAC) Health Sector Reform Initiative. This section compares the decision
space of Zambia to these other countries. It should be noted that although there are general criteria for
judging these ranges of choice, there is significant room for judgment in each country case. There is no
easy method for countering the subjectivity of this exercise; even a panel of expert judges with the

2. Background and Formal Decision-Space Analysis 19
detailed knowledge of all three cases would be hard to establish. Therefore, the information provided in
Map 3 should be taken as indicative and subjective and not as quantitative tools.
Map 3. Comparative Decision Space: Current Ranges of Choice
Range of ChoiceFunctions
Narrow Moderate Wide
Financing
Sources of Revenue Zambia Ghana, Uganda, Colombia,
Chile,
Bolivia
Philippines
Expenditures Zambia, Ghana, Uganda,
Philippines, Colombia, Chile,
Bolivia
Income from Fees Chile, Bolivia
Zambia, Ghana, Uganda,
Philippines, Colombia
Service Organization
Hospital Autonomy Zambia, Ghana,
Colombia, Chile
Uganda, Bolivia Philippines
Insurance Plans
Ghana,Uganda,
Colombia, Chile,
Bolivia
Zambia, Philippines
Payment Mechanisms Ghana, Uganda Philippines, Colombia, Chile,
Bolivia
Zambia
Contracts with Private
Providers
Zambia, Ghana, Philippines,
Colombia, Bolivia
Uganda, Chile
Required Programs &
Norms
Colombia, Chile,
Bolivia
Zambia, Ghana, Uganda,
Philippines
Human Resources:
Salaries Zambia
Ghana, Uganda,
Philippines,
Colombia, Chile
Bolivia
Contracts Ghana Philippines, Colombia, Bolivia Zambia, Uganda, Chile
Civil Service
Ghana, Colombia,
Chile, Bolivia
Zambia, Uganda, Philippines
Access Rules Ghana, Colombia,
Chile, Bolivia
Zambia, Uganda, Philippines
Governance
Local Accountability Zambia, Ghana Uganda, Philippines,
Colombia, Chile, Bolivia
Facility Boards Zambia, Ghana,
Uganda,
Philippines,
Chile

20 Decentralization of the Health System in Zambia
Colombia, Bolivia
Health Offices Ghana, Philippines,
Colombia, Bolivia
Zambia, Uganda, Chile
Community
Participation
Ghana, Uganda,
Bolivia
Zambia, Philippines Colombia, Chile
Total Decision Space:
Zambia
Ghana
Uganda
Philippines
Colombia
Chile
Bolivia
5
11
5
3
8
7
9
8
5
8
8
6
5
6
3
0
3
5
2
4
1
Map 3 shows that, overall, Zambia tends toward the “moderate” range of choice along with Uganda
and the Philippines, with eight functions in that range. However, both the Philippines and Chile have a
higher number of functions in the “wide” range while only the Philippines has fewer functions in the
“narrow” range.
In the financing functions, Zambia had the narrowest choice of all the countries regarding control of
revenue sources. This is because Zambian districts receive most of their budgets from the national
government and do not receive local own source revenues from local governments, as do the other
countries. Similar to the majority of the other countries, Zambian districts had a moderate range of choice
over expenditures and income from fees.
In service organization functions, Zambia was similar to the majority of the other countries in hospital
autonomy, contracting private providers, and required norms and programs. It had an unusually wide
choice, however, over insurance plans and payment mechanisms.
Zambia, as well as all other countries, had a narrow choice over human resource salaries. Only Chile
had a wide choice over salaries in its initial implementation; however, a law that restored civil service
restrictions on salaries, and was supported by professional associations and unions, narrowed that choice.
Zambia had a wide range of choice over contracting additional staff, as did Uganda and Chile. Similar
to Uganda and the Philippines, Zambia had moderate choice over civil service employment rules under
the limited implementation of “delinkage.”
Local control over access rules is moderately restricted in Zambia, as it is in two other countries, but
more so than the rest. With the exception of Ghana, local accountability in Zambia was more limited than
in other countries, since it was limited by the lack of local government participation in the sector and by
the fact that the Ministry selected the participants in the district boards. Although Zambian districts had
moderate control over health offices, which was more than a majority of the other countries had, its
moderate control over community participation was less than that of Chile and Colombia.
In conclusion, the range of choice offered to Zambian local health districts is moderate; however, for
many functions, it has more than the systems that were devolved to local municipal governments. The
narrow range of choice over additional local government contribution to revenue is the key distinction
that limits Zambian choice.

3. National Level Data Analysis of All Districts 21
3. National Level Data Analysis of All
Districts
This section examines the effects of decentralization that can be assessed using data available at the
national level. These data sources included the MOH management information system with financial and
service utilization data supplemented by selected variables from the LCMS in 1996 and 1998.
These data sets allowed researchers to assess some of the key issues of the study framework using
bivariate and multiple regression analysis. First, researchers examined several financing issues in relation
to the choices made by the central authorities in allocating resources to the districts. In addition, other
sources of revenue were assessed, including the own source revenues from medical fees. Then the local
district’s allocation choices were evaluated: assignments to primary care, hospitals, and district offices, as
well as assignments to personnel, transportation, and drugs. Researchers were able to relate these
allocation choices to local characteristics to evaluate the impact of decentralization on equity among
different types of districts. They were unable to assess other elements of the decision space, such as
service organization, many human resource issues, targeting, and governance. These issues are examined
to some extent in Section 4 in the field case studies of the nine districts.
Changes in utilization and immunizations were also examined as important measures of performance.
For this analysis, researchers were able to relate differences in utilization and immunization performance
to different local characteristics, again measuring mainly the equity of performance under
decentralization.
3.1 Data Sources
The data sources used for this analysis are the MOH’s FAMS and HMIS and the 1996 LCMS.
Expenditure data from the FAMS were available for the period 1995 to 1998; however, revenue data on
sources of funds were only available for 1997 to 1998. The HMIS data were available only for the period
1997 to 1998. Much of the information provided in Tables 1 through 10 includes data from 50 of the 72
districts. Only 50 districts had complete financial data from 1995 to 1998.
The FAMS provided information on revenues and expenditures at the district level. The HMIS
provided information on utilization and immunization coverage. The LCMS is a household survey that is
representative at the district level. The LCMS was used to create variables for local conditions: average
household income, degree of urbanization, average level of education, access to health facilities, and
number of children under five years of age. LCMS population figures supplied by the Office of Statistics
were also used. (See Annex B for a complete explanation.)
While the data presented are probably the best available and certainly among the best data for district
level analysis in the developing world, they have limitations. In many cases, only partial data were
available, and there are clear inconsistencies in some data sources. Given these concerns, it is important
not to be overly confident about the study findings. Nevertheless, the authors believe that this analysis is
more complete and can be taken with more confidence than most anecdotal reports based on very partial
observations.

22 Decentralization of the Health System in Zambia
3.2 Allocation Decisions
3.2.1 Revenues from Central Authorities, Medical Fees, and Other
Sources
Revenues that the district authorities control come from a variety of sources. It should be noted that
there are also funds that the district does not control that provide significant portions of the total health
expenditure in the district. The MOH and the Ministry of Finance provide a major portion of the salary
expenditures directly to the civil service staff, and the major promotion of the drug supplies come through
“drug kits” that are paid by donors or central funds. In addition, there is some donor funding that is not in
the “basket” of funds available to the districts. Only the funds that come under the direct control of the
district authorities are analyzed here.
Table 1 reports data on the average contribution of grants from the government, medical fees
collected from the households, and other funds (mainly donor funding). Calculations in this table are
based on data from those districts that had data available from 1997 to 1998, and as the table shows, data
on these variables are only available for 1997 and 1998. The average total income per district increased in
1998 over the 1997 value. The decline in the average amount of the budgetary transfer “grant” per district
from the government was more than offset by the increase in the fees collected from the households and
other funds, which are basically donor funding.
Table 1. District Mean of Sources of District Income in Constant 1998 Kwacha
1997 1998
Grant funds 330,278,443 308,352,910
Grant funds % 92 84
Grant funds per capita 2,084 1,871
Other funds 10,366,496 32,447,235
Other funds % 3 10
Other funds per capita 57 212
Medical Fees 26,349,567 28,680,088
Medical Fees % 5 6
Medical Fees per capita 118 127
Medical Fees as % of THE 5 6
Total Revenues 366,994,506 369,480,232
Total Revenues per capita 2,259 2,210
Source: Government of Zambia
The share of average total income contributed by grants from government declined from 92 percent in
1997 to 84 percent in 1998; however, the share of other funds rose from 3 percent in 1997 to 10 percent in
1998 and that of user fees remained the same. Average total per capita income and average grant per
capita declined over the two years, but the average per capita of other funds and medical fees increased.

3. National Level Data Analysis of All Districts 23
3.2.2 Budgetary Transfer Grants from Central Authorities
The major source of funding at the district level comes from grants that are transfers from the CBOH
to the districts. The source of these funds is largely donors in the sectoral “basket” of funds that are
funneled through the CBOH.
Factors that were included in the formula for resource allocation to the districts during the post
decentralization period (1993) varied from year to year. They were primarily and consistently based on
population size, which was variously adjusted by degree of urbanization, index of fuel prices, absence of
bank of fuel station, and, for a brief period before 1997, second- or third-level hospitals (Lake et al.,
2000).
The first question to ask is whether this formula for resource allocation was actually applied. For
purposes of this study, researchers were only able to assess the relation of grants (actual disbursements) to
population and urbanization using national level data from the Central Statistical Office and from the
LCMS of 1996. Although district “wealth” or average household income was not an explicit part of the
formula, it is possible to assess whether the formula favors wealthier or poorer districts based on LCMS
household survey data on average income in the district.
The LCMS data allowed an assessment of the relation of grants to other local characteristics: average
educational level, access to health facilities, and percentage of children under the age of five. Although
these characteristics were not part of the formula, the equity of allocations from the center might be
assessed using these variables to see if the actual allocations favored higher or lower educational levels,
those areas with greater or lesser access to health facilities, and those areas with higher or lower
percentages of children under five. The relationship of allocations to these local characteristics was tested
in a variety of ways.
During this study, researchers were unable to analyze data from before decentralization in 1993 to
compare it with data after decentralization. Prior to decentralization, financial data were not disaggregated
to the district level. It was not until 1997 that relatively consistent data on financing were available for the
district level. An analysis of data for 1997 and 1998 shows that the population appears to have been used
in some way in the actual allocation of grants. Table 2 shows that the larger populations received 4.5
times more in total grants than did the smaller populations and that the correlation coefficient was almost
one, with a high degree of significance.
1
1
Correlations that are significant at p-value of less than .25 are in bold.

24 Decentralization of the Health System in Zambia
Table 2. Total Grants 1997-1998 by District Population Quintiles
Population Quintiles 1997* 1998
1
st
(smallest) 186,250,000 138,000,000
2
nd
275,000,000 162,000,000
3
rd
316,250,000 289,000,000
4
th
450,000,000 324,000,000
5
th
(largest) 833,750,000 621,000,000
5
th
/1
st
4.48 4.50
Correlation Coeff. 0.94 0.96
p-value 0.0001 0.0001
Source: Government of Zambia
*Adjusted according to Consumer Price Index for 1998
Table 3 shows that grants per capita were relatively consistent among urban percentage quintiles and
income quintiles. The significant negative correlation for income that appears in 1998 suggests that the
actual allocation may have been shifting toward poorer rural areas as implementation progressed.
Table 3. Grants Per Capita 1997-1998 by District Income and Urbanization Quintiles
Grants per Capita 1997* 1998
Income Quintiles
1
st
(poorest) 2373.76 1860.85
2
nd
2740.74 1976.76
3
rd
2286.34 2014.33
4
th
2621.68 1794.77
5
th
(wealthiest) 2921.88 1631.6
5
th
/1
st
1.23 0.88
Correlation Coeff. -0.04 -0.23
p-value 0.76 0.11
Urban Quintiles
1
st
(most rural) 2448.66 1742.81
2
nd
2769.38 1981.13
3
rd
2483.63 1931.72
4
th
2461.00 1900.56
5
th
(most urban) 2781.73 1722.09
5
th
/1
st
1.14 0.99
Corr. Coef. 0.02 -0.12
p-value 0.90 0.42
Sources: Government of Zambia and LCMS 1996
*Adjusted according to Consumer Price Index for 1998

3. National Level Data Analysis of All Districts 25
Figure 2 presents a summary of these three tables that shows more directly that the grants were
relatively equal based on population, urbanization, and average district household income.
Figure 2. Equity of Grants Per Capita
The regression analyses attempted to explain the assignment of government grants (per capita) in
terms of district income, urbanization, education, access to health facilities, and percentage of children
under the age of five years. Since data on grant funding was only available for 1997 and 1998, regression
data for 1998 only were analyzed (see Table 4). This analysis suggested that these variables were not
significant explanatory variables.
Table 4. Regression of Grants Per Capita 1998
Dependent Variable Grants Per Capita
Total N N=50 Districts
Independent Variables Coeff. t
Income -0.59 -0.35
Urbanization 105.60 0.19
Education -158.43 -1.11
Access -8.96 -0.48
Children Under 5 yrs 2556.98 0.59
Constant 2912.88 * 3.23
R-square 0.0746
p-value 0.6195
* |t| >2.00 ** 1.5<|t| <2.0
One can conclude that the allocations from the center appear to be largely based on the population
formula. There is no clear evidence that the allocations begin to favor rural over urban areas, as would be
expected by the articulated formula. An analysis of correlation coefficients between per capita grants and
average district income based on LCMS data suggests that, although it was not an explicit part of the
formula, the grant allocations did seem to favor the poorer districts by 1998.
Grants Per Capita: 5th/1st Quintile
Ratio
0
0.5
1
1.5
1997 1998
Year
Ratio
Income Quintiles
Urbanization
Quintiles

26 Decentralization of the Health System in Zambia
3.2.3 Medical Fees
The second source of revenue for districts comes from user fees—called “medical fees” in Zambia.
The following analysis attempts to determine which districts were more successful in generating fees.
This is important since local conditions limiting the success in generating local fees will limit the local
control over health resources. Some districts will be more dependent on the central budgetary grants than
others.
The study examined the relationship between the percentage of total district revenue that comes from
fees and local characteristics such as population, income, and urbanity (see Annex A, Tables 25-28).
Figure 3 shows that districts with higher income and larger and more urban populations were collecting a
higher percentage of their revenue in fees. It also shows that the gap between rich and poor districts has
increased over the two years while the gap between larger and less urbanized districts has remained
relatively stable.
Figure 3. Equity of Medical Fees as Percent of Total District Revenue
The study also examined other sources, mainly donors not included in the government basket, but it
also included other nonmedical revenue sources, like profits from a district board canteen. The bivariate
and regression analyses did not show any strong relationships.
In conclusion, the data show that the formula for assigning resources to districts seems to be based on
a population estimate, resulting in relatively uniform per capita assignments of central grants to the
districts. The formula should favor rural districts, and there is some evidence that by 1998 the allocations
began to slightly favor rural areas. By 1998, allocations did favor poorer districts, although that factor was
not part of the formula. The findings indicate that, overall, the allocations from the center are relatively
equitable in terms of population, urbanity, and income.
The study also found that the wealthiest and the most urban districts were most successful in raising
fees as a percentage of total revenue and that there is a growing gap between the wealthiest and most
urban versus the poorest and most rural districts in generating fees. This is to be expected, but without a
mechanism to favor the poorer and more rural districts, it suggests that the current level of overall equity
in revenues is likely to deteriorate over time.
Medical Fees as a Percent of Total
Expenditures: 5th/1st Quintile Ratio
0
2
4
1997 1998
Year
Ratio
Population
Quintiles
Income Quintiles
Urbanization
Quintiles

3. National Level Data Analysis of All Districts 27
3.3 Local Choices over Expenditures
The decision space analysis suggests that local districts have some choice about how to allocate their
expenditures within some guidelines of earmarked percent ranges distributed by the CBOH. These
guidelines are, however, just that; they are not strictly enforced by the CBOH. Districts are required,
however, to provide strong justification if their expenditures are not within the range of the guidelines.
In this analysis, the total health expenditures that were available to the local district decision makers
from all sources—grants, fees, and other sources—were assessed first. Researchers tried to determine
how these expenditures were changing over time and, as above, whether they were related to local
characteristics of the districts.
3.3.1 Total Health Expenditures
Total health expenditures at the district level and per capita increased in nominal terms from 1992 to
1998 with a significant jump in 1996 (see Table 5). There is a minor decline from 1997 to 1998 in both
figures. However, when adjusted for inflation, the real allocations are declining significantly in both total
expenditures and in per capita terms. Zambia’s economic performance has been severely constrained and
has registered negative growth in Gross Domestic Product (GDP) during the better part of the 1990s, as
the statistics show. For instance, the GDP per capita in 1994 prices was K255,785 and had declined by
1999 to K231,825, a decline in real terms as stated of 10 percent.
Table 5. Total Nominal and Real Total and Per Capita Health Expenditures 1992-1998
Year Nominal THE Nominal THE/cap Percentage change*
1992 1,674,572,686.0 ----- 0.00
1993 3,892,525,541.0 ----- 132.45
1995 3,564,790,165.2 23,955.4 -8.42
1996 13,245,900,269.9 88,496.3 271.58
1997 18,138,518,973.4 109,443.2 36.94
1998 17,813,602,650.0 105,712.9 -1.79
Year Real THE** Real THE/cap**
1992 20,932,158,575.0 ----- 0.00
1993 17,693,297,913.6 ----- -15.47
1995 7,921,755,922.7 53,234.2 -55.23
1996 20,378,308,107.5 136,148.2 157.24
1997 22,673,148,716.8 136,804.0 11.26
1998 17,813,602,650.0 105,712.9 -21.43
* Based on Nominal Total Health Expenditures (THE) and Real THE
** Based on Consumer Price Index for 1998 in Kwacha
*** 1992-1993 includes only 40 out of 57 Districts
**** 1995-1998 includes only 50 out of 72 Districts
Researchers examined total health expenditures by population size to see if the relationship found for
grants also held for total expenditures. It did, as Table 6 indicates.

28 Decentralization of the Health System in Zambia
Table 6. Total Health Expenditures 1995-1998 by District Population Quintiles
Population Quintiles 1995* 1996* 1997* 1998
1
st
(smallest) 89,111,111 195,384,615 191,250,000 167,070,507
2
nd
84,888,889 252,307,692 281,250,000 182,939,020
3
rd
110,444,444 332,307,692 326,250,000 307,529,441
4
th
135,555,556 509,230,769 491,250,000 374,322,384
5
th
(largest) 372,178,393 747,692,308 976,250,000 749,498,911
5
th
/1
st
0.42 3.83 5.10 3.83
Correlation Coeff. 0.90 0.93 0.93 0.97
p-value 0.0001 0.0001 0.0001 0.0001
Source: Government of Zambia
*Adjusted according to Consumer Price Index for 1998
By looking into this expenditure data in more depth, the study attempted to see if urbanization or
average household income was related to different levels of per capita spending (see Annex A, Tables 29-
32). In other words, do more urban and wealthier communities get an advantage in the assignment of
health budgets and generation of fees and other sources? The total health expenditures per capita were
examined in relation to urbanization and income, as shown in Figure 4.
Figure 4. Equity of Total Health Expenditures Per Capita
Figure 4 shows that initially the total health expenditures were higher in rural and poorer districts and
that over time this advantage was reduced; by 1998, the gap was reduced, resulting in more equal
allocations.
3.3.2 Allocation of Expenditure to Primary Level and Other Levels
The management of financial resources at the district level is guided by the District Planning Guide
prepared by the CBOH. The guide sets ceilings on how much the district can spend on each item as a
percentage of the total budget (see Table 7). The general guide determines how much can be spent at the
district office, referral hospitals, health centers, and in the community. The guidelines were consistent
throughout the period for which data are available.
THE Per Capita: 5th/1st Quintile Ratio
0
0.5
1
1.5
1995 1996 1997 1998
Year
Ratio
Population Not
Included
Income Quintiles
Urbanization
Quintiles

3. National Level Data Analysis of All Districts 29
Table 7. Guidelines for Management of Financial Resources
Level All district Boards
Minimum Maximum
District Office 5% 15%
1st Referral Hospital 20% 40%
Health Centers 45% 60%
Community 2% 5%
Source: District Planning Guidelines 1999
Table 8 presents data on the average distribution of expenditure for the district office, district hospital,
health center, community, and primary care. Calculations in this table are based on data from those
districts that had data available from 1995 to 1998. Primary care is a sum of health center and community
level expenditures.
Table 8. Average Distribution of Expenditure on Primary Care and Other Levels
Year District Office % District Hospital % Health Center % Community % Primary Care %
1995 32 29 31 8 39
1996 21 24 38 18 56
1997 24 23 43 10 53
1998 23 23 51 3 54
N=50 districts with complete reporting
Per district, the share of total expenditures that went to the district hospital decreased on average from
about 29 percent in 1995 to around 23 percent in 1998, while the amount going to primary care increased
from about 39 percent in 1995 to around 54 percent in 1998. This suggests a shift of resources to primary
health care and conforms to one of the objectives of the health policy. The component contributing to the
increase in the share of primary health care expenditure has been health center expenditure, since the
share of expenditure on community has been decreasing since 1996.
Table 8 shows that the guidelines are not being respected. The districts overall are consistently
spending more on district offices than they should. At first they spent less than the targets for health
centers, then they over spent, and they overspend the targets for community, but these amounts ended up
within the approved range. Districts did, however, respect the target range for hospitals.
The study also attempted to see if income and urbanization explained differences in allocation
decisions toward primary care (see Annex A, Tables 33-36). Figure 5 shows that districts with larger
populations assign higher percentages to primary care but that the gap between large and small districts
has declined over time. Although wealthier municipalities tended toward a 20 percent higher expenditure
than poorer municipalities, this difference was relatively stable—the gap between rich and poor was not
increasing or decreasing. On the other hand, more urban districts were increasingly assigning greater
proportions of their expenditures to primary care. The major explanation for this is that large urban
districts rely more heavily on secondary and tertiary hospitals that are funded directly by the MOH and
are not part of their district budgets.

30 Decentralization of the Health System in Zambia
Figure 5. Allocation to Primary Care According to Population, Urbanization, and Income
The study found a significant difference in allocations within primary care, with declining
assignments toward the community level and increasing allocations toward health centers (See Annex A,
Tables 37-40 and 41-44, respectively). While this may be a disturbing trend, it is within the guidelines
that the CBOH set, as previously noted. In addition, the study found that over time higher income districts
had reduced the assignments to the community more than did lower income districts and the gap between
high and low income increased over time.
A similar analysis of the data on assignments to health centers and hospitals shows that the decline in
community percentages was shifted to health centers, not hospitals or offices, and that the shift was more
pronounced in more urban areas (See Annex A, Tables 45-48 and 49-52, respectively). It is important to
note that the spending on hospitals in the wealthiest and most urban districts is significantly lower than in
other districts. This is probably due to the presence of second- and third-level hospitals in these districts.
The presence of other providers in the district means that a share of the disease burden is shifted to them.
This would be the case for mining towns with a lot of industrial clinics and hospitals or in cities like
Lusaka where a large number of the population attends private health facilities, either paying out of
pocket or through insurance and employee benefits. Lusaka is also served by the Ministry’s Teaching
Hospital, which is funded through the Ministry.
3.3.3 Allocations to Budgetary Expenditure Items
The districts have expenditure guidelines for traditional budgetary categories of personnel
allowances, drugs, fuel, and capital. Table 9 gives the CBOH guidelines for expenditures in each
category, and the districts are required to report expenditures in these categories and justify expenditures
that exceed the guideline percentages. District expenditures for personnel allowances include per diem
allotments to staff for travel and housing allowances. It is important to note that the expenditures on drugs
do not include the “drug kits” that are supplied directly to the districts by the central authorities and
probably make up the bulk of the drug supplies the ceilings apply to “emergency” drug requirements
above what is supplied by the drug kits.
Table 9. District Guideline on Expenditures (Cost Item Expenditures)
Personnel allowances Drugs and supplies Fuel Capital
20% 4% 15% 15%
Percent Allocated to PHC: 5th/1st
Quintile Ratio
0
0.5
1
1.5
2
1995 1996 1997 1998
Year
Ratio
Population
Quintiles
Income Quintiles
Urbanization
Quintiles

3. National Level Data Analysis of All Districts 31
Table 10 presents data on the actual average distribution of total health expenditures on personnel
allowances, drugs, fuel, transport costs, other costs, and capital costs. The distribution of average total
expenditure per district among its various components remained almost the same. The data show that
except for personnel allowances before 1998, district averages were within the guideline maximum
allocations. This is an important finding. It suggests that Zambia was able to implement fairly strict
maximum allocations as a tool of central control and that this tool was effectively enforced.
Table 10. Percent Allocations to Budgetary Expenditure Items
Expenditure Items 1995 1996 1997 1998
Allowances % 24 21 21 18
Drugs % 3 2 2 2
Fuel % 11 13 14 12
Capital Costs % 7 6 5 5
The next item assessed was whether different types of districts had different allocations in these
categories.
3.3.3.1 Personnel allowances
The expenditures for personnel allocations were analyzed to see if district population, income, or
urbanization explained differences in allocation (see Annex A, Tables 53-56). As shown in Figure 6, the
study found that smaller and more rural districts consistently spent more on personnel allowances. This
finding is probably explained by the greater need for per diem travel allowances in rural areas with small
dispersed populations.
Figure 6. Allocation to Allowances According to Population, Urbanization and Income
Percent Allocated to Allowances:
5th/1st Quintile Ratio
0
0.5
1
1.5
1995 1996 1997 1998
Year
Ratio
Population
Quintiles
Income Quintiles
Urbanization
Quintiles
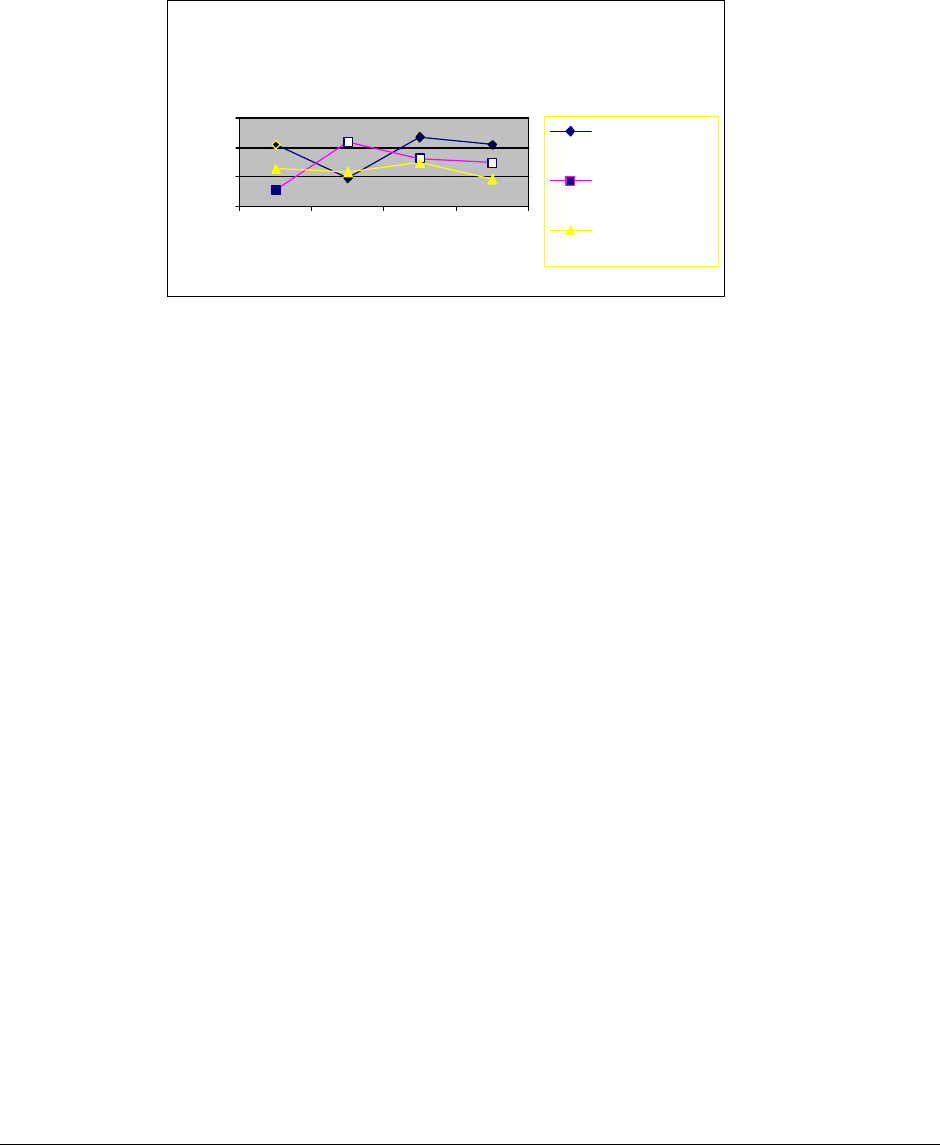
32 Decentralization of the Health System in Zambia
3.3.3.2 Drugs
The data show that districts in general remained within the guidelines for drug allocations. As Figure
7 indicates, larger, more urban, and wealthier districts allocate a greater percentage of their total
expenditures to drugs (see Annex A, Tables 57-60).
Figure 7. Allocations to Drugs According to Population, Urbanization, and Income
3.3.4 Conclusion Regarding Local Allocation Choices
Local districts did take advantage of the increased decision space over allocations allowed by
decentralization. Although there were guidelines established by the CBOH, the districts repeatedly made
choices that did not respect those guidelines. They appear in general to have been persuasive in their
justifications for violating the guidelines since few were sanctioned for violations of guidelines. The
CBOH generally sanctioned districts only for nonreporting and for failing to respect accounting standards,
but all districts had to provide justifications for exceeding guidelines. The allocation decisions were often
fairly uniform among districts (at least by quintile), and there were some trends among all districts over
time. Decentralization, while in some specific districts may have had significant variations in allocations,
appears overall not to have led to major differences in allocation choices. There were some important
trends and specific differences, however.
First, there was a significant variation over time in the real per capita resources available at the
district levels. There were significant declines from 1992 to 1994 followed by increases from 1995 to
1997 (although they never reached the 1992 levels), followed by another decline in 1998. These trends
occurred during a period of general economic decline.
Over time, there was a significant increase in percentage allocations to primary care. Districts with
larger populations assigned higher percentages to primary care, but the gap between large and small
districts declined over time. Although wealthier municipalities tended toward a 20 percent higher
expenditure than poorer districts, this difference was relatively stable; the gap between rich and poor was
not increasing or decreasing. On the other hand, the more urban districts were increasingly assigning
greater proportions of their expenditures to primary care. The wealthiest and most urban districts spent
less on hospitals than did the other districts. This may be due to the presence of other providers, such as
private hospitals and secondary and tertiary hospitals that are funded directly by the MOH and are not on
the district budget. In addition, there was a shift within primary care from community-level expenditures
toward health centers; however, this shift was within the CBOH guidelines. It is notable that allocations
to district offices were much higher than the guidelines, but they did not seem to vary according to
Percent Allocated to Drugs Only:
5th/1st Quintile Ratio
0
2
4
6
1995 1996 1997 1998
Year
Ratio
Population
Quintiles
Income Quintiles
Urbanization
Quintiles
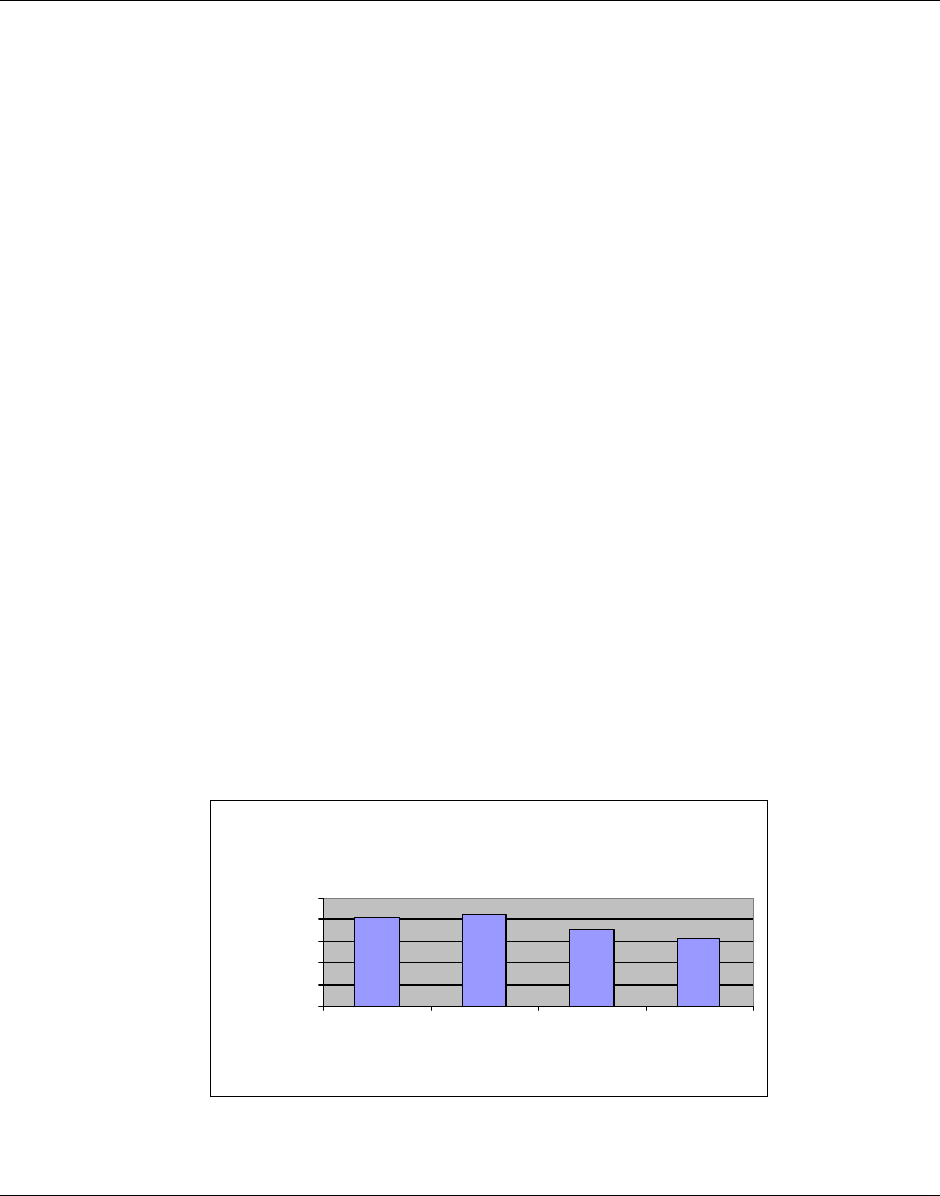
3. National Level Data Analysis of All Districts 33
income, urbanity, or population. Finally, the study found that the mechanism of using maximum
guidelines for traditional budgetary allocations was effectively implemented and that the percentage of
total expenditures that was devoted to personnel allowances was higher in smaller rural areas than in
larger urban areas.
3.4 Performance of Health System Decentralization
This section provides a review of national data on utilization and immunizations to examine trends
and differences in performance during the period of decentralization. While the previous section
examined the performance of the health system in terms of equity by discussing the equity of allocations
among districts with different local characteristics (income, urbanity, population size, and others), this
section will examine performance in terms of equity, efficiency, and quality by discussing data on
utilization rates and immunization coverage.
3.4.1 Utilization Rates
The data from the HMIS allow an analysis of the outpatient utilization rates for 1995-1998. The
number of districts reporting varied from year to year, however, there does not seem to be any significant
trend either over time or among income, urbanity, or population variables (see Annex A, Tables 61-64).
Combined with the data for expenditures, these tables suggest that the declining real per capita
expenditures did not result in declines in utilization rates. Although this might indicate improvement in
efficiency, there is no measure of the quality of these services, which may be suffering from decline in
funding.
3.4.2 Immunization Trends
One of the major fears of public health officials is that decentralization will disrupt the effectiveness
of priority centralized vertical programs such as immunization programs. As Figure 8 shows, there is
some evidence to support this fear. Using the data for coverage of the third dose of the DPT (diphtheria,
pertussis, and tetanus) vaccine, it appears there was a significant decline in coverage from 82 percent in
1995 to 63 percent in 1998.
Figure 8. DPT3 Coverage 1995-1998
National Average of the Percent
Coverage of DPT3 1995-1998
81.56
85.2
71.28
62.6
0
20
40
60
80
100
1995 1996 1997 1998
Year
Percent
Coverage

34 Decentralization of the Health System in Zambia
Figure 9 shows that this decline occurred more significantly in poorer districts and that the gap
between the wealthiest and the poorest is growing. Similar trends exist with regard to urbanization and
population with the most rural and the smallest districts showing greater declines in coverage (also see
Annex A, Tables 65-68).
Figure 9. Immunization Coverage of DPT3
A similar trend was discovered for the third dose of the polio vaccine despite the fact that there were
national campaigns against polio in 1997 and 1998. Slightly different trends were found for measles. The
gap between highest and lowest income was greatest in 1996, but by 1998, better equity had returned. A
similar trend also occurred for urbanity and population (see Annex A, Tables 69-72). However, this
phenomenon cannot be clearly attributed to decentralization. Several studies have attempted to determine
the causes of this decline with a variety of possible explanations, including cold chain maintenance,
possible disruption in donor funding for supplies, and inadequate reporting indicators for supplies
(Feilden and Nielsen, 1998; Bates, forthcoming). This issue should be investigated in depth.
3.4.3 Conclusion Regarding Performance
There has been relatively little impact of either decentralization or the decline in real expenditures per
capita on the utilization rate for outpatient services. A significant decline in immunization rates has
occurred, and for some vaccines this decline has had a greater impact on the poorest, most rural and
lowest population districts. It is not clear what caused this decline since, at the time of the study, there
was a disruption in donor support and there was a decline in per capita real expenditures.
Percent Immunization Coverage of
DPT3: 5th/1st Quintile Ratio
0
0.5
1
1.5
2
1995 1996 1997 1998
Year
Ratio
Population
Quintiles
Income Quintiles
Urbanization
Quintiles

4. Field Case Studies of Nine Districts 35
4. Field Case Studies of Nine Districts
4.1 Introduction
This section reports on the nine district case studies and is based on research conducted by the
Zambian team and presented in an initial report by Maryse Simonet. It presents the methodology and
findings of both quantitative and qualitative analysis of the districts that were selected to gain a more in-
depth assessment of decision space, decision processes, innovations, and performance at the district
levels.
The case studies analyzed the local allocation decisions and the performance of the local systems in
more depth than in the national level analysis. Researchers were able to assess some of the processes of
making local decisions: the role and activities of various means of community participation, the role of
DHMTs, how much they respected central guidelines, and the innovative decisions they made.
Researchers then tried to relate the differences in processes to local characteristics. They were also able
to assess a more detailed range of decision space than they had defined in the national level analysis,
including issues about human resources, debt, types of service available, and other elements in the
decision space map presented in Section 2.
In addition, researchers assessed performance using the perceptions of those interviewed as well as
additional data available at the local level. As in the previous assessment, researchers attempted to
determine how different local conditions might shape these decisions and the performance. First, they
assessed the national level data for the selected cases and then they added additional information collected
in the districts to assess other local characteristics that might have an effect on decisions and performance.
How the districts were selected for the case studies is discussed in the following section.
4.1.1 Selection of Districts for the Case Studies
This study included nine districts. Using the initially limited data available at the health center, eight
paired cases were selected. The ninth was used to pretest the data collection instruments. The district
selection was made based on data and interviews with experienced officials of the MOH who were
involved in the design and implementation of the management information system and the financing
system. Selection was based on initial and partial national level data and on the perceived reputation of
the districts. An attempt was made to pair the districts to control some contextual factors such as the
presence of a district hospital, levels of expenditures per capita, percentage allocations to primary health
care, and reputations for performance. The focus was on “average” districts, therefore highly urbanized
districts with special conditions, like Lusaka, were excluded. The initial criteria did not hold after the final
data were collected, so researchers abandoned the attempt to analyze the sample by paired districts;
however, the sample still held sufficient numbers of cases to examine some of these issues, as will be
discussed below.
The following description of the sample ranks the districts according to population, urbanization,
income, and per capita budgetary grants and will be used in the analysis of the relationship of local

36 Decentralization of the Health System in Zambia
characteristics to allocation and performance. These are characteristics that researchers considered to be
beyond the control of the local decision makers.
4.1.1.1 Population Size
Using national level data that were available for eight of the nine districts (all except Siavonga), Table
11 shows the rankings of the districts and the national average for all districts for population size. The
table shows that five of the sample districts were below the national average, however, only one was
below the mode. The mode is the middle district in the sample ranked from small to large while the
national average is skewed by the large population in Lusaka. These figures suggest that the sample is
somewhat biased toward the larger of the middle range of districts. Even in this case, the largest district
was 2.7 times larger than the smallest.
Table 11. Sample Districts by Population Size
1996 Population
Districts
Chinsali 108,049
Kaoma 136,439
Isoka 146,261
Solwezi 149,014
Mumbwa 152,285
Katete 162,859
Mongu 167,185
Petauke 273,932
National Average 153,478
Mode 131,876
4.1.1.2 Degree of Urbanization
Using the LCMS data on urbanization, the study ranked the districts according to the percentage of
the district population that resided in urban areas. Table 12 shows that six of the districts were below the
national average; however, only four were below the mode, suggesting that the sample was representative
of the middle range of districts.
Table 12. Sample Districts by Degree of Urbanization
1996 Urbanization (%)
Districts
Petauke 4.74
Katete 5.35
Chinsali 6.85
Isoka 6.98
Kaoma 12.84

4. Field Case Studies of Nine Districts 37
Mumbwa 15.50
Mongu 23.87
Solwezi 26.93
National Average 23.54
Mode 9.80
4.1.1.3 Average Household Income
The sample had a range of average household income based on the 1996 LCMS survey (Siavonga
was not sampled in the LCMS). With five districts under the national average and four districts under the
mode, this again suggested that the sample was representative of the middle range of districts ranked by
income (see Table 13).
Table 13. Sample Districts by Average Household Income
1996 Income
Districts
Chinsali 12,355.71
Mongu 16,360.07
Kaoma 20,152.21
Petauke 27,692.24
Isoka 30,475.06
Solwezi 49,559.11
Katete 59,482.02
Mumbwa 60,681.63
National Average 51,219.49
Mode 28,731.06
4.1.1.4 Per Capita Grants
The central authorities make decisions to provide grant funding to the districts. Table 14 ranks the
sample districts according to the grants per capita that they receive. It shows that only three districts were
below the national average or the mode, biasing the sample toward the districts with greater per capita
grants. The most advantaged district received almost two times as much per capita as the least
advantaged.
Table 14. Sample Districts Ranked by Per Capita Grants
1998 Grants/capita
Districts
Mumbwa 1380.1
Isoka 1563.0
Petauke 1737.7

38 Decentralization of the Health System in Zambia
Kaoma 2102.3
Mongu 2142.8
Chinsali 2174.7
Solwezi 2175.0
Katete 2597.5
National Average 1855.7
Mode 1,844.6
4.1.1.5 District Hospitals
The sample also included six districts with direct responsibility for district hospitals (Kaoma, Petauke,
Chinsali, Siavonga, Mumbwa, and Isoka) and three that had no district hospital (Katete, Mongu, and
Solwezi). These districts were expected to contract for first-level hospital care at secondary and tertiary
care hospitals that were located in their districts but received their major funding directly from the MOH.
4.1.2 Methodology of Qualitative Study
This component of the study was aimed at assessing perceptions on decision space and changes in
performance associated with decentralization.
Open-ended interviews were conducted with the three top managers of the district health team and
with at least two of the DHB’s most experienced members. Interviews were also conducted at one health
center level, with the head of the health center and the neighborhood or facility committee. Given the time
constraints, interviewers had to be able to access the health center relatively easily.
Two interviewers were trained using draft interview questions, guidelines on conducting open-ended
interviews, and the expanded decision-space framework. Interviewers prepared their own list of questions
and drew on this to develop their topic list. The topic list was used during the interview process to record
the topics covered. Interviews were tape recorded but were not transcribed (interview summary sheets
written on a daily basis after each interview summarized the main findings). Tapes were used to retrieve
quotes and as a support to memory. However, of the 27 tapes sent to Harvard by the interviewers to date,
only 16 were of sufficient recording quality to be transcribed. Two tapes, one from each interviewer, were
transcribed to compare transcripts with interview summary sheets. The quality of reporting in the
interview summary sheets was good, although this exercise should be repeated with the remaining tapes.
Interviewers had different styles: one was relatively directive following the topics in the pre-established
order; the other was more open with a brief presentation of the topics of interest and few interventions
during responses, except when seeking practical examples of respondents’ statements. Only one
interviewer provided notes with reflections on the information collected.
Within each district the sampling of interviewees was intended to include respondents who had
sufficient exposure to the reforms in the district so they could answer questions regarding changes in
performance. Therefore, some former board members or former directors of health were also interviewed.
Table 15 reveals the background, or experience, of those interviewed according to district.

4. Field Case Studies of Nine Districts 39
Table 15. List of Interviewees by District
District
DHMT
(# of interviews) head MPD MHR MA other
Isoka (8) 2 1 1
Kaoma (4) 1 1
Petauke (6) 1 1
acting
(HIO)
1
Solwezi (8)
1
actin
g
1
acting
1 acting
Mongu (~7) 1 1 1 1 inspector (former plng dev)
Siavonga (?) 1 1
Katete (8) 1 1
acting
1 acting 1 CBD manager
Chinsali (5) 1
1for
mer
1
Mumbwa (10) 2 1 1 HIO officer
1 clinical officer at hospital
District DHB RHC
(# of interviews) Chair Vice
chair
member RHC
head
FC NHC
Isoka (8) 1 1 1 1 chair
Kaoma (4) 1 former 1 vice chair
Petauke (6) 1 former 1 1
Solwezi (8) 1 former 1 former 1 (former?) 1 1 chair
Mongu (~7) 1 former 1 3 joint
interview
Siavonga (?) 1
Katete (8) 1 1 1 Chair FC &
NHC
Chinsali (5) 1 former 1 mission
RHC
Mumbwa (10) 1 2
1 nurse
not head
1
DHB: District Health Board
DHMT: District Health Team
MA: manager administration; MHR: manager human resources, MPD: Manager Planning and Development
HIO: health Information officer, CBD: community based program, FC: facility committee, NHC: Neighborhood Health Committee.
RHC: Rural Health Center

40 Decentralization of the Health System in Zambia
4.1.3 Methodology of Quantitative Data Collection at District Level
A nurse who had worked on district health information systems since 1992 collected the quantitative
data for the sample districts. Data availability at district levels was unknown initially. Thus the strategy
for data collection was relatively flexible, starting with readily available information to end with
uncompiled data. Recent data were collected first, then the researcher looked for data on previous years as
far as was available. Only raw data were collected because problems with population figures were
anticipated; this allowed researchers to recalculate indicators with a consistent approach. The source and
quality of data were systematically reported. Data mainly came from old reports sent to provincial offices,
previous action plans, personnel registers, and facility reports.
Data collected cover performance indicators and district revenues. Expenditure data were not
collected given their availability at the center. Information on changes in the information system
(including target population) and in the district data collection method was systematically requested.
Personnel data were collected by the level of the health system and by source of funding with respect to
salaries. For the analysis, the numerous categories of health workers were grouped as follows:
> Medical doctors
> Qualified employees – all workers with a qualification in health services delivery (enrolled,
registered, or family health nurses; environmental health technicians; laboratory assistants; etc).
This group, sometimes referred to as “nurses,” is composed of civil servants.
> Classified employees – all employees who are involved in support services or in service delivery
but have no medical or health-related training (accountants, store personnel, and casual workers).
These are not civil servants, and they were retrenched from the MOH payroll in 1998.
Data collection took place between September 21 and November 30, 1998, with two to four days
spent in each district. Interviews conducted in each district are listed in Table 15 above. The number of
interviews conducted varies between four and 10, with the decision of how many to conduct left at the
discretion of the research team. The criterion for conducting additional interviews was to obtain at least
three different points of view on the topics explored (more in case of contradictions), and local logistical
conditions were also a consideration.
Health system output indicators were generally available for more than three years, with one or two
data points over 1993-1995 and at least two data points over 1996-1998. Data for 1998 or 1997 were
sometimes missing due to the introduction of the HMIS. Some early data (1992-1995) were found in
about half of the districts for each indicator. Petauke had poor data with respect to reproductive health and
use of services; Siavonga had poor data with respect to use of services. Isoka and Solwezi consistently
provided a wide range of data overtime, even more complete than Kaoma and Mongu, contrary to
expectations. Similarly, no data on classified health workers and community level health workers were
collected in Mongu. Given the data collection strategy, this suggests that data were not available in a
ready-for-use format.
There were some discrepancies in data collected at the local level and similar categories at the
national level data; this was particularly problematical with the data on population bases, which in some
cases changed rankings of per capita data. This study used the CBOH data on financing to keep the
analysis consistent with the national level data analysis. However, district level population estimates were
used for service utilization and other performance data because they appeared to be more consistent with
the data collected and were used in action plans. CBOH should establish a uniform and reliable set of
population estimates so that both central and district levels are working on the same assumptions.

4. Field Case Studies of Nine Districts 41
4.2 Decision Space Analysis, Innovation, and the Process of Making
Decisions and Priority Setting at the District Level
The local decision makers of the DHMT, the DHBs, and the neighborhood and facility committees in
the nine districts all worked within the formal decision space map described in Section 2. Although
researchers would have liked to compare the decision space before and after decentralization, the
interviewees were either not able or not willing to make reliable statements about past events. Therefore,
researchers focused this analysis on current perceptions of how much the local decision makers adhered
to the formal decision space and how they perceived their roles in areas that lacked clarity in the formal
rules.
The decision space map presents a brief discussion of “governance” or the ability of local decision
makers to make choices about who participates in the process of decision making and how that process is
structured. In the Zambian process, the general rules of governance are fairly narrowly defined by the
central authorities in the National Health Services Act of 1995 and in the guidelines set out by the CBOH.
The case study interviews offered an idea of how the local districts follow the national guidelines and
how they vary from each other.
The central decision maker in the district is the DHMT, but the DHMT should involve the local
community in the decision-making process. The DHMT is supposed to first form the DHB, usually made
up of between four and 10 local community members. The boards were to be proposed by the districts
and approved by the MOH. This occurred in all the districts; however, the central authorities did not
clearly define who should be selected, nor did they determine whether selection should involve any voting
procedures. Therefore, in this sample there was some variety as to who was selected and how they were
selected.
The interviews consistently showed that district teams played a crucial role in identifying possible
candidates, sometimes with the support of the hospital or local councils. Interviewees mentioned that
some type of electoral process was used to elect members, either at the initial stage of the members’
selection or later in the process. In the initial selection process, the population of voters was not clearly
identified but likely to be drawn from rural facility committees or the local urban elite. With respect to the
chair and vice chair, when there were several candidates for these positions, board members selected them
using a secret ballot.
Members were usually drawn from the local urban elite, which included teachers, farmers, and
businessmen. However, board composition often included some residents of rural areas. Most of the
boards did not appear to include representatives of the local government, but the boards appeared to have
been formed prior to the distribution of guidelines that contained this criterion. There was no systematic
attempt to represent users by type of services, geographical area, or sociodemographic characteristics
(type of health needs) through an electoral process. Women were barely represented—at best, there were
two to four female members. Katete had the only board chaired by a woman, and she was a replacement
for the initial chairman who had moved out of the district. In some cases, the local elite were particularly
active; for instance, the board of Isoka admitted two local members of the parliament as nonvoting
members, and in Siavonga the board members were very active but did not accept allowances.
The center has imposed its will in several cases by dissolving the boards. In three districts (Mongu,
Solwezi, and Petauke), the boards were dissolved by order of the MOH, often with no clear reason given.
However, in cases where the Ministry has not taken action, some boards have met without being
appointed (Chinsali) and others continue to meet after their term has expired (Katete).

42 Decentralization of the Health System in Zambia
At the community level, spot checks conducted in each district indicated the existence of functioning
health center committees that had variable relationships with NHCs. In Isoka, NHCs and facility
committees are the same entities, whereas in Mumbwa, each group of 200 households forms an NHC
whose relationship with the facility committee is unclear. The selection process is vaguely described. As
for selecting board members, there is a mixture of approaches. On the one hand, there is a tendency to
select wealthy educated people, and on the other hand, there is a search for members who represent the
geographic and socioeconomic characteristics of users.
As reported in other studies (Choongo and Milimo 1997), many of the NHCs were formed in the
absence of clear guidelines. Decisions seem to reflect the DHMTs’ understanding of the process of
participation at the community level as illustrated in Isoka and Mumbwa. However, since DHMTs did not
provide a clear description of the selection process, further room for interpretation was available for
health workers and communities. DHMTs did not provide information reflecting clear guidelines on the
selection process. Criteria and responsibility for the initial selection of acceptable candidates (health
workers or community or traditional authorities) were not clearly specified. “Voting,” when applicable,
was not qualified in terms of eligibility to vote and voting procedures.
The lack of clear guidelines at the district office for member selection process is a problem for the
initially established NHCs (e.g., Isoka) and newly formed NHCs (e.g., Mumbwa). The latter would follow
central recommendations—for example, the equal representation of women and men—but the selection
process was not detailed by DHMTs. Mumbwa also was innovative in that it had the sole area health
board of all the districts visited, and this area health board covers the target population of the mission
hospital.
4.2.1 District Board and Community Committee Participation in
Decision Making
The central objective of community participation on the boards was to have local accountability for
key priority setting and for personnel decisions after delinkage. It appears that the boards also were
understood to have a role in mobilizing additional local resources for the health sector, although this was
not clearly stated in documents. With such multiple tasks and roles, boards in different districts appeared
to have emphasized different roles.
The district of Katete offers an example of a board focused on revenue generation. This board reviews
action plans but does not seem to seek access to decisions regarding resource allocations or to play an
advocacy role for a particular structure or segment of the population. The board runs a canteen, a local
innovation generating revenues for health. It also contributes the expertise of its members when requested
with respect to management and accounting. Similarly, the board in Siavonga appears to contribute many
resources, but these are mainly for the hospital and in kind. Contributions include the adoption of hospital
wards by individuals who donate nonmedical equipment and the members’ voluntary participation at
meetings. A similar pattern was found in Mumbwa where board and DHMT members all belong to the
District Lyons Club. Fundraising activities for rural areas were mentioned once, but most of the efforts
and attention concern the hospital. A particular aspect of interest is that members of the board in
Mumbwa include stakeholders, not in terms of health needs or services to the population but in terms of a
stake in the health business. One member runs the mission hospital, another is a private pharmacist. It is
not clear whether the expertise of these members or their stakes in the health business drove the selection
process.
By contrast, the board in Solwezi took a more active role as managers of the system and advocates for
the community. Each member was assigned the responsibility to supervise some health centers in his or

4. Field Case Studies of Nine Districts 43
her neighborhood. These members provided examples of their roles as advocates for rural health centers
during the planning process or the regular functioning of the district. They helped deliver drugs, wrote
reports on perceived problems at the facility level, and presented their findings during board meetings.
Board members explained their role in terms of reminding the district team of needs at the rural health
center level. However, the lack of guidance regarding board mandates probably explains the development
of a climate of suspicion between the DHMT and the board. When drug shortages were observed in the
facilities, the board decided to suspend the payment of allowances, but this was beyond its scope of
authority as understood by district teams. As a result of such decisions, the initially promising partnership
seems to have turned into an inefficient game of mutual surveillance. This experience is, however, the
closest illustration available of a “representative” board exerting some systematic advocacy role for rural
areas.
At the community level, the NHCs and the facility committees appear to be used as anticipated by the
central guidelines, that is, to approve fee increases and conduct initial discussions on local priorities.
Community committees also seem to be involved in approvals of expenditures from user fee revenues.
Districts were expected to involve community representatives (NHCs, facility committees, and boards) in
decisions regarding the level of fees. In all districts, it appears that NHC and facility committee
consultations happen prior to fee hikes. In Katete, the district team reported that fees applied in the district
were the average of the different fee levels suggested by communities. In all districts, fee hikes were
initiated by DHMTs, approved by community representatives, and then submitted to the CBOH. But in
Katete, fees were raised prior to central approval because the team felt supported by the community and
could not obtain a rapid response from the CBOH.
Consultations seem to allow for effective popular participation (beyond gaining the required
signatures), as several instances of postponed fee hikes involved popular discontent. In general, these
consultations refer to unit prices and not to the total yield expected or budgeted.
However, community committees are not involved in planning or in resource allocation after
budgetary cuts. Budget cuts appear after the consolidation of facility action plans at the district level, at
the level of approval by the CBOH, and throughout the year due to grant erratic payments. Much of the
decisions as to where to spend grant funds among the initially planned activities appear to be in the hands
of the facility personnel. However, DHMTs have some authority over facility personnel. There is little
communication between the community committees and the DHB so this avenue of advocacy and
accountability is limited.
During 1995-1998, the decision space on human resources was quite limited as districts had no
authority over promotions, bonus distributions, and firing/hiring decisions. District boards usually
emphasized their contribution to personnel management in spite of complaints regarding their limited
formal authority. Some perceived their mandate as ensuring that district teams effectively disciplined
health workers; others did exert some control directly over personnel. Some NHCs also reported
interventions similar to that of district boards. These actions mainly consisted of engaging in discussions
with health workers whose attitudes towards patient or the use of district resources was not satisfactory.
In general, district teams handled problems that were due to staff misuse of user fee revenues, whereas the
local committees handled cases involving staff attitudes towards patients.
It was clear from the interviews that the boards and community committees do play a marginal but
specific role in the decision-making process. Their central role has to do with mobilizing resources from
the community—both as active boards that participate in fundraising through nonmedical services and as
participants in decisions to raise local medial fees. Their role in advocacy and management of the system
is limited unless, as in Solwezi, they take an initiative to be advocates for rural areas. Their role in

44 Decentralization of the Health System in Zambia
personnel decisions—which had been anticipated to be large with the proposed delinkage that did not
actually occur except for the nonprofessional personnel—did not materialize.
4.2.2 The Process of Local Decision Making
Local authorities made decisions in a process that started with the development of action plans that
laid out the district planned activities and proposed budgets. Through the interviews, it was discovered
that the action plans began with the boards’ and the committees’ priorities according to central guidelines.
These plans were then developed by the DHMT using central guidelines and “assumptions.” Then the
district boards, NHCs, and facility committees reviewed the action plans. The heads of the health centers
appeared to have participated in workshops where they consolidated the health centers’ and hospitals’
plans into a single district action plan. Priorities were set as recommended in guidelines with respect to
priority interventions (taking into account disease patterns, central priorities, feasibility, potential benefits,
and other issues). The action plans were then sent to the CBOH for final approval. In the cases the
researchers reviewed, it appears that the general guidelines were respected and the action plans were
approved by the CBOH.
The districts were then required to submit their expenditure reports quarterly to the CBOH, and they
were sanctioned if the reports were missing or if they did not clearly justify expenditures that did not fit
the CBOH guidelines. The sanctions were simply that the CBOH did not release the next tranche of
budgetary funds. In most cases these funds were supplied later in the year when the full reports were
completed, and the research data show that districts reporting such sanctions were not necessarily
receiving less funds on an annual basis.
The national budgetary process was not without its own vagaries, however, and the weakness of the
general revenue collection usually meant that budgets were cut periodically throughout the year. The
overall effect of budget cuts is significant, as Table 16 shows.
Table 16. Actual Grant Budgetary Transfers as Percentage of Action Plan Budget
% Grant Funded 1994 1995 1996 1997 1998
Kaoma 64% 63%
Mongu 79% 71% 114% 58% 54%
Solwezi 53% 40% 73% 56%
Katete 17% 50% 67% 75%
Isoka 57% 63%
Siavonga 56%
Petauke 24% 75% 81%
Chinsali 58%
Mumbwa 15% 34% 60% 53%
Source: District Data
With periodic budget cuts, it is inevitable that the priorities and budgets established in the action plans
would have to be revised throughout the year. This is usually done by the DHMT, which does not consult
with the local boards and committees and seldom with the CBOH in any formal process. Budget cuts lead
to reallocations of resources that are not discussed with board members. In practical terms, erratic and late
payments do not match with the schedule of board meetings. Quarterly board meetings do not allow for

4. Field Case Studies of Nine Districts 45
the board’s participation in such decisions. All decisions on actual expenditures are made by the DHMT
as soon as grant funds are available. The decisions appeared to remain within the action plan; however,
the reprioritization is entirely under the control of the DHMT. For some DHMTs, the costs of board
meetings, reflected in allowances spent at the district level office, may also deter them from organizing ad
hoc meetings (as was suggested in some interviews).
This means that the local authorities mainly made decisions about the health care system during at
least two periods: once during the formal planning process of the action plans and later during the periods
of budget cutting. They also had to cope with late payments of the central budgetary transfers, which
meant they often had to delay payments or borrow from local sources for periods of two to three months.
When grant funds were received, the funds were immediately distributed and did not follow a rational
planning process.
To respect the percentages recommended in the CBOH guidelines, districts distributed funds as soon
as they were received. This approach is similar to budget cuts across programs and levels, and it indicates
the lack of policy choice at the district level. Still some budget lines suffered more than others: costly
activities were suppressed, especially those calling for some investments. Allocations to health centers
appeared to have been based on population target areas according to the interviews.
4.2.3 Decisions at the Local Level
The following analysis follows the functional areas of financing, service delivery, and human
resources, and some of their subfunctions, as presented in the framework of the decision space analysis
(see Section 1).
4.2.3.1 Financing
Sources of Revenue. According to the formal decision space allotted, districts had extremely limited
choices in providing additional sources of revenue, but they were allowed to make some choices about
expenditures and fees.
The districts attempted to add to their revenue stream; however, the funds were quite limited in
relation to the budgetary transfers and user fees. The districts tried a variety of mechanisms to generate
more revenue, including the following:
> Requesting support from the presidential fund through political representatives; in one district
this resulted in a promise to provide an ambulance.
> Submitting proposals for training or infrastructure developments to donor programs in poverty
alleviation and other general development activities.
> Obtaining community contributions at the facility or board level. Interviews provided numerous
examples of household contributions, usually related to infrastructure at the health center or
hospital levels with in-kind or cash payments. The contributions of district boards were usually
for equipment and infrastructure for hospitals.
> Generating revenue for nonmedical services. Activities included small shops selling drinks and
other items needed by hospital patients and visitors; recovering costs on the public’s use of copy,
fax, and telephone services; and charging for inspections of trading premises and food, use of
canteens nearby or within the hospital premises, or use of rented vehicles or offices. These

46 Decentralization of the Health System in Zambia
revenues are to be reported as other sources of revenues, separate from user-fee collections.
A second strategy for coping with revenue problems from the central budgetary transfers is to go into
debt. Debt is generally low, with the exception of Siavonga, and data are limited since debts, with the
exception of Isoka, were not reported before 1998, and even then not all districts reported that
information. Table 17 indicates the percentage of debt with respect to total expenditures for 1997 and
1998, where available.
Table 17. Sample Districts: Debt as Percentage of Total Health Expenditures
Districts 1997 1998
Mongu 1.20%
Solwezi 5.06%
Katete 1.80%
Isoka 4.19% 0.21%
Siavonga 46.60%
Petauke 4.07%
Source: District Data
One mechanism for incurring debt is to delay payments of personnel allowances. Payments are often
delayed since the amounts to be paid would exceed the ceilings in the guidelines.
Overall, the revenue source decision space remains limited due to the districts’ reliance on central
grants and the scarcity of economic opportunities locally. A main incentive for such informal practices,
such as going into debt or limiting entitlements, seems to be the pervasive delays and cuts in central
budgetary funding.
Expenditure Choices. The districts were limited in two ways by the central guidelines on
expenditures. There were ranges of choice allowed in allocations to different levels of service and to
different traditional expenditure categories (personnel, transportation, drugs, and capital). (See Tables 7
and 9 in Section 3.) Districts were allowed to violate the guidelines, but they had to provide a good
justification to the CBOH or they risked having their funding suspended. In terms of the decision space
analysis, the guidelines were “soft” in that they allowed for some exceptions but could not be violated
without justification.
As mentioned in the analysis of all districts detailed in Section 3, researchers found in the case study
sample that the guidelines for levels of service were systematically violated in terms of the allocations.
District offices almost always allocated more than the 15 percent maximum and health centers
systematically received less than the 45 percent minimum (as shown in Table 18). Although the
community far exceeded the 5 percent maximum in 1996, by 1998 only three of the eight districts
exceeded the maximum. Although hospital spending in general remained in the acceptable range, Katete
and Mongu were far below the minimum.

4. Field Case Studies of Nine Districts 47
Table 18. Sample Districts: Allocation of Expenditures to Levels of Service by Percent of Total
Expenditure
1996 THE/cap District
Offices
District Hosp Health
Centers
Community
Districts
Mumbwa 1,890.22 19.9% 37.4% 35.5% 7.1%
Chinsali 2,023.44 16.2% 38.1% 32.4% 13.3%
Isoka 1,133.06 13.1% 34.7% 34.0% 18.2%
Solwezi 1,379.05 18.8% 15.7% 45.4% 20.1%
Katete 1,029.34 37.1% 0.0% 44.0% 18.9%
Petauke 1,380.10 18.4% 35.5% 31.2% 15.0%
Kaoma 1,878.00 16.0% 33.3% 18.9% 31.9%
Mongu 1,517.16 29.0% 9.5% 47.4% 14.1%
Nat’l Average 1,769.93 20.8% 22.5% 38.0% 18.6%
1998 THE/cap District
Offices
District Hosp Health
Centers
Community
Districts
Mumbwa 1,634.74 13.6% 37.2% 44.7% 4.5%
Chinsali 2,408.60 14.7% 33.5% 40.8% 11.0%
Isoka 1,624.95 25.7% 34.1% 31.2% 9.0%
Solwezi 2,180.10 20.6% 8.0% 65.5% 5.9%
Katete 2,371.27 41.0% 12.9% 45.8% 0.4%
Petauke 2,016.15 23.3% 38.8% 36.0% 1.9%
Kaoma 2,332.52 20.4% 36.0% 37.4% 6.2%
Mongu 2,392.82 28.7% 14.7% 56.6% 0.0%
Nat’l Average 2,114.26 22.6% 22.9% 51.6% 2.9%
Source: Government of Zambia
It appears that there was an informal agreement to account for nationally sponsored “National
Immunization Days” activities at the community level, which may explain why the 1996 figures for
community spending were so high.
The national level data showed that spending on hospitals in the wealthiest and most urban districts
was significantly lower than in other districts. It was surmised that this was probably due to the presence
of second- and third-level hospitals in these districts. In the sample study, the districts of Katete, Mungu,
and Solwezi were consistently low spenders on hospitals. These three districts did not have district
hospitals, and this seemed to provide more of an explanation for the low spending than population,
urbanity, and income, which all varied among these districts. This sample suggests that having a
requirement that districts contract for first-level hospital care if they do not have their own hospital is not
sufficient to force the districts to allocate resources for hospital care. Districts without their own hospital
did not allocate sufficient funding (according to guidelines) to cover this care, so it is likely that other
districts or other sources are providing the funding for the hospital care in these districts. While this

48 Decentralization of the Health System in Zambia
saving allows some districts to allocate more to primary care (as in Solwezi and Mongu) and district
offices (as in Katete), it contributes to inequities in allocation across districts.
As Table 19 indicates, Katete was consistently high in personnel expenditures and Petauke was
consistently low. In 1996, Ksoka was an outlier in drugs but came in line in 1998 (see Annex A, Figure
14, for trends).
Table 19. Sample Districts: Allocation According to Traditional Expenditure Categories
1996
Personnel
Costs (%)
Drugs and
Supplies(%)
Drugs
only (%)
Fuel(%) Transport(%)
Other
Costs(%)
Capital
Costs(%)
Districts
Mumbwa 24.3 17.0 3.9 11.5 27.4 25.6 5.7
Chinsali 20.6 33.2 3.0 10.0 23.5 14.7 8.1
Isoka 21.4 47.6 2.0 13.0 19.9 8.5 2.6
Solwezi 22.4 32.7 .20 7.2 21.2 19.6 4.0
Katete 24.9 25.9 0.0 11.4 26.8 15.6 6.9
Petauke 17.3 28.2 0.77 9.8 21.2 22.9 10.5
Kaoma 19.4 32.1 5.8 11.7 21.8 25.6 1.1
Mongu 23.1 26.2 0.70 12.5 19.2 27.0 4.1
National
Average
22.4 29.3 1.8 12.7 24.1 18.5 5.8
1998 Personnel
Costs(%)
Drugs and
Supplies(%)
Drugs
only (%)
Fuel(%) Transport(%) Other
Costs(%)
Capital
Costs(%)
Districts
Mumbwa 21.4 24.8 0.32 12.3 23.7 25.3 4.8
Chinsali 23.3 25.8 1.3 14.0 20.9 25.5 4.6
Isoka 26.8 27.2 1.6 9.9 18.5 17.3 10.2
Solwezi 21.4 22.9 2.9 6.3 17.3 36.4 2.0
Katete 30.4 22.5 2.1 8.9 17.6 16.5 13.1
Petauke 11.6 25.0 2.2 6.5 13.3 48.7 1.4
Kaoma 23.3 20.2 1.9 7.6 15.4 41.0 0.1
Mongu 19.2 23.0 2.4 9.3 18.0 33.0 6.8
National
Average
24.0 25.6 1.9 11.6 21.0 24.5 4.9
Source: Government of Zambia
Personnel expenditures included allowances, some salaries paid by districts since 1998 (1996 for
Petauke), and expenditures on personnel housing, which may not have been accounted as allowances. To
examine compliance with guidelines on the percentage of expenditures allocated to allowances only, data
on allowance costs were collected at the district level, where available. The percentages of expenditures
allocated to personnel allowances were calculated using the total amount paid on allowances (including
those outstanding) collected at the district level and on national level data concerning expenditures. For
1998, the percentages spent respected the central guideline ceiling of 15 percent for the following districts

4. Field Case Studies of Nine Districts 49
that had data available: Solwezi, 15 percent; Katete, 13 percent; Petauke, 2 percent. Limited data were
available for 1997: Katete spent 4 percent on allowances in 1997; Petauke spent 1 and 2 percent in 1996
and 1997, respectively; and Solwezi spent 5 percent for both years.
The districts appeared to have respected the ceiling, although only partial data were available to
confirm this. As of 1999 however, the costs of allowances appeared much higher in some districts. During
the first semester of 1999, Petauke spent twice the amount it had spent for the entire previous year. In
Solwezi, there appeared to be no change. This reflects the DHMT’s decision not to apply the new
allowance rates. Allowances did not seem to increase in Katete either; interviewees reported that the
DHMT had supervised the health centers only once in the semester. The explanation given was that the
DHMT was waiting for the new supervision guidelines produced by the CBOH.
A preliminary conclusion would be that districts vary in their ability to restrain allowances within the
range of central guidelines.
Total expenditures for personnel were not subject to guidelines that focus only on allowances.
Allocations to personnel, as a percentage of expenditures, diverged overtime with a steady increase in
Katete and Isoka over 1996 to 1998 (see Annex A, Figure 13). Prior to 1998, most personnel costs
comprised allowances and perhaps housing rentals and training costs. In 1998, the salaries of
nonprofessional classified employees were to be paid by districts. Petauke is an exception as its classified
employees were delinked as early as 1996.
In 1998, most districts did not experience a dramatic increase over 1997 personnel expenditures as
might have been expected when the districts took over responsibility for the “delinked,” nonprofessional
“classified” employees. The percentages spent on personnel ranged from 12 to 30 percent, proving that
the delinkage of these employees did not translate into increased personnel costs. In fact, personnel costs
declined in constant terms over 1997-1998 for Solwezi (18 classified employees de-linked between 1997
and 1998) and Mumbwa (with 55 salaries added to district expenditures between 1997 and 1999).
For some districts, the delinkage occurred in the middle of 1998. Even if many health centers reported
recently using user fees to pay the salary of classified employees, these expenditures should have
appeared in the personnel expenditures that were reported. Perhaps the low salaries of classified
employees (approximately 70,000 Kwacha per month, according to interviewees – equivalent to the night
allowance of a classified employee in 1999) explain part of this puzzle. Alternatively, training costs, if
included in personnel costs, disappeared in 1998 due to a ban on training. This ban affected training
sessions organized for qualified personnel, thereby freeing resources for the salaries of classified
employees.
Fuel expenditures followed the maximum allowed (15 percent of total health expenditures) except for
Mumbwa (31 percent) in 1995 and Siavonga (18 percent) in 1996. Overall, the districts respected the
guidelines and the allocations did not change much from 1996-1998. Over the period of 1997-1998,
Petauke and Isoka spent the least per capita in constant Kwacha whereas Mumbwa and Chinsali spent the
most. Amounts spent per capita tended to decline over 1997-1998.
Drug expenditures in the sample, as with the national data, generally remained within the maximum
allowed of 4 percent, although there were several periods in which one or two districts exceeded the
guidelines. By 1998 all districts were within the guidelines (see Annex A, Figure 14). The reduced
availability of additional sources of supplies (Dutch cooperation in Kaoma and Mongu and Zambian
Flying Doctors in Isoka and Solwezi) did not appear to translate into higher drug expenditures. Districts
such as Katete, Chinsali, and Petauke that were able to exchange drugs with mission facilities did not

50 Decentralization of the Health System in Zambia
appear to have systematically lower expenditures on drugs (in percentage or in nominal values per capita).
Indeed, the data did not allow for isolating the effect of consumption patterns and central deliveries.
No systematic data were available with respect to central drug supplies and consumption. However,
spot checks indicated variable responses to districts’ requests for drugs. In Chinsali, Mumbwa, and
Solwezi, the examination of delivery orders showed that districts’ orders were only partially honored for
selected basic drugs such as chloroquine, paracetamol, and cotrimoxazole, but contraceptives were
supplied in the quantity requested. Conversely, Kaoma often received more than it ordered from the
central stores, and it had some stocks of excess drugs to use in 1999. Kaoma is among the highest spender
on drugs in terms of percentage of expenditures allocated and per capita expenditures in 1995 constant
Kwacha. Interviewees reported that the DHMT strategy is to stock drugs as a buffer for potential future
shortages. Therefore, this pattern of expenditures in Kaoma seems to reflect a deliberate choice to spend
more than needed on drugs in the short run and the availability of additional funds through Dutch
technical assistance.
In all districts except Solwezi, drugs received were not systematically costed by the central stores.
Each district is allocated a grant tied to drugs that is managed at the center. Drugs are sent as kits (push
system) for health centers and community health workers. Drugs are also ordered as needed for district
hospitals and to supplement kits (pull system). The interviews revealed that orders for kits are often
placed at the time the kits are delivered, since districts do not have control on the number of kits they
receive. Information on how the “pull system” (responding to district orders) worked was limited. The
lack of information on drug costs limits the districts’ ability to forecast the remaining amounts available
in the central district account for drugs. In turn this may have affected their ability to plan expenditures
for emergency drug purchases.
If drugs are supplied in smaller quantities than ordered and supplies are hardly predictable, then the
districts’ failure to comply with guideline ceilings may not be deliberate. The CBOH may regard
overspending in this category as justifiable. As in the case of the delinked nonprofessional personnel, the
guidelines reflect a mismatch between responsibilities at the district level and the guidelines and total
allocations given from the center.
Central guidelines limit expenditures for capital investments to 15 percent of expenditures. In 1995,
all districts (except Solwezi at 6 percent) began with a small expenditure allocation that was below 2.5
percent. But the districts’ allocations to capital diverged over time with an overall average increase from
1995 to 1997. Petauke and Katete showed a steep increase, beyond the maximum allowed from 1996 to
1997 and a reduction in 1998, whereas Isoka’s situation was almost opposite. Most districts increased
their share of expenditures on capital from 1995 to 1996, except Kaoma, which consistently spent little on
capital. The interviews found revenues from interests in Katete and investments in revenue-generating
activities in Petauke (maize) that were in line with the districts’ spending patterns. The DHMT of Isoka
failed to save resources for capital investment and recently requested direct CBOH support for hospital
equipment. Similarly, the percentage spent on capital in Solwezi was relatively low, under 5 percent from
1996 to1998, but the strategy for the allocation of resources for the next year was said to have been to set
aside 4 percent for drugs and 10 percent for capital prior to calculating the share of the grant by levels.
Interview data therefore suggested that while some districts allocated funds to capital expenses early
in the reform, others were still in the process of learning how to make use of their choices to assign
resources to capital investments. While the fact that few districts exceeded CBOH guidelines might be
taken as an indicator of compliance, it is also a sign that scarce resources made allocating to current
operating costs a priority.

4. Field Case Studies of Nine Districts 51
Overall, expenditure patterns by items and levels indicated considerable room to negotiate with the
CBOH. Expenditures by items followed guidelines on sensitive issues such as fuel and allowances, but
ceilings on drugs were not enforced.
User Fees. Districts varied somewhat in their ability to generate user fees, but in all cases the
percentage of total health expenditures that came from fees was low (less than 10 percent), as shown in
Table 20.
Table 20. Sample Districts: User Fees
1998 % to Fees
Districts
Mumbwa 6.7
Chinsali 2.5
Isoka 3.6
Solwezi 4.9
Katete 3.9
Petauke 9.1
Kaoma 3.7
Mongu 7.8
National Average 5.946
Source: Government of Zambia
The process of making decisions about user fees through community participation was described
previously. The process of disbursement appears to generally follow the national guidelines, which
require the signature of the chair of the health center committee prior to purchasing items from user-fee
revenues. The guidelines also require a double record keeping system on revenues and expenditures, by
the facility committee and by the DHMT, as well as the use of ledger cards to identify each facility’s
financial resources within district pooled accounts. The MOH reduced decision space over these accounts
by suspending the payment of bonuses for health workers from these accounts.
Local decisions can also affect the user fees through the exemption policy. Interviews showed that
most districts generally applied the central guidelines on exemptions for specific diseases and treatments
but there were exceptions. Mongu was the only district that applied exemptions to all the interventions in
the guidelines, including deliveries. Kaoma, Isoka, Siavonga, and Chinsali required registration and fees
for patients with sexually transmitted diseases, contrary to the guidelines.
In contrast to the national level data, this study did not find that the wealthier and more urban districts
were better able to increase the percentage of total expenditures coming from user fees; for instance,
Mongu has the lowest income in the sample with the second highest percentage of total expenditures
covered by fees. Although districts without hospitals might be expected to be less successful in raising
fees than those with hospitals, since the exemptions to fees apply mostly to primary health care activities,
the sample did not support this hypothesis. Nevertheless, for the three districts that had data
distinguishing the source of fees, a high percentage of total fees came from the hospitals (in 1999, 62
percent in Kaoma, 53 percent in Mumbwa, and 86 percent in Siavonga).

52 Decentralization of the Health System in Zambia
4.2.3.2 Service Delivery
Standards and Essential Benefits Package. Although much has been made of the EHCP as a means
of establishing priorities, there was no clear indication that local decision makers made decisions about
the package of services delivered. The interviews with the DHMT and boards did not suggest that there
were major attempts to limit services offered according to a list of basic interventions, with the exception
of an effort to impose bypass fees to reduce direct access to first referral hospitals. The decisions to ration
or to provide services were made within the budgets and probably reflected the ad hoc availability of
equipment, supplies, drugs, and personnel. There were no indications that rational priority setting based
on limiting available interventions had been done at the district level other than to provide primary care
and hospital services using the percentage allocation guidelines.
Several continuing services such as immunization had been vertical programs previously, and they
appeared to continue to have been directed by “National Immunization Days” and to have been
coordinated by CBOH and Ministry officials. Family planning activities also seemed to have retained
something of the centrally directed vertical structure that the districts respected. These two services will
be examined in more detail in the following section on performance.
Hospitals, Contracting, and Outreach Services. Although there was no real space for districts to
make their hospitals autonomous, the presence of other hospitals—private mission hospitals and Ministry-
controlled second and tertiary hospitals—did have an impact on districts, and they exercised some
decision space over contracting with and, in the case of mission hospitals, providing subsidies to these
hospitals.
Contracts for service delivery are to be negotiated by districts, although guidelines stipulate that the
amounts received by private mission health facilities are decided at the central level. In practice, amounts
paid to mission hospitals have been negotiated locally, with some support from the center when
negotiations failed. However, the mission contracts are a legacy of the period prior to decentralization. All
mission hospitals and health centers contracted by districts were previously contracted by the MOH.
Districts with hospitals appeared to prefer to spend their resources on a hospital under their control. In
Mumbwa, assistance from the CBOH was requested to define the share of resources to be allocated to the
mission health center. The mission health center was developing into a referral hospital competing for
resources with the district hospital. The district team appeared reluctant to fund mission referral services.
In Kaoma, two mission hospitals are contracted in the northern and southern part of the district.
Interviews suggest that the district sees the mission hospitals as competing with its own district hospital
and therefore it is reluctant to contract for additional services from the mission. As noted above, districts
without hospitals tend to reduce their contribution to hospitals and are effective in shifting resources to
primary health care. In some cases, when budgets are cut, it is the payments to missions that are first
affected. When this occurred in Ketete, one of the missions suspended its outreach services. It is
important to note, however, that mission hospitals are also contracted for primary health care services. For
instance, Kaoma has drawn up separate contracts with mission hospitals: one for referral services and one
for primary health care services.
The 1999 guidelines specify the number of beds to be contracted for referral services (based on one
bed per 1500 inhabitants). A district such as Kaoma already has 78 first referral beds in its district
hospital. It needs only 12 additional beds to meet the national standard. But the current guidelines require
the district to purchase referral services from two mission hospitals (total beds available if all mission and
referral hospital beds are counted would be 267 with only 90 recommended). Similarly, in Siavonga, the
hospital has 68 beds while the guidelines would require only 23. Even though it would have beds in

4. Field Case Studies of Nine Districts 53
excess of the amount recommended, the district is expected to purchase additional beds from a mission
hospital.
Small, private, for-profit providers were found in eight districts; some of these share their activity
reports, but only in Mumbwa and Siavonga. None is contracted.
There is some evidence of innovations involving collaboration among districts for outreach services
that are encouraged by the central guidelines. Health workers in Petauke conducted outreach services in
Katete and allowances were paid from Katete’s grant. Isoka conducted outreach activities to contain the
cholera outbreak in the Nakonde district, and Nakonde paid the allowances. However, such encouraging
initiatives are less successful when they involve sharing the costs and benefits of district referral hospitals.
Nakonde was said to refer patients to Isoka, Nyimba to Petauke and Isoka, and Nakonde to Chinsali. An
agreement was reached in 1998 between Nakonde and Isoka, but the payment negotiated between the two
districts was suspended. Regarding the other cases, districts complained of the lack of contracts and
compensation for providing referral services to other districts. However, only Isoka was able to produce
data on referred patients. Again, contracting mechanisms did not seem to alleviate the burden of running a
district hospital, even when neighboring districts benefited from the hospital.
Overall districts did not seem to be contracting services on their own. Much of the contracting activity
was in response to prior commitments to mission hospitals and seemed often to create tension between
missions and districts that the CBOH is called in to resolve.
Community-Based Programs. Access to community-based (CBD) programs is estimated by
calculating the population covered by community health workers. Traditional Birth Attendant (TBA)
programs with the best coverages were found in Isoka, Solwezi, Katete, and Mumbwa, with a stable
density of TBAs per inhabitant from 1995 to1998 (fewer than 5,000 inhabitants per TBA). Coverage in
Katete was low (around 7,000 inhabitants per TBA) but stable overtime, whereas Mongu and Chinsali
seemed to have difficulties in maintaining active TBAs. Similar problems may have existed in Kaoma as
the density of TBAs varied. As of 1998, there were fewer inhabitants per TBA than in 1995, suggesting
that some efforts were successful. Dates for the initiation of these programs were not systematically
available; some of the TBA programs existed before 1995 (western province, Chinsali), some were
created in 1995 (Mumbwa), and many were assisted externally with an unknown degree of influence from
the center on the allocation of nongovernmental organizations (NGOs) and donor support. Therefore, the
degree of innovation is hard to assess, the data simply suggest that overall, these programs do not seem to
have been neglected.
Community Health Worker (CHW) programs showed a slight decline in the density of CHWs per
inhabitants from 1995 to1998 for Mongu, Katete, and Chinsali, but Isoka improved its already high
availability of CHWs, and Kaoma seemed to improve its initially low availability of CHWs. In Katete, the
number of CHWs was halved in 1997, due to a new CBD program. DHMT members reported that CHWs
lost their motivation when they saw that CBD agents received a regular compensation and training
courses. The district’s responsibility and authority for planning the CBD program and in foreseeing the
problem was not documented; this program is run by the Planned Parenthood Association of Zambia
(PPAZ). As for TBAs, the initiation of the CHW programs is not dated, with the exception of Isoka, and
districts’ initiative is hard to evidence. Only the health centers of Katete and Isoka mentioned buying
spare parts for the CHWs’ bicycles out of user fee revenues, suggesting that, in other districts, additional
community resources are requested to support community activities. These resources are more likely to be
drawn from the most remote communities where CHWs serve, with possible inequities in financing.
Overall, CBD programs appeared to keep up with population growth and to display a relatively stable
availability, which was often determined by their initial situation in 1995. Contrary to expectations,

54 Decentralization of the Health System in Zambia
program coverage at the community level was relatively low in the western province. Isoka had the best
coverage throughout the period.
The effects of CBD programs is well summarized in this quote from a DHB chair:
“Especially now, these [resources/equipment etc] are being used more properly than in the
past, because if they cause[d] damage, the government should [have] come and repair it.
Where you see a need, now, they run short of their programs and need [to] repair that
vehicle, whereas previously they waited for the government and just sit without doing
anything on that vehicle. Otherwise, giving things to people to use it to care for, that thing
is a good measure…”
The districts displayed a good ability to take advantage of local conditions and maintain their
respective assets. Perhaps the most dramatic changes lay in the multiple “small” decisions that reflected
greater self-reliance and commitment to performance. Small districts or poor districts seemed to innovate
as much as rich and large districts, although Siavonga, a small, poor, and understaffed district seemed to
display a slightly lower use of the decision space regarding service organization. Mumbwa also reported
slightly less innovations than other districts.
4.2.3.3 Human Resources
Salaries and Civil Service. As noted above, the districts did not gain much control over personnel,
although it had been anticipated that staff would be “delinked” from the Ministry and then the districts
would have assumed responsibility for hiring, firing, and paying salaries. This delinkage occurred in 1998
for the nonprofessional staff only.
For the period 1995 to 1998, there was little change observed for the professional staff of doctors,
nurses, and other health professionals. Although the resource mix may have been inadequate, in some
districts this was the result of the historical legacy and the lack of redistribution by the MOH. Districts
may recommend promotions, but the procedure is said to be long.
However, as of 1998-1999, districts had more decision space than formally allowed with respect to
hiring professional employees. According to interviews and data collected, two districts began this
practice in 1998 and it expanded in 1999. Since 1998, districts have hired qualified workers, using funds
“borrowed” from the grant. The enrollment in the MOH payroll takes approximately one year, but no
district mentioned the rejection of a proposed enrollee. Delays and lack of clear decisions were attributed
to the sharing of responsibilities between the MOH and the CBOH. Hiring and firing decisions were to be
controlled by the CBOH, whereas the MOH would control the payroll. If proposed enrollments appeared
to be rather successful, the division of authority at the center was seen as responsible for the lack of
effective sanctions. Indeed, it was reported that a health worker fired by the CBOH following a
recommendation from the district team could still obtain his or her salary from the MOH.
Professional workers employed by districts are paid a salary and/or allowances out of grant funds.
They are to reimburse these amounts to the district once they are enrolled in the central payroll. This
recent practice is not under the control of district boards as none reported this kind of decision space and
most of the boards were dissolved or had reached the limit of their 1998-1999 term of office. The number
of qualified employees recruited may be explained by a district’s needs and resources. District behavior
with respect to newly hired qualified personnel is summarized in Table 21.

4. Field Case Studies of Nine Districts 55
Table 21. Allocation of Locally Recruited Qualified Personnel
Districts Total
hired on district
funds
posted at HC Posted at
hospital
Posted
at DHO
Classified
total (99)
Siavonga 3 0 3 0 30
Kaoma 0 20
Isoka 0 54
Chinsali 7 6 1 0 About 40
Solwezi 0 46
Mongu 3 3 0 0
Mumbwa 9 4 4 1 57
Katete 0 40
Petauke 13-16 6 2 5-8 87
Source: District Data
Table 21 suggests that hiring does not actually reflect a low availability of qualified personnel
(mainly nurses) overall and/or per health center. Mumbwa, Chinsali, and Petauke had a large pool of
nurses relative to their population and hired the greatest number of nurses, in contrast to Katete, Isoka,
and Kaoma, which did not hire nurses in spite of having a large population served by each nurse. Hiring
decisions hardly reflected districts’ income as Katete and Kaoma are relatively well funded, lack nurses,
and did not hire locally. Yet Siavonga, a poor district with respect to finances and personnel, managed to
hire nurses.
As mentioned, in 1998 districts were able to make decisions about the nonprofessional “classified”
personnel who were delinked from the MOH. The removal of classified employees from the MOH payroll
led to a reduction of such employees in Kaoma (from 37 to 20), Mumbwa (from 77 to 57), and Solwezi
(from 94 to 46). But other districts hired more classified personnel than were available prior to
retrenchment: Katete went from 34 to 40 employees, Petauke from 74 to 87, and Isoka from 49 to 54.
Since Katete and Isoka have relatively few nurses, the hiring of classified employees may have been an
attempt to compensate for such shortages, especially at the health center level (both districts have large
target populations for their health center even though these centers function with at least two nurses). The
district of Petauke is just as difficult to explain with respect to hiring classified employees as it was
concerning the hiring of nurses. In addition, the director of health is a medical doctor who receives
advances from grant funds.
In general, the percentage of nonprofessional classified personnel allocated to health centers declined
slightly following the delinkage—from 1 to 15 percentage points—with the exception of Kaoma, where it
fell from 37 percent to 5 percent. This indicates a bias in favor of hospitals and district offices as
classified personnel are usually recruited locally and their allocation should not reflect socioeconomic
disparities between rural and urban areas. Petauke was an exception in that it has been paying its
classified employees since 1996 whereas the transfer was only affected in the other districts in 1998.
From 1995 to 1998, district offices in the six districts that had data for the period grew over time;
however, many of the staff, especially the nurses and classified nonprofessionals, were often assigned to
hospital and clinic service. By 1999, their composition, as presented in Table 22, varied.

56 Decentralization of the Health System in Zambia
Table 22. Composition of District Offices
Districts Composition Size
Mumbwa 1 MD 5N 7C 13
Chinsali 1 MD 5N 6C 12
Isoka 6N 2C 8
Solwezi 10N 9C 19
Katete 11N 10C 21
Petauke 1MD 8N 14C 23
Siavonga 6N 7C 13
Kaoma 5N 5C 10
Mongu 6N no data C >6
Source: District Data
MD: medical doctor
N: qualified employees/nurses
C: classified non-professional employee
The decision space with respect to human resources appeared to widen over time with the delinkage
of nonprofessional classified employees and the growing practice of hiring local professional employees
who were expected to become civil servants under the MOH. The experience of delinking
nonprofessionals suggests that districts were willing to reduce staff, especially when their budgets began
to shrink. How they would treat professional staff, however, remains to be seen.
4.3 Perceptions of Performance Changes
The study attempted to use the interviews at the sample districts to gain insight into the perception of
changes in performance before and after decentralization. An attempt was made to gain some sense of
what local officials thought about the impact of decentralization, especially concerning those factors that
could not be measured by available data. Unfortunately, getting respondents to clearly state their
perception of changes in performance was difficult. Interviewees, especially board members and
community representatives at the health center level, tended to assess recent changes rather than changes
over the entire period of 1995 to 1998. Therefore, these findings are reported with caution.
Overview by Type of Respondents
District teams tended to see decisions as being made more in line with local needs since
decentralization was implemented. In addition, fee increases are now discussed and accepted by users.
District teams saw their choices as enhancing efficiency because they had to make due with reduced
resources from the center. Despite shortages of resources, however, district teams generally claimed that
routine programs were maintained. In one district, team members clearly stated that outreach strategies
were reduced due to lack of funds. Despite a general complaint regarding insufficient and erratic funding,
district teams felt that the planning that established the initial budgets was useful.
DHMTs assessed the present quality of services as fair, at best. Several constraints to improving
quality were mentioned. These constraints appeared to have worsened recently. In addition to limited
financial resources, health workers’ low motivation was seen as affecting quality of services. Most teams
stated they had uncertainties regarding future conditions of employment and they were dissatisfied with
their present conditions, as salaries did not reflect actual responsibilities. However, they believed that

4. Field Case Studies of Nine Districts 57
health workers who continued to provide the best possible services did so because of professional ethics
and increased control on decisions. In one district, the board was said to have provided moral support to
the DHMT. Quality appeared to be threatened by the lack of diagnostic equipment. Respondents reported
that equipment was not replaced as needed; for example, weighing scales in health centers were said to be
missing. This may be part of the reason why immunization coverage declined in some districts. In
districts with hospitals, a main concern was the infrastructure and equipment of the hospital. Drug
supplies were said to be a major element of quality, and they were recently found to be deficient in many
districts. This complaint was, however, much more common among board members, health centers, and
community representatives than DHMT members.
In terms of equity in financial access, one district team clearly stated problems with favoritism on the
side of health workers. But there was no clear assessment as to whether financial access was lower after
the reform, probably because user fees and decentralization were implemented jointly. In several districts,
a failure to raise user fees due to popular discontent was reported (for example, Siavonga in 1998). In
Petauke, a bypass fee to prevent first use of hospital outpatient services could not be applied for the same
reason. These instances of popular participation suggest that fees cannot be raised beyond users’ ability to
pay. When interviewed about geographical access, DHMT members mentioned existing outreach and
community programs, new health centers, and plans for health posts, but there was no clear assessment of
a change in performance over time. Three districts in the sample appeared to have inherited community
programs developed prior to 1995 (Mongu, Kaoma, and Isoka). For the remaining districts, such
programs were likely to have developed around 1995. It is difficult to assess whether such decisions
reflected district initiatives or developments induced by districts’ assets and donors, and these would have
been observed even in the absence of decentralization. The sole element of comparison of equity changes
associated with the decentralization reform lies in central allocations to districts. These allocations were
seen as being fairer than the prior provincial system where districts funds were said to be disbursed on a
first come, first-served basis.
In terms of efficiency in the mix of inputs, all DHMTs mentioned difficulties in allocating personnel,
especially female nurses to rural health centers. Efficiency in service delivery may be discussed in light of
districts’ strategies for service delivery. The quantitative data discussed above suggest that districts with
community-based services achieved greater results in basic primary health care services (with perhaps the
exception of immunization) for a comparable level of funding in these services (Katete versus Mongu).
Again, the role of decentralization and local choice in developing such services is difficult to isolate from
the effects of the districts’ assets and central influences. In terms of other aspects of efficiency gains for
finances, drug management, and services organization, districts related numerous decisions regarding the
management of resources in line with improved efficiency. Reduced bureaucratic delays were not among
the major achievements except in the case of controlling outbreaks. Districts explained that all their
decisions had to be justified through lengthy reporting procedures. Even in the case of outbreaks, the
districts’ rapid responses were followed by a load of “red tape” to justify unplanned expenditures.
Lengthy bureaucratic responses were also noticed with respect to central approval for fee increases and
inquiries regarding DHBs.
In terms of financial soundness, most districts had some debts and argued that debt payment was a
priority. This may not always be the case, however, as some districts continue to hire staff and pay their
salaries through advances drawn from grant funds rather than use the funds to clear their debts. (Details of
this situation are discussed in the section on human resources). Some district teams acknowledged that
user fee revenues are borrowed to make up for delays and cuts in grant payments.
In most cases, DHBs were seen as legitimate to the extent that they contributed to district income
through fund-raising activities. Such activities were successful in a couple of districts whereas in others,
the views were inconsistent or negative.

58 Decentralization of the Health System in Zambia
Overall, the district teams regarded the reform positively because of it gave local ownership in
making choices. This was the main motivation driving the teams as they deplored the recent lack of
leadership.
From the district board’s perspective, assessments of changes in performance reflected a decline in
the quality of services, but especially in districts where the board had been dissolved. Boards that were
still active as of 1999 perceived shortages of resources, but their assessment was more positive, with the
view that shortages were better handled locally. Some board members expressed the view that the system
was more efficient, as the reform developed more self-reliant health districts. Members of recently
dismissed boards argued that drug availability and staff behavior deteriorated after their departure.
Indeed, all DHB members mentioned that the most common contributions of boards related to personnel
discipline, drugs, and fund raising for infrastructure (generally at the hospital level, but in some cases
rural maternity wards at health centers). The boards most involved in rural health centers were also boards
that had difficult relationships with DHMTs. These tensions developed or worsened following the failure
of delinkage, as board members thought their mandate involved the control of the whole district team
while DHMTs took notice of changes in policies. In some cases, facilities were said to be crowded and
the staff overworked (e.g., Katete). The changes the reform introduced that board members most often
noticed related to the improved cleanliness of the facilities. In general, the decentralization reform was
said to be good in its initial phase, but current developments, such as the failure of delinkage, limited
funds, insufficient drug supplies, and low morale among personnel, were hampering progress. In general,
board members and DHMTs were pleased with local initiatives for revenue generation, and often both
claimed ownership on the initiative.
The perspective at the health center level regarding changes in performance was incomplete in that
only a few people at the health centers were interviewed and only a few issues were addressed. In general,
current problems regarding drug supplies were mentioned as well as resource shortages that hampered
program implementation.
As one head of a health center noted: “Planning is a good thing…as it shows intentions of what is to
be done.” Health workers generally thought that allocations among health centers were fair since these
were made on a per capita basis with respect to planned expenditures. They were aware of budget cuts
and of DHMTs’ borrowing practices with respect to user fees. Most health centers visited were unable to
discuss the district board’s contribution as they often ignored the board’s composition and roles. In many
cases, in-kind contributions from the community were mentioned as evidence of good performance.
These last two points were generally consistent with the views of NHCs or health center committees.

4. Field Case Studies of Nine Districts 59
4.4 Performance Indicators of the Health Systems in the Districts
Indicators of Health Services Activity in Sample Districts
Overall, health services activity was determined by the number of outpatient visits and admissions per
inhabitant per year. These figures generally included activities from mission facilities, public hospitals,
and health centers. The only districts where data from a private, for-profit facility were included were
Mumbwa and Siavonga. Mission activity data have always been aggregated with that of public facilities.
Data from hospital and health center levels were usually disaggregated for at least a couple of years,
allowing for an assessment of their relative share of activity. For some districts, hospital data included
primary health care activities conducted at the hospital whereas other districts had created an autonomous
urban clinic, and these activities were reported with health centers. The details are mentioned when
relevant in the analysis.
Immunization was evaluated using a measure of geographical access; that is, the number of first BCG
immunization against tuberculosis per infant. For each district, this target was estimated as 4 percent of
the population. Full immunization was calculated similarly. Drop-out rates were estimated as a measure
of quality since immunization is free, although this rate could be due to other factors. This rate is likely to
be a proxy of the true drop-out rate as there is no guarantee that the children fully immunized are all
drawn from the population of children having received their first BCG. Health centers do not seem to
keep records of children in a manner that would allow an accurate estimation of drop-out rates. Some
districts showed negative drop-out rates: Petauke, Chinsali, and Siavonga. Their estimated drop-out rates
were not factored into the analysis.
The number of visits for children under five per year were calculated by estimating the population of
under fives as 20 percent of the district population, according to the guidelines of the national information
system.
Access to antenatal care (ANC) was measured by the number of first ANC visits per expected
pregnancy. The target population is nationally estimated as 5.4 percent of the district population. The total
number of attended deliveries includes deliveries attended at the community level. Divided by the number
of expected deliveries (5.2 percent of district population), this yields the percentage of assisted deliveries.
The share of activities for TBAs and hospitals also have been calculated. Finally, an estimated number of
visits for first ANC contact was provided as a proxy measure of quality since ANC is free. However, as in
the case of the immunization drop-out rates, the population from which first ANC visits and total ANC
visits were drawn may differ. As this is even more likely with deliveries, the drop-out rate between first
ANC and deliveries was not estimated.
The number of family planning visits for women of reproductive age per year were calculated using
an estimated target of 22 percent of the population. But family planning activities include condom
distribution to men, therefore, the indicators are only useful as they relate activity to population over time
and allow for comparisons among districts. The absolute value of the indicator is meaningless.
Data on immunizable diseases were collected, but these were not used in the comparisons among
districts as they are subject to uncontrollable fluctuations (outbreaks from neighboring districts, quality of
diagnosis and reporting, etc). Similarly, data on maternal and infant death were usually left out of the
comparisons.

60 Decentralization of the Health System in Zambia
4.5 General Trends
4.5.1 Utilization of Health Services
The national level data analysis showed no significant trend for utilization of outpatient services. The
data for the sample districts also did not show any specific trend. The results are as follows:
> Among seven districts with available data, outpatient services utilization remained stable in five
districts until 1997 (see Annex A, Figure 16). One of the districts whose initial utilization level
was high experienced a recent decline in 1997-1998. Only Chinsali showed an increase in
utilization over the period but with a serious drop over 1997-1998. Utilization declined in
Solwezi, which had started at the highest level. Five of the seven districts showed a decline
between 1997 and 1998. The range of values narrowed from 1995 to 1998.
> Hospital admission levels per inhabitant per year did not change for four of the seven districts
with interpretable data. Only two districts with initially high admissions rates showed a drop in
admissions. Overall, values appeared to converge between 0.05 and 0.1 admissions per
inhabitant per year in 1998.
4.5.2 Immunizations
Data on child health services are presented in Annex A. The analysis showed the following regarding
immunizations:
> BCG coverage decreased for most of the districts (five) that had initially high levels and
remained stable for the remaining districts (three) with available data. Overall, access seemed to
decline, unless initially high values reflect improvements in the information system (see Annex
A, Figure 17).
> Three districts showed a decrease in full immunization coverage, two improved, and three saw
no changes (see Annex A, Figure 18). Overall, the range of values was narrower in 1998 than in
1995 and values were lower, as illustrated in Table 23.
Table 23. Sample Districts: Ranges for Fully Immunized Chile Coverage
Year/ n Minimum value Maximum value Interval width
(percentage points)
94 (n=3) 47% 124% 77%
95 (n=8) 14% 137% 124%
96 (n=9) 45% 94% 49%
97(n=8) 51% 90% 39%
98 (n=9) 35% 74% 39%
Source: District Data
> With respect to child health services, immunization data suggested a reduced access (reduced
BCG coverage). If this were associated with reduced outreach strategies, the BCG coverage
achieved by health centers would drop, but this was not the case, except in Siavonga and perhaps

4. Field Case Studies of Nine Districts 61
in Katete where data were missing for 1998. Rather, a reduced BCG coverage may reflect
reduced hospital level activities in BCG. It translates into lower drop-out rates. The data suggest
a slight decline in full immunizations at both health center and hospital levels.
4.5.3 Reproductive Health
Reproductive health activities are presented in Annex A, Figures 19 and 20. Results regarding
reproductive health are as follows:
> With respect to antenatal first contacts per expected pregnancy, the data indicated an increasing
trend overall, with a decline over 1997-1998. Analyzed individually, four districts showed a
clear increase, one had a declining coverage from a very high initial level, and three remained
stable. From 1997 to 1998, five districts reduced their coverage and only two showed an
increase. The plots were well grouped with the exception of two outliers with high coverage:
Katete and Chinsali.
> The number of ANC visits suggested the absence of dramatic changes.
> The percentage of assisted deliveries was stable.
> Family planning activities rose in all seven districts with longitudinal data but one, Mumbwa.
The figure clearly suggested increasing levels of activity. The share of contraceptives provided
for the purpose of birth control and for sexually transmitted disease prevention was not available.
> Overall, reproductive health indicators indicated improvements in basic services and especially
in access to delivery services.
The decline in first ANC visits and BCG coverage was not dramatic and was mainly apparent in
districts that had doubtful data regarding access (coverage above 100 percent). Therefore, this suggests
that the main concern might be the drop in full immunization. Quality of services, as reflected in
immunization drop-out rates, did not seem to deteriorate, but reduced utilization of services overall raised
some questions that may be answered by financial access. For a country facing increased poverty levels
and a severe AIDS outbreak, these statistics were rather encouraging.
4.6 Summary of Changes in Performance by District
Table 24 attempts to recapitulate the above findings on performance changes during the period 1995-
1998. As several dimensions were explored for each area of performance assessments, especially under
financing, some assumptions were made. Debts are seen as a factor of low performance. High user-fee
revenues are a factor of good performance provided that fees are raised with the approval of communities
and that no subsequent decline in service activity or major neglect of exemptions is noticed. Changes in
grant releases are assumed to reflect district performance in reporting and designing appropriate action
plans. Finally, income-generating activities are considered a method to improve financial performance,
when they are not reported as failures. However, even with clearly spelled out assumptions, this
assessment of financial performance remains subject to bias, depending on the relative weight given to
selected areas of financial performance and the possibility of missing information.
With respect to allocations to primary health care and finances, the initial level of performance and
the observed changes are presented jointly.

62 Decentralization of the Health System in Zambia
Table 24. Summary of the Changes in Performance over 1995-1998 by District
District Katete Mongu Solwezi Kaoma Petauke Chinsali Siavonga Mumbwa Isoka
Health
services
activity
About
stable
About
stable
Slightly
better
About
stable
NA
About
stable
Slightly
better
About
stable
About
stable
Perceptions
No clear differential assessment, shared perception of recent decline (98-99) in quality of
services
Local choice allows greater efficiency in use of resources
4.7 Conclusion
The field study found that the participation of district boards, NHCs, and facility committees varied
and that their roles and responsibilities were unclear to the participants. The board composition varied and
did not seem to follow a particular pattern. The lack of clarity regarding the board’s roles, the apparently
arbitrary dissolution of some boards, and the lack of renewal of expired terms resulted in some districts
not having an active board and others having active, though expired, boards.
District boards seemed to be somewhat effective in raising additional revenues, and the boards and
committees were consulted for proposed user-fee increases. In some cases popular resistance to these fees
was effective in changing policy. District boards did not assume the expected role in personnel decisions
because of the failure to “delink” professional staff to the districts. The recent delinkage of
nonprofessional staff occurred too soon to determine the role of the boards in these personnel decisions. It
was clear that communication between the neighborhood and facility committees and the district boards
was minimal so that this potential avenue of local accountability was not being used.
The local decision makers appeared to appreciate the process of developing action plans as a planning
process, and the process appeared to follow general guidelines. However, the consistent lack of full
funding for these plans meant that critical decisions needed to be made at the time of centrally determined
budget cuts. This put the DHMT in the role of making allocation decisions while experiencing budget
cuts or while trying to cope with delays in payments. The DHMT tended to make these decisions without
consulting the district boards, in part because the boards did not meet frequently enough to be consulted at
the time the cuts were received. The DHMT tended to make these decisions based on the percentage
allocation categories of the central guidelines rather than on an assessment of the action plan or new
needs. In other words, there was no consistent rational process of trying to accommodate the action plans
based on the budget cuts. Furthermore, there did not appear to be a clear means of translating the EHCP
into a rational means of making priorities at the local level.
Researchers had hoped to provide a more detailed understanding of the impact of local characteristics
on the differences in performance observed in the sample. What emerges from this analysis that differs
somewhat from the national level analysis is that the district trends are relatively stable and therefore
better reflect the conditions that were present at the beginning of the period of decentralization. This
suggests that decentralization itself did not have much of an effect on the performance of the sample
districts. The districts continued to do what they had been doing before. The changes they experienced—
especially the changes in revenues per capita, the decline in immunization programs, and the effective
family planning activities—impacted all the districts. Those districts that were doing well before
continued to do well; those that were not doing as well continued to do poorly. Decentralization did not
improve or disadvantage anyone in particular.

5. Conclusions and Policy Implications 63
5. Conclusions and Policy Implications
The conclusions drawn as a result of this analysis are tentative. Although the data presented are
probably the best available and certainly among the best data for district-level analysis in the developing
world, they do have limitations. In many cases, only partial data were available, and there are clear
inconsistencies in some data sources. Only partial interview data were available, and all such data needed
cross-checking and further investigation. Parts of the analysis—the definition of formal decision space,
for example—depend on judgment rather than hard evidence. Given these concerns, it is important not to
rely heavily on these findings. Nevertheless, the researchers believe that this analysis is more complete
and can be taken with more confidence than most anecdotal reports based on very partial observations.
The following paragraphs provide a review of the findings of the analysis of formal decision space,
allocation decisions, and performance. Each section concludes with policy recommendations presented in
italics.
5.1 Decision Space
The important aspect to note in Zambia is that although this is predominantly a case of
“deconcentration” to the districts within the MOH administrative structure, the districts have as much if
not more decision space than do other countries that are “devolved” to local municipal governments.
Districts in Zambia, like local authorities in many other countries, have a moderate range of choice over
expenditures, income from fees, and some aspects of governance. The districts have an unusually wide
range of choice over payment mechanisms and local prepaid insurance plans. Like systems in other
countries, Zambian districts have little choice over standards and norms and over human resources,
although this has been widening over time. Zambia differed from cases of “devolution” in that its capacity
to generate significant additional revenue sources, such as revenue from local taxes, was quite narrow.
Like all other systems, there were changes over time, with some expansion of district choice over human
resources (such as with the delinkage of nonprofessional personnel) and with reduction of choices in
governance as boards were dismissed by the MOH.
The field studies suggest that the formal decision space is generally respected and that there is no
significant “informal” decision space with different ranges of choice in actual practice.
Although there is no clear model of appropriate decision space, it can be concluded that Zambian
decentralization is neither excessive nor too limited in general and this study does not suggest a clear
policy recommendation to change the overall range of choice offered to the districts. However,
Zambia might consider adopting a process of widening decision space for districts that demonstrate
that they have achieved more equitable and efficient allocations and other performance
improvements. As shown below, this study will also recommend some modifications on specific
functions.

64 Decentralization of the Health System in Zambia
5.2 Allocation Decisions
This study found that the real total per capita expenditures in the districts varied over time with initial
increases occurring from 1995 to 1997, followed by a significant decline in 1998. Total real expenditures
per capita appear to have been relatively evenly distributed among income, urbanity, and population sizes.
Researchers could not determine whether this relative equity was the result of decentralization since no
good measures of total health expenditures were available for the period prior to decentralization.
However, the trends over time were relatively stable and did not respond to differences in income or
urbanity, so it is likely that decentralization did not change much in the initial distribution of
expenditures. In other words, it is likely that decentralization maintained a relatively equal distribution
from the period prior to decentralization and did not increase inequalities among districts.
A major contributor to this equity was the relative equity of the distribution of budgetary transfers, or
“grants,” to the districts. Grants make up by far the largest source of revenue in the districts. Data show
that the formula for assigning resources to districts seems to be adequate in terms of producing a general
equity of per capita resources among districts. The formula should be based on population size and favor
rural areas over urban areas. The study data suggest that the allocation of central grants to the districts is
related to population, but the study found no evidence that rural areas were being favored in the grant
allocations. Although it was not part of the formula, the allocation of budgetary grant funding in 1998 was
negatively correlated with average district income based on the LCMS.
Based on this finding, it is recommended that making average district income part of the formula
could be useful in that it would be transparent for future allocations and rurality would become a
more explicit part of the formula.
The districts did have some choice over raising fees, and some districts were more successful in this
area than others. The study found that the wealthiest and the most urban districts were most successful in
raising fees as a percentage of total revenue and that there is a growing gap between the wealthiest and
more urban versus the poorest and more rural districts in generating fees. This fact has not yet made a
major impact on total health expenditures since fees have not yet become a major source of revenue.
However, without a mechanism to favor the poorer and more rural districts, the current level of overall
equity in revenues is likely to deteriorate over time.
Fee collection should be carefully monitored, and poor and rural districts should be increasingly
favored in the central formula as the wealthier districts increase their revenues from fees.
Regarding expenditure allocations, the study found a significant increase in allocations to primary
care. Districts with larger populations assigned higher percentages to primary care, but the gap between
large and small districts declined over time. Although wealthier municipalities tended toward a 20 percent
higher expenditure than poorer municipalities, this difference was relatively stable—the gap between rich
and poor was not increasing or decreasing. On the other hand, the more urban districts were increasingly
assigning greater proportions of their expenditures to primary care. The wealthiest and most urban
districts spent less on hospitals than did the other districts. This appears to be due to the presence of other
providers, such as private hospitals and secondary and tertiary hospitals, that are not in the district’s
budget. In the field cases, researchers found that districts that had no district hospital were particularly
likely to assign more resources to primary care and were failing to contract for hospital services at the
expected level. This finding suggests that larger districts, especially those without district hospitals in
their budgets, are favored in terms of allocations to primary care. The smaller districts, therefore, will be
at an increasing disadvantage in assignments to primary care.

5. Conclusions and Policy Implications 65
The CBOH should either monitor more carefully and enforce the contracting of hospital services,
especially by those districts that do not have their own hospitals, or develop a different mechanism
for paying for hospital services in those districts and reduce the funding to those districts
accordingly. More explicit guidelines on contracting hospital services should be developed.
There is a shift within primary care from community-level expenditures toward health centers;
however, this shift is within the CBOH guidelines. The field case studies suggest that this may be a
function of accounting, since a national program on immunization was funded through the community-
level allocations. It is notable that allocations to district offices are much higher than the guidelines, but
they do not seem to vary according to income, urbanity, or population.
This finding suggests that a more detailed analysis of the actual functions and staffing of district
offices should be done in order to establish more realistic guidelines. These guidelines should be
carefully monitored to prevent growth in the percentage going to district offices.
The study found that the mechanism to impose maximum guidelines on traditional budgetary
categories of personnel allowances, emergency drugs, fuel, and capital costs was generally very effective.
This finding suggests that this mechanism can be implemented in countries with low levels of funding
and education. Probably because the guidelines used the traditional well known budgetary categories
rather than the new categories of levels of care, they were easier to monitor and control.
The process of delinkage was not implemented according to the initial plans, and only
nonprofessional staff were delinked in 1998, without clear additional budgets to accommodate the
increase in district salary responsibility. The districts, however, did appear to make important personnel
decisions regarding this new responsibility, reducing staff in many districts. While the staffing in relation
to staffing needs should be reviewed, this outcome suggests that districts can make rational choices
concerning personnel.
Some additional decision space should be allowed for district decisions concerning professional
staffing. A major effort to establish guidelines on human resource decisions at the district level
should be made prior to any new attempt to delink the professional staff.
In the area of personnel delinkage, it is clear that the guidelines are unrealistic in terms of additional
responsibilities for delinked staff.
The MOH and CBOH should reassess the guidelines so that they more adequately reflect the
allocations needed at the district level and accommodate the districts’ responsibilities.
5.3 Decision Making Process at District Levels
The field study found that the participation of district boards and neighborhood and facility
committees varied and that their roles and responsibilities were unclear to the participants. The board
composition varied and did not seem to follow a particular pattern. The lack of clarity about board roles,
the apparently arbitrary dissolution of some boards, and the lack of renewal of expired terms resulted in
some districts not having an active board and others having active, though expired, boards.
The MOH should redefine the role of district boards, clarify the selection process and criteria, and
develop and implement procedures for renewal of board responsibilities.

66 Decentralization of the Health System in Zambia
District boards appeared to be somewhat effective in raising additional revenues, and the boards and
committees were consulted for proposed user-fee increases. In some cases, popular resistance to these
fees was effective in changing policy. District boards did not assume the expected role in personnel
decisions because of the failure to “delink” professional staff to the districts. The recent delinkage of
nonprofessional staff occurred too soon to determine the boards’ role in these personnel decisions. It was
clear that communication between the neighborhood and facility committees and the district boards was
minimal so that this potential avenue of local accountability was not being used.
The role of district boards in the process of personnel decision making should be redefined so that it
is appropriate to the actual process of delinkage. A process for neighborhood and facility committees
to formally petition the district boards should be implemented so that this avenue of accountability is
established.
The local decision makers appeared to appreciate the process of developing action plans as a planning
process, and the process appeared to follow general guidelines. However, the consistent lack of full
funding for these plans meant that critical decisions needed to be made at the time of centrally determined
budget cuts. This put the DHMT in the role of making allocation decisions while experiencing budget
cuts or while trying to cope with delays in payments. The DHMT tended to make these decisions without
consulting the district boards, in part because the boards did not meet frequently enough to be consulted at
the time cuts were received. The DHMT tended to make these decisions based on the percentage
allocation categories of the central guidelines rather than based on an assessment of the action plan or
new needs. In other words, there was no consistent rational process of accommodating the plans based on
the budget cuts. Furthermore, there did not appear to be a clear means of translating the EHCP into a
rational means of making priorities at the local level and it does not seem to have been used in the sample
districts.
A process of making allocation decisions in relation to budget cuts needs to be developed so that
factors such as consistency with action plans, new situations, and the EHCP are brought to bear in
the process of priority setting during the year. A formal means of involving the district boards at the
time budget cuts are made should also be established.
5.4 Health System Performance
This study was not able to assess the performance of the districts in relation to the period prior to
decentralization. However, researchers found little evidence of major changes in performance during the
period of decentralization, although data were limited and mainly available for the most recent period. In
general, the interviews did not provide evidence of major changes in system performance. Interviews
suggested that the DHMTs tended to see performance improving while district boards saw continuing
problems.
There was no evidence of major changes in utilization over the period 1995-1998. Researchers did
find evidence of some decline in immunization coverage and an increase in family planning over this
period. However, these changes are more likely to have been the result of central decisions (disruption in
external funding for immunizations and donor-driven programs of family planning and NGOs) than of
local decisions resulting from decentralization. The trends found in the field sample suggest that districts
with good performance continued to perform well and those with poor performance continued to perform
poorly and that these factors may be related to local characteristics.
Overall, there was no clear evidence that decentralization has weakened the Zambian health system.
Indeed, in the face of economic decline and the rise in HIV/AIDS, the system appears to have

5. Conclusions and Policy Implications 67
maintained itself fairly well. It has in some sense probably improved efficiency since the activity
levels have been maintained in the face of recent declines in funding.
This may not be a favorable conclusion in that advocates of decentralization would have liked to have
seen major improvements since 1995 and critics would have liked to have seen major deterioration in
order to confirm their initial biases. That decentralization cannot be clearly linked to improvements
or deterioration may be due to data limitations. However, these findings are consistent with findings
in other countries. While researchers can offer suggestions to improve the effectiveness and processes
of decentralization, they cannot expect this policy lever alone to make major changes in system
performance.

Annex A: Additional Tables and Figures 69
Annex A: Additional Tables and Figures
Table 25. Percent Allocated to Medical Fees 1997-1998 by District Population Quintiles
Medical Fees 1997 1998
Population Quintiles
1
st
(smallest) 2.56 3.1
2
nd
5.43 5.77
3
rd
4.09 5.33
4
th
5.75 6.67
5
th
(largest) 7.52 8.86
5
th
/1
st
2.94 2.86
Correlation Coeff. 0.56 0.50
p-value 0.0001 0.0002
Source: Government of Zambia
Table 26. Percent Allocated to Medical Fees by District Urbanization Quintiles
Medical Fees 1997 1998
Urban Quintiles
1
st
(most rural) 4.15 4.94
2
nd
2.92 3.75
3
rd
3.7 4.22
4
th
4.01 4.69
5
th
(most urban) 10.57 12.13
5
th
/1
st
2.55 2.46
Corr. Coef. 0.68 0.68
p-value 0.0001 0.0001
Sources: Government of Zambia and LCMS 1996
Table 27. Percent Allocated to Medical Fees by District Income Quintiles
Medical Fees 1997 1998
Income Quintiles
1
st
(poorest) 2.36 3.23
2
nd
3.36 3.69
3
rd
5.18 5.5
4
th
7.8 9.07
5
th
(wealthiest) 6.65 8.24
5
th
/1
st
2.82 2.55
Correlation Coeff. 0.40 0.40
p-value 0.01 0.01
Sources: Government of Zambia and LCMS 1996

70 Decentralization of the Health System in Zambia
Table 28. Regression of Percent Allocated to Medical Fees 1998
Dependent Variable % Medical Fees
Total N N=50 Districts
Independent Variables Coeff. t
Income 0.02 1.45
Urbanization 5.06 1.30
Education 0.93 0.94
Access 0.12 0.95
Children Under 5 yrs -27.06 -0.93
Population .069 1.20
Constant -3.78 -0.59
R-square 0.5308
p-value 0.0001
* |t| >2.00 ** 1.5<|t| <2.0
Table 29. Total Health Expenditures 1995-1998 by District Population Quintiles
Population
Quintiles
1995* 1996* 1997* 1998
1
st
(smallest) 89,111,111 195,384,615 191,250,000 127,000,000
2
nd
84,888,889 252,307,692 281,250,000 164,000,000
3
rd
110,444,444 332,307,692 326,250,000 216,000,000
4
th
135,555,556 509,230,769 491,250,000 331,000,000
5
th
(largest) 37,111,111 747,692,308 976,250,000 486,000,000
5
th
/1
st
0.42 3.83 5.10 3.83
Correlation Coeff. 0.90 0.93 0.93 0.97
p-value 0.0001 0.0001 0.0001 0.0001
Source: Government of Zambia
*Adjusted according to Consumer Price Index for 1998
Table 30. Total Health Expenditures Per Capita 1995-1998 by Weighted District Urbanization
Quintiles
Urbanization
Quintiles
1995* 1996* 1997* 1998
1
st
(most rural) 1031.38 2582.85 2557.33 2008.16
2
nd
1279.82 2901.54 2801.20 2292.64
3
rd
1294.93 2594.11 2562.86 2075.77
4
th
827.56 2742.45 2743.50 2095.10
5
th
(most urban) 889.76 2793.88 3015.53 2099.64
5
th
/1
st
0.86 1.08 1.18 1.05
Correlation Coeff. -0.13 0.06 0.11 0.01
p-value 0.36 0.71 0.50 0.97
Source: Government of Zambia
*Adjusted according to Consumer Price Index for 1998

Annex A: Additional Tables and Figures 71
Table 31. Total Health Expenditures Per Capita 1995-1998 by Weighted District Income Quintiles
Income Quintiles 1995* 1996* 1997* 1998
1
st
(poorest) 1179.33 2499.60 2334.95 2023.52
2
nd
1302.69 2844.25 2845.16 2187.16
3
rd
940.60 2553.72 2470.59 2240.87
4
th
1072.22 2981.37 2986.14 2209.73
5
th
(wealthiest) 828.58 2735.88 3043.58 1910.00
5
th
/1
st
0.70 1.09 1.30 0.94
Correlation Coeff. -0.21 -0.06 -0.02 -0.20
p-value 0.14 0.67 0.91 0.17
Source: Government of Zambia and LCMS 1996
*Adjusted according to Consumer Price Index for 1998
Table 32. Regression of THE Per Capita 1996 and 1998
Dependent Variable THE Per Capita
Total N N=100 Districts
Independent Variables Coeff. t
Income 0.006 0.01
Urbanization -170.50 -0.15
Education -175.31 -1.04
Access -9.98 -0.49
Children Under 5 yrs -118.22 -0.04
Population ----- -----
Year 426.21 0.79
Constant 3277.41** 1.88
R-square 0.7286
p-value 0.0049
* |t| >2.00 ** 1.5<|t| <2.0
Table 33. Allocation to Primary Health Care 1995-1998 by Population Quintiles
Population Quintiles 1995 1996 1997 1998
1
st
(smallest) 32.22 49.68 46.63 47.68
2
nd
33.27 57.53 57.13 57.84
3
rd
30.55 53.44 47.49 48.19
4
th
41.35 56.12 53.18 53.97
5
th
(largest) 58.73 66.43 64.05 64.91
5
th
/1
st
1.82 1.34 1.37 1.36
Correlation Coeff. 0.39 0.33 0.27 0.30
p-value 0.005 0.02 0.05 0.03
Source: Government of Zambia and LCMS 1996

72 Decentralization of the Health System in Zambia
Table 34. Percent Allocated to Primary Health Care 1995-1998 by Weighted District Urbanization
Quintiles
Urbanization
Quintiles
1995 1996 1997 1998
1
st
(most rural) 41.61 55.77 45.89 48.21
2
nd
35.39 45.02 44.4 47.64
3
rd
30.04 54.1 46.73 46.09
4
th
40.83 62.16 56.59 57.85
5
th
(most urban) 48.25 66.15 74.87 72.8
5
th
/1
st
1.16 1.17 1.63 1.51
Correlation Coeff. 0.2782 0.35 0.61 0.63
p-value 0.0504 0.01 0.0001 0.0001
Source: Government of Zambia and LCMS 1996
Table 35. Allocation to Primary Health Care 1995-1998 by Weighted District Income Quintiles
Income Quintiles 1995 1996 1997 1998
1
st
(poorest) 28.37 59.86 42.87 48.46
2
nd
46.12 54.89 54.16 48.49
3
rd
38.36 56.19 54.44 57.03
4
th
46.9 58.13 62.11 60.17
5
th
(wealthiest) 36.37 54.13 54.9 58.44
5
th
/1
st
1.28 0.90 1.28 1.20
Correlation Coeff. -0.11 -0.08 0.06 0.12
p-value 0.46 0.58 0.69 0.46
Source: Government of Zambia and LCMS 1996
Table 36. Regression of Percent Allocated to Primary Care 1996 and 1998
Dependent Variable Primary Care
Total N N=100 Districts
Independent Variables Coeff. T
Income 0.007 0.37
Urbanization 30.53 1.18
Education 1.57 0.42
Access 0.95** 2.08
Children Under 5 yrs 59.28 0.79
Population .0005 0.92
Year 0.86 0.07
Constant -101.20 -0.84
R-square 0.8148
p-value 0.0001
* |t| >2.00 ** 1.5<|t| <2.0

Annex A: Additional Tables and Figures 73
Table 37. Allocation to Communities 1995-1998 by Population Quintiles
Population Quintiles 1995 1996 1997 1998
1
st
(smallest) 5.54 20.32 13.9 3.5
2
nd
5.12 17.07 8.49 2.09
3
rd
9.48 24.34 9.83 4.18
4
th
11.78 14.3 7.51 2.38
5
th
(largest) 7.11 16.99 11.64 2.55
5
th
/1
st
1.28 0.84 0.84 0.72
Correlation Coeff. 0.12 0.07 0.18 -0.07
p-value 41 0.65 0.22 0.62
Source: Government of Zambia and LCMS 1996
Table 38. Percent Allocated to Communities 1995-1998 by Weighted District Urbanization Quintiles
Urbanization
Quintiles
1995 1996 1997 1998
1
st
(most rural) 8.89 18.34 9.59 2.87
2
nd
5.68 17.09 11.31 4.15
3
rd
10.46 23.81 10.18 2.1
4
th
6.35 17.21 9.63 2.28
5
th
(most urban) 7.65 16.57 10.66 3.3
5
th
/1
st
0.86 0.90 1.11 1.15
Correlation Coeff. 0.04 -0.08 0.06 -0.04
p-value 0.76 0.60 0.60 0.77
Source: Government of Zambia and LCMS 1996
Table 39. Percent Allocated to Communities 1995-1998 by Weighted District Income Quintiles
Income Quintiles 1995 1996 1997 1998
1
st
(poorest) 7.76 27.78 11.44 3.44
2
nd
8.89 19.22 9.08 2.79
3
rd
7.81 18.4 12.37 4.11
4
th
7.21 14.42 9.18 2.49
5
th
(wealthiest) 7.36 13.2 9.3 1.87
5
th
/1
st
0.95 0.48 0.81 0.54
Correlation Coeff. -0.18 -0.30 -0.16 -0.22
p-value 0.21 0.03 0.27 0.12
Source: Government of Zambia and LCMS 1996

74 Decentralization of the Health System in Zambia
Table 40. Regression of Percent Allocated to Communities 1996 and 1998
Dependent Variable Percent to
Communities
Total N N=50 Districts
Independent Variables Coeff. t
Income .0005 0.03
Urbanization -11.78 -0.63
Education 3.33 1.23
Access 0.54** 1.65
Children Under 5 yrs -25.13 -0.46
Population .00009 0.21
Year -21.66* -2.34
Constant -15.06 -0.17
R-square 0.8132
p-value 0.0001
* |t| >2.00 ** 1.5<|t| <2.0
Table 41. Percent Allocation to Health Centers 1995-1998 by Population Quintiles
Population Quintiles 1995 1996 1997 1998
1
st
(smallest) 26.67 29.35 32.72 44.18
2
nd
28.11 40.46 48.65 55.75
3
rd
21.06 29.11 37.66 44.01
4
th
29.57 41.81 45.66 51.61
5
th
(largest) 51.61 49.44 52.43 62.4
5
th
/1
st
1.94 1.68 1.60 1.41
Correlation Coeff. 0.46 0.43 0.36 0.48
p-value 0.0008 0.0017 0.0101 0.0005
Source: Government of Zambia and LCMS 1996
Table 42. Percent Allocated to Health Centers 1995-1998 by Weighted District Urbanization
Quintiles
Urbanization
Quintiles
1995 1996 1997 1998
1
st
(most rural) 32.7 37.39 36.28 45.37
2
nd
29.71 27.95 33.09 43.49
3
rd
19.57 30.29 36.55 43.98
4
th
34.47 44.94 46.99 55.6
5
th
(most urban) 40.57 49.6 64.21 69.51
5
th
/1
st
1.24 1.33 1.77 1.53
Correlation Coeff. 0.29 0.40 0.59 0.63
p-value 0.04 0.004 0.0001 0.0001
Source: Government of Zambia and LCMS 1996

Annex A: Additional Tables and Figures 75
Table 43. Percent Allocated to Health Centers 1995-1998 by Weighted District Income Quintiles
Income Quintiles 1995 1996 1997 1998
1
st
(poorest) 20.6 32.09 31.44 45.02
2
nd
37.23 35.66 45.08 45.72
3
rd
30.54 37.79 42.09 52.95
4
th
39.68 43.71 52.92 57.69
5
th
(wealthiest) 28.97 40.92 45.59 56.57
5
th
/1
st
1.41 1.28 0.81 1.26
Correlation Coeff. -0.06 0.11 0.11 0.16
p-value 0.68 0.44 0.43 0.26
Source: Government of Zambia and LCMS 1996
Table 44. Regression of Percent Allocated to Health Centers 1996 -1998
Dependent Variable Percent to Health
Centers
Total N N=100 Districts
Independent Variables Coeff. T
Income 0.007 0.37
Urbanization 42.21** 1.71
Education -1.78 -0.49
Access .4018 0.92
Children Under 5 yrs 83.71 1.16
Population 0.0005 0.80
Year 22.46** 1.83
Constant -85.26 -0.74
R-square 0.8611
p-value 0.0001
* |t| >2.00 ** 1.5<|t| <2.0
Table 45. Percent Allocated to Hospitals 1995-1998 by Population Quintiles
Population Quintiles 1995 1996 1997 1998
1
st
(smallest) 36.46 31.74 28.51 27.85
2
nd
19.46 19.47 19.23 19.01
3
rd
42.55 28.27 30.69 32.76
4
th
28.7 21.59 19.81 20.97
5
th
(largest) 13.33 11.57 13.04 13.66
5
th
/1
st
0.37 0.36 0.46 0.49
Correlation Coeff. -0.30 -0.37 -0.33 -0.32
p-value 0.04 0.008 0.02 0.02
Source: Government of Zambia and LCMS 1996

76 Decentralization of the Health System in Zambia
Table 46. Percent Allocated to Hospitals 1995-1998 by Weighted District Urbanization Quintiles
Urbanization
Quintiles
1995 1996 1997 1998
1
st
(most rural) 25.21 23.96 27.05 27.15
2
nd
38.28 34.18 33.81 31.1
3
rd
44.23 25.48 29.64 32.46
4
th
19.23 15.25 16.34 16.85
5
th
(most urban) 13.55 13.77 4.44 6.69
5
th
/1
st
0.54 0.57 0.16 0.25
Correlation Coeff. -0.30 -0.30 -0.56 -0.53
p-value 0.03 0.03 0.0001 0.0001
Source: Government of Zambia and LCMS 1996
Table 47. Percent Allocated to Hospitals 1995-1998 by Weighted District Income Quintiles
Income Quintiles 1995 1996 1997 1998
1
st
(poorest) 34.81 18.97 31.85 29.85
2
nd
24.22 24.68 22.67 28
3
rd
27.37 24.64 22.56 21.49
4
th
26.51 23.14 16.08 17.51
5
th
(wealthiest) 27.59 21.21 18.12 17.4
5
th
/1
st
0.79 1.12 0.57 0.58
Correlation Coeff. 0.07 -0.03 -0.14 -0.12
p-value 0.64 0.86 0.33 0.39
Source: Government of Zambia and LCMS 1996
Table 48. Regression of Percent Allocated to Hospitals 1996-1998
Dependent Variable Percent to Hospitals
Total N N=100 Districts
Independent Variables Coeff. T
Income -0.007 -0.34
Urbanization -41.88** -1.50
Education -0.41 -0.10
Access -.31 0.92
Children Under 5 yrs -32.45 -0.40
Population -.0006 -0.94
Year 1.80 0.13
Constant 176.56 1.35
R-square 0.8324
p-value 0.0001
* |t| >2.00 ** 1.5<|t| <2.0

Annex A: Additional Tables and Figures 77
Table 49. Percent Allocated to District Offices 1995-1998 by Population Quintiles
Population Quintiles 1995 1996 1997 1998
1
st
(smallest) 31.33 18.58 24.87 24.46
2
nd
47.28 23.01 23.63 23.16
3
rd
26.9 18.3 21.83 19.05
4
th
29.95 22.29 27.02 25.06
5
th
(largest) 27.95 22.02 22.92 21.38
5
th
/1
st
0.89 1.19 0.92 0.87
Correlation Coeff. -0.15 -0.06 -0.19 -0.23
p-value 0.31 0.69 0.18 0.13
Source: Government of Zambia and LCMS 1996
Table 50. Percent Allocated to District Offices 1995-1998 by Weighted District Urbanization
Quintiles
Urbanization
Quintiles
1995 1996 1997 1998
1
st
(most rural) 33.18 20.3 27.05 24.63
2
nd
26.36 20.79 21.82 21.26
3
rd
25.73 20.45 23.64 21.45
4
th
39.94 22.6 27.06 25.28
5
th
(most urban) 38.2 20.06 20.7 20.49
5
th
/1
st
1.15 0.99 0.77 0.83
Correlation Coeff. 0.09 0.01 -0.13 -0.09
p-value 0.59 0.93 0.39 0.53
Source: Government of Zambia and LCMS 1996
Table 51. Percent Allocated to District Offices 1995-1998 by Weighted District Income Quintiles
Income Quintiles 1995 1996 1997 1998
1
st
(poorest) 36.81 21.18 25.27 25.27
2
nd
29.67 20.45 23.17 23.17
3
rd
34.31 19.2 23.02 23.02
4
th
26.59 18.72 21.83 21.83
5
th
(wealthiest) 36.03 24.65 26.98 26.98
5
th
/1
st
0.98 1.16 1.07 1.07
Correlation Coeff. 0.04 0.19 0.17 0.03
p-value 0.81 0.19 0.25 0.85
Source: Government of Zambia and LCMS 1996

78 Decentralization of the Health System in Zambia
Table 52. Regression of Percent Allocated to District Offices 1996-1998
Dependent Variable Percent to Offices
Total N N=100 Districts
Independent Variables Coeff. T
Income -.00004 -0.003
Urbanization 11.35 0.72
Education -1.158 -0.50
Access -0.64* -2.29
Children Under 5 yrs -26.61 -0.58
Population .00006 0.15
Year -2.66 -0.34
Constant 24.31 0.33
R-square 0.7852
p-value 0.0003
* |t| >2.00 ** 1.5<|t| <2.0
Table 53. Percent Allocated to Allowances 1995-1998 by Population Quintiles
Population Quintiles 1995 1996 1997 1998
1
st
(smallest) 26.76 24.72 23.66 21.45
2
nd
27.01 23.07 22.28 22.28
3
rd
24.01 22.63 20.91 20.91
4
th
22.55 18.94 20.50 20.50
5
th
(largest) 18.32 14.92 16.28 16.28
5
th
/1
st
0.68 0.60 0.69 0.80
Correlation Coeff. -0.38 -0.64 -0.47 -0.47
p-value 0.007 0.0001 0.0007 0.0005
Source: Government of Zambia and LCMS 1996
Table 54. Percent Allocated to Allowances 1995-1998 by Weighted District Urbanization Quintiles
Urbanization
Quintiles
1995 1996 1997 1998
1
st
(most rural) 27.43 22.63 22.45 19.14
2
nd
25.86 21.98 22.72 18.49
3
rd
25.77 25.52 21.49 18.92
4
th
22.68 18.90 21.76 18.86
5
th
(most urban) 16.92 15.26 15.21 13.96
5
th
/1
st
0.62 0.67 0.68 0.73
Correlation Coeff. -0.37 -0.62 0.61 0.52
p-value 0.0001 0.0001 0.0001 0.004
Source: Government of Zambia and LCMS 1996

Annex A: Additional Tables and Figures 79
Table 55. Percent Allocated to Allowances 1995-1998 by Weighted District Income Quintiles
Income Quintiles 1995 1996 1997 1998
1
st
(poorest) 24.73 25.22 23.11 18.98
2
nd
27.10 22.54 21.96 18.31
3
rd
23.21 19.00 19.66 16.33
4
th
19.39 16.42 19.03 16.78
5
th
(wealthiest) 24.22 21.10 19.88 18.96
5
th
/1
st
0.98 0.84 0.87 1.00
Correlation Coeff. -0.15 -0.14 -0.27 -0.13
p-value 0.07 0.09 0.0007 0.11
Source: Government of Zambia and LCMS 1996
Table 56. Regression of Percent Allocated to Allowances 1996-1998
Dependent Variable Personnel Costs
Total N N=100 Districts
Independent Variables Coeff. T
Income 0.004 0.60
Urbanization 10.63 1.02
Education -3.57* -2.78
Access -0.442* -2.84
Children Under 5 yrs -63.98* -2.48
Population 0.0004* 2.24
Year -15.16* -3.45
Constant -39.80 -0.96
R-square 0.8379
p-value 0.0001
* |t| >2.00 ** 1.5<|t| <2.0
Table 57. Percent Allocated to Drugs 1995-1998 by Population Quintiles
Population Quintiles 1995 1996 1997 1998
1
st
(smallest) 1.42 1.17 0.56 0.85
2
nd
1.46 1.73 1.50 1.45
3
rd
1.99 1.80 1.83 1.39
4
th
3.33 2.04 2.47 2.39
5
th
(largest) 5.91 2.30 2.63 3.56
5
th
/1
st
4.16 1.95 4.72 4.20
Correlation Coeff. 0.11 0.13 0.32 0.49
p-value 0.43 0.36 0.02 0.0001
Source: Government of Zambia and LCMS 1996

80 Decentralization of the Health System in Zambia
Table 58. Percent Allocated to Drugs 1995-1998 by Weighted District Urbanization Quintiles
Urbanization
Quintiles
1995 1996 1997 1998
1
st
(most rural) 1.12 0.65 0.95 1.41
2
nd
1.02 2.08 0.93 1.28
3
rd
6.71 1.65 1.51 0.90
4
th
4.05 1.86 2.53 1.90
5
th
(most urban) 1.21 2.80 3.07 4.16
5
th
/1
st
1.08 4.33 3.23 2.95
Correlation Coeff. -0.09 0.31 0.23 0.65
p-value 0.51 0.03 0.10 0.0001
Source: Government of Zambia and LCMS 1996
Table 59. Percent Allocated to Drugs 1995-1998 by Weighted District Income Quintiles
Income Quintiles 1995 1996 1997 1998
1
st
(poorest) 1.97 0.98 0.90 1.03
2
nd
3.89 1.73 1.00 1.16
3
rd
0.73 1.82 1.78 2.33
4
th
2.54 2.18 2.58 3.17
5
th
(wealthiest) 4.99 2.32 2.71 1.94
5
th
/1
st
2.54 2.36 3.00 1.88
Correlation Coeff. 0.2520 0.2025 0.11 0.1123
p-value 0.08 0.16 0.45 0.44
Source: Government of Zambia and LCMS 1996
Table 60. Regression of Percent Allocated to Drugs 1996 and 1998
Dependent Variable Drugs
Total N N=100 Districts
Independent Variables Coeff. T
Income 0.004 1.25
Urbanization -0.263 -0.07
Education 0.201 0.34
Access -0.008 -0.11
Children Under 5 yrs -24.91* -2.11
Population 0.0003* 2.85
Year -6.16* -3.07
Constant -43.55* -2.30
R-square 0.7112
p-value 0.02
* |t| >2.00 ** 1.5<|t| <2.0

Annex A: Additional Tables and Figures 81
Table 61. Outpatient Utilization Per Capita 1995-1998 by Population Quintiles
Population Quintiles 1995 1996 1997 1998
1
st
(smallest) 1.08 0.77 0.59 1.05
2
nd
1.16 1.01 1.35 1.04
3
rd
0.92 0.85 0.62 0.90
4
th
1.24 0.95 0.92 0.77
5
th
(largest) 1.46 1.17 1.02 0.88
5
th
/1
st
1.35 1.52 1.75 0.85
Correlation Coeff. 0.14 0.25 -0.10 -0.33
p-value 0.36 0.33 0.68 0.11
Source: Government of Zambia and LCMS 1996
Table 62. Outpatient Utilization Per Capita 1995-1998 by Weighted District Urbanization Quintiles
Urbanization
Quintiles
1995 1996 1997 1998
1
st
(most rural) 1.29 1.17 0.94 0.89
2
nd
0.84 0.76 0.89 1.00
3
rd
1.06 0.86 1.17 0.90
4
th
1.22 0.93 0.80 0.68
5
th
(most urban) 1.37 1.10 0.94 1.21
5
th
/1
st
1.06 0.94 1.00 1.36
Correlation Coeff. 0.12 0.08 -0.05 0.06
p-value 0.46 0.76 0.83 0.78
Source: Government of Zambia and LCMS 1996
Table 63. Outpatient Utilization Per Capita 1995-1998 by Weighted District Income Quintiles
Income Quintiles 1995 1996 1997 1998
1
st
(poorest) 1.01 0.99 1.05 0.93
2
nd
1.10 0.98 1.01 1.05
3
rd
1.14 0.90 0.88 0.75
4
th
1.58 0.95 0.88 0.87
5
th
(wealthiest) 1.01 0.85 0.93 0.98
5
th
/1
st
1.00 0.86 0.88 1.06
Correlation Coeff. 0.12 -0.13 -0.12 -0.04
p-value 0.44 0.63 0.58 0.85
Source: Government of Zambia and LCMS 1996

82 Decentralization of the Health System in Zambia
Table 64. Regression of Outpatient Utilization Per Capita 1996 and 1998
Dependent Variable Outpatient
Total N N=42 Districts
Independent Variables Coeff. t
Income 0.010 1.19
Urbanization 0.22 0.06
Education 0.48 0.68
Access -0.04 -0.90
Children Under 5 yrs 9.73 0.43
Population ---- -----
Year 1.00 0.34
Constant -6.45 -0.49
R-square 0.9267
p-value 0.5977
* |t| >2.00 ** 1.5<|t| <2.0
Table 65. Percent Immunization Coverage of DPT3 1995-1998 by Population Quintile
Population Quintiles 1995 1996 1997 1998
1
st
(smallest) 76.2 76.4 70.37 41.55
2
nd
78.8 69.0 71.0 58.75
3
rd
76.5 81.9 75.25 61.111
4
th
89.7 104.6 74.2 73.33
5
th
(largest) 86.6 94.1 66.1 76.11
5
th
/1
st
1.14 1.26 0.93 1.83
Correlation Coeff. 0.06 0.32 0.05 0.16
p-value 0.67 0.02 0.76 0.33
Source: Government of Zambia and LCMS 1996
Table 66. Percent Immunization Coverage of DPT3 1995-1998 by Weighted District Urbanization
Quintiles
Urbanization
Quintiles
1995 1996 1997 1998
1
st
(most rural) 93.8 81.4 83.33 63.75
2
nd
78.0 73.7 69.13 38.88
3
rd
71.5 84.9 51.86 74.11
4
th
84.0 93.9 64.0 63.57
5
th
(most urban) 80.5 92.1 82.3 71.38
5
th
/1
st
0.89 1.13 0.98 1.12
Correlation Coeff. -0.01 0.20 0.13 0.18
p-value 0.96 0.17 0.40 0.26
Source: Government of Zambia and LCMS 1996

Annex A: Additional Tables and Figures 83
Table 67. Percent Immunization Coverage of DPT3 1995-1998 by Weighted District Income
Quintiles
Income Quintiles 1995 1996 1997 1998
1
st
(poorest) 80.6 66.5 64.57 54.56
2
nd
87.5 96.1 55.75 69.0
3
rd
66.3 79.8 68.5 52.75
4
th
86.3 97.2 71.9 69.33
5
th
(wealthiest) 87.1 86.4 90.0 69.14
5
th
/1
st
1.08 1.30 1.39 1.26
Correlation Coeff. 0.05 0.01 0.15 0.11
p-value 0.70 0.93 0.32 0.51
Source: Government of Zambia and LCMS 1996
Table 68. Percent Immunization Coverage of DPT3 1996 and 1998
Dependent Variable DPT3 Coverage
Total N N=90 Districts
Independent Variables Coeff. T
Income -0.04 -0.68
Urbanization 137.41 1.22
Education 13.10 1.10
Access 1.14 0.96
Children Under 5 yrs 318.61* 1.63
Population 0.002 1.33
Year -3.82 -0.12
Constant -594.37* -1.93
* |t| >2.00 ** 1.5<|t| <2.0
Table 69. Immunization Coverage for Measles 1995-1998 by Population Quintile
Population Quintiles 1995 1996 1997 1998
1
st
(smallest) 71.50 74.90 62.88 51.22
2
nd
80.10 71.40 69.00 69.00
3
rd
77.70 83.20 73.25 73.25
4
th
93.50 111.80 64.70 64.70
5
th
(largest) 86.20 106.20 66.60 66.60
5
th
/1
st
1.21 1.42 1.06 1.30
Correlation Coeff. 0.19 0.47 0.20 0.17
p-value 0.20 0.0005 0.19 0.29
Source: Government of Zambia and LCMS 1996
Table 70. Immunization Coverage for Measles 1995-1998 by Weighted District Income Quintiles
Urbanization
Quintiles
1995 1996 1997 1998
1
st
(most rural) 89.8 86.9 74.555 74.375
2
nd
76.8 81.1 63.25 46.5
3
rd
70.6 72.9 51.42857 71.1111
4
th
86.5 94.9 58.11 72.4285
5
th
(most urban) 85.3 111.7 82.5 75.63
5
th
/1
st
0.95 1.29 1.11 1.02
Correlation Coeff. 0.004 0.25 0.07 0.17
p-value 0.98 0.08 0.65 0.30
Source: Government of Zambia and LCMS 1996

84 Decentralization of the Health System in Zambia
Table 71. Immunization Coverage for Measles 1995-1998 by Weighted District Income Quintiles
Income Quintiles 1995 1996 1997 1998
1
st
(poorest) 82.2 67.6 62.3 65.8
2
nd
84.1 84.1 54.9 71.0
3
rd
63.5 88.0 67.25 57.3
4
th
93.4 122.6 65.4 73.1
5
th
(wealthiest) 85.8 85.2 81.8 73.4
5
th
/1
st
1.04 1.26 1.31 1.12
Correlation Coeff. 0.10 0.29 0.27 0.11
p-value 0.51 0.04 0.08 0.52
Source: Government of Zambia and LCMS 1996
Table 72. Regression of Immunization Coverage for Measles 1996 and 1998
Dependent Variable Measles
Total N N=100 Districts
Independent Variables Coeff. t
Income -0.05 -0.82
Urbanization 135.80 0.98
Education 17.17 1.18
Access -0.29 -0.20
Children Under 5 yrs 84.17 0.35
Population 0.001 0.58
Year -33.20 -0.83
Constant -407.01 -1.08
R-square 0.7389
p-value 0.0583
* |t| >2.00 ** 1.5<|t| <2.0

Annex A: Additional Tables and Figures 85
Figure 10. Sample Districts: Percent Allocated to District Offices
Percent Allocated to District Offices
0
20
40
60
80
1995 1996 1997 1998
Year
Percent
Mumbwa
Chinsali
Isoka
Solwezi
Katete
Petauke
Kaoma
Mongu
Avg. Nat.

86 Decentralization of the Health System in Zambia
Figure 11. Sample Districts: Percent Allocated to District Hospitals
Percent Allocated to District Hospitals
0.00
20.00
40.00
60.00
80.00
1995 1996 1997 1998
Year
Percent
Mumbwa
Chinsali
Isoka
Solwezi
Katete
Petauke
Kaoma
Mongu
Avg. Nat.

Annex A: Additional Tables and Figures 87
Figure 12. Sample Districts: Percent Allocated to Health Centers
Percent Allocated to Health Centers
0
20
40
60
80
100
1995 1996 1997 1998
Year
Percent
Mumbwa
Chinsali
Isoka
Solwezi
Katete
Petauke
Kaoma
Mongu
Avg. Nat.

88 Decentralization of the Health System in Zambia
Figure 13. Sample Districts: Percent Allocated to Communities
Percent Allocated to Communities
0
10
20
30
40
1995 1996 1997 1998
Year
Percent
Mumbwa
Chinsali
Isoka
Solwezi
Katete
Petauke
Kaoma
Mongu
Avg. Nat.

Annex A: Additional Tables and Figures 89
Figure 14. Sample Districts: Percent Allocated to Personnel Costs
Percent Allocated to Personnel Costs
0
20
40
60
1995 1996 1997 1998
Year
Percent
Mumbwa
Chinsali
Isoka
Solwezi
Katete
Petauke
Kaoma
Mongu
Avg. Nat.

90 Decentralization of the Health System in Zambia
Figure 15. Sample Districts: Percent Allocated to Drug Costs
Percent Allocated to Drugs Only
0
2
4
6
8
10
1995 1996 1997 1998
Year
Percent
Mumbwa
Chinsali
Isoka
Solwezi
Katete
Petauke
Kaoma
Mongu
Avg. Nat.

Annex A: Additional Tables and Figures 91
Figure 16. Sample Districts: Number of Outpatient Visits Per Inhabitant Per Year
outpatient visits/inhabitant
0
0.2
0.4
0.6
0.8
1
1.2
1.4
1.6
1.8
2
93 94 95 96 97 98 99 proj
Kaoma
Katete
Mongu
Mumbwa
Petauke
Siavonga
Chinsali
Isoka
Solwezi
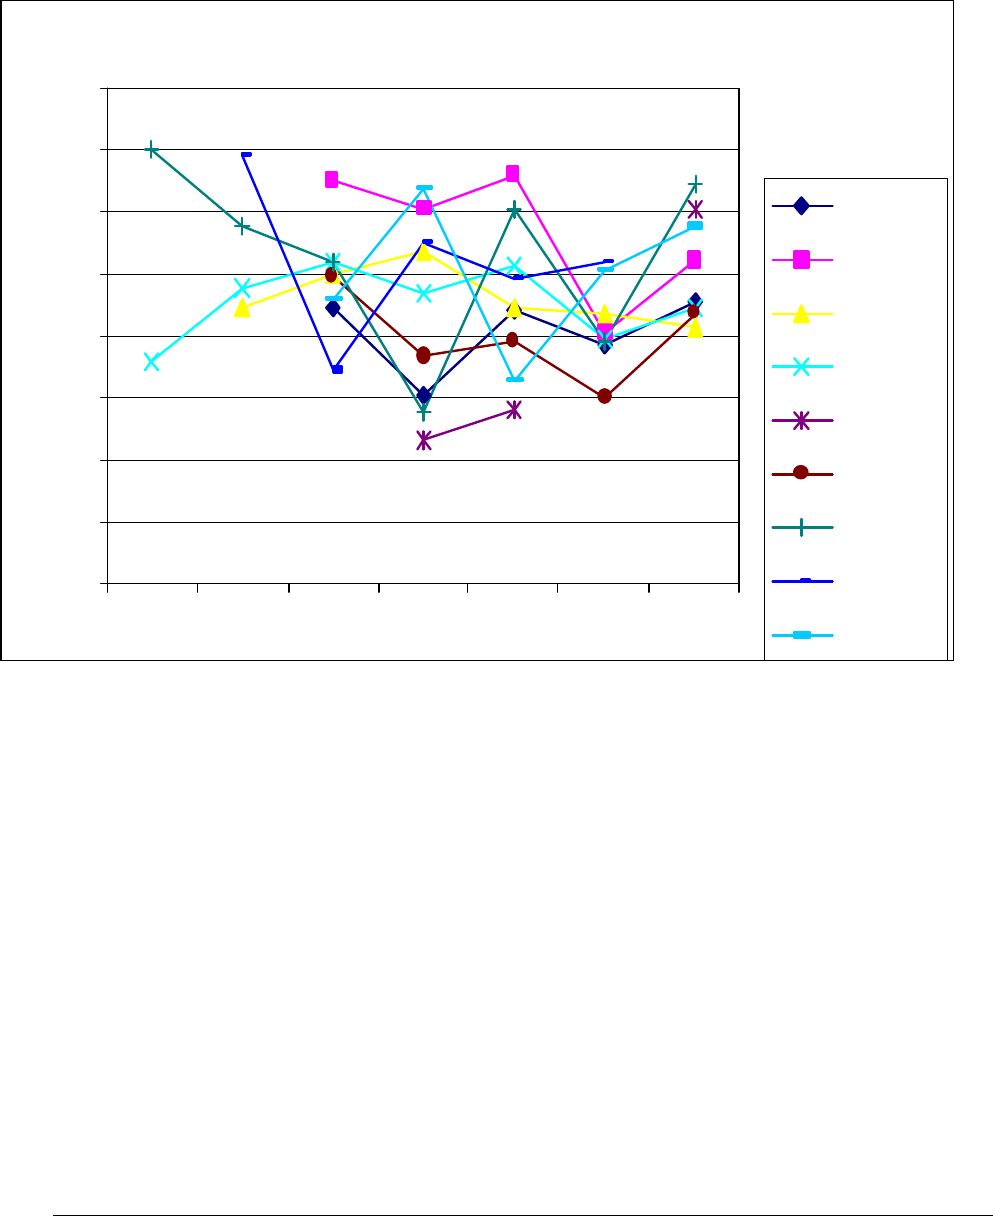
92 Decentralization of the Health System in Zambia
Figure 17. Sample Districts: BCG Coverage (First BCG Per Child under 1 Year Old)
BCG coverage
0%
20%
40%
60%
80%
100%
120%
140%
160%
93 94 95 96 97 98 99 proj
Kaoma
Katete
Mongu
Mumbwa
Petauke
Siavonga
Chinsali
Isoka
Solwezi

Annex A: Additional Tables and Figures 93
Figure 18. Sample Districts: Percentage of Children under 1 Year Fully Immunized
Fully immunized %
0%
20%
40%
60%
80%
100%
120%
140%
160%
93 94 95 96 97 98 99 proj
Kaoma
Katete
Mongu
Mumbwa
Petauke
Siavonga
Chinsali
Isoka
Solwezi

94 Decentralization of the Health System in Zambia
Figure 19. Sample Districts: Assisted Deliveries Per Expected Deliveries
% assisted deliveries (all levels)
0%
10%
20%
30%
40%
50%
60%
70%
93 94 95 96 97 98 99 proj
Kaoma
Katete
Mongu
Mumbwa
Petauke
Siavonga
Chinsali
Isoka
Solwezi

Annex A: Additional Tables and Figures 95
Figure 20. Sample Districts: Number of Family Planning Visits Per Women in Reproductive Age
Per Year
FP visits/Women in reproductive age/yr
0
0.05
0.1
0.15
0.2
0.25
0.3
0.35
0.4
0.45
0.5
93 94 95 96 97 98 99 proj
Kaoma
Katete
Mongu
Mumbwa
Petauke
Siavonga
Chinsali
Isoka
Solwezi

Annex C: Bibliography 97
Annex B: Explanation of Data Bases and
Variables
1. Financial, Administrative, and Management Information System (FAMS)
The Financial, Administrative, and Management Information System (FAMS) of the Central Board of
Health (CBOH) was the first subsystem of the Health Management Information System (HMIS) to be
implemented soon after the formation of the Health Reform Implementation Team (HRIT) in 1994. The
primary reason for the early implementation of FAMS was based on the fact that the financial support to
the district through the “basket,” or system, of pooled resources entailed that a number of the donor
community commit themselves to a decentralized process of district financial support even before
decentralization was legally institutionalized. This was on the understanding that the next step in the
process remain the formal institutionalization of the District Health Boards (DHBs) following the
appointment of the District Health Management Teams (DHMTs).
The decentralization of the funding mechanism was one of the major acts of the reform. However, it
was also realized that this gave the DHMTs the enormous responsibility of handling the funds.
Additionally, it raised the issue of transparency for the entire health system as funds had to flow from the
center to the districts. The support to the district health system in this manner focused on the development
of an appropriate accounting and financial framework for the accountability of the funds and transparency
of the system. In this context a complete financial model of accounting was developed that was based on
Danish financial systems, but was more or less universally acceptable in its use of international
accounting standards. The problem was developing the capacity of human resources (accountants) in the
public sector to adequately handle the financial functions. Nevertheless, basic bookkeeping functions
were reasonably developed. As the emphasis was on the ability to perform these functions manually
before switching to computerized systems, the accountants had to develop these skills. Again, an
innovative training program was quickly developed in modular basis and was contracted to one of the
country’s accounting schools.
In this way, FAMS manages to capture critical revenue and expenditure data and is able to at least
reflect the actual financial position in terms of cash inflows and cash outflows. In accordance with the
FAMS requirements, the DHMTs are required to prepare monthly and quarterly financial statements,
which are used as the basis for monitoring and evaluating the districts’ financial performance and provide
input to the donor-Government Republic of Zambia (GRZ) basket steering committee for the health
sector.
Inappropriate financial expenditures are tracked not only through the financial statements but through
internal and external audits of the district financial performance. Lack of resources does not allow this to
be executed across the board, yet the selective approach seems to function sufficiently to ensure that there
is accountability and accuracy in the financial reporting system and financial reports.
The HMIS generates other performance data relating to service delivery. These performance reports
together with the financial reports constitute the basis for funding of district services following the
contracting process at the end of the year. In the past, if the financial reports were found inadequate,
sanctions were stringently enforced with respect to the disbursement of funds. However, emphasis is now

98 Decentralization of the Health System in Zambia
being put on administrative decisions and support through the internal financial audit office and
provincial offices.
Financial Reporting
FAMS collects data through the districts’ monthly and quarterly financial reporting to the CBOH.
This is the last stage in the process. The data collection begins at the district level. The health centers
prepare monthly revenue and expenditure schedules, which are sent to the district office. These schedules
include any health center that may be privately owned under the Churches Medical Association of
Zambia. They also include any of the district hospital’s expenditures. It is the districts’ responsibility to
aggregate all the data and report on the overall bank status as well as to bank all funds under their
responsibility.
FAMS Variables Used in Analysis
Sources of District Income
The district incomes are decomposed into the following:
> Donor disbursements from CBOH
> GRZ disbursements from the Ministry of Health (MOH) to CBOH
> Medical revenues from cost-sharing fees from the districts (hospitals and health centers).
CBOH provided the grants disbursements on actual total disbursements to the districts from both
donors and GRZ. CBOH further provided the medical revenues, as collected through the district financial
reports to CBOH. Although there may be errors in the reporting, the financial statements are not used to
fund the districts until they are assumed to present a satisfactory state of the district’s financial affairs
according to the internal auditors at CBOH. External auditors annually audit accounts on a selective basis.
From these accounts, therefore, the district financial reports provide the only reliable source of the
medical revenues as generated by the health facilities (health centers and hospitals) in the district.
District Income per Capita
The district income or revenue per capita is the total sum of all GRZ, donor, and medical fees divided
by the district population (see below for a note on the district population).
District Health Expenditures
As mentioned, district expenditures are derived from district financial reports that are submitted on a
quarterly basis to CBOH. This quarterly submission or financial and management reporting is part of the
accountability process of the financial and administrative monitoring necessary for management decision
making at the center and it conforms with the objectives and aspirations of decentralization. In addition to
serving this function, the Basket Steering Committee uses the district financial and performance reports to
assess district performance. The Basket Steering Committee monitors and evaluates district performance
for accountability and transparency. This committee is comprised of members and observers from all
donor organizations participating in the health sector in the country.

Annex C: Bibliography 99
Total health expenditures therefore comprise all district expenditures that are channeled through the
district office as planned in the district action plan and the district health budget of the DHB and DHMT.
Health expenditures not included in the DHMT and DHB budget are therefore not captured for CBOH
reporting purposes. In this instance, some expenditures from vertical programs are not part of the action
plan and budget and are not, therefore, captured.
District health expenditures on a per capita basis equal the district’s total expenditures divided by the
total population of the district.
Population
The populations CBOH used for district purposes are as given by the Central Statistical Office (CSO),
the official government statistical office. Any variations are therefore attributable to the source. (**Note:
CSO has been using projections for the population and is due to carry out a population census).
Population figures for 1996 were used to calculate the population quintiles for the bivariate analysis. The
smallest district had a population of 40,636 while the largest district had a population of 793,743. The
mean population for all 50 districts used in the analysis was 153,478.
Expenditures by Item
Resource allocations are made by function and are reported under personnel expenses, allowances,
capital expenses, fuel and transportation, and drug and medical supplies. They are also reported under the
district office, health center, hospital, and community.
Personnel expenditures - These expenditures are for full-time employees of the boards, which
mostly include the daily classified employees (mainly nonprofessional, nontechnical, unskilled help).
Also included on a minor level are some full-time professional and technical staff who have been
employed directly by the boards.
Allowances - Allowances pertain to the amount paid per diem for payments or subsistence
allowances. Other allowances may include payments in lieu of housing and education for child/school
support.
Capital expenses – This is an expenditure on investments and assets.
Fuel and transportation – These are expenses incurred on motor vehicles and other forms of
transportation.
Drug and medical supplies – The districts can spend funds to obtain emergency drug and
medical supplies in cases of shortages, and these expenses are reported here.
Expenses not allocated to the service levels within the districts – These expenses are reported
under the following service areas:
> District Office – for administrative costs
> Health Centers
> District Hospital(s)

100 Decentralization of the Health System in Zambia
> Contracting – for the purchase or contracting of first-level district health care in the event a
district does not have a district hospital or may seek additional services.
> Community – support for social mobilization and community support programs, mainly in the
areas of prevention and promotion.
Primary health services – Primary health services is the sum of expenditures for district
hospitals or first-level referral hospitals, district offices, and health centers
Data Trend
Data are available for the period between 1992 and 1998. For consistency and reliability, however,
only data for the period 1995 to 1998 were used.
Reliability of Financial Data from 1992-1998
The financial data for 1992 to1993 are average data by provinces and are not disaggregated to the
district level. This is simply in conformity to the reporting system that existed at that particular time. The
district health services were funded by a voucher system. The districts held only an insignificant amount
of funds on an imprest basis. All district expenditures were facilitated through a voucher or requisition
requests to the provincial medical officer’s office and the provincial accounting office. The requisitions
would then be serviced depending on the provincial priorities. The provincial priorities were intersectoral
catering for all government ministries. Only national level data could be provided for 1992 to 1993 (see
Tables 5 and 6).
Data for 1993 to 1994 are not complete. This time period covered a particular trial period for some of
the districts regarding the disbursement of resources. The remaining districts continued to be funded
through the provincial system.
Thus, the most reliable data available from the records that covered the new financing paradigm shift
were from 1995 onward. Not all districts reported financial data for all four years (1995-1998), since the
new system was still being implemented. For this reason, only those districts (50 in all) that reported
financial data for all four years were used. A list of the districts used can be obtained from the authors.
Annual data for these 50 districts for all the years under consideration are complete. As mentioned,
the disbursement of the funds was initially done through the forerunner to CBOH, the HRIT/MOH.
Expenditure Data
Expenditure data have been consistently available during the period 1995 to 1998.
Revenue (or Income) Data
Revenue or income data have not been complete during this period. Only part of the revenue data is
available for 1996. However, for purposes of analysis in this study, only data from 1997 to 1998 were
considered. This is due to the fact that the most complete revenue data, in terms of disbursements to the
districts, were available during this period. The data include all donor and GRZ disbursements to the
districts in the “district basket,” which is a sum total of the district grants. The 50 districts that reported
revenue data for 1997 to 1998 were used in the analysis.

Annex C: Bibliography 101
Health Management Information System
The HMIS in Zambia has been developed as the key information line of the health reform process.
The burden of disease in Zambia was assessed using the Disability Adjusted Life Years methodology.
The results of this analysis led to the delineation of six priority areas for health services. These six areas
are intended to address the major sources of the burden of disease in Zambia. Focusing the delivery of
health services on these six priority areas is viewed as the most cost-effective way to reduce the burden of
disease. The six areas are malaria; maternal health and family planning; HIV/AIDS and sexually
transmitted diseases; child health; tuberculosis; and water and sanitation.
HMIS indicators have been divided into six categories, or subsystems. The HMIS monitors health
status and service utilization related to the six priority areas through the health subsystem. Other aspects
of the reform process are supposed to be monitored through four other subsystems that focus on the
availability and efficient utilization of resources that support health service delivery. These four
subsystems are finance; human resources; drugs and supplies; and assets. A sixth subsystem,
performance, has been integrated into the health and service utilization component of HMIS.
The HMIS is a routine monitoring system. It relies on data that are regularly collected during routine
operations of the health system. The HMIS plays a very specific role in the monitoring and evaluation
process; the role of the HMIS in overall monitoring and evaluation is to provide warning signals. It does
not provide all of the information that is required to respond to these signals. Responding to the HMIS
warnings requires further investigation of the problem; this investigation may include gathering
information from other sources, like sentinel surveillance systems, or it may require special studies or
surveys.
Note that sentinel surveillance systems have been partially incorporated into the HMIS since 1998
and that through HMIS other research studies should filter through the system.
The HMIS has been tuned to reflect two other aspects of service delivery emphasized by the health
reforms: decentralization and accountability. The previous information system reflected the earlier top-
down management style; data were collected and forwarded to the central Ministry offices, without
analysis by or response from the health workers who gathered the data and provided the services. An
essential criterion for selecting indicators in the HMIS is that the information directly facilitates active
response at all levels of the delivery system.
The HMIS indicators have also been adjusted to conform to World Health Organization (WHO)
standard indicators as presented in Catalogue of Health Indicators: A selection of important health
indicators recommended by WHO programmes (Geneva, August 1996).
The HMIS analytic framework aims at rapid, action-oriented problem solving to improve the quality
of service; the framework distinguishes two major categories of causal factors. On one hand, there are
health needs factors, which influence the demand for services. On the other hand, there are the service
delivery factors, which influence the supply of services.
Examples of health needs factors are demographic and epidemiological conditions:
> Demographic – composition of the population and changes due to population growth and
migration

102 Decentralization of the Health System in Zambia
> Epidemiological – seasonal patterns of the disease, epidemic spread of some diseases, and
development of drug resistance.
Examples of service delivery factors include the following:
> Availability of services, especially regarding distances to health institutions
> Accessibility of services, due to temporary closure, patient fees, etc.
> Acceptability of services, due to cultural factors, gender issues, etc.
> Quality of supplies and equipment; for example, drug shortages
> Performance of staff; for example, capacity to diagnose correctly.
A Note on Outpatient Data
One of the variables this analysis used from the HMIS was the level of outpatient services offered per
capita. The study found very low reporting in working with this variable. In 1995, only 43 of the 50
districts reported information on outpatient services. In 1996, only 17 of the 50 reported such information;
in 1997, 24 of 50; and in 1998, 25 of 50.
A Note on Immunization
Certain immunization variables were used in the analysis. Of all the variables available, the
information on measles and diphtheria, pertussis, and tetanus (DPT3) was found to be most reliable. The
data on BCG, Oral Polio vaccine (OPV), and the total number of immunized children were insufficient.
Immunization statistics have always been compiled by the Department of Reproductive Health in the
MOH. The reporting system on immunization was, therefore, not a part of the Health Statistics Unit in
MOH, although it reported to this unit. After the restructuring of MOH and the creation of CBOH and the
HMIS within the Directorate of Monitoring and Evaluation, which occurred during 1996-1997, there was
a lapse in the central collection, compilation, and analysis of data, and this led to the gap in the reported
statistics on health. However, because of the immunization reporting system, immunization data were not
affected. In terms of performance, however, informal explanations have stated that the decline in
immunization performance during 1991–1993/94 in particular was due to the partial breakdown in the
social mobilization programs that targeted mothers.
Living Conditions Monitoring Surveys
The 1996 and 1998 Living Conditions Monitoring Surveys (LCMS) were used to extract district-level
data based on household information. Five explanatory variables were used:
> Average household income at the district level
> Percent of the district considered urban
> Average household level of education for the district
> Average distance to the nearest health facility for each district

Annex C: Bibliography 103
> Percent of the district population under five years of age.
Each variable was assessed at the household level, weighted according to the LCMS weighting
criteria, and then averaged over the district.
2
The CSO delineates the districts into Census Survey Areas
(CSAs) and Standard Enumeration Areas (SEAs), and the districts are designated urban or rural. Each
CSA is made up of about three SEAs. The sampling frame for the 1996 LCMS had 4,193 CSAs and
12,999 SEAs.
Household income – Household income was calculated by totaling the income received from the sale
of all items related to food and animal products and combining this amount with reported gross monthly
salary plus allowances, gross monthly salary in kind, nonregular allowances, income from rent, and
income from other sources. These figures are given in kwacha/month. In 1996, figures were weighted
according to the weighting variable given within the initial roster section of the LCMS 1996, and in 1998,
according to the weighting variable within the income section of the LCMS 1998. Income quintiles were
calculated based upon the district income for 1996. Table 73 shows the range of values for the income
quintiles.
Table 73. Range of Values for District Income Quintiles (1996)
Quintiles Mean Standard
Deviation
Min. (Kwa) Max. (Kwa)
1
st
8314.32 2845.17 3891.07 12070.70
2
nd
16331.38 2587.03 12355.71 20578.74
3
rd
28896.67 2069.52 26103.53 32455.96
4
th
43243.89 7790.31 32467.53 52215.66
5
th
159311.20 155905.20 59482.02 459539.60
National Avg. 51219.49 87191.26 3891.07 459539.60
Urbanization – The level of urbanization was based on the percent of the district considered
“urban” according to the 1990 Census of Population and Housing. The CSO makes this designation and
then delineates the districts into CSAs and SEAs. Each household was designated urban or rural based on
this decision. The districts are comprised of 4,193 CSAs, of which 3,231 are rural and 962 are urban
(1996 LCMS). The level of urbanization was weighted according to the weighting variable provided in
the roster section of both the 1996 and 1998 LCMSs. Table 74 shows the urbanity statistics for each
quintile.
Table 74. Range of Values for Urbanization Quintiles (1996)
Quintiles Mean Standard
Deviation
Min. (Kwa) Max. (Kwa)
1
st
3.07 1.93 0.00 05.35
2
nd
7.05 0.90 5.48 08.49
3
rd
10.24 1.65 8.56 12.84
4
th
18.75 4.53 13.04 25.24
5
th
78.60 25.02 26.93 100.00
National Avg. 23.54 30.34 0 100.00
2
Each variable was weighted according to the weighting variables available in its corresponding interview
section. If a weighting variable was not available for that section, the weighting variable from the roster section
of the LCMS was used.

104 Decentralization of the Health System in Zambia
Education level – The average level of education was taken from the education sections of the
1996 and 1998 LCMSs and is based on the highest grade attained by those who have attended but are not
currently in school. The average district education level was 6.29 years for 1996 and 6.86 years for 1998.
Access to health facilities – In order to assess access to health facilities, researchers figured the
distance to the nearest health clinic in kilometers. These data were taken from section 9 of the 1998
LCMS and section 4 of the 1996 LCMS. Responses of “do not know” and “not applicable” were
eliminated from the sample before any averaging or weighting was calculated. The average distance to a
health facility for districts in 1996 was 7.5 km and in 1998, 7.0 km.
Percent of children under age five – The percent of children in each
district under age five was calculated based on the number of children under age five reported at the
household level. The average number of children under age five in 1996 was 19.27 percent and the
average in 1998 was 4.08 percent.

Annex C: Bibliography 105
Annex C: Bibliography
Atkinson, Sarah, Jacob Songsore, and Edmundo Werna, eds. 1996. Urban Health Research in Developing
Countries: Implications for Policy. London: CAB International.
Bates, J. 2000. Implications of health sector reform for contraceptive logistics: A preliminary assessment
for SubSaharan Africa. Arlington, VA: Family Planning Logistic Management Project. John Snow,
Inc.
Berman, Peter. 1995. Health Sector Reform: Making Health Development Sustainable. In Berman, Peter.
(ed.). Health Sector Reform in Developing Countries. Boston: Harvard University Press.
Berman, Peter, Kasirim Nwuke, Ravindra Rannan-Eliya, and Alast Mwanza. 1995. Zambia: non-
governmental health care provision. Boston: Unpublished project report, Data for Decision-Making,
Harvard University/RTI/USAID.
Bossert, T. 1998a. MAR Concept Paper: Decentralisation of health systems: Priority setting, allocation
and performance. Unpublished project report for Partnerships for Health Reform Major Applied
Research Program.
———. 1998b. Analysing the decentralisation of health systems in developing countries: Decision space,
innovation and performance. Social Science Medical Journal, 47(10): 1513 –1527.
———. 1999. Decentralisation of the Zambian Health Sector. Terms of Reference and Research
Proposal. Unpublished project report for Partnerships for Health Reform Major Applied Research
Program.
———. 1999. Draft report on decentralisation. Zambia.
———. 2000. Decentralization of health systems in Latin America: A comparative study of Chile,
Colombia, and Bolivia. Boston: Data for Decision Making Project, Harvard School of Public Health.
Bossert T., M. Chawla, D. Bowser, U. Giedion, J. Arbelaez, and A. Lopez 2000. Applied Research on
Decentralisation of Health Systems in Latin America: Colombia Case Study. Boston: Data for
Decision Making Project, Harvard School of Public Health.
Bossert T., O. Larranaga, A. Infante, J. Beauvais, E. Consuelo, and D. Bowser. 2000. Applied Research
on Decentralisation of Health Systems in Latin America: Chile Case Study. Boston: Data for
Decision Making Project, Harvard School of Public Health.
Bossert T., F. Ruiz Mier, S. Escalante, M. Cardenas, B. Buissani, K. Capra, and D. Bowser. 2000.
Applied Research on Decentralisation of Health Systems in Latin America: Bolivia Case Study.
Boston: Data for Decision Making Project, Harvard School of Public Health.
Bratton, Michael and Beatrice Liatto-Katundu. 1994. A focus group assessment of political attitudes in
Zambia. African Affairs 93: 535-563.

106 Decentralization of the Health System in Zambia
Bwalya, Mac Trevor. 1998a. State to spend $40 million on health centres. The Daily Mail, June 8, 1998.
———. 1998b. UTH workers divided over strike. The Daily Mail, June 10, 1998.
Cassels A. 1996. Reform of the Health Sector in Ghana and Zambia: Commonalities and Contrasts. WHO
SHS paper no. 11. Geneva: World Health Organization.
———. 1997. Health Sector Reform: Key Issues in LDCs, Geneva: World Health Organization.
Central Board of Health, Zambia. 1991-1999. Various immunisation reports. Lusaka, Zambia.
———. 1994-1999. Various financial reports. Lusaka, Zambia.
———. 1995-1999. District action plans. Lusaka, Zambia.
———. 1998. Health management information system data. Lusaka, Zambia.
———. 1999. District health planning guide, vol.1. Lusaka, Zambia.
———. 1998. District health planning guide, vols. I, II. July 1998. Lusaka, Zambia.
Chikulo, B.C. 1982. The reorganization of Zambian local government: an analysis of the implications of
the Local Administration Act of 1980. Africa Quarterly 22(3): 49-61.
———. 1981. The Zambian administrative reforms: an alternative view. Public Administration and
Development 1(1): 55-65.
Ciardi, Paola. 1997. Socio-cultural dimensions: the vision and the community partnership programme. In
Comprehensive Review of the Zambian Health Reforms, 1997. Volume II: Technical Reports.
Center for International Health Information. 1996. Zambia: health statistics report. (www.cihi.com).
Collins, C. and A. Green. 1994. Decentralization and primary health care: some negative implications in
developing countries. International Journal of Health Services 24(3): 459-475.
Comprehensive review of the Zambian health reforms. 1997. Volumes I, II, III. May 1997. Unpublished
report, prepared by a joint working group from WHO, UNICEF, the World Bank, and the Zambian
Ministry of Health.
Curreri, Shannon. 1998. Implementation of essential health package policies at the district level in
Zambia. Unpublished manuscript.
Daura, Maureen, Musa Mabandlha, Kamima Mwanza, and Sara Bennett. 1998. An evaluation of district-
level cost sharing schemes. Draft report prepared for CBOH meeting on cost sharing. March 13-14,
1998.
Dresang, Dennis L. 1975. The Zambia Civil Service. Nairobi: East Africa Publishing House: Nairobi.
Fielden, Rachel and Ole Frank Nielsen. 1998. Immunization and health reform: Making reforms work for
immunization. A Reference Guide. Geneva: WHO/GPV/EPI.

Annex C: Bibliography 107
Foltz, Anne-Marie. 1997. Policy analysis. Comprehensive Review of the Zambian Health Reforms.
Volume II: Technical Reports.
Gertzel, Cherry (ed.). 1984. The Dynamics of the One-Party State in Zambia. Manchester: Manchester
University Press.
Hammer, J.S, and P. Berman. 1995. Ends and Means in Public Health Policy in Developing Countries.
Berman, P. (ed.). Health Sector Reform in Developing Countries.
Huddart, Jennifer and Esther Mbao. 1997. Human resources. In Comprehensive Review of the Zambian
Health Reforms (1997) Volume II: Technical Reports.
Kalumba K. 1997. Towards an Equity Oriented Policy of Decentralisation in Health Systems Under
Conditions of Turbulance: The Case of Zambia. Geneva: World Health Organization.
Kayumba, Liseli. 1998. UTH doctors resume work. The Post, June 4, 1998.
Kutzin J. 1997. Experience With Organisational and Functional Reform of the Health SHS. Paper No. 8.
Geneva: World Health Organization.
Lake, S., M. Daura, M. Mabandhla, F. Masiye, S. Mulenga, I. Antezana, C. Mwikisa, and S. Bennett.
2000. Analyzing the process of health financing reform in South Africa and Zambia. Zambia
Country Report. Major Applied Research 1, Technical Paper No. 2. Bethesda, MD: Partnership for
Health Reform, Abt Associates Inc.
Lisawaniso, Pelekelo. 1998. Hospital board quits. The Daily Mail, May 8, 1998.
Litvack, J., J. Ahmad, and R. Bird. 1998. Rethinking decentralization in developing countries.
Washington, DC: The World Bank.
Lungu, Gatian F. 1986. Mission impossible: integrating central and local administration in Zambia.
Planning and Administration 13(1): 52-57.
Lungu, Vivian and Mukubuta Kawete. 1998. Apologize, for what? – Luo. The Daily Mail, May 21, 1998.
Makinen, Marty. 1997. Health spending inequalities and government’s role in Zambia. DRAFT NOT
FOR CITATION. Partnerships for Health Reform, Abt Associates, Inc.
Mbanefoh, Gini F. 1997. Financing/resource utilization. In Comprehensive Review of the Zambian
Health Reforms (1997) Volume II: Technical Reports.
Mills, Anne. 1994. Decentralization and accountability in the health sector from an international
perspective: what are the choices? Public Administration and Development 14: 281-292.
Mills, Anne, J.P. Vaughan, D.L. Smith, and I. Tabibzadeh. 1990. Health System Decentralization:
Concepts, Issues and Country Experience. Geneva: World Health Organization.
Ministry of Finance and Economic Development. 1999. Economic Report, MoFED, Lusaka, Zambia.
———. 1992-1995. Various annual reports. Lusaka, Zambia.

108 Decentralization of the Health System in Zambia
Ministry of Health. 1998a. National health care financing policy. Directorate of Planning and
Development, 22 May 1998. Lusaka, Zambia.
———. 1998b. National Health Strategic Plan 1998-2000. Draft version 6, May 20, 1998. Lusaka,
Zambia.
———. 1998. Independent review of the Zambian health reforms. Technical Reports, vol. 1.
———. 1998. Independent review of the Zambian health reforms. Technical Reports, vol. 2.
———. 1998. Independent review of the Zambian health reforms. Technical Reports, vol. 3.
———. 1998b. Country health system profile. Zambia.
———/Health Reform Implementation Team. 1995. The National Health and Services Act 1995. Lusaka,
Zambia: Government Printers.
MoFED. July 1999. Macroeconomic Indicators. Lusaka, Zambia.
Momba, Jothan C. 1989. The state, rural class formation, and peasant political participation in Zambia:
the case of Southern Province. African Affairs 88(352): 331-357.
Mphaisha, Chisepo J.J. 1996. Retreat from democracy in post one-party state Zambia. Journal of
Commonwealth & Comparative Politics 34(2): 65-84.
Mpuku, Herrick C. and Ivan Zyuulu, eds. 1997. Contemporary issues in socio-economic reform in
Zambia. Brookfield, VT: Ashgate Publishing.
Mubiana, Sandra. 1998. UTH workers reject government’s ‘three months grace period’. The Post, June 9,
1998.
Mukwena, Royson M. 1992. Zambia’s Local Administration Act, 1980: a critical appraisal of the
integration objective. Public Administration and Development 12(3): 237-247.
Mwamba, Mutale. 1998. Luo tight-lipped over health board’s resignation. The Daily Mail, May 9, 1998.
Mwanza, Benjamin. 1998. UTH consultants fire warning shots. Times of Zambia, June 3, 1998.
Phiri, Patson. 1998. Luo blasts district health boards. The Sunday Mail, September 6, 1998.
Prud’homme, Rémy. 1995. The dangers of decentralization. The World Bank Research Observer 10(2):
201-220.
Rakodi, Carole. 1988. The local state and urban local government in Zambia. Public Administration and
Development 8: 27-46.
Rondinelli, D. 1981. Government decentralization in comparative perspective: Theory and practice in
developing countries. International Review of Administrative Science 47(2): 133-145.
Ruwe, Mathilda, Mubiana Macwangi, and Sarah Atkinson. 1996. Reforming health care provision in
Lusaka, Zambia. In Atkinson et al., eds. Pp. 93-114.

Annex C: Bibliography 109
Saltman B. R, Otter, von Casten (1992). Planned Markets and Public Competition: Sector. Strategic
Reform in Northern European Countries. England: St. Edmundsbury Press.
Simutanyi, Neo. 1996. The politics of structural adjustment in Zambia. Third World Quarterly 17(4): 825-
839.
Sukwa, T. and J. Chabot. 1997. Public health. In Comprehensive Review of the Zambian Health Reforms.
Vol. II: Technical Reports.
Sumaili, Fanuel and John T. Milimo. 1996. A report from the Participatory Assessment Group:
Assessment and Evaluation. In Comprehensive Review of the Zambian Health Reforms (1997)
Volume III.
Times Reporter. 1998a. Doctors overtime perks stay, says Luo. Times of Zambia, May 26, 1998.
———. 1998b. Doctors body battles to meet State. Times of Zambia, June 2, 1998.
———. 1998c. Health board members fired. Times of Zambia, September 11, 1998.
———. 1998d. Health union warns UTH. Times of Zambia, December 4, 1998.
———. 1998e. Kabwe nurses protest. Times of Zambia, December 10, 1998.
Tordoff, William. 1994. Decentralisation: comparative experience in commonwealth Africa. Journal of
Modern African Studies 32(4): 555-580.
———. ed. 1980. Administration in Zambia. Manchester: Manchester University Press.
Tordoff, William and Ralph A. Young. 1994. Decentralisation and public sector reform in Zambia.
Journal of Southern African Studies 20(2): 285-299.
United States Agency for International Development. 1995. Zambia child health project: draft project
paper. Project No. 611-0237.
Van Bergen, J.E.A.M. 1995. District health care between quality assurance and crisis management.
Tropical and Geographical Medicine 47(1): 23-29.
Visshedijk, J.H.M., I.M. Liywalii, and J.J.G. van Oosterhout. 1995. Pilot project for financial
decentralization in Senanga, Zambia. Tropical and Geographical Medicine 47(1): 39-42.
World Health Organization. August 1996. Catalogue of Health Indicators: A selection of important health
indicators recommended by WHO programmes. Geneva.
Zambia Consensus Building Initiative. 1996. Using political mapping for the sustainability in reforms in
the health sector, essential drugs, and user fees. Unpublished project report.
