
Customer Satisfaction
Survey 2022
Banking Industry
FEBRUARY 2023
1962-2022
Fresh Frontiers

‘Building customer experience
does not happen by accident.
It is by design’
CLARE MUSCUTT
The Banking Industry Customer Satisfaction Survey (BICSS) is conducted annually by the Kenya
Bankers Association (KBA) in collaboration with the KBA Customer Service Working Group,
whose membership is drawn from the banking sector. The publication seeks to contribute to the
banking industry’s eorts towards enhancing the quality of customer experience. Since its
inception in 2018, the Survey has continued to inform industry strategies towards
customer-centrism and ensuring access to financial services for all.
The 2022 BICSS coincides with the issuance of the ‘KBA Gold Standard of Bank Services in
Kenya’ report in 2023. The report is based on bank customers’ service feedback since the 2018
inaugural edition of the Survey. The handbook outlines minimum service standard expectations
and provides a comprehensive overview of global best practice recommendations on customer
service. It seeks to channel the banking public’s feedback into clear action points towards
embellishing customer service across banking service points besides informing responsive
product design.
Initiated in 2018, the BICSS is part of eorts being spearheaded by Kenya Bankers Association
(KBA) towards enhancing customer experience in the banking industry. Over the years, the
survey has continued to inform industry strategies towards customer-centrism and ensuring
access to financial services for all. This edition aims to build on these industrywide eorts by
addressing emerging needs.
About
this Survey
i KENYA BANKERS ASSOCIATION

In 2022, the Kenya Bankers Association (KBA) celebrated its 60th Anniversary — a Diamond
Jubilee that presented a fabulous opportunity to take stock of challenges and opportunities in
the economy. The commemoration rearmed the industry’s collective commitment to continue
creating innovative solutions towards enhancing the quality of products and services provided to
the banking public.
Importantly, the celebration also oered an occasion to reflect on strategies that can be
leveraged upon to sustain the banking industry’s longstanding vibrant resilience as part of
collective eorts towards deepening sustainable financial inclusion. In the spirit of the KBA 60
th
Anniversary, this Survey is geared towards sustaining the Kenyan banking industry’s resilience—
dating back to 1962— by informing initiatives designed to optimize the banking industry’s
contribution to the national socio-economic development agenda.
Celebrating
60 Years
1962-2022
Fresh Frontiers
BANKING INDUSTRY CUSTOMER SATISFACTION SURVEY 2022 II
Contents
The entire content of this publication is protected by copyright laws. Reproduction in part or
whole requires express written consent from the publisher. © Kenya Bankers Association, 2023
About this Survey
Celebrating 60 years
Survey Highlights
Foreword
Sampling Methodology
Demographic Distribution
a. Geographical location
b. Age
c. Gender
Multi-banking Trends
Overall Customer Experience
Customer Banking Channel Preference
Preferred Mode of Interaction when
Accessing Banking Services
Promoting Access to Banking services
for Persons with Special Needs
Customer Complaint Resolution
Industry Net Promoter Score
Acknowledgments
i
ii
2
4
5
6
6
6
7
7
8
9
10
11
12
12
14

Survey
Highlights
The 2022 Banking
Industry Customer
Satisfaction Survey
obtained
33,801
responses
compared to 29,791
responses received in
the 2021 Survey.
The distribution of
responses across the
47 counties
remains comparatively
similar, with slight
variations that suggest
increased participation
in the 2022 survey
compared to 2021.
Majority of respondents
(67.8 percent)
cited mobile banking as
their most preferred
banking channel in 2022

Majority of respondents
in the 2022 Survey were
aged between 26 and
35 years, representing
35 percent
of the total survey
responses.
The 2022 Survey showed
a sustained multiple
relationship with banks,
with two or more bank
account holders
accounting for
48.2 percent
Preference for
human-assisted
customer service
increased to
16 percent
from 12 percent
in 2021
In gender distribution,
males accounted for
65 percent
of the total number
respondents.
Foreword
This issue of the Banking Industry Customer
Satisfaction Survey (BICSS) marks the fifth
instalment of industrywide banking sector
customer service evaluation; the first having been
published in the year 2018. Fortuitously, the Survey
was conducted in 2022, coinciding with the Kenya
Bankers Association (KBA) 60
th
Anniversary
celebrations. The two distinctions make the
current report important— providing an
opportunity to set a fresh pace for an enhanced
quality of banking services.
In keeping with that expectation, this report is
based on a refreshed questionnaire that covers
new areas, informed by feedback obtained in its
predecessors. The new areas of focus include the
addition of the Net Promoter Score (NPS), an
important metric that assesses the likelihood of
referral. Widely used by organizations globally
across sectors, the metric is considered eective in
measuring overall customer satisfaction. The NPS
is aimed at providing the industry and individual
banks an additional evaluation tool that will inform
strategies towards service excellence.
The past six decades of banking in Kenya have
been marked with groundbreaking developments,
well interspersed with challenges and lessons. At
the forefront of the challenges and learnings was
the COVID-19 disruption which will, without doubt,
continue to have an enduring impact across
sectors. Beyond the negative eects of the health
crisis, it also served as a launchpad for new
possibilities.
In the realm of customer service, the potential of
technology was reawakened at the onset of the
pandemic in 2020. The role of innovation in
preventing the COVID-19 health crisis from
degenerating into a financial crisis in 2020 and
succeeding years cannot be gainsaid. Customers
continued to access banking services without
having to visit banking halls in light of restricted
movement meant to contain the spread of disease.
I would like to commend the banking industry for
the sustained foresighted innovation. Although
COVID-19 was an unanticipated risk, banks’
customer service teams demonstrated responsive
leadership. On behalf of the banking industry, I
take this opportunity to extend gratitude to the
customer service teams for creatively leveraging
on technology to forestall service disruption and at
the same time maintaining service standards.
However, some challenges persist, especially in the
area of facilitating satisfactory experience for
Persons with Disability. Based on this report’s
findings, there is a need to redouble eorts
towards ensuring independent access to banking
services for this important segment of the banking
public. I am pleased to note that out of 93 percent
of customers with special needs were able to
access banking services. However, 13 percent of
the customers surveyed reported having
diculties accessing financial services
independently.
In response to this challenge, it is gratifying to
note that over 30 banks are in the course of
implementing a harmonized banking industry
accessibility roadmap that seeks to address
accessibility challenges. It is the ambition of KBA
to continue supporting member banks to fully
implement the measures by the close of the year
2024.
Customer service is among the most challenging
aspects of banking. This distinction owes to the
fact that the banking public’s needs and
expectations keep evolving. It is, therefore,
incumbent upon the banking industry to keep
abreast with these dynamics as part of eorts to
deepen financial inclusion.
I have no doubt that this report is an important
ingredient to the attainment of the banking
industry’s Strategic Plan, whose aim is to facilitate
access to aordable financial services through
responsive innovation.
Dr. Habil Olaka, EBS
Chief Executive Ocer
BANKING INDUSTRY CUSTOMER SATISFACTION SURVEY 2022 04

Using a questionnaire developed by the Kenya Bankers Association Customer Service Working
Group, both quantitative and qualitative information was collected. In 2022, a total of 33,801
responses were received, compared to 29,791 responses in the 2021 survey. Out of the sample, 13.8
percent representing 4,677 persons, are those with special needs (i.e., braille, ramp, screen reader,
voiced aid).
This is an annual survey conducted online
using SurveyMonkey© survey tool. Its main
aim is to evaluate the quality of customer
service oered by the banking industry in
Kenya by obtaining feedback from the
banking public on various aspects of
customer experience. The survey is based on
a simple random sampling technique owing
to the approach’s strengths:
i. It reduces the possibility of systemic
errors and minimizes sampling biases.
ii. The approach produces a representative
sample, ensuring generalizability of
inferences drawn therein to population of
bank customers.
Sampling
Methodology
33,801
RESPONSES
IN 2022
01
05 KENYA BANKERS ASSOCIATION

Geographical distribution of the 2022
KBA customer satisfaction survey
responses
Figure 1
Mombasa
Nakuru
Kiambu
Nairobi
44.4%
6.4%
5.7%
4.1%
Age distribution of the survey responsesFigure 2
1%
15%
3%
6%
14%
25%
37%
Under 18yrs
18-25yrs
26-35yrs
65
+
yrs36-45yrs
46-55yrs
56-65yrs
Demographic
Distribution
02
A) GEOGRAPHICAL LOCATION
Access to banking services remains
geographically concentrated. In 2022, those
accessing most of their banking services in
Nairobi stood at 45 percent compared to 50.7
percent in the 2021 Survey while those
accessing them from Mombasa stood at 6.4
percent, and those accessing banking services
in Kiambu and Nakuru stood at 5.7 percent and
4.1 percent respectively (Figure 1). These
trends mirror the distribution of financial touch
points, especially the branch network of the
banking sector
1
. That said, the distribution of
the responses across the 47 counties remains
comparatively similar to the trends observed in
the 2021 Survey, however, slight variations in
the number of responses exist, suggesting that
there has been increased participation by the
banking public in the survey across the
counties.
B) AGE
Most of the bank customers surveyed were
aged between 26 – 35 years, which accounted
for 37.3 percent survey responses, 24.8 percent
were aged between 36 – 45 years, 14.6 percent
were 18-25 percent, while those aged 46-55
accounted for 13.8 percent while those aged
55-65 years accounted for 6.15 percent of the
responses. Under 18 and those above 65 years
accounted for 0.7 percent and 2.5 percent
respectively. While there are slight variations in
the distribution of responses by age in the
2022 Survey, it mirrors the trends observed in
2021.
2
CBK Annual Bank Supervision Report 2021
BANKING INDUSTRY CUSTOMER SATISFACTION SURVEY 2022 06

03
Multi-banking
Trends
Multiple bank relationships, herein referred to as
the maintenance of more than one bank account
in dierent banks is becoming a predominant
feature. In 2022, one-bank account holders
stood at 45.3 percent which is in line with the
findings of the 2021 FinAccess survey which
revealed that 44.1 percent of Kenyans use
banking services. The ownership of two or more
accounts stood at 48.2 percent which is a
reduction from the 62 percent in 2021. Those
holding between four and five accounts
accounted for 5.8%, while only 0.7 percent of the
respondents held more than six bank accounts.
The multiple bank relationships are not unique
though to the Kenyan context but is a consistent
feature across the globe where it is observed
that customers deal with more than one bank.
Gender distribution of the survey
responses
Figure 3
Trends in multi-bank account
ownership
Figure 4
C) GENDER
In terms of the distribution by gender, males
accounted for 65. 2 percent while females
accounted for 35 percent of the responses, a
trend that compares with the 2021 survey,
where 65.6 percent of the respondents were
male, and 34.4 percent were female.
1%
6%
48%
45%
1 bank account
2-3 bank accounts
4-5 bank accounts
6
+
bank accounts
Female
Male
65%
35%
KENYA BANKERS ASSOCIATION07

ABC Bank
Overall Customer
Experience
04
Based on customer experience ranking, respondents were asked to rank on a scale of 1 to 5 their
overall experience with the main bank, and the respondents’ views are resoundingly positive. For
instance, ninety-six (96.5) percent of the respondents rated their customer experience with their
banks above three (3). For instance, 50.70 percent of the respondents rated their customer
experience with their main banks at five (5), being the highest rating. In addition, 35.4 percent
rated it at four (4) and 10.4 percent rated their customer experience at three (3).
Top Overall
Tier 01 Tier 02 Tier 03
In the 2022 Survey, respondents were asked to rank which bank oers the best overall
customer experience and the feedback is as tabulated below.
BANKING INDUSTRY CUSTOMER SATISFACTION SURVEY 2022 08

Customers’ rating of their bank’s customer experience
Figure 5
50.70%
of respondents
rated their customer experience
with their main banks at five, being the
highest rating
05
Customer Banking
Channel Preference
Channels leveraging on technology are emerging to be the most preferred banking channels with
mobile banking emerging top. In 2022, 67.8 percent of the Survey respondents preferred mobile
banking, a trend that gained traction with onset of COVID-19 and continues to stay elevated
which is consistent with the 2021 FinAccess survey findings that found mobile banking usage
also increased between 2019 and 2021. Preference for Internet or online banking is also on the
rise with 23.3 percent of the respondents expressing preference for it. Moreover, the preference
for branch banking came in third at 17.6 percent and ATMs fourth at 16.9 percent while both
agency banking and card payments or touchpoints came in fifth at 6.1 percent . only 2.1 percent
of the respondents expressed preference for cash depositor machines. Compared to 2021,
preference for digital channels has accelerated; for instance, in the 2021 Survey, 58.7 percent of
the respondents preferred mobile banking, and 20.3 percent expressed preference for internet or
online banking.
50.70%
1.46%
2.04%
10.42%
35.39%
09 KENYA BANKERS ASSOCIATION

Bank Agent/
Agency Banking
6.06%
Bank Branch
17.64%
ATM
16.85%
Mobile Banking
67.83%
Internet Banking/
Online Banking
23.33%
Cash Depositor
Machines
2.04%
Card Payments
(Online/Point of Sale)
6.14%
Customers’ preferences of banking channels
Figure 6
67.83%
of respondents
cited Mobile
Banking
as their
topmost preferred
banking channel
45%
06
Preferred Mode of Interaction
When Accessing Banking Services
There has been a steady growth in the last
four years of bank customers preferring fully
automated or self-service modes (including
Mobile, Internet and Chatbots), when
accessing banking services. In 2022, 45.6
percent preferred this mode of interaction,
compared to 46.7 percent in 2021 and 43
percent in 2020. Some 15.5 percent of the
respondents preferred human-assisted
service (including Call Centers and
Branches), compared to 12.8 percent in 2021
and 16 percent in 2020, denoting a reversal
of the downward trajectory. Those who are
indierent to the use of either slightly
declined to 38.9 percent in 2022 compared
to 40.5 percent in 2021 and 40 percent in
2020.
Preferred Mode of Interaction
When Accessing Banking Services
Figure 7
39%
16%
Either is fine
Human-Assisted Service
(including Call Centers and Branches)
Fully Automated / Self-service
(including Mobile, Internet, Chatbots)
BANKING INDUSTRY CUSTOMER SATISFACTION SURVEY 2022 10
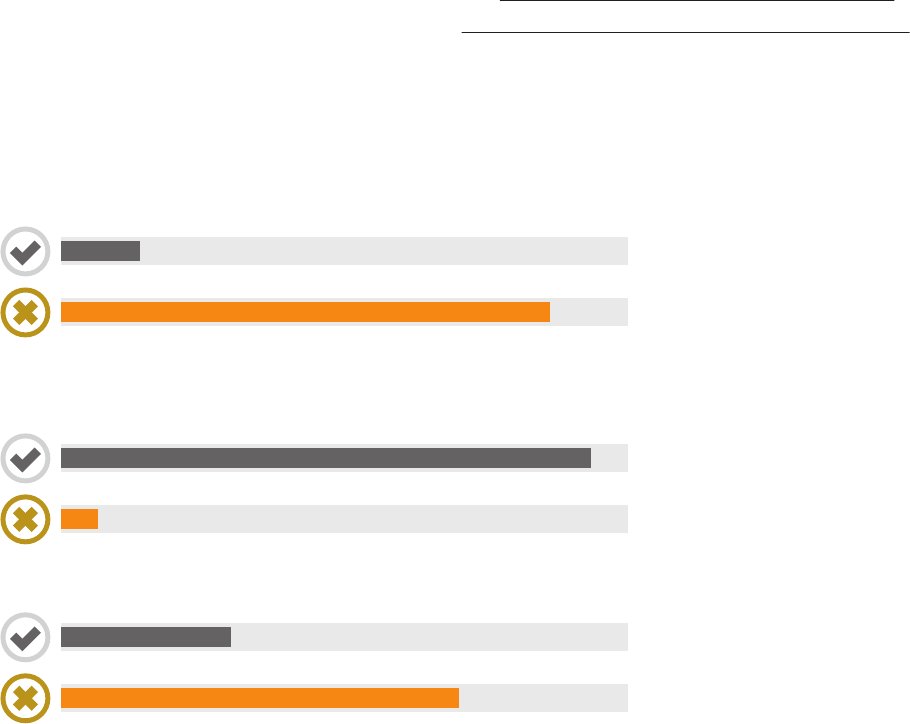
Access to bank services for Persons with Special Needs
Figure 8
Promoting Access to Banking services
for Persons with Special Needs
07
Banking services must be adaptable to the
needs of all, and customers with special needs
should be able to access the same financial
services as customers without special needs.
From the 2022 survey, 13.8 percent of the
respondents needed special accommodation
(e.g., braille, ramp, screen reader, voiced aid)
to access banking services. Out of the
respondents’ 93.5 percent were able to use
the banking services (e.g. Mobile banking and
online banking) independently, a significant
improvement from the 2020 and 2021 level
where 78 percent and 81 percent, respectively,
could access services independently. However,
6.5 percent of customers with special needs
reported requiring support in accessing
banking services. This highlights the need for
the banking industry to enhance eorts
towards ensuring independent access to
banking services for customers with special
needs.
That said, majority (70.1 percent) of customers
do not intend to switch to another bank that
provides them with accessible services
independently compared to 29.9 percent that
do. These findings are inspiring and
demonstrate the commitment of the banking
industry to improve the financial services and
ensure inclusion of all customers regardless
their conditions, which aligns with the
industry’s commitment to making banking
work for everyone as envisioned in the report
on “A Roadmap for Digital Accessibility and
Financial Inclusion of People with Disabilities.”
YES
NO
13.8%
86.2%
Need Special Accommodation to Access Banking Services
(e.g. braille, ramp, screen, reader, voiced aid)
YES
NO
93.5%
6.5%
Able to Use the Banking Sevices Independently
(e.g. mobile banking and online banking independently)
YES
NO
29.9%
70.1%
Intent to Switch to Another Bank that Provides you with Accessible Services Independently
KENYA BANKERS ASSOCIATION11

Customer complaint resolution by banks
Figure 9
Customer Complaint
Resolution
08
Most of the respondents, at 68.9 percent
indicated that their banks were always able
to respond to complaints within two days of
the complaint being raised. This is against 74
percent recorded during the 2021 Banking
Industry Customer Satisfaction Survey
(BICSS). Some 23.5 percent of the
respondents in 2022, compared to 20
percent in 2021, indicated that their banks
respond to complaints within two days,
sometimes, denoting the need for clear
Service Level Agreements (SLAs) and strict
adherence to the same, among banks that fall
in this category.
Industry Net
Promoter Score
09
In an increasingly competitive banking climate, customer loyalty is more important than ever. As
banks continue to face increased competition among each other and from emerging FinTechs,
the need for customer retention and acquisition, that is the ability of its customers to
recommend it to their close associates has become so important. In the 2022 survey, unlike in
the previous editions of the BICSS, respondents were asked the question “On a scale of 0-10,
with 10 being the highest, what’s the likelihood that you would recommend us (our bank) to a
friend or colleague?” The response to this question is used to compute the Net Promoter Score®
(NPS)
2,3
, a crucial metric of assessing how likely it is for customers to refer others to a given
brand or even products and services.
2
Since its 2003 debut, NPS has been used by companies of all sizes in a variety of industries, and its eectiveness comes
from its ability to measure the overall satisfaction of a customer base.
3
The NPS score is calculated in the following ways. First, the responses are divided into three categories namely
promoter, passive, and detractors. Second, obtain a count of the number of promoters and detractors in the total number
of responses. Third, obtain the proportion of promoters and detractors to the total responses and subtract the
percentage of detractors from the percentage of promoters. The resulting number, whether positive or negative, is your
NPS score. Notably, the passives are left out of the NPS calculation because they are unlikely to recommend or not
recommend.
3.05%
4.49%
68.93%
23.52%
Always
Sometimes
Rarely
Never
BANKING INDUSTRY CUSTOMER SATISFACTION SURVEY 2022 12

Net promoter score of the banking industry
Figure 10
Based on the responses obtained, 55.8 percent of the respondents are promoters
4
, 27.5 percent
of the respondents are passive
5
while 16.7% are detractors
6
. Given these trends, the industry’s
standing especially from a promoter’s standpoint is impressive as research shows that the
lifetime value of a promoter is 2.5 times higher than that of a detractor, while detractors are 2.3
times more likely to switch to another financial organization compared to a promoter. More
importantly, research has shown that a higher net promoter score (NPS) correlates positively
with revenue. For instance, according to a study published by the London School of Economics
entitled “Advocacy Drives Growth”, an average NPS increase of 7 percent correlates on average
with a 1 percent growth in revenue.
4
Promoters are respondents who answer with a 9 or 10 and are the most loyal of customers whose enthusiasm for the
bank translates into actual recommendations to family and friends.
5
Passives are respondents who answer with a 7 or 8, and are largely indierent, and therefore are disinclined to share
either negative or positive reviews with others.
6
Detractors are those respondents who answer the question with a 6 or lower; these respondents are unsatisfied
customers who could actively harm the bank’s brand by making their complaints public.
Detractor
Passive
Promoter
Promoter
Detractor
Passive
55.8%
39
16.7%
27.5%
13 KENYA BANKERS ASSOCIATION
The Kenya Bankers Association wishes to express its sincere gratitude to
the KBA Customer Service Working Group for playing an important role in
conceptualizing the research upon which this Survey is based. We extend
gratitude to the KBA member banks for sharing the survey across
platforms. We gratefully acknowledge the thousands of bank customers
across the country who continue to provide feedback since the Survey’s
inception in 2018. Data review, analysis and compilation of the report was
led by Palm Consulting Services, supported by Josea Kiplangat,
supported by Christine Onyango, and Hesborn Nyakundi-Nyagaka from
the KBA Secretariat. It has been designed by Sabinga Brand Design Ltd.
Acknowledgements
BANKING INDUSTRY CUSTOMER SATISFACTION SURVEY 2022 14


www.kba.co.ke
