1
Ensuring Customer Satisfaction in Banking Sector through Service Quality –
A Study with Reference to Select Branches of State Bank of India
Sangita Maji
Guest Lecturer
Sarojini Naidu College for Women
e-mail: maitysangita090@gmail.com
Bappaditya Biswas
Assistant Professor
Department of Commerce
University of Calcutta
e-mail:aditya_2582@rediffmail.com
Abstract: The banking industries are facing a rapidly changing market, new technologies,
economic uncertainties, increasing competition, and especially more demanding customers. The
income and business growth of the banks depends on loyal and satisfied customers. As a result,
in today‟s competitive environment, banks are continuously trying to retain their existing
customer and attract new customers by providing better quality services. The objectives of the
study are (i) to understand the concept of service quality and customer satisfaction, and to
examine the relationship between them and (ii) to appraise the level of service quality and
customer satisfaction in select branches of State Bank of India. Primary data have been collected
through a structured questionnaire by direct interacting with 110 banking customers of SBI from
different areas of Burdwan district. Bar chart, cross tabulation, Chi-square test, etc. have been
used for interpreting the data. The study found that the service quality of SBI bank is not so
satisfactory in Burdwan district. The study suggests that the banks should increase their number
of ATMs, cash counting machines, and number of front desk employees to improve their quality
of services.
Key-words: Service Quality, State Bank of India, SERVQUAL Model, Tangibility, Reliability.
2
1. Introduction
Banking, an important segment of the service sector, plays a very crucial role in the economic
development of every country. In these days of intense competition, the banks are very
particular in identifying the needs of their customer and how effectively that can be met. They
continuously struggle and develop new strategies to differentiate
themselves from their competitors by providing their customers with high
quality banking services and high technology innovative products.
Although, banking sector of India has been improved gradually for the last two decades. But it is
also facing lot of challenges and difficulties such as, increasing customer‟s demand and
awareness, increasing competition, growing population, etc. Beside these, another important
challenge that the sector is facing is technological changes. As the sector is growing fast, a
number of new private banks have emerged. Therefore customers are getting many options for
selecting their suitable financial service provider. Due to increasing customer awareness, they
would select those particular banks that can provide standard services and fulfill their
expectation. In the Indian scenario, where all banks offer almost similar products and services,
need based efficient customer service and the service quality can differentiate a bank.
So, to ensure customer satisfaction the banks have to improve their service quality, as service
quality and customer satisfaction are interrelated to each other. It means if banks provide
service as per customer‟s expectation then only the customers will be satisfied. As a result, to
cope up this changing market condition banks have to retain old customers and have to attract
new customers by providing better quality of services.
2. Review of Literature
Several studies have been conducted by the academicians and researchers on different aspects
of service quality and customer satisfaction of banking sector. Few of them are summarized
below:
Oppewal and Vriens (2000) used SERVQUAL model to find out the dimension which yield
maximum improvement in bank‟s utility among different dimension such as different service
attributes, strategically important service dimensions, and overall preference for banks or
banking products. Chinwuba (2013) measured the customer perceived service quality and their
3
satisfaction level by using SERVQUAL model through the help of 117 respondents. They found
that assurance, empathy and responsiveness dimensions have positive relationship between them
and no significant effect on customer satisfaction and there was a negative relationship and no
significant impact between reliability and customer satisfaction. But the dimension tangibility
has significant positive relationship with customer satisfaction.
Sheetal et.al (2004) attempted to examine the role of nature of service in knowing the order of
importance of service quality dimension and found out that tangibility is least important and
empathy is second least important in banking service marketing. Agarwal (2009) observed that
the customers are influenced in their usage of e-banking services by the kind of account they
hold, age, profession, etc. The study clearly emphasizes the need for banks to understand that
the financial products and services supplied over the Internet must not only be tailored to fulfill
wants, preferences, security and quality expectations of customers at the present time, but also be
required to induce customers to demand and use e-banking on a wider scale in the future. Siddiq
(2011) attempted to identify the interrelationships and critical factors between service quality,
customer satisfaction and customer loyalty in retail banking sector in Bangladesh. He found that
all the service quality attributes are positively related to customer satisfaction and customer
loyalty in the retail banking sector. Empathy demonstrates the highest positive correlation with
customer satisfaction and tangibility shows the least positive correlation with customer
satisfaction. Jani (2012) identified relative important factors affecting the areas of strength and
weaknesses of public and private sector banks in terms of different technologies offered to
customers and future growth of e-channels in retail banking. The result revealed that use of
technology inferred a positive perception of customers of public sector and private sector banks.
Vasantha and Rani (2011) have analyzed the practicality of determining the retail service quality
opinions and its effect on demographic aspects in Bangalore city. Findings of this study
delivered guidelines regarding enhancement of service offerings by various organizations and
effort to provide a primary understanding on the direction of the customer‟s opinion about the
service quality in retail banking.
Haidar and Islam (2011) determined the importance of perceived service quality factors of
private commercial banks (PCB) in Bangladesh. Sample size of this study was 300.The results
revealed that tangibility is the most important factor in determining the service quality followed
4
by reliability, empathy, accessibility and assurance. Rahaman et al. (2011) conducted the study
on Bangladesh to measure service quality of PCBs on expectation and perception of customers
regarding the services on diverse five dimensions. Authors concluded that three factors were
responsible in determining service quality gaps viz. reliability, responsiveness, and assurance.
The results revealed that the gap existed between perceived services and customers‟ expectation
in PCBs which implies that customers were not satisfied with the services provided by private
sector banks.
Shanka (2012) made an on working mechanism of private banks on Ethiopia. By using
SERVQUAL model, author found out that empathy and responsiveness play a important role in
customer satisfaction level and the author also concluded that providing excellent service
increases the customer satisfaction and customer loyalty. Muyeed (2012) conducted a study in
Bangladesh to examine the service quality in retail banking by taken the sample size 250
respondents of public and private sector banks. The author found that customers are highly
satisfied in prompt and accuracy in transaction but less satisfied in the service of modern
equipment of the bank. Mary (2014) conducted a study in Chennai city and the study found out
that the customers in private sector banks are more satisfied than customers of public sector
banks. There exists a strong relationship between expectation level of the customer and level of
satisfaction and customer loyalty in banking sector.
3. Objectives of the study
The main objectives of the study are as follows:
To understand the concept of customer satisfaction and service quality, and to examine
the relationship between them.
To appraise the level of service quality in select branches of State Bank of India.
4. Database and methodology
Database
The study is both exploratory and empirical in nature. The explorative part of the study is
based on the existing literature on the subject including books, journal, articles, etc. The
empirical analysis in the study has been done on the basis of primary data which have been
collected through field survey as mentioned below.
Methodology
5
For appraisal of service qualities and customers satisfaction in the banks, SBI bank has been
selected as it is the largest public sector bank in India. Three semi-urban branches of SBI
bank from different area of Burdwan district have been considered for collection of primary
data on the basis of convenient sampling method. The selected branches of SBI are; CAC
Burnpur Branch, Rupnarayanpur Branch and Niyamatpur Branch.
The information related to quality of services has been collected through a structured
questionnaire by direct interaction with 110 customers of SBI bank from the three selected
semi-urban branches. The questionnaire is based on SERVQUAL Model which was
developed by Zeithmal, Parsuraman and Berry in the year of 1988. For appraising the service
quality of the selected banks, five parameters of service quality have been used from this
model. The parameters are; tangibility, reliability, responsiveness, assurance and empathy.
Simple percentage, cross tabulation, bar charts, pie charts and Chi Square tests have been
used to present and interpret the data.
5. Customer Satisfaction
The dictionary meaning of „customer‟ is a person who buys goods and services. So, customer
services involve three entities i.e., seller, buyer and goods/services. Customer service is,
therefore, encapsulation of all these entities for the mutual benefits so as to increase the value of
all the participants in the process of buying and selling.
As per Reserve Bank of India‟s (RBI) definition, the customer of a bank may include:
A person or entity that maintains an account and/or has a business relationship with a
bank;
One on whose behalf the account is maintained (i.e. the beneficial owner);
Beneficiaries of transactions conducted by professional intermediaries, such as, stock
brokers, Chartered Accountants, solicitors, etc., and
Any person or entity concerned with a financial transaction, which can pose significant
reputational or other risk to the bank, e.g., issue of a high value demand draft as a single
transaction.
The Talwar Committee (1977) deserved that the main purpose of banking is “to create and
deliver customer – needed services in a customer satisfying manner”. This implies that there are
two elements that are required for the banking services, viz., creating and delivering services.
6
While creation indicates the creation/introduction of new technology in services, carrying out
these services effectively constitutes the delivering of services. These two elements greatly
determine the level of satisfaction of the customers.
According to Kotler and Keller (2009), “customer satisfaction is a person‟s feeling of pleasure or
disappointment resulting from comparing a products perceived performance in relation to his or
her expectation.” Rao (2008) draws the basic formula of customer satisfaction,
Customer satisfaction = Customer perception of the service received - Customer expectation of
service.
In this way it is easy to generalize that if the perception of the service received exceeds the
expectation of the service, customer‟s satisfaction will be positive. On the other hand if the
perception of the service received is less than the level of expectation of the service, it would
lead to customer dissatisfaction. But customer satisfaction is highly effected by the other factors
like experience, purchase decision, service provider, price, etc. There is a substantial body of
empirical literature that establishes the benefits of customer satisfaction for firms. It is well
established that satisfied customers are key to long-term business success. Companies that have a
more satisfied customer base also experience higher economic returns. Consequently, higher
customer satisfaction leads to greater customer loyalty; which in turn leads to higher future
revenue.
Indian banking industries is facing various kind of ups and downs in the current scenario. There
are some specific reasons like lowering of entry barriers, increasing product line of banks and
non-banks, etc. Since the financial reforms, bank are also facing huge competitive pressure
therefore it is inevitable for the banks to maintain loyal customers based, besides banks are trying
to make strategies towards customers satisfaction and loyalty through improved service quality
to achieve and improve their marker and profit position.
6. Service Quality and its Different Models
A service is an act or performance offered by one party to another. They are economic activities
that create value and provide benefits for customers at specific times and places as a result
bringing desired change. It can be said that service is a transaction where no physical goods are
transferred. Service quality means a form of an attitude, related but not equivalent to satisfaction
that results from the comparison of expectation with performance. The customers generally use
7
certain criteria to evaluate service quality by examining reliability, responsiveness, assurance,
empathy and physical aspects. The aim of providing quality services is to satisfy customers.
Measuring service quality is a better way to dictate whether the services are good or bad and
whether the customers will or are satisfied with it.
According to business dictionary “Service quality means an assessment of how well a delivered
service conforms to their client‟s expectation”. Reeves and Bednar (1994) defined service quality
as excellence, value, conformance to specifications and meeting or exceeding customers‟
expectations. Service quality is defined as the degree of discrepancy between customers‟
normative expectations for service and their perceptions of service performance (Parasuraman et
al., 1985). Customer always wants good services from their service provider. But from above
definition we can say that delivered service will become as the quality service if it meets the
customer expectation. But customer expectation depends on his perception which varies from
person to person. So service quality is a comparison between perceived expectation of a service
and perceived performance of a service. As per Parasuraman, Zeithmal and Berry (1985) the
service quality may be expressed as:
Service quality=Perception - Expectation
Therefore if the customer gets same services as they expect then difference will be zero, we can
say service quality is very good. If the customer does not get the expected services then service
quality is bad. Customer perception depends on various factors like age, gender, occupation,
technological changes, etc. which again influence the service quality.
Service Quality Models
Numbers of service quality model have been developed by different researchers around the
world like Gronroos model, GAP Model, Attribute Service Quality Model (Haywood-Farmer,
1988), Alignment Model (Berkley and Gupta 1994), SERVPERF Model, and SERVQUAL
Model. Among these SERVQUAL model is one of the popular model that has been used
globally for measuring service quality of different institutions including banking sector. In this
study we have applied SERVQUAL model for measuring the service quality and customer
satisfaction among the selected customers of State Bank of India.
SERVQUAL is a well-known multidimensional research instrument for measuring and
evaluating service quality in any service sector. This model perfectly covers the dimensions that

8
are considered by a customer in evaluating quality of service in a service sector. The objective of
this survey instrument is to determine the value that the service sector is currently delivering to
the customers and the value that the customer expects. The SERVQUAL model of measuring
the scale of quality in service was developed by Valerie Zeithaml, Parasuraman and Len
Berry in 1985. In this method data are collected via surveys of a sample of customer. In
these surveys the customer responds to series of questions based around a number of key
service dimensions .The methodology was originally based around 5 key dimensions. The
questionnaire consists of matched pairs of items; 22 expectation items and 22 perceptions items,
organized into five dimensions which are believed to align with the consumer‟s mental map of
service quality dimension. The 5 dimensions that are used in this model are:
Reliability: The ability to perform the promised service dependably and accurately.
Assurance: The knowledge and courtesy of employees and their ability to convey
trust and confidence.
Tangibles: The appearance of physical facilities, equipment, personnel and
communication materials.
Empathy: The provision of caring, individualized attention to customers.
Responsiveness: The willingness to help customers and to provide prompt service.
7. Relation between Customer Satisfaction and Service Quality
Customer satisfaction and service quality are inter-related. The higher the service quality, the
higher is the customer satisfaction. Many agree that in the banking sector, there are no
recognized standard scales to measure the perceived quality of a bank service. Thus, competitive
advantage through high quality service is an increasingly important weapon to survive. As a
process in time, service quality takes place before, and leads to overall customer satisfaction.
Service quality has been found to be an important input to customer satisfaction.
Service quality is one of the important areas of business especially for service industries like
bank to retain their customer and to attract new one. Poor customer service could cause a
banking business loss of millions of dollars and also „its credibility‟. Good customer service and
service quality is what attracts people to a business. When customers are pleased they become
long-term assets of the bank. Building strong customer relations can tie a customer and a
business together. When customers are satisfied they feel well treated and are willing to treat the
9
business well. Perfect and smiley customer service definitely improves customer satisfaction.
From the customer‟s perspective service quality significantly influence customer satisfaction and
customer satisfaction has direct influences on purchase intentions.
Some researchers have found empirical supports for the view of the point mentioned above;
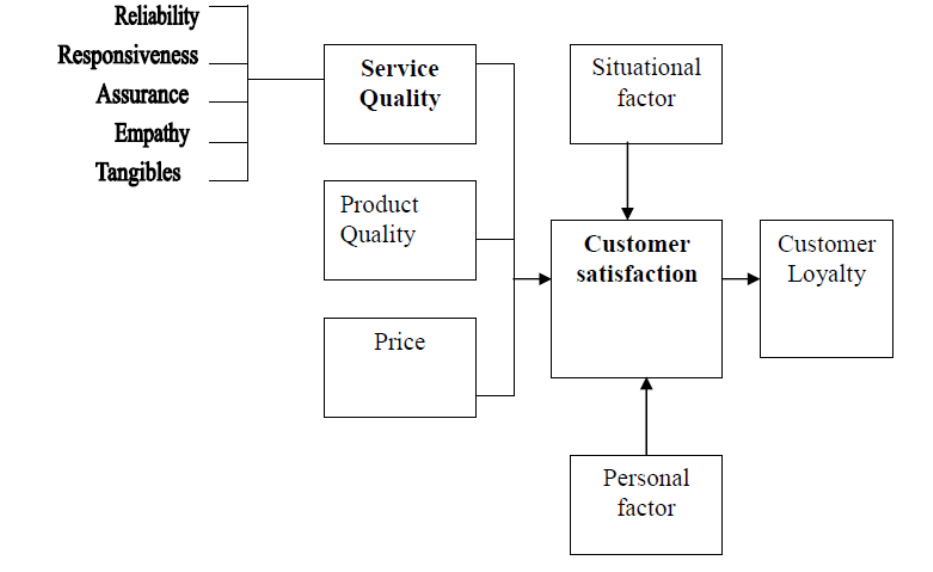
where customer satisfaction came as a result of service quality. As said by Wilson et al. (2008),
service quality is a focused evaluation that reflects the customer‟s perception of reliability,
assurance, responsiveness, empathy and tangibility while satisfaction is more inclusive and it is
influenced by perceptions of service quality, product price and quality, also situational factors
and personal factors. The relationship between service quality and customer satisfaction is
becoming crucial with the increased level of awareness among bank customers.
Exhibit 1: Customer perception of quality and customer satisfaction
(Source: Wilson et al., 2008)

10
8. Appraisal of Service Quality and Customer Satisfaction in SBI Bank
In this section for appraising the service quality, three branches of SBI bank have been
considered from semi-urban areas of Burdwan district. The information related to quality of
services has been collected through direct interview with the 110 customers of SBI by filling up
the questionnaire.
8.1.Demographic Profile of the Respondent
The demographic profile of the respondents are summarized below:
a. Branch wise distribution of the Customers
The Table 1 in below shows that 45.50% respondents are from Rupnarayanpur branch, 32.70%
are from CAC Burpur branch and remaining from Niyamatpur branch.
Table 1
SBI BANK- NAME OF THE
BRANCH
NO. OF CUSTOMER
PERCENTAGE
CAC Burnpur branch
36
32.70%
Rupnarayanpur branch
50
45.50%
Niyamatpur branch
24
21.80%
Total
110
100%
(Source: Field survey by the Researcher)
b. Gender of the Respondents
Exhibit 2: Gender wise distribution of the customers
(Source: Field survey by the Researcher)
Exhibit (2) indicates that for SBI bank (80%) most of the respondents are male.
MALE, 80
%
FEMALE,
20%

11
c. Educational qualification of the Respondents
Exhibit 3: Educational qualification of the Respondents
(Source: Field survey by the Researcher)
Exhibit (3) shows that most of the customers are „12 th‟ pass (49.50%) and „graduate‟ (30.40%),
and few are „primary level educated‟ and „eight pass‟ and Post Graduate (PG) and Professional.
e. Type of account selected by the Respondents
2.70%
1.80%
10.90%
49.50%
30.40%
4.70%

12
Exhibit 4: Type of account selected by the customers
(Source: Field survey by the Researcher)
From the above Exhibit (4) it can be said that most of the respondents (70.90%) have only
Savings Account with SBI and very few of them have Current Account (0.90%) and Fixed
Deposit Account (1.80%). 16.40% of the respondents have both Saving and Fixed deposit
Account.
8.2.Analysis of the Service Quality and Customer Satisfaction by using SERVQUAL
Model
In this section, we have analysed the primary data collected from 110 customers of three
branches of SBI bank through questionnaire designed on the basis of the five parameters of
SERVQUAL model. We have collected the customer‟s feedback in five point likert scale
regarding their satisfaction level out of the services provided by SBI to examine the customer‟s
satisfaction in regards to the quality of services. Chi-Square tests have been done to compare
between the desired level and perceived level of satisfaction of the respondents regarding the five
parameters. The findings of the analysis have been summarized below:
a) Tangibility
Savings
A/C
Current
A/C
Recuring
deposit
A/C
Fixed
deposit
A/C
Savings
and
Recuring
deposit
A/C
Savings
and
Recuring
deposit
and Fixed
deposit
A/C
Savings
and Fixed
deposit
A/C
70.90%
0.90%
0.0%
1.80%
4.50%
5.50%
16.40%

13
For collecting the information regarding the „Tangibility‟ or physical infrastructure of the bank
eleven (11) sub-parameters or questions were set up. The findings are as follows:
(i) Sub-parameter - 1: Availability of sufficient number of counter in the Banks
Availability of sufficient numbers of counters in the banks is an important factor of service
quality. A Chi-Square test has been done to examine whether there is any significant difference
between the desired level and perceived level of the customers regarding the availability of
sufficient number of counters in the banks.
Chi Square test
Hypothesis -1
Ho – There is no significant difference between desired level and perceived level regarding
sufficient number of counter available in the branches.
H1 – There is a significant difference between desired level and perceived level regarding
sufficient number of counter available in the branches.
Table 3 and 4 describe the table of cross tabulation test and Chi-Square test result.
Table 3 : Cross tabulation table of desired level and perceived level of Sufficient number of
counter available in the branches
Name of the Bank
Desired tangibility
Sufficient number
counter available
Total
Highly
satisfied
Satisfied
SBI
Perceived tangibility
Sufficient number counter
available
Highly
satisfied
Count
27
2
29
% of Total
24.5%
1.8%
26.4%
Satisfied
Count
34
12
46
% of Total
30.9%
10.9%
41.8%
Not Decided
Count
16
7
23

14
% of Total
14.5%
6.4%
20.9%
Dissatisfied
Count
10
2
12
% of Total
9.1%
1.8%
10.9%
Total
Count
87
23
110
% of Total
79.1%
20.9%
100.0%
Table 4 : Chi-Square Tests
Name of the Bank
Value
df
Asymp. Sig.
(2-sided)
SBI
Pearson Chi-Square
5.582
a
3
.134
Likelihood Ratio
6.364
3
.095
Linear-by-Linear
Association
1.693
1
.193
N of Valid Cases
110
In the above table 4, for SBI, Pearson Chi-Square value is 0.134, which is greater than 0.05 at
5% level of significance. So, we accept the Null Hypothesis (Ho). Now we can say that for SBI
there is no significant difference between the desired level and perceived level regarding
sufficient number of counter available in the branches. Hence, we may conclude that SBI bank
has sufficient number of counter available for providing smooth services to the customer and the
bank has met the customer‟s expectation level.
In the same way, we have done Chi-Square tests for the other ten (10) sub-parameters of
„Tangibility”. The findings of the Ch-Square test of all the eleven (11) sub-parameters are
summarized in the following table
Table 5: Summary Table of the Chi Square tests of the parameter ‘Tangibility’
Sl no.
Hypothesis
P
value
Remarks

15
1
Ho= There is no significant difference between desired level
and perceived level relating to sufficient number of counter
available in the bank.
0.134
Ho accepted
2
Ho= There is no significant difference between desired level
and perceived level regarding availability of cash depository
machine in the branch.
0.496
Ho accepted
3
Ho = There is no significant difference between desired level
and perceived level relating to sufficient number cash
counting machine.
0.014
Ho rejected
4
Ho = There is no significant difference between desired level
and perceived level relating to sufficient number of ATM
machine in the bank.
0.121
Ho accepted
5
Ho = There is no significant difference between desired level
and perceived level relating to sufficient space to serve
customer with reasonable comfort in the branch of this bank.
0.015
Ho rejected
6
Ho = There is no significant difference between desired level
and perceived level relating to availability of bank slip,
Challan and pamphlets.
0.000
Ho rejected
7
Ho= There is no significant difference between desired level
and perceived level relating to adequate staff at the bank to
meet customer requirements in the bank
0.024
Ho rejected
8
Ho = There is no significant difference between desired level
and perceived level relating to bank has sufficient passbook
up to date machine.
0.117
Ho accepted

16
9
Ho= There is no significant difference between desired level
and perceived level parking facilities in the bank premises.
0.13
Ho accepted
10
Ho = There is no significant difference between desired
level and perceived level relating to seating facilities,
drinking water and toilet facilities are convenient.
0.357
Ho accepted
11
H0= There is no significance difference between desired
level and perceived level relating to E-corner facilities in the
bank.
0.137
Ho accepted
(Source: Compiled by Researcher)
Table 6: Consolidated result of the Chi-Square tests for Tangibility
SBI Bank
Accept
7
Reject
4
Total
11
(Source: Compiled by Researcher)
The above table (6) shows that regarding tangibility, seven (7) hypotheses have been accepted
and four (4) hypotheses have been rejected. The acceptance of the hypothesis means that there is
no significant difference between the desired level and perceived level among the customers
regarding any particular service. That means, the customers are satisfied with the services if the
hypothesis are accepted and vice-versa. Again, rejection of hypothesis means that there is a
significant difference between the desired level and perceived level among the customer i.e. the
customers are not getting the expected services regarding this parameter of ‘Tangibility’.
a) Reliability
As the same way, we have also done Chi-Square tests for the seven (7) sub-parameters of
„Reliability” also and got the findings which are summarized in the following table:

17
Table 7: Summary Table of the Chi Square tests of the parameter ‘Reliability’
Sl.no
Hypothesis
P value
Remarks
1
Ho= There is no significance difference between
desired level and perceived level relating to bank
renders service as promised.
0.215
Ho accepted
2
Ho = There is no significance difference between
desired level and perceived level relating to
standard time taken to process transaction .
0.004
Ho rejected
3
Ho = There is no significance difference between
desired level and perceived level relating to staffs
are sincere in solving customer problems.
0.483
Ho accepted
4
Ho= There is no significance difference between
desired level and perceived level relating to
level of services are same at all times of day .
0.035
Ho rejected
5
Ho= There is no significance difference between
desired level and perceived level relating to
accurate information are provide on website.
0.000
Ho rejected
6
Ho = There is no significance difference
between desired level and perceived level relating
to banks insist error free records.
0.082
Ho rejected

18
7
Ho = There is no significance difference
between desired level and perceived level relating
to customers can feel a sense of security during
the transaction process.
0.000
Ho rejected
(Source : Compiled by the Researcher)
Table 8: Consolidated result of the Chi-Square tests for Reliability
SBI Bank
Accept
2
Reject
5
Total
7
(Source : Compiled by the Researcher)
The above table (8) shows that for SBI, two (2) hypotheses have been accepted and five (5)
hypotheses have been rejected and for all rejected hypothesis, desire level of the customer is
greater than the perceived level regarding the parameter ‘Reliability’.
c. Responsiveness
In this case, we have also selected six (6) Sub parameter and also have done Chi-Square tests for
that of „Responsiveness” and got the findings which are summarized in the following table.
Table 9: Summary Table of the Chi Square test of the parameter
‘Responsiveness’
sl.no
Hypothesis
P value
Remarks

19
1
Ho = There is no significance
difference between desired level and
perceived level relating to your request
are handle promptly.
0.003
Ho rejected
2
Ho= There is no significance difference
between desired level and perceived
level relating to bank alerts the customer
after their every transaction through
SMS promptly.
0.001
Ho rejected
3
Ho= There is no significance difference
between desired level and perceived
level relating to response in case of
emergency and seriousness.
0.434
Ho accepted
4
Ho = There is no significance difference
between desired level and perceived
level relating to bank delivers the
information and product at proper time.
0.0183
Ho rejected
5
Ho= There is no significance difference
between desired level and perceived
level relating to banks performs the
services right the first time.
0.011
Ho rejected
6
Ho = There is no significance difference
between desired level and perceived
level relating to sincerity of bank staff
to answer when you have doubts and
queries.
0.025
Ho rejected

20
(Source : Compiled by the Researcher)
Table 10: Consolidated result of Responsiveness
SBI Bank
Accept
1
Reject
5
Total
6
The above table (10) shows that for the bank SBI one (1) hypothesis have been accepted and
five (5) hypothesis have been rejected and as same way all five hypothesis are rejected. It means
SBI have not been able to satisfy the customers regarding the parameter Responsiveness.
d. Assurance
For the parameter Assurance four (4) sub parameter or questions were setup and we have done
Chi-Square tests on that. The findings of the Ch-Square test are summarized in the following
table.
Table 11: Summary Table of the Chi Square test of the parameter ‘Assurance’
sl.no
Hypothesis
P value
Remarks
1
Ho= There is no significant difference
between desired level and perceived level
employee of the bank have knowledge to
answer customer‟s questions.
0.034
Ho rejected
2
Ho = There is no significant difference
between desired level and perceived level
relating to staff behavior with customers are
polite and friendly.
0.026
Ho rejected

21
3
Ho = There is no significant difference
between desired level and perceived level
relating to employees are always willing to
help you.
0.013
Ho rejected
4
Ho= There is no significant difference
between desired level and perceived level
relating to bank can honor their
commitment.
0.006
Ho rejected
Table 12: Consolidated result of the parameter ‘Assurance’
SBI Bank
Accept
0
Reject
4
Total
4
The above table (12) describe that for SBI bank all of the hypothesis have been rejected, it means
that SBI have not been able to satisfy the customers of the parameter of „Assurance‟. So we can
say that for the selected branches of SBI, the customers are not getting better quality of service
regarding the parameter of ‘Assurance’.
d. Empathy
In the same way, we have also set up and done Chi-Square tests for the five (5) sub-parameters
of „Empathy”. The findings of the Ch-Square test of all the five (5) sub-parameters are
summarized in the following table
Table 13: Summary table of chi square test of the parameter ‘Empathy’
sl.no
Hypothesis
P value
Remarks
1
Ho= There is no significant difference
between desired level and perceived level
relating to provisions of financial advice.
0.402
Ho accepted

22
2
Ho= There is no significant difference
between desired level and perceived level
relating to staffs try to determine what are the
clients specific objectives.
0.519
Ho accepted
3
Ho = There is no significant difference
between desired level and perceived level
relating to helpdesk , call center of bank
operate 24 hours.
0.118
Ho accepted
4
Ho = There is no significant difference
between desired level and perceived level
relating to bank‟s operating hour are
convenient to their customer.
0.107
Ho accepted
5
Ho = There is no significant difference
between desired level and perceived level
relating to employees give personal attention
to their customer .
0.426
Ho accepted
(Source: Compiled by the Researcher)
Table 14: Consolidated result of the parameter ‘Empathy’
SBI Bank
Accept
5
Reject
0
Total
5
The above table (14) indicates that for SBI, all and five (5) hypotheses have been accepted and
none (0) of the hypothesis have been rejected. It means that SBI has been able to satisfy the
customers for 100% of the sub-parameters (5 out of 5) of „Empathy‟. So we can say that the
customers of SBI are highly satisfied with the service quality regarding the parameter
‘Empathy’.
23
9. Conclusion
The study found that in today‟s competitive environment, service quality plays an important
role for the long term sustainability of the banks. As a result, to cope up this changing market
condition banks have to retain old customers and have to attract new customers by providing
better quality of services. It has been evident from the study that there is a strong relationship
between the customer satisfaction and service quality. To ensure customer satisfaction the
banks have to improve their service quality as per the customer‟s expectation. The specific
conclusions regarding the five parameters of service quality are as flows:
(i) The appearance of physical facilities, equipment, personnel and communication
materials in relation to „Tangibility’ are not so strong in SBI Bank to satisfy their
customer.
(ii) Service quality of SBI bank is not so reliable, accurate, secured and faithful to
satisfying their customers.
(iii)In case of ‘Responsiveness’ service quality of this bank could not meet their customer‟s
expectation level.
(iv) Regarding ‘Assurance’ the feedback of customers of the banks is not good. Lack of
assurance has been found for the bank.
(v) Regarding ‘Empathy’, SBI provide excellent services which have increased the
customer‟s satisfaction.
10. Recommendations
Some recommendations are given below for betterment of the services in State Bank of India.
(i) Now a day‟s technology is modernizing day by day therefore SBI Bank have to up to date
there technology as per modern era, and banks have to install sufficient number of cash
counting machine in every branches. The bank should ensure availability of bank slip,
challan and pamphlets to serve customers in a better way.
(ii) The bank should increase its staff to give personal attention to the customers and serve
quickly.
(iii) The bank should ensure that the employees are behaving politely and friendly with the
customers.

24
(iv) There are a huge number of customers in SBI bank. So the bank should increase its
number of staff to serve the customers quickly, should improve seating facility to
customers and increase the space inside the bank for providing smooth services to the
customers.
(v) Better and faster technology, swanky branches and best product/service offering are
necessary but not sufficient for customer satisfaction. Hence, there is a need to transform
the mindset of the staff through greater knowledge and enhanced communication skills.
References
Journals
Agarwal, J. (2009). Customer satisfaction in Indian Banking Services- A Study in Aligarh
District. International Journal of Computing and Business Research, Vol.3 Issue 1, 4-5.
Chinwuba, M. S. and Egene, S. (2013). Evaluating customer – Perceived Service Quality And
Customer Satisfaction in The Nigerian Banking Industry, Far East Journal of Psychology and
Business, Far East Research Center, Vol-11(3), 34- 46.
Gronroos, C (1984). A Service Quality Model and Its Marketing Implications, European Journal
of Marketing, 18, 36-44.
Haidar, M. I, and Islam, M. S. (2011), Determination of Service Quality Factors of Private
Commercial Banks in Bangladesh, ASA University Review, Vol.5, No.2, 129-138.
Jani, A. S. (2012), A study of Customer Perception on the use of E-Technology in the Retail
Banking Sector: A Comparative study of Public Sector and Private Sector Banks, Indian Journal
of Marketing, Vol: 42, No: 1, 46-58.
Mary S. S. (2014). A Comparative Study on the Customer Satisfaction in Private Sector and
Public Sector Banks with Reference to Chennai City, International Journal of Business
Quantitative Economics and Applied Management Research, Vol 2, 42-43.
Muyeed M. A. (2012). Customer perception of service quality in retail banking in developing
countries – A case study, International Journal of Marketing Studies, Vol.4, No.1, pp. 116-122.
Oppewal, H. and Vriens, M. (2000). Measuring Perceived Service Quality Using Integrated
Conjoint Experiment, International Journal of Bank Marketing, Vol.18 Issue: 4, pp.154-169.
25
Parasuraman, A., Zeithaml, V. A. and Berry, L. L. (1988). “SERVQUAL: A Multiple-item Scale
for Measuring Consumer Perception of Service Quality”, Journal of Retailing, Vol.64, No.1, 12-
40.
Rahaman, M. M., Abdullah, M and Ataur (2011). Measuring Service Quality using SERVQUAL
Model: A Study on PCBs (Private Commercial Banks) in Bangladesh, Business Management
Dynamics, 05-11.
Seth, Deshmukh, Vrat (2004). Service quality models: A Review, International Journal of
Quality and Reliability Management Vol. 22, 915-923.
Shanka, M.S. (2012). Bank Service Quality, Customer Satisfaction and Loyalty in Ethiopian
Banking Sector, Journal of Business Administration and Management Sciences Research, 1(1),
001-009.
Sheetal B. Sachdev and Harsh V. Verma (2004). Relative Importance Of Service Quality
Dimensions: A Multi-sectoral Study, Journal Of Service Research, Volume 4, No 1, 93-115.
Siddiqi K. O. (2011). Interrelations Between Service Quality Attributes, Customer Satisfaction
and Customer Loyalty in the Retail Banking Sector in Bangladesh”, International Journal of
Business and Management, Vol. 6, No. 3, 12-36.
Vasantha, H. and Rani, S.S. (2011). Customer Perception of Services Quality in the Retail
Banking Sector, European Journal of Business and Management, 3, 18-23.
Books
Desai, V. (1979). Indian Banking-Nature and Problems, Himalaya Publishing House, Bombay.
Indian Institute of Banking and Finance (2004). Banking Product and Service, Taxman
Publication, New Delhi.
Indian Institute of Banking and Finance (2000). Principle and Practice of Banking,
MACMILLAN Publication, New Delhi.
Jha, S.M. (2007). Services Marketing, Himalaya publishing House, Bangalore.
Kothari, C.R. (2005). Research methodology methods and Techniques, New Age International
publishers, New Delhi.
Report
Report of the RBI Study Group, IBA Publications, 1977.
