
1
Enabling Cisco DNA Assurance on an existing
network
Solutions adoption prescriptive reference—design guide
October, 2019
2
Table of contents
Introduction .................................................................................................................................................................................................................. 4
About the solution ................................................................................................................................................................................................... 4
About this guide....................................................................................................................................................................................................... 4
Define – Cisco DNA Assurance on an existing network................................................................................................................................................ 6
Audience .................................................................................................................................................................................................................. 6
Purpose of this document ....................................................................................................................................................................................... 6
Solution overview .................................................................................................................................................................................................... 6
Design the network ...................................................................................................................................................................................................... 7
Process: Integrate Cisco Identity Services Engine (ISE) with Cisco DNA Center ..................................................................................................... 7
Procedure 1: Enable pxGrid services on Cisco ISE .............................................................................................................................................. 7
Procedure 2: Configure ISE as an authentication and policy server on Cisco DNA Center .............................................................................. 10
Procedure 3: Permit pxGrid connectivity from Cisco DNA Center into Cisco ISE ............................................................................................. 13
Process: Creating the network site hierarchy for your network within Cisco DNA Center .................................................................................. 14
Procedure 1: Adding an area / site to a network hierarchy ............................................................................................................................. 14
Procedure 2: Add a building within an area ..................................................................................................................................................... 16
Procedure 3: Add a floor to your building ........................................................................................................................................................ 18
Process: Configure network device credentials necessary for discovery of your devices .................................................................................... 20
Procedure 1: Network CLI credentials .............................................................................................................................................................. 20
Procedure 2: SNMP v2c credentials ................................................................................................................................................................. 21
Deploy the network .................................................................................................................................................................................................... 24
Process: Discover and manage your network devices .......................................................................................................................................... 24
Procedure 1: Discovering your network ........................................................................................................................................................... 24
Process: Assign network devices to sites ............................................................................................................................................................. 28
Process: Configure network devices for telemetry with Optimal Visibility within Cisco DNA Center ................................................................. 29
Operate the network .................................................................................................................................................................................................. 32
Use Case: Using Cisco DNA Network Assurance and Cisco DNA Client Assurance ............................................................................................... 32
Procedure 1: Assurance home page ................................................................................................................................................................. 32
Procedure 2: Network Health ........................................................................................................................................................................... 33
Procedure 3: Client Health................................................................................................................................................................................ 36
Appendix A — Product list .......................................................................................................................................................................................... 44
Appendix C—Glossary ................................................................................................................................................................................................ 45
About this guide ......................................................................................................................................................................................................... 46
Feedback & discussion........................................................................................................................................................................................... 46
3

Introduction
4
Introduction
About the solution
This solution assumes you are deploying Cisco DNA Assurance in an existing brownfield network. This will help
transform your network operations through actionable insights and simplicity. Cisco DNA Assurance uses unique
network graph technology developed by Cisco that draws from a combination of data resources in real time and a
historical capture of interrelationships, among users, devices, applications, and network services across time and
location. This document will walk you through your existing network to get Cisco DNA Assurance ready.
Figure 1 Cisco DNA Assurance Workflow
About this guide
This guide focuses on technical guidance to design, deploy and operate Cisco DNA Assurance on existing networks.

Introduction
5
Figure 2 Implementation flow
This document contains four major sections:
• The Define section presents a high-level overview of the existing campus network that will be designed and deployed
through Cisco DNA Center. It consists of an enterprise campus network with a traditional L2 design which includes
switches, routers, WLCs, access points and clients.
• The Design section shows how to integrate Cisco DNA Center with Cisco Identity Services Engine (ISE); creation of the
network hierarchy for your enterprise network - including the importing of floor maps – within Cisco DNA Center; and
configuration of various network services necessary for network operations – such as AAA, DNS, DHCP, NTP, SNMP,
and Syslog servers.
• The Deploy section shows how to use Cisco DNA Center to discover and manage devices, assign devices to a network
hierarchy site, and enable network telemetry visibility for your enterprise network.
• The Operate section shows how to use Cisco DNA Assurance to proactively troubleshoot and monitor an enterprise
network.

Define – Cisco DNA Assurance on an existing network
6
Define – Cisco DNA Assurance on an existing network
Audience
The audience for this document includes network design engineers, network operations personnel, and those who wish to
benefit from Cisco DNA Center.
Purpose of this document
This guide details the necessary steps to get Cisco DNA Assurance to an operational state. It assumes you are deploying it in
an existing network, brownfield deployment also help get telemetry from existing networks with Cisco DNA Center.
Solution overview
In this document we will assume that you have an existing network design similar to that shown in the following figure; and
you will use that network topology with Cisco DNA Center to get telemetry data from it. You may refer to the link below for
guidance on the design of your campus network.
https://www.cisco.com/c/dam/en/us/td/docs/solutions/CVD/Campus/CVD-Campus-LAN-WLAN-Design-Guide-2018JAN.pdf
Figure 3 Legacy 3-tier network with Cisco DNA Center

Design the network
7
Design the network
There are some latency requirements to consider regarding the placement of Cisco DNA Center in your network. The round
trip delay between your Cisco ISE and your network devices needs to be less than 300 msec. The other round trip delay
consideration is between your Cisco DNA Center and ISE. This needs to be no more than 200 msec.
Having said that, for this deployment guide, we decided to deploy Cisco DNA Center in the Data Center as shown in Figure 3
above, along with other services like Cisco ISE, DHCP, DNS and Microsoft Active directory (AD). These being the services in
our existing network.
The processes for integrating Cisco DNA Center to an existing deployment are as follows:
• Integrate the existing Cisco Identity Services Engine (ISE) with Cisco DNA Center.
• Configure the network site hierarchy within Cisco DNA Center and import floor maps.
• Configure network services necessary for network operation.
Process: Integrate Cisco Identity Services Engine (ISE) with Cisco DNA Center
Integration of Cisco ISE and Cisco DNA Center enables sharing of information between the two platforms, including device
and group information.
Use the following procedures to integrate Cisco ISE with Cisco DNA Center:
• Enable pxGrid services on Cisco ISE
• Configure Cisco ISE as an authentication and policy server to Cisco DNA Center.
• Permit pxGrid connectivity from Cisco DNA Center into Cisco ISE.
Procedure 1: Enable pxGrid services on Cisco ISE
1. Login to Cisco ISE web console using the IP address or fully qualified domain name of your instance.
For example: https://<Cisco ISE IPaddress or FQDN>/admin
2. Enter the credentials for your ISE instance to login.
Figure 4 Cisco ISE login window
To integrate Cisco DNA Center and ISE, pxGrid must be enabled.
3. On the ISE home screen, go to Administration > System > Deployment.

Design the network
8
Figure 5 Cisco ISE Administrator screen
4. In the Deployment screen, on the right panel, click on your ISE node. See the figure below.
Figure 6 Deployment screen
Another window will open as follows.

Design the network
9
Figure 7 Cisco ISE node
5. Check to see if pxGrid is checked. If not, check the box next to pxGrid and click on Save.
Make note of the FDQN (you will need this later for Cisco DNA Center integration with ISE).
6. Navigate to Administration > pxGrid Services.
You will see a screen similar to the figure below.

Design the network
10
Figure 8 pxGrid Services page
The next procedure of the integration needs to be done on Cisco DNA Center.
Procedure 2: Configure ISE as an authentication and policy server on Cisco DNA Center
1. Login to your Cisco DNA Center server web console using the IP address or fully qualified domain name.
For example: https://Cisco DNA Center IPaddr or FQDN>. The credentials (userid and password) you enter must have
SUPER-ADMIN-ROLE OR NETWORK-ADMIN-ROLE privileges.
2. In the top right corner of any screen within Cisco DNA Center click on the gear icon. From the drop-down menu
select System Settings
This will take you to the System 360 tab within the System Settings screen. An example is shown in the following figure.

Design the network
11
Figure 9 System setting screen – System 360 tab
3. Click on the Settings tab
4. In the navigation panel on the left side of the screen, select Authentication and Policy Servers.
This will bring up the Authentication and Policy Servers dashboard.
5. Click the Add button and add and ISE Server
6. Fill in the information within the Add AAA/ISE server panel which appears
The following table discusses the fields within the Add AAA/ISE server panel which appears.
Table 1 Add AAA/ISE server panel fields
Field
Settings
Description
Server IP Address
Text Field
The IP address of the AAA/ISE server
Shared Secret
Text Field
This is the shared secret used by network devices for communicating with the AAA/ISE
server. This is also referred to the PAC key within IOS XE device configuration.
Cisco ISE Server
Toggle
Switch
Enabled when the AAA server is a Cisco ISE server. Note that although there can be
multiple AAA servers, there can only be one ISE server (high-availability standalone ISE
deployment or distributed ISE deployment) defined to Cisco DNA Center.
Username
Text Field
This is the username of the default super admin account that you created during the
Cisco ISE installation.
Password
Text Field
This is the password of the default super admin account that you created during the
Cisco ISE installation.

Design the network
12
Field
Settings
Description
FQDN
Text Field
This is the fully-qualified domain name of the Cisco ISE server.
Subscriber Name
Text Field
This is client name which the Cisco DNA Center server will be known by to the pxGrid
service within Cisco ISE.
SSH Key
Check Box
Optional SSH key for authentication between Cisco DNA Center and Cisco ISE.
Virtual IP Address
Text Field
One or more Policy Services Nodes (PSN) may be behind a single load balancer. In
those cases, you can add the load balancer IP(s) in the Virtual IP field.
Advanced Settings >
Protocol
Multiple
Choice Radio
Button
Determines the authentication protocol(s) used. The choices are as follows:
- RADIUS - This is the default setting, using the RADIUS protocol
- TACACS - Uses the TACACS protocol
Advanced Settings >
Authentication Port
Text Field
When RADIUS is selected, the default port is 1812.
Advanced Settings >
Accounting Port
Text Field
When RADIUS is selected, the default port is 1813.
Advanced Settings >
Port
Text Field
This field appears only when TACACS is selected. The default port is 49.
Retries
Number
The number of authentication retries before failure. The default is 3.
Timeout (seconds)
Number
The number of seconds before an attempt times out. The default is 4 seconds.
For this design and deployment guide, the following information was entered.
Table 2 Add AAA/ISE server panel settings
Field
Value
Server IP Address
10.4.48.18
Shared Secret
****
Cisco ISE Server
On
Username
admin
Password
****
FQDN
ISE23.cisco.local
Subscriber Name
dnacmgmt
SSH Key
None (empty)
Virtual IP Address
None (empty)
Advanced Settings > Protocol
RADIUS
Advanced Settings > Authentication Port
1812
Advanced Settings > Accounting Port
1813
Advanced Settings > Port
Not applicable - TACACS not selected

Design the network
13
Field
Value
Retries
3
Timeout (seconds)
4
7. Click the Apply button to create the Cisco ISE server within Cisco DNA Center.
This will take you back to the Authentication and Policy Servers dashboard. The new Cisco ISE server should appear with a
Status of Active. See figure below
Figure 10 Cisco DNA Center and ISE Integration
Procedure 3: Permit pxGrid connectivity from Cisco DNA Center into Cisco ISE
1. Log back into the Cisco ISE web console using the IP address or fully qualified domain name of your instance.
For example: https://<Cisco ISE IPaddr or FQDN>/admin.
2. Navigate to Administration > PxGrid Services > All Clients.
This will take you to a screen similar to the following.
Figure 11 ISE PxGrid Services screen
3. Locate and select the Client Name in the list based upon the subscriber name you configured when adding the
Cisco ISE server to Cisco DNA Center in the previous procedure.
For this design and deployment guide the Client Name is dnacmgmt.

Design the network
14
4. Click the ✓Approve button to activate the new client.
The status of the client should transition to Online (XMPP).
Technical Note: Alternatively, you could change the pxGrid settings to automatically approve new certificate-based
accounts through the Settings tab shown in the figure above.
Cisco ISE should now be integrated with Cisco DNA Center through pxGrid.
Process: Creating the network site hierarchy for your network within Cisco DNA Center
Configuring the site hierarchy involves defining the network sites for deployment, and their hierarchical relationships.
Network sites consist of areas/sites, buildings, and floors. Their hierarchical relationship is important because child sites
automatically inherit certain attributes from parent sites. However, these attributes may be overridden within the child site
Procedure 1: Adding an area / site to a network hierarchy
1. Click on the Design workflow icon within Cisco DNA Center.
Tech Tip: By default, the Design dashboard should have the Network Hierarchy tab selected. The default Global site
should be displayed along with a map of the world.
Figure 12 Network Hierarchy dashboard
2. Click Add Site.
A small drop-down window should appear.

Design the network
15
Figure 13 Add site
3. Click on Add Area.
The Add Area pop-up window should appear.
Figure 14 Name of a site
Areas area also referred to as sites – although this can be a confusing since adding a site can refer to adding an area,
building, or floor. Areas don't have a physical address (for example, United States). You can think of areas as the largest
element of the site hierarchy. Areas can contain buildings and sub-areas. For example, an area called United States can
contain a sub-area called California. And the sub-area California can contain a sub-area called San Jose.
4. Enter an Area Name for the site.
By default, Global is the Parent for the site. You can leave that alone.

Design the network
16
5. Click Add and the site will be created under the parent node in the left menu.
Figure 15 Site added in Global
Procedure 2: Add a building within an area
6. Click on Design > Network Hierarchy > Add Site > Add Building
Figure 16 Add a building to a site
The Add Building pop-up window should appear.

Design the network
17
Figure 17 Add Building pop-up window
Buildings have physical addresses and contain floors and floor plans. When you create a building, you must specify a physical
address or latitude and longitude coordinates. Buildings cannot contain areas. By creating buildings, you can apply settings
to a specific area.
7. Enter a Building Name for the building and an Address for your building.
8. Be sure to change the Parent to San Jose | Global/.
9. Click Add and the building you just created will appear on the left. If you do not see it, be sure to expand the area.
Figure 18 Add a building to a site

Design the network
18
Procedure 3: Add a floor to your building
Floors are the spaces within the building which are comprised of cubicles, walled offices, wiring closets, and so on. You can
add floors only to buildings.
10. Click Design > Network Hierarchy > Add Site > Add Floor
Figure 19 Adding a floor to your building
The Add Floor pop-up window should appear.
11. Enter the Floor Name, select the appropriate Site, Building, and Type (RF Model).
12. Import the image of your floor plan by dragging-and-dropping a file to the pop-up window, or by selecting the
Upload file button and choosing a file from your laptop / PC.
13. Adjust the Width and Length as necessary to match the dimensions of your floor.

Design the network
19
Figure 20 Add Floor pop-up window
The Type (RF Model) setting is used to calculate heat maps for radio frequency (RF) coverage, when Access Points (APs) are
added to the floor. Choose the RF model that most closely matches the floor to which you are adding.
14. Click Add and the floor should be on the left side of the window. If the window is overshadowed by a heat map,
resize it appropriately.
Figure 21 Floor added to a building
Once you have designed your network site hierarchy of areas/sites, buildings, and floors; you are ready to create network
device credentials.

Design the network
20
Process: Configure network device credentials necessary for discovery of your devices
In this process, you will configure CLI and SNMP services that will be used later in this guide to be able to discover your
network devices.
Procedure 1: Network CLI credentials
Device credentials refer to the CLI, SNMP, and HTTPS credentials that are configured on network devices. Cisco DNA Center
uses these credentials to discover and collect information about the devices in your network. In Cisco DNA Center, you can
specify the credentials that most of the devices use so that you do not have to enter them each time you run a discovery job.
After you set up these credentials, they are available for use in the Discovery tool.
1. Navigate to Design > Network Settings > Device Credentials.
Figure 22 Device Credentials
2. In the CLI Credentials area, click Add and enter the following fields:
• Name/Description - Name or label that describes the CLI credentials.
• Username - Name that is used to login in via CLI to the devices in your network.
• Password - Password that is used to log in via CLI to the devices in your network. Passwords need to be re-entered for
confirmation and are encrypted for security reasons.
• Enable Password - Password used to move to a privileged level.

Design the network
21
Figure 23 CLI Credentials information
3. Click Save.
Procedure 2: SNMP v2c credentials
SNMP credentials are used to monitor and manage network devices. Follow the step below to create credentials for SNMP
read and write communities.
Tech Tip: In this document we will be using SNMPv2c. SNMPv3 is also supported, and generally recommended.
4. Click on Design > Network Setting > Device Credentials

Design the network
22
Figure 24 SNMP Credentials
In the SNMP Credentials area, click Add, as shown in Figure 15 above.
5. Select SNMPv2c and select Read.
Figure 25 SNMPv2 read community
6. Enter the following information, as shown in Figure 25 and click Save.
Read
• Name / Description - Name or description of the SNMPv2c settings that you are adding.
• Read Community - Read only community string password used to view SNMP information on devices.
7. Repeat Step 4 with the Write community and click Save.
Design the network
23
Write
• Name / Description - Name or description of the SNMPv2c settings that you are adding.
• Write Community - Write community string password used to view and/or modify SNMP information on devices.
Now that the design phase is done, you can move on to deploying by discovering the networks.

Deploy the network
24
Deploy the network
This section of the guide will focus on the following processes in order to get your network ready for Cisco DNA Assurance.
• Discover and manage the network devices – switches, routers, and wireless controllers (WLCs).
• Assign network devices to sites.
• Configure network devices for telemetry with Optimal Visibility within Cisco DNA Center.
Process: Discover and manage your network devices
This deployment guide uses IP address ranges for discovery of all network devices.
Tech Tip: Alternatively, you can supply an initial device for discovery and direct Cisco DNA Center to use Cisco Discovery
Protocol (CDP) to find connected neighbors.
Procedure 1: Discovering your network
The Discovery feature scans the devices in you network and sends the list to the Device Inventory under the Provision tab.
1. From Cisco DNA Center home screen, use the scroll bar and scroll to the Tools section and click on Discovery.
Figure 26 Discovery section under tools
This will take you to the Discovery Dashboard.
Deploy the network
25
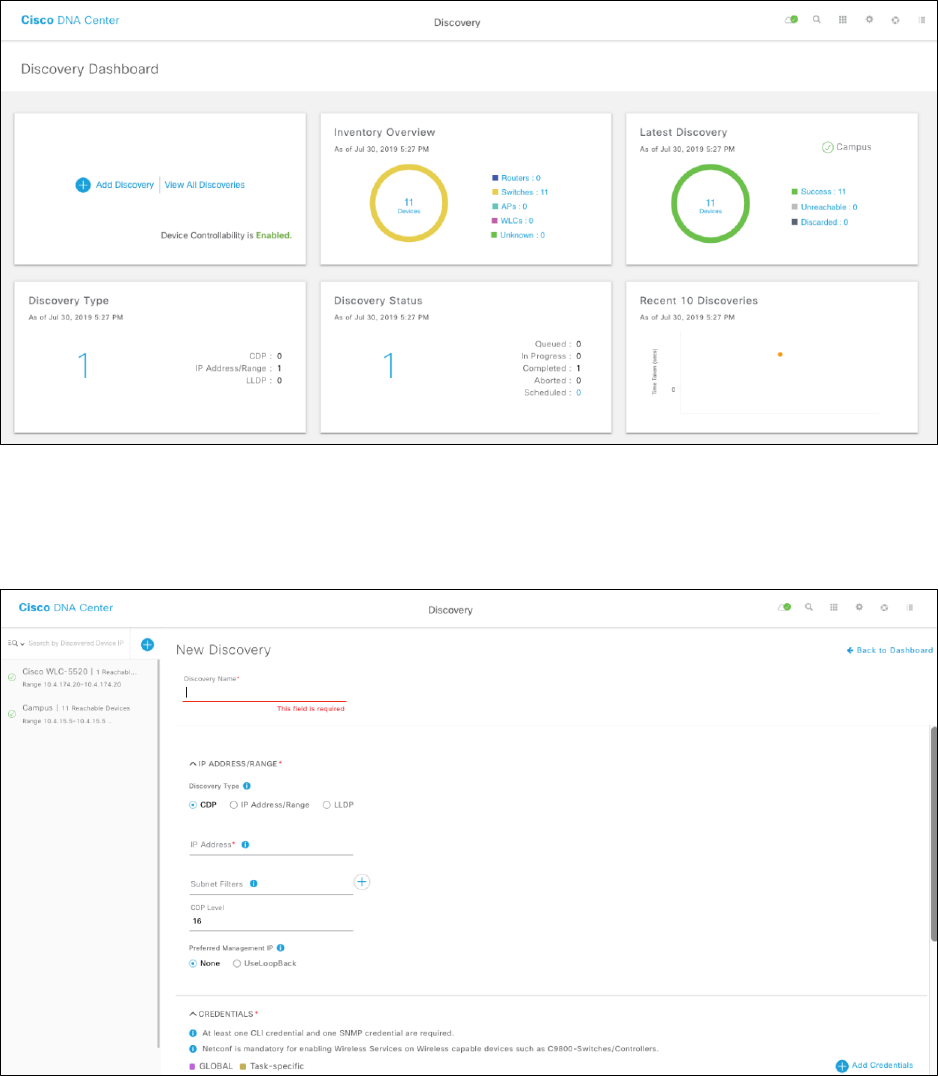
Figure 27 Discovery dashboard
2. Click on the + Add Discovery widget to create a new discovery.
This will take you to the New Discovery dashboard.
Figure 28 New Discovery dashboard
3. Expand the IP Address/Range area if it is not already visible, and configure the following:
For Discovery Type, click CDP or IP Address/Range.
• If you select CDP In the Discovery Type field, enter a seed device that is using Cisco Discovery Protocol (CDP).
• If you select IP Address/Range, the fields will change allowing you to configure a range through a beginning IP address
(From) and an ending IP address (To). You can enter a single IP address range or multiple ranges.
Deploy the network
26
Tech Tip: It is recommended to use loopback for discovery but for Layer 2 access switches, the SVI interface can use for
discovery.
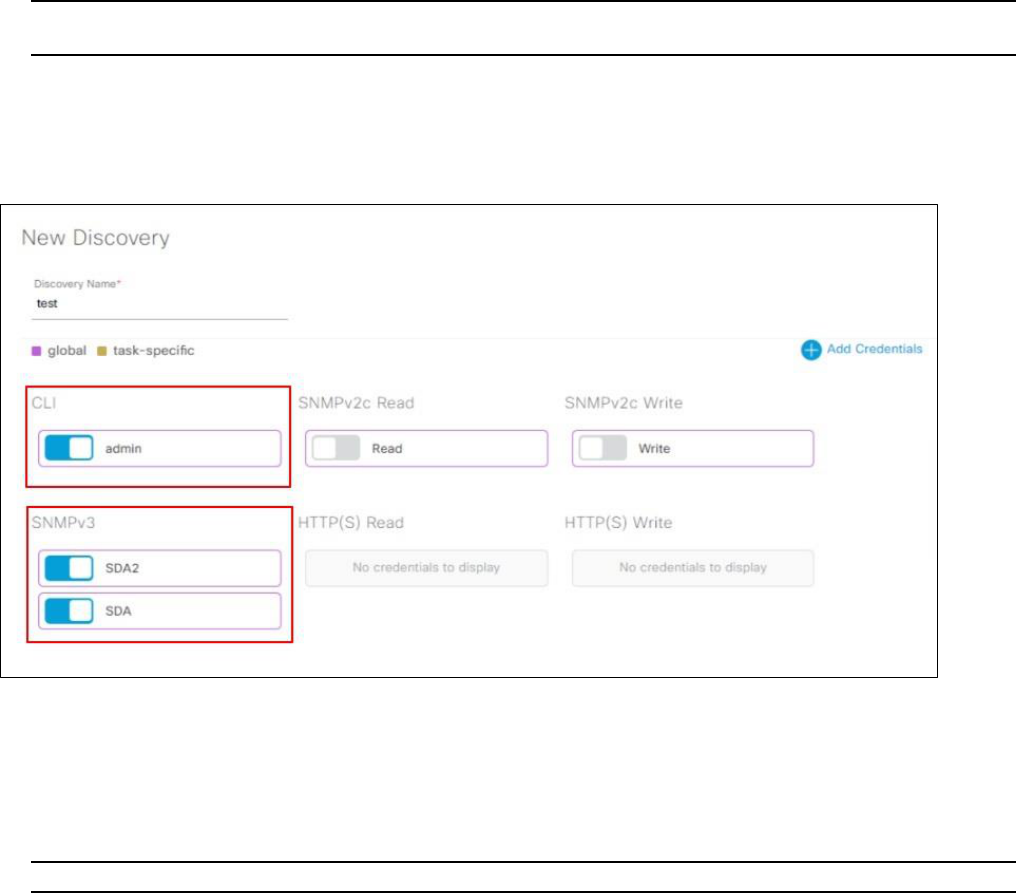
4. Expand the Credentials area if not already visible and use the credentials that were created earlier in the design
section of this guide. You can also create additional credentials here as well, if you need. Make sure that the toggle
switches next to the credential fields are set to the ON position.
Figure 29 Credential fields for CLI and SNMP
5. Expand the Advanced section if not already visible
The SSH check mark should be check by default for increase security. This is recommended method for discovering of your
network devices
6. Click on Discover at the bottom right corner start the discovery process.
Tech Tip: The time to discover your network devices varies depending on how large your network is.
The discovery details are displayed while the discovery runs. When the discovery has completed, it should appear as shown
in the following figure.

Deploy the network
27
Figure 30 Completed discovery
7. After the discovery process successfully finishes, navigate to the main Cisco DNA Center dashboard.
8. Navigate to Provision to display the inventory
This will display all the network devices that are known to Cisco DNA Center.
Figure 31 Cisco DNA Center inventory
Cisco DNA Center can access the devices, synchronize the inventory, and make configuration changes on the devices.

Deploy the network
28
Process: Assign network devices to sites
Cisco DNA Assurance displays some information based on site. Therefore, you should assign the devices discovered in the
previous process to sites (areas, buildings and floors) within the Cisco DNA Center site hierarchy created in the design
section of this guide.
1. From the Cisco DNA Center home screen, navigate to Provision to display the inventory.
This will display all the network devices that are known to Cisco DNA Center. Any devices which are not assigned to a site
will appear within the inventory table with the word “Assign” in blue under the Site column. See Figure 31 above.
2. Select one of the network devices which is not currently assigned.
From the drop-down menu under Actions select Provision > Assign Device to Site
Figure 32 Assign a network device to a site
This will bring up the Assign Device to Site side panel.
Figure 33 Assign Device to Site side panel

Deploy the network
29
3. Click the Choose a floor button.
This will bring up the Choose a floor side panel. See Figure 33 above.
4. Expand the site hierarchy and select the area, building, or floor to which you wish to assign the network device.
5. Click Save to close the Choose a floor side panel.
6. Click Assign to assign the device to the site and close the Assign Device to Site side panel.
7. Repeat Steps 1 – 8 for all other devices which are not currently assigned to a site.
Process: Configure network devices for telemetry with Optimal Visibility within Cisco DNA
Center
You should verify that all network devices which you discovered are configured for telemetry with a minimum of
optimal visibility within the Network Telemetry dashboard within Cisco DNA Center.
1. From the Cisco DNA Center home screen, use the scroll bar and scroll to the Tools section and click on Network
Telemetry.
Figure 34 Network Telemetry section under tools
This will take you to the Network Telemetry Assessment and Configuration dashboard.
2. Click on the Profile View tab.
This will display the three pre-configured telemetry profiles which can be applied to network devices.
Figure 35 Network Telemetry Assessment and Configuration – Profile View tab
The three telemetry profiles are as follows:

Deploy the network
30
• Maximal Telemetry – This enables collection of telemetry information via Syslog (Severity Level – Informational) and
via NetFlow / IPFIX (Cisco Performance Monitor (ezPM) Application Performance profile context) on the network
device. This telemetry profile is only supported on router platforms running IOS XE 16.x and higher as of Cisco DNA
Center release 1.3.0.
• Optimal Visibility - This enables collection of telemetry information via Syslog (Severity Level – Informational).
• Disable Telemetry – Neither Syslog or NetFlow / IPFIX collection of telemetry is enabled with this option.
You can create custom telemetry profiles by clicking on the Add Profile button at the top right corner of the screen.
However, this is not needed for this design and deployment guide
3. Click the “eye” icon at the far right of any of the telemetry profiles.
This will bring up the details for the selected profile. See Figure 36 for details on the Optimal Visibility profile.
Figure 36 Optimal Visibility profile details
4. Click the X in the upper right corner to close the details pop-up window when you are done viewing the telemetry
profile.
5. Within the Network Telemetry Assessment and Configuration dashboard click on the Site View tab.
6. Click Global in the navigation panel on the left to view all discovered devices.
The telemetry profile applied to each network device is listed under the Profile column.

Deploy the network
31
Figure 37 Network Telemetry Assessment and Configuration – Site View tab
7. Select any network devices which have their telemetry profiles set for Disable Telemetry.
8. From the drop-down menu under Actions, select Optimal Visibility.
Under the Profile column, the entries for these network devices should change to Optimal Visibility. This enables basic
telemetry collection on the network devices. Note that you don’t need to change any devices already configured for
Maximal Visibility.

Operate the network
32
Operate the network
This section of the design and deployment guide briefly discusses how Cisco DNA Assurance can be used to monitor and
troubleshoot the network deployment. Cisco DNA Assurance provides the ability to monitor the health of Cisco switches,
routers, WLCs, access points, and wireless clients.
A single use case – using Cisco DNA Network Assurance for visibility and troubleshooting RF issues on Access Points (APs),
and Cisco DNA Client Assurance for monitoring wireless clients – is discussed in this section.
This section of the deployment guide assumes that telemetry with Optimal Visibility is enabled for the WLCs within the
Telemetry section of Cisco DNA Center.
Use Case: Using Cisco DNA Network Assurance and Cisco DNA Client Assurance
This use case combines the use of Cisco DNA Network Assurance to gain visibility into the wireless infrastructure in order to
assist in troubleshooting RF issues on Access Points (APs), with the use of Cisco DNA Client Assurance for monitoring wireless
clients. Both combined provide a powerful tool for maintaining the health of your wireless network.
Procedure 1: Assurance home page
Tech Tip: The network administrator should see telemetry from their devices approximately 25 minutes from the time
that the devices are added to the inventory and telemetry is enabled.
1. From the Cisco DNA Center home page, click on Assurance to bring up the Assurance dashboard.
The Assurance dashboard has four drop-down menus across the top of the page - Health, Dashboards, Issues, and Manage.
By default, the Assurance dashboard displays the Overall Health page, which can be navigated to by clicking Health >
Overall.
Figure 38 Assurance dashboard - Overall Health
The Overall Health page contains multiple panels.
The top panel displays aggregate health information for network devices and clients, in separate sections. Within each
section, a percentage score (from 0% to 100%) of the health of all client or network devices over the most recent collection
interval is provided. The timeline adjacent to the health score provides a visual record of the health of all client or network

Operate the network
33
devices over the specified time period. By default, the time period is set for the last 24 hours. This can be adjusted (Last 3
Hours, Last 24 Hours, or Last 7 Days) from the drop-down menu at the top of the Overall Health page.
Each section also provides a breakdown of the overall health score. For clients, the breakdown shows the health percentage
of wired and wireless clients. This provides you with a quick visual indicator of whether any issues exist that affect the
health of wired or wireless clients. Similarly, for the network, the breakdown shows the health percentage of core switches,
access-layer switches, distribution-layer switches, routers, and wireless access points. Again, this provides you with a quick
visual indicator of where any issues may exist which affect the health of different layers of the network infrastructure.
The Top 10 Issues panel displays the top 10 issues that must be addressed. The issue with the most recent timestamp is
displayed first on the list.
The next procedure drills down into more detail around the information Cisco DNA Assurance provides around network
health.
Procedure 2: Network Health
1. From Cisco DNA Center home page, click on Assurance to bring up the Assurance dashboard.
2. Click Health > Network to bring up the Network Health dashboard.
The Network Health dashboard has several panels, each of which will be discussed. The following figure shows an example
of the first panel.
Figure 39 Network Health
The timeline at the top of the dashboard controls the time period over which the remaining panels within the Network
Health dashboard display data. By default, the time period is set for the last 24 hours. This can be adjusted (3 Hours, 24
Hours, or 7 Days) from the drop-down menu to the right above the timeline. The time period can be further adjusted by the
sliders on the right side of the timeline.
The Network Devices panel shown in the figure above has two separate sections. The section on the left provides a
percentage score of the health of all network devices for the latest collection interval – from 0% to 100%. The right panel
Operate the network
34
shows the current health score by device role (core switch, access-layer switch, distribution-layer switch, wireless access
point, or router) in a bar graph.
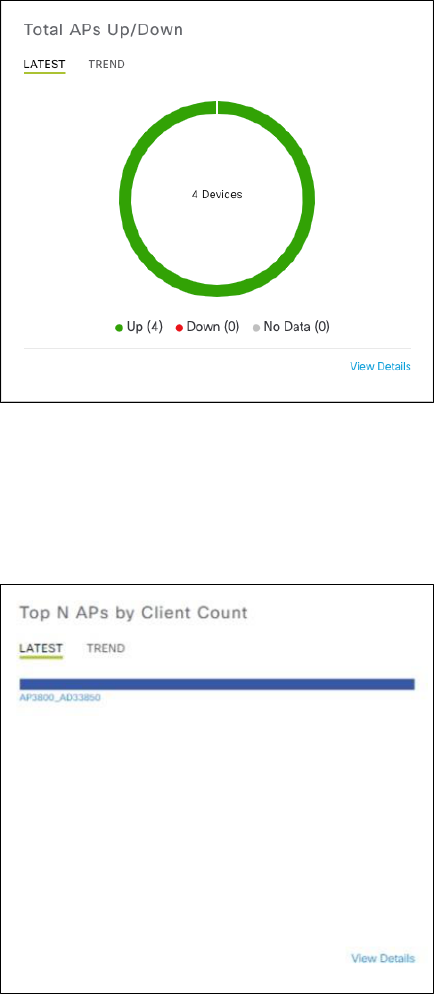
The following figure shows an example of the next panel - Total APs Up/Down.
Figure 40 Total APs Up/Down
The Total APs Up/Down panel provides the network administrator with a history (TREND tab) of Access Points that were
previously connected. The color-coded circle provides the status of the number of Access Points that are currently
connected (LATEST tab) to the network (Up) not connected (Down).
The following figure show an example of the next panel - Top N APs by client Count.
Figure 41 Top N APs by Client Count
The Top APs by Client Count panel provides the network administrator with information about Access Points with the
highest number of clients. Again, the information can be displayed historically (TREND tab) or currently (LATEST tab).
The following figure show an example of the next panel - Top N APs with High Interference.

Operate the network
35
Figure 42 Top N APs with High Interference
The Top N APs with High Interference panel provides information about Access Points with the highest RF interference. You
can choose between the 2.4 GHz and 5 GHz RF bands. Again, the information can be displayed historically (TREND tab) or
currently (LATEST tab).
The Network Devices panel is at the bottom of the Network Assurance dashboard. In order to view any information
regarding network devices, the network administrator needs to first select the device type and health.
Click in one of the predefined filters for Device, Type, and Overall Health, as shown in the figure below.
Figure 43 Predefined filters for Device, Type, and Overall Health
3. Click Apply to set filter and display the information as shown in the figure below
Figure 44 Apply filter
The Network Devices panel displays the overall health score of the network device. The panel also displays the number of
issues associated with each network device, as well as the site location of the particular device. You can us this to identify
issues associated with specific devices or sites quickly.
An example of the information is shown in the figure below.

Operate the network
36
Figure 45 Network devices
As discussed earlier, the network administrator can filter and even export the network device information by clicking on the
Export button shown in the figure above.
The next procedure drills down into more detail around the information Assurance provides around client health.
Procedure 3: Client Health
1. From Cisco DNA Center home page, click on Assurance to bring up the Assurance dashboard.
2. Click Health > Client to bring up the Client Health dashboard.
The Client Health dashboard has several panels, each of which will be discussed. The following figure shows and example of
the top-panel.
Figure 46 Client Health top-panel
The timeline at the top of the dashboard controls the time period over which the remaining panels within the Client Health
dashboard display data for both wired and wireless clients. By default, the time period is set for the last 24 hours. This can
be adjusted (3 Hours, 24 Hours, or 7 Days) from the drop-down menu to the right above the timeline. The time period can
be further adjusted by the sliders at the bottom of the drop-down menu and on the side of the timeline.
You can adjust the SSIDs and RF bands (2.4 GHz and 5 GHz) from which you want to receive wireless client information from
the drop-down menu under Filter.

Operate the network
37
Figure 47 Filtering wireless client information
The next panel displays aggregate information for all clients. The panel breaks out the information between wireless and
wired clients. This provides you with a quick visual indicator of whether any issues exist that affect the health of wired or
wireless clients.
Figure 48 Client Health – second panel
Within the panel, a percentage score (from 0% to 100%) of the health of client devices over the last collection period is
displayed by default (when the LATEST tab is selected). The collection interval for LATEST is set for every 5 minutes. The
information can also be displayed historically by selecting the TREND tab.
The next panel is the Client Health Analytic Chart, as show in figure below.
Operate the network
38
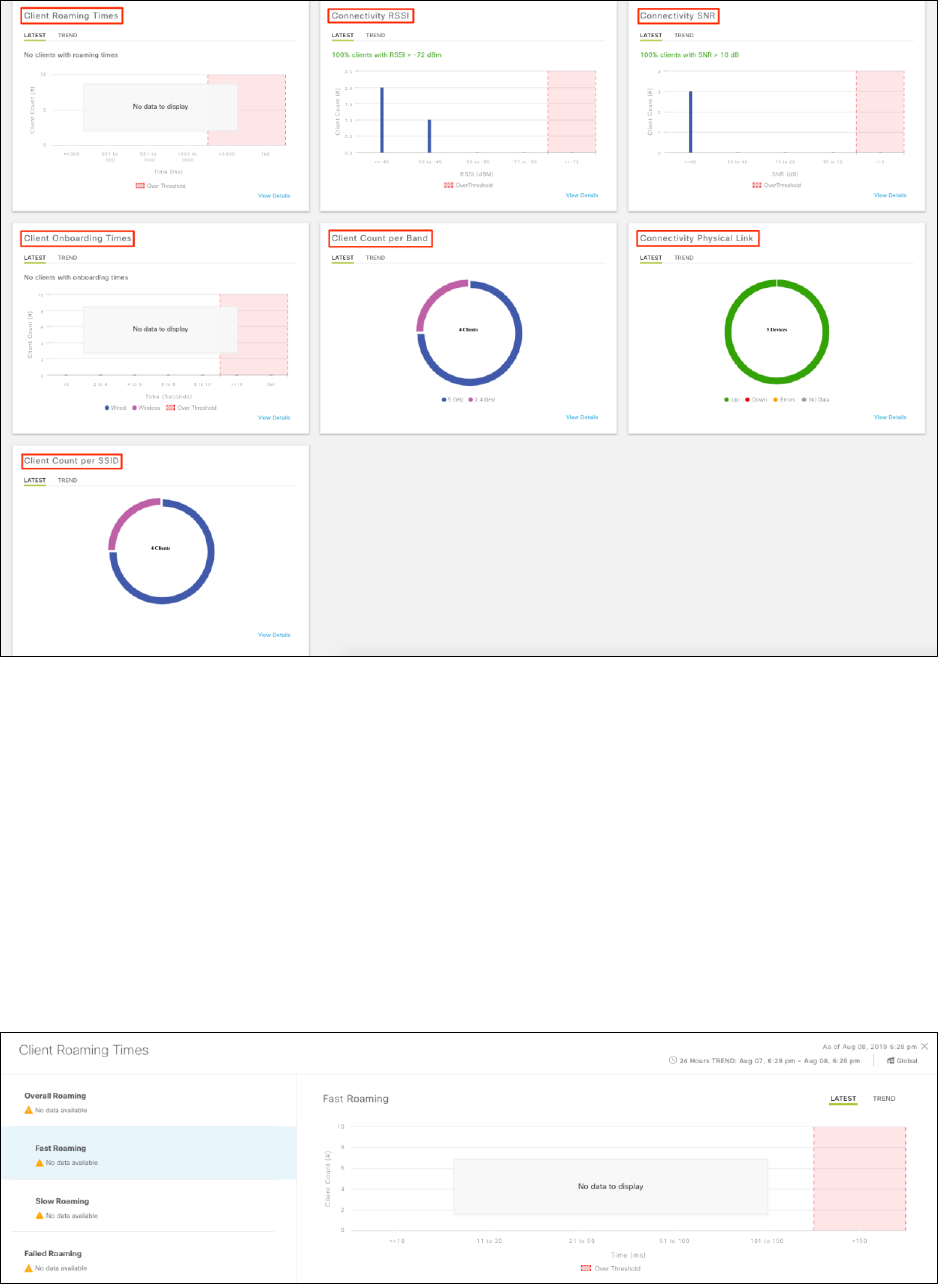
Figure 49 Client Health Analytic Chart
The Client Health Analytic Chart consists of seven different panels. All of the panels display information over a default
setting of the latest interval (5 minutes) through the LATEST tab. However, the information can also be displayed historically
(24 hours) by selecting the TREND tab.
Each of the panels is briefly discussed below.
Client Roaming Times panel
The Client Roaming Times panel shows the distribution of wireless clients by roaming and failures. This panel provides the
percentage of clients with roaming times less than 3000 milliseconds.
3. Click on View Details to bring up additional details regarding client roaming times.
An example of the detailed information provided for client roaming times is shown in the following figure.
Figure 50 Client roaming Times detail

Operate the network
39
Client Onboarding Times panel
The Client Onboarding Times panel show a distribution of the overall time for attempts to onboard taken by clients over a
displayed time interval. The default threshold for overall onboarding time is set for 10 seconds. Any onboarding times
greater than 10 seconds appear within the red shaded area of the graph.
4. Click View Details to bring up additional details regarding client onboarding times
An example of the detailed information provided for client onboarding time is shown in the following figure.
Figure 51 Client Onboarding Times detail
In the details screen, the time required to associate with an Access Point (wireless clients only), the time required for AAA
authentication/authorization to the network, and the time required to receive a DHCP address can each be displayed
separately. Individual information regarding specific clients can be displayed by selecting the appropriate filters at the
bottom of the details screen.
High onboarding times can negatively influence your end-user's perception of the overall network and decrease productivity
within your organization. The ability to break out the individual components of onboarding time provides you with valuable
information in troubleshooting the issue. For example, high association time may indicate one or more Access Points with
high CPU utilization, or simply too many wireless clients already associated. High AAA authentication/authorization times
could be indicative of your AAA server(s) being overrun with requests/responses, a possible failure of the primary AAA
server in a redundant deployment, or possibly simply poor placement of the AAA server(s) - in the case where the AAA
server(s) is remote from the location of where the clients are onboarding to the network. High DHCP times can also be the
result of your DHCP server being overrun with requests/responses, or again poor placement of the DHCP server - in the case
where the DHCP request is being relayed to a DHCP server which is remote from the location where the clients are
onboarding to the network.
Connectivity RSSI panel
The Connectivity RSSI panel shows a Received Signal Strength Indication (RSSI) distribution for all wireless clients, as LATEST
and TREND with LATEST as the default setting. The default threshold for RSSI is set for -72 dBm seconds. Any RSSI less than
-72 dBm appears within the red shaded area of the graph.
5. Click View Details to bring up additional details regarding client RSSI
An example of the detailed information provided from client RSSI is show in the following figure.

Operate the network
40
Figure 52 Client RSSI details
In this screen, client information is displayed by clicking on the bar graph. Received signal strength is a factor in determining
the rate at which a client can transmit and receive frames over a wireless network. RSSI values may help you in
troubleshooting potential performance problems within the wireless network. Low RSSI values may be the result of possible
wireless coverage issues within your deployment.
Connectivity SNR panel
The Connectivity SNR panel shows the Signal to Noise Ratio (SNR) distribution for all wireless clients, as LATEST and TREND
with LATEST as the default setting. The default threshold for SNR is set for 10. Any SNR less than 10 appears within the red
shaded area of the graph.
6. Click View Details to bring up additional details regarding client SNR.
An example of the detail information provides for client SNR is shown in the following figure.

Operate the network
41
Figure 53 Client SNR details
In this screen, client information is displayed by clicking on the bar graph.
SNR is also factor in determining the rate at which a client can transmit and receive frames over a wireless network -
generally with higher SNRs resulting in higher transmission rates for a given wireless client. Therefore, SNR values may also
help you in troubleshooting potential performance problems within the wireless network. Low SNR values may be the result
of possible wireless coverage issues within your deployment, or the result of certain types of wireless interference that
increases the 'noise' of the wireless network.
Client Count per SSID panel
The Client Count per SSID panel shows the number of clients associated with each SSID, as LATEST and TREND with LATEST
as the default setting. Information is displayed in a circular graph - visually showing the distribution of wireless clients per
SSID. Clicking the View Details link brings up additional information. Again, specific client information can be displayed by
selecting the appropriate filters at the bottom of the details screen.
It should be noted that client count per SSID does not display client count per Access Point, unless there is a single Access
Point for the given SSID. However, with some knowledge of the number Access Points for a given SSID, you may still be able
to gain some insight into possible SSIDs where the number of clients per Access Point may be resulting in decreasing
performance of the wireless infrastructure at given points in time.
Client Count per Band panel
The Client Count per Band panel shows the number of clients associated with each radio frequency (RF) band (2.4 GHz or 5
GHz), as LATEST and TREND with LATEST as the default setting. Information is displayed in a circular graph - visually showing
the distribution of wireless clients per RF band. Clicking the View Details link brings up additional information. Again,
specific client information can be displayed by selecting the appropriate filters at the bottom of the details screen.
It should be noted that client count per band does not display client count per Access Point, unless there is a single Access
Point for the given band. It should also be noted that 802.11ac does not operate in the 2.4 GHz band. However, 802.11n
can operate in both the 2.4 GHz and 5 GHz bands. Many wireless clients can be set up to connect in either the 2.4 GHz and 5
GHz bands, with a preference for one band over the other. Information regarding the number of clients per band can be
used to quickly assess whether your end-users are connecting to your wireless network using the 2.4 GHz or 5 GHz bands.
Generally, due to the lower number of overlapping channels in the 2.4 GHz band, the 5 GHz band is often preferred. Finally,
if you are migrating to 802.11ac and are interested in determining if there are any wireless clients on your network that
don't support 802.11ac, you may be able to gain some insights based on the number of clients connecting to the 2.4 GHz
band.

Operate the network
42
Connectivity Physical Link panel
The Connectivity Physical Link panel shows the aggregate number of wired client devices with link state of up, down, or with
link errors - as LATEST and TREND with LATEST as the default setting. Clicking the View Details link brings up additional
information. Again, specific client information can be displayed by selecting the appropriate filters at the bottom of the
details screen. This information includes the network device to which a given wired client is connected, the location of the
wired client, and the VLAN to which the wired client is connected. This information may be used to quickly identify and
troubleshoot issues with access-layer switches within the network.
The final panel in the Client Health dashboard is the Client Devices panel. An example is shown in the figure below.
Figure 54 Clients Devices panel
The Client Devices panel provides the similar client specific information to what was discussed when clicking on the View
Details links within the individual panels of the Client Health Analytic Chart. Individual information regarding specific clients
can be displayed by selecting the following filters.
Client TYPE gives you the choice of displaying information for all clients, only wireless clients, or only wired clients.
HEALTH gives you the choice of displaying information for clients with a given health score. The choices are to display clients
with all (any) health score, clients which are inactive (no health score), or clients with poor, fair, or good health scores.
DATA gives you the choice of narrowing the client information down to look at specific issues. The choices are to display
clients with onboarding times greater than 10 seconds, wireless association times greater than five seconds, DHCP times
greater than five second, AAA times greater than 5 seconds, or RSSI values less than -72 dBm.
7. Click on the userid under the Identifier column of a client to get more detail about that client.
The administrator can view in-depth detail about specific clients by clicking on the userid of the client within the displayed
list, as shown in the figure below.
Figure 55 Client in depth view
Operate the network
43
This design and deployment guide has only briefly touched upon how to enable Cisco DNA Assurance on your network; and
the benefits you get doing so. Additional design and deployment guides will further discuss specific features of Cisco DNA
Assurance, and the benefits of those features.

Appendix A — Product list
44
Appendix A — Product list
This design & deployment guide was created using the following hardware and software.
Table 3 Hardware and software
Functional area
Product
Software version
Enterprise SDN Controller
Cisco DNA Center running Cisco DNA Assurance
1.3.0
LAN Access Layer
Modular Access Layer
Cisco Catalyst 4500E Series 4507R+E 7 Slot Chasis with 48Gbps per
slot
03.10.01
Cisco Catalyst 4500E Supervisor Enigine 8-E Unified Access, 928
Gbps
Cisco Catalyst 9400R Series 7 Slot Chasis
16.06.03
Cisco Catalyst 9400R Supervisor 1
-
Stackable Access Layer Switches
Cisco Catalyst 9300 Series
16.06.03
Cisco Catalyst 3850 Series
16.06.03
Cisco Catalyst 3650 Series
16.06.03
LAN Distribution Layer
Extensible Fixed Distribution Layer
Cisco Catalyst 6800 Series 6880-X
15.4(1)
Modular Distribution Layer Virtual Switch
Cisco Catalyst 4500E Series 4507R+E 7 Slot Chasis with 48Gbps per
slot
03.10.01
Cisco Catalyst 4500E Supervisor Enigine 8-E Unified Access, 928
Gbps
-
Fixed Distribution Layer Virtual Switch
Cisco Catalyst 4500-X
03.10.01
Stackable Distribution Switch
Cisco Catalyst 3850 Series
16.06.03
Core Layer
Modular Core Layer Virtual Switch
Cisco Catalyst 6800 Series 6807-XL 7 Slot
155-1.SY1
The list in the Table 3 is used to validated in this doc. The following link list a complete hardware and software that is
compatible with Cisco DNA Center: https://www.cisco.com/c/en/us/support/cloud-systems-management/dna-
center/products-device-support-tables-list.html

Appendix C—Glossary
45
Appendix C—Glossary
AAA Authentication, Authorization, and Accounting
AP Access Point
Cisco ISE Cisco Identity Service Engine
CDP Cisco Discovery Protocol
DHCP Dynamic Host Configuration Protocol
ezPM Cisco Easy Performance Monitor
IPFIX IP Flow Information Export
L2 Layer 2
RF Radio Frequency
RSSI Received Signal Strength Indication
SNR Signal to Noise Ratio
SSID Service Set Identifier
SVI Switched Virtual Interface
VLAN Virtual Local Area Network
WLAN Wireless Local Area Network
WLC Wireless LAN Controller

About this guide
46
About this guide
ALL DESIGNS, SPECIFICATIONS, STATEMENTS, INFORMATION, AND RECOMMENDATIONS (COLLECTIVELY, "DESIGNS") IN THIS
MANUAL ARE PRESENTED "AS IS," WITH ALL FAULTS. CISCO AND ITS SUPPLIERS DISCLAIM ALL WARRANTIES, INCLUDING,
WITHOUT LIMITATION, THE WARRANTY OF MERCHANTABILITY, FITNESS FOR A PARTICULAR PURPOSE AND
NONINFRINGEMENT OR ARISING FROM A COURSE OF DEALING, USAGE, OR TRADE PRACTICE. IN NO EVENT SHALL CISCO OR
ITS SUPPLIERS BE LIABLE FOR ANY INDIRECT, SPECIAL, CONSEQUENTIAL, OR INCIDENTAL DAMAGES, INCLUDING, WITHOUT
LIMITATION, LOST PROFITS OR LOSS OR DAMAGE TO DATA ARISING OUT OF THE USE OR INABILITY TO USE THE DESIGNS,
EVEN IF CISCO OR ITS SUPPLIERS HAVE BEEN ADVISED OF THE POSSIBILITY OF SUCH DAMAGES.
THE DESIGNS ARE SUBJECT TO CHANGE WITHOUT NOTICE. USERS ARE SOLELY RESPONSIBLE FOR THEIR APPLICATION OF
THE DESIGNS. THE DESIGNS DO NOT CONSTITUTE THE TECHNICAL OR OTHER PROFESSIONAL ADVICE OF CISCO, ITS
SUPPLIERS OR PARTNERS. USERS SHOULD CONSULT THEIR OWN TECHNICAL ADVISORS BEFORE IMPLEMENTING THE
DESIGNS. RESULTS MAY VARY DEPENDING ON FACTORS NOT TESTED BY CISCO.
CCDE, CCENT, Cisco Eos, Cisco Lumin, Cisco Nexus, Cisco StadiumVision, Cisco TelePresence, Cisco WebEx, the Cisco logo,
DCE, and Welcome to the Human Network are trademarks; Changing the Way We Work, Live, Play, and Learn and Cisco
Store are service marks; and Access Registrar, Aironet, AsyncOS, Bringing the Meeting To You, Catalyst, CCDA, CCDP, CCIE,
CCIP, CCNA, CCNP, CCSP, CCVP, Cisco, the Cisco Certified Internetwork Expert logo, Cisco IOS, Cisco Press, Cisco Systems,
Cisco Systems Capital, the Cisco Systems logo, Cisco Unified Computing System (Cisco UCS), Cisco UCS B-Series Blade Servers,
Cisco UCS C-Series Rack Servers, Cisco UCS S-Series Storage Servers, Cisco UCS Manager, Cisco UCS Management Software,
Cisco Unified Fabric, Cisco Application Centric Infrastructure, Cisco Nexus 9000 Series, Cisco Nexus 7000 Series. Cisco Prime
Data Center Network Manager, Cisco NX-OS Software, Cisco MDS Series, Cisco Unity, Collaboration Without Limitation,
EtherFast, EtherSwitch, Event Center, Fast Step, Follow Me Browsing, FormShare, GigaDrive, HomeLink, Internet Quotient,
IOS, iPhone, iQuick Study, LightStream, Linksys, MediaTone, MeetingPlace, MeetingPlace Chime Sound, MGX, Networkers,
Networking Academy, Network Registrar, PCNow, PIX, PowerPanels, ProConnect, ScriptShare, SenderBase, SMARTnet,
Spectrum Expert, StackWise, The Fastest Way to Increase Your Internet Quotient, TransPath, WebEx, and the WebEx logo
are registered trademarks of Cisco Systems, Inc. and/or its affiliates in the United States and certain other countries.
All other trademarks mentioned in this document or website are the property of their respective owners. The use of the
word partner does not imply a partnership relationship between Cisco and any other company. (0809R)
© 2019 Cisco Systems, Inc. All rights reserved.
Feedback & discussion
For comments and suggestions about our guides, please join the discussion on Cisco Community.
© 2019 Cisco and/or its affiliates. All rights reserved.
