
Clemson University Clemson University
TigerPrints TigerPrints
All Theses Theses
8-2022
The 2021 NBA Rule Change: Analyzing Strategic Adjustments and The 2021 NBA Rule Change: Analyzing Strategic Adjustments and
Changes in Worker Productivity Changes in Worker Productivity
Jeremy Long
Follow this and additional works at: https://tigerprints.clemson.edu/all_theses
Part of the Other Economics Commons
Recommended Citation Recommended Citation
Long, Jeremy, "The 2021 NBA Rule Change: Analyzing Strategic Adjustments and Changes in Worker
Productivity" (2022).
All Theses
. 3857.
https://tigerprints.clemson.edu/all_theses/3857
This Thesis is brought to you for free and open access by the Theses at TigerPrints. It has been accepted for
inclusion in All Theses by an authorized administrator of TigerPrints. For more information, please contact

1
THE 2021 NBA RULE CHANGE: ANALYZING STRATEGIC ADJUSTMENTS AND CHANGES IN WORKER
PRODUCTIVITY
A Thesis
Presented to
the Graduate School of
Clemson University
In Partial Fulfillment
of the Requirements for the Degree
Master of Science
Economic Analytics
by
Jeremy Beckham Long
August 2022
Accepted by:
Dr. Raymond Sauer, Committee Chair
Dr. Devon Gorry
Dr. Robert Fleck
2
ABSTRACT
The NBA introduced a rule change for the 2021/22 season to stop shooters from drawing fouls
from “non-basketball moves.” This paper seeks to determine how the 2021 Rule Change has impacted
productivity in the NBA and investigate whether it has caused teams to make strategic adjustments. My
analysis reveals evidence that the rule change has limited offensive players’ abilities to draw fouls on 3-
point shots. While the rule change has rendered non-basketball moves ineffective, there is no evidence
of strategic adjustments beyond this arena. I find only limited evidence that the rule change has
impacted worker productivity. The findings imply that the rule change’s impact on the game of
basketball is localized to the foul rate on 3-point shots, and it has only a minute impact on other facets
of the game.
3
TABLE OF CONTENTS
ABSTRACT ........................................................................................................................................... 2
LIST OF FIGURES .................................................................................................................................. 4
LIST OF TABLES .................................................................................................................................... 4
INTRODUCTION ................................................................................................................................... 5
BACKGROUND ON THE RULE CHANGE ................................................................................................. 6
ECONOMIC FRAMEWORK .................................................................................................................... 7
1. The Four Factors of Basketball Production ........................................................................................ 7
2. Foul Hunting as a Strategy .................................................................................................................. 9
DESCRIPTION OF THE DATA ............................................................................................................... 11
REVIEW OF TRENDS ........................................................................................................................... 13
1. Long-Term Trends ............................................................................................................................. 13
2. A Volatile Season, the Historic Uptick in Production During The 2021/22 Season .......................... 20
3. A Quick Note on the Playoffs ............................................................................................................ 24
POSSIBLE CONFOUNDING FACTORS .................................................................................................. 25
1. Games Missed Due to Covid Protocols .......................................................................................... 25
2. The Shorter Offseason ................................................................................................................... 26
3. Attendance ..................................................................................................................................... 27
4. The New Ball .................................................................................................................................. 29
EVIDENCE OF THE RULE CHANGE’S IMPACT: STRATEGIC CHANGES AND WORKER PRODUCTIVITY ..... 31
1. A Decrease in 3-point Foul Calls .................................................................................................... 31
2. Analyzing Changes in Worker Productivity .................................................................................... 35
3. Investigating Strategic Changes ..................................................................................................... 40
LIMITATIONS AND RECOMMENDATIONS FOR FURTHER STUDY ......................................................... 43
1. Larger Sample Size ......................................................................................................................... 43
2. Access to SportsVU Data ................................................................................................................ 43
3. Player-level Data ............................................................................................................................ 44
4. Labor Market Analysis.................................................................................................................... 44
CONCLUSION ..................................................................................................................................... 45
BIBLIOGRAPHY ................................................................................................................................... 47
4
LIST OF FIGURES
Fig. 1, Effective Field Goal % from 2014/15 – 2021/22 (NBA) .............................................................. 14
Fig. 2, 3-point Ratio to Points Per Game (Basketball Reference) ......................................................... 15
Fig. 3, Points Per Game and 3-point Attempts from 2014/15 – 2021/22 (NBA) ................................... 16
Fig. 4, Free Throw Attempts from 2014/15 – 2021/22 (NBA) .............................................................. 17
Fig. 5, Offensive Rebounds from 2014/15 – 2021/22 (NBA) ................................................................ 19
Fig. 6, Turnovers from 2014/15 – 2021/22 (NBA) ................................................................................ 19
Fig. 7, Regular Season Scoring Trends from 2014/15 to 2021/22 (NBA) .............................................. 21
Fig. 8, Field Goals Made and Attempted in 2021/22 (NBA) ................................................................. 22
Fig. 9, Free Throw Attempts Per Game in 2021/22 (NBA) ................................................................... 23
Fig. 10, Players Missing Time Due to Covid-19 Protocols in 2021/22 (Hashtag Basketball) .................. 26
Fig. 11, Average NBA Attendance by Year (Statista) ........................................................................... 28
Fig. 12, 3-point % from 2014/15 – 2021/22 (NBA)............................................................................... 28
Fig. 13, Free Throw % in 2021/22 (NBA) ............................................................................................ 30
Fig. 14, Free Throw % from 2014/15 - 2021/22 (NBA) ........................................................................ 31
Fig. 15, 3-point Foul Rate from 2014/15 - 2021/22 (PBP Statistics) .................................................... 33
Fig. 16, Percent of Fouls per Source from 2014/15 - 2021/22 (PBP Statistics) ..................................... 34
LIST OF TABLES
Table 1, Summary Statistics from the Dataset .................................................................................... 12
Table 2, Multiple Linear Regression Results- 2-point Foul Rate ........................................................... 34
Table 3, Multiple Linear Regression Results- Effective Field Goal % .................................................... 37
Table 4, Multiple Linear Regression Results- Turnovers ...................................................................... 39
Table 5, Simple Linear Regression Results- 2-point Attempts.............................................................. 40
Table 6, Simple Linear Regression Results- 3-point Attempts.............................................................. 41
5
INTRODUCTION
In this paper, I analyze the effects of the 2021 NBA Rule Change. The change was implemented
to limit unproductive player behavior that negatively affected the game and viewer experience. The
2021/22 season marked the first time since 2014 that the NBA’s scoring average dropped from the prior
season (Basketball Reference). The drop off in scoring prompted me to investigate whether the rule
change was responsible for the decrease in offensive productivity. My hypothesis was that the rule
change would allow defenders to play more aggressively, thus limiting offensive productivity. My
analysis, however, reveals little evidence that productivity was affected by the rule change.
To analyze productivity in the NBA, I developed an economic framework to review the rule
change and its subsequent effects on offensive and defensive productivity. I expand on Gannaway’s
definition of worker productivity in basketball from his 2014 paper, Technological Change, Relative
Worker Productivity, and Firm-Level Substitution (Gannaway et. al.). In analyzing these effects, I
contribute a statistical analysis of the NBA’s latest changes in scoring technology to the literature on
basketball.
My analysis centers around objective statistical measures of productivity, based on Oliver’s Four
Factors of Basketball Success (Oliver). I provide some supplemental evidence from NBA players and
coaches to contextualize the rule change’s effects, however. I uncover significant trends related to
scoring and identify historically unusual shifts in offensive productivity within the 2021/22 season.
Scoring increased significantly more within the ‘21/22 season than any other season in my data. Several
other statistics like free throw attempts increased within the season as well. Despite this, scoring was
still down as a whole from the previous season.
6
I find evidence that the rule change negatively impacted players’ abilities to draw fouls on 3-
point shots but find no such evidence for 2-point shots. Additionally, I find no evidence that shot
selection was affected by the new rules. While I expected the new rules to impact other areas of the
game, it seems like teams have not made any notable strategic adjustments. Players are, however, less
incentivized to try to draw fouls through non-basketball moves.
Overall, I find the demonstrable impact of the rule change is restricted to 3-point fouls. Players
attempted nearly 25% fewer free throws from 3-point attempts in 2021/22 than the previous season.
Aside from 3-point fouls, I found the new rules were not responsible for significant shifts in productivity
in 2021/22, and I cannot identify any strategic responses from its implementation. The lacking response
from the new rules is notable, as it suggests that the rule change’s impact was isolated to just one
aspect of the game.
BACKGROUND ON THE RULE CHANGE
On September 30
th
, 2021, the NBA announced its new rule change via Twitter, “For the 2021-22
NBA season, there will be an interpretive change in the officiating of overt, abrupt or abnormal non-
basketball moves by offensive players with the ball in an effort to draw fouls” (NBA Official). The NBA
went on to emphasize points of focus: shooters launching into defenders at abnormal angles and other
non-basketball moves where offensive players initiate contact with defenders. This strategy was widely
known as “foul-hunting.” Starting in 2021, shooters would no longer be awarded free throws when they
initiated contact with defenders via non-basketball moves.
The 2021 Rule Change sought to correct the growing problem of offensive players forcing
abnormal contact to gain free throws. Before the rule change, offensive players were able to erratically
extend their body into defenders to draw a foul. This forced defenders to give more space to offensive
players to avoid being called for fouls, which in turn made it easier for offensive players to find open
7
shots. Thus, the expected result of the rule change is two-fold: offensive players will draw fewer fouls
and defensive players will be able to guard offensive players more tightly. This is not the only possible
effect; the rule change could embolden defenders and cause an increase in foul calls as they play more
aggressive defense.
The foul-hunting problem was especially pronounced on 3-point shots. Defenders did not want
to give up an open 3-pointer, as that has proven to be one of the most efficient shots in basketball. At
the same time, they dreaded getting called for a foul when defending a 3-point attempt closely enough
for a shooter to initiate contact. It was a catch-22 situation for defenders, who were often limited in the
ways they could defend shooters. The issue became more apparent as NBA teams increased their rates
of 3-pointers in recent years, as offensive players gained more chances to draw shooting fouls.
The 2021 Rule Change was overwhelmingly met with positivity by players and fans alike.
Spectators had often decried the “non-basketball” moves employed by shooters, saying that it made for
poor basketball. A poll of fans found 87% to be in support of the rule change (Rivas). 2022 NBA Finals
MVP Steph Curry was quoted on the topic before the season as saying, "the goal is to put the ball in the
basket and not be out there just living and dying by trying to get to the free-throw line any way you can.
I love the effort" (Slater). I seek to find if that effort was validated.
ECONOMIC FRAMEWORK
1. The Four Factors of Basketball Production
One goal of the research is to identify how NBA worker productivity changed in response to the
2021 Rule Change. Since the rule change is concerned with how fouls are called, I focus on behavior
relating to gaining free throw attempts. I am also interested in substitutes for free throw attempts, as
they allow us to observe behavioral changes stemming from the rule change.
8
From an economic perspective, the rule change can be viewed in a similar manner to that of the
introduction of the 3-Point line in 1979. Gannaway calls that introduction an “exogenously imposed
change in technology for scoring points in the NBA” in his 2014 paper (Gannaway et. al.). I view the
2021 Rule Change in a similar light, as it was an exogenously imposed change made by the league that
took away a vehicle for scoring. While the rule change is probably not as impactful to the game of
basketball as the introduction of the 3-point line, it could potentially affect players’ productivity in a
similar manner.
Gannaway’s paper measures worker productivity for NBA players in terms of “points per
attempt” on shots. Per NBAstuffer, Points Per Shot is calculated by taking the total number of points
from 2-point and 3-point attempts and dividing that by the total number of field goal attempts
(NBAstuffer). While this is a useful metric, it is crude in the sense that it does not take free throws or
defense into account and is therefore limited in its application for the 2021 Rule Change. Rather than
following Gannaway’s methodology here, I take a multi-faceted approach to measuring worker
productivity by using Oliver’s “Four Factors of Basketball Success.”
Dean Oliver is a former player, coach, and pioneer in the field of basketball statistics
(NBAstuffer). His four factors are the elements he found to be most crucial to winning in basketball;
they apply to offense and defense. From the offensive perspective, the four factors are shooting the ball
efficiently, limiting turnovers, rebounding effectively, and taking as many free throws as possible—in
that order (Oliver). On defense, teams seek to limit the offense’s ability to execute the four factors.
These factors were not picked arbitrarily—they are rooted in basketball efficiency metrics. In fact, a
2017 review of the four factors used regression analysis to find that they explain 91.7% of the variation
in a teams’ win totals (Jacobs).
9
The four factors serve as simple, useful metrics to analyze worker productivity in the NBA. To
further specify these metrics: shooting is measured by effective field goal percentage, a weighted metric
that takes the impact of 3-point shots into account; rebounds are measured in terms of offensive
rebounds; and turnovers and free throw attempts are measured by their counting stats. The
interpretation varies accordingly from the defensive perspective.
Out of the four factors, I am most focused on how the rule change affects shooting and the
number of free throws a team takes. Changes in shooting would be captured in how teams adjust their
shot selection in the absence of viable non-basketball moves. The potential effect on free throws is
more straightforward, as I would expect teams to attempt fewer free throws after the rule change.
Turnovers should increase as defensive productivity improves from the rule change. It is possible that
rebounding could be indirectly affected by the rule change, but there is too much noise surrounding this
stat to draw reliable conclusions. I attempt to measure the impact of the rule change on shooting,
turnovers, and free throws through statistical and regression analysis.
Oliver’s Four Factors of Basketball Success lend a way to measure worker productivity in the
NBA. If the exogenous change in the rules affects offensive productivity, it should do so via shooting
efficiency and free throw attempts, as it takes away an avenue for scoring. I would expect a similar
response in turnovers to indicate changes in defensive productivity. The direct effect of the rule change
should limit the number of fouls players can draw, and the ripple effects should impact other aspects of
the game.
2. Foul Hunting as a Strategy
NBA players, teams, and coaches employ numerous strategies to score points and limit their
opponent’s production. Some strategies occur on a broad scale throughout the season, while others
manifest only in niche situations. The rule change should express itself in situations where players try to
10
strategically foul hunt. Basketball is essentially a 2-player game, where offenses and defenses react to
each other’s strategies and adjust accordingly. There is a third party present, however; that being the
referees. Here, we define foul hunting as a strategy relative to all three parties and contextualize its role
in the game of basketball.
Changes in basketball are typically met with adjustments from both sides. An example of this is
the “Hot Hand” phenomenon. The paper Momentum Isn’t Magic—Vindicating the Hot Hand with the
Mathematics of Streaks finds that players do shoot slightly better after making consecutive shots
(Miller). The resulting adjustment is that defenders key into the shooter with the hot hand; the
shooter’s teammates benefit from this as they are left open. The improvement in team performance
resulting from the Hot Hand phenomenon is noted in Dixit’s Thinking Strategically and it highlights the
connected nature of basketball (Dixit).
In the case of the 2021 Rule Change, all three parties in the game of basketball are affected by
the rule change and should be expected to make strategic adjustments. Defenders no longer have to
worry about being called for fouls when the offensive player initiates contact, so they should be able to
play a more focused style of defense. Offensive players are more reliant on lapses in officiating if they
wish to foul-hunt and cannot rely on their old strategies as heavily. Referees need to focus on calling
the new rules, which could take some acclimation and potentially limit their attention to detail in other
areas of the game.
Before the rule change, offensive players would repeatedly attack defenders to initiate contact
and draw fouls. This necessitated a cautious approach for defenders. With the new rules, offensive
players should not be able to repeatedly foul hunt in a game with success, as refs will zone into that
player’s behavior and their attempts will be rewarded with few free throws, if any. It is still possible that
11
a player can successfully draw a foul or two by catching the refs off guard, but these attempts must be
well-timed. In general, we expect players to substitute away from foul hunting.
In the absence of foul hunting, I expect players and refs to make strategic adjustments.
Offensive players must rely more on other strategies; this could manifest in differences in shot selection.
Defenders and refs must also shift their attention accordingly. In particular, defenders should be able to
play more aggressively. We investigate broader strategic adjustments later in the paper.
DESCRIPTION OF THE DATA
I drew my data from a variety of sources to observe the impact of the rule change from as many
angles as possible. I scraped box score data from the NBA’s website and downloaded detailed foul-
related data from PBP Statistics. ESPN provided attendance data and Basketball Reference gave season-
long averages for certain stats. The main cross-sectional dataset is comprised of dozens of team
performance statistics from game-level observations. This gives granular data that allows for precise
results in my analysis. My dataset contains basic box score data, information on the sources of fouls,
advanced penalty metrics, season-long averages, the game’s date, location, and attendance numbers.
Summary statistics are shown in table 1:

12
Table 1, Summary Statistics from the Dataset
I include data from every regular season NBA game, starting in the 2014/15 season and going
through 2021/22. 2014/15 was chosen as it marks the first season where all teams had season-long
access to “SportsVU” technology. SportsVU is motion-tracking technology that allows NBA teams to
analyze aspects of the game that were not possible before (NBAstuffer). The statistical insights it offers
have driven many changes in the way teams approach the game of basketball. Examples include an
increased emphasis on three-point shooting and gaining free throw attempts. I refer to my statistically
driven subset of seasons as the “SportsVU Era.”
The data used in this research excludes games played in “the bubble,” the NBA’s quarantined
site for the 2019/20 season after the onset of the Covid-19 pandemic. Cecchin’s paper, Oliver’s Four-
Factor Model: Validation through Causality, considers these games to be outliers due to the large
13
number of statistical anomalies from the bubble (Cecchin). I follow this reasoning and exclude the
bubble games from my dataset.
One aspect of NBA games relating to the pandemic is attendance. Many stadiums had
restrictions resulting in few to no fans attending games during the pandemic. This is important to
control for, but game-by-game data on attendance is not readily available. Instead, I approximate
attendance using each team’s season-long attendance averages (ESPN). While this is an imperfect
measure of attendance, it largely controls for the reduction of fans in the 2020/21 season, when several
arenas did not allow a single fan to attend all season. Additionally, I use each stadium’s difference from
the mean attendance in my regressions to give better insight into the effects of below average
attendance.
In total, my dataset contains 18,862 observations of team performance in the regular season,
which equates to a sample of 9,431 games with data for both teams. The sample size is large enough to
yield significant insights. It also allows us to easily analyze trends across and within seasons.
REVIEW OF TRENDS
1. Long-Term Trends
Understanding the context of recent statistical trends in the NBA is crucial to understanding how
the new rule change fits into the game of basketball. Much of the conventional wisdom of the sport has
been abandoned since the introduction of SportsVU, as teams race to score more efficiently. Offenses
have gravitated towards 3-point shooting and “positionless basketball,” with 7-footers commonly
shooting better than guards did in past eras. This has culminated in players performing better at Oliver’s
Four Factors and increasing productivity. In this section, I analyze the trends that have impacted worker
productivity the most in recent years.

14
Oliver’s first factor is shooting, measured by efficient field goal % (EFG). EFG appropriately
weighs the value of 3-point shots by counting made attempts as 1.5 field goals, as opposed to traditional
field goal % which counts them the same as 2-pointers. Thus, EFG is a better measure of shooting
efficiency than traditional FG%. As shown in figure 1 below, it improved every year until dipping slightly
in 2021/22:
Fig. 1, Effective Field Goal % from 2014/15 – 2021/22 (NBA)
The consistent improvement in EFG highlights the impact SportsVU technology has had on NBA
basketball. One might assume that the increase is due to better shooting, but that is not the case.
Traditional field goal percentage has stayed mostly constant over the time span (NBA). Rather, the
increase is primarily due to better shot selection. Teams have foregone low-efficiency mid-range
jumpers in favor of 3-pointers, and the results are paying dividends. Figure 2 shows how a higher diet of
3-point shots results in better scoring:
0.47
0.48
0.49
0.5
0.51
0.52
0.53
0.54
0.55
2014 2015 2016 2017 2018 2019 2020 2021
Average EFG from 2014/15 - 2021/22
EFG

15
Fig. 2, 3-point Ratio to Points Per Game (Basketball Reference)
Teams clearly score more when they shoot a higher ratio of 3’s to 2’s. Accordingly, teams have
increased the number of 3-pointers taken per game every year since 2014. This has resulted in better
scoring year-over-year until 2021/22 (see figure 3):

16
Fig. 3, Points Per Game and 3-point Attempts from 2014/15 – 2021/22 (NBA)
It is clear the increased number of 3’s that teams take has improved scoring and efficiency. At
the same time, teams have reduced the number of 2’s they have attempted. This is important to bear in
mind, as I am interested in whether the rule change has affected shot selection.
Free throw attempts (FTA) are how Oliver measures a team’s ability to get to the free throw
line. I would expect this to be the factor most influenced by the rule change. The past few seasons have
been a rollercoaster for this stat, as shown in figure 4:
20
22
24
26
28
30
32
34
36
38
40
95
97
99
101
103
105
107
109
111
113
2014 2015 2016 2017 2018 2019 2020 2021
3-
point Attempts Per Game
Points Per Game
Axis Title
Scoring and 3PA from 2014/15 - 2021/22
PPG 3PA

17
Fig. 4, Free Throw Attempts from 2014/15 – 2021/22 (NBA)
There is no clear time trend. This makes some sense, as free throws are a volatile stat that can
vary depending on a ref’s mood. Players consistently attest to officiating varying from game to game, so
we should not expect consistency across seasons.
What is surprising is the slight increase in FTA from the ‘20/21 to ‘21/22 seasons. The rule
change was introduced to curb the number of free throws players drew, but that effect is not evident in
the most fundamental free throw statistic. Surprisingly, worker productivity measured by free throw
attempts rose slightly after the rule change. This could be evidence of the rule change’s ineffectiveness,
or simply due to the long-term trend of free throw volatility. I investigate this further in subsequent
sections.
Oliver’s remaining factors are rebounding and turnovers. The new rules are not likely to have a
direct effect on rebounding; we would only expect this stat to shift in response to changes in shot
selection. Turnovers, however, represent a useful metric to evaluate the rule change’s impact on
20.5
21
21.5
22
22.5
23
23.5
2014 2015 2016 2017 2018 2019 2020 2021
Free Throw Attempts from 2014/15 - 2021/22
FTA
18
defensive productivity, though the effect here may also be indirect. Both statistics are as volatile as FTA,
as shown in figures 5 and 6:

19
Fig. 5, Offensive Rebounds from 2014/15 – 2021/22 (NBA)
Fig. 6, Turnovers from 2014/15 – 2021/22 (NBA)
20
A downward trend is plausible in both graphs, but the volatility limits our ability to investigate
the direct effect of the rule change. For this reason, it is more straightforward to investigate the effects
on Oliver’s other two factors. Turnovers and rebounds are key components in evaluating offensive and
defensive productivity in basketball, but they are less likely to be directly impacted by the new rules
than shooting and free throw attempts.
I am interested in investigating the rule change’s impact on offensive productivity via EFG and
FTA, and the impact on defensive productivity via turnovers. The decrease in EFG in the 2021/22 season
makes sense given the new rules, but FTA did not take an expected plunge. Furthermore, teams turned
the ball over less in ‘21/22, indicating that defensive productivity did not improve. The results are not
intuitive and imply that either the rule change is playing out in unexpected ways, or there are other
factors impacting productivity.
2. A Volatile Season, the Historic Uptick in Production During The 2021/22 Season
The 2021/22 NBA season saw a historic uptick in scoring from the beginning of the season to
the end. In fact, stats across the board rose meteorically after the first two months of the season. This
is atypical, to say the least. Scoring rose from 107.2 PPG in November ’21 to 115.7 in April of the same
season. Teams generally perform better in the second half of the season, but the trend here is unique.
The range in ‘21/22 was 3 points larger than any other in the dataset, and no other season
demonstrated such a clear upward scoring trend throughout the season. Regular Season scoring trends
for each year in our data are shown in figure 7:

21
Fig. 7, Regular Season Scoring Trends from 2014/15 to 2021/22 (NBA); Note: 2019 Regular Season data
ends in March and the 2020 data starts in December due to the Pandemic
Points per game skyrocketed after November in 2021; the question is why? From a basic
statistical perspective, teams improved their shooting percentages. Made field goals increased over the
course of the season, but field goal attempts generally decreased over the same span (see figure 8):
98
100
102
104
106
108
110
112
114
116
118
Oct Nov Dec Jan Feb Mar Apr
Regular Season Scoring trends from 2014/15 - 2021/22
2014 2015 2016 2017 2018 2019 2020 2021

22
Fig. 8, Field Goals Made and Attempted in 2021/22 (NBA)
This does little to explain the root cause of the shifts. It is unlikely that a drastic, league-wide
increase in player skill is solely responsible for the uptick in scoring. The shift could be interpreted as
evidence of short and long run effects of the rule change, as players adjusted their behavior to the new
rules after an initial depression in scoring. There are other possible explanations, however. Figure 9
shows a similar trend for free throw attempts in ‘21/22:
38
38.5
39
39.5
40
40.5
41
41.5
42
42.5
86
86.5
87
87.5
88
88.5
89
89.5
90
Oct Nov Dec Jan Feb Mar Apr
FGA and Made Field Goals in the 2021/22 Season
FGA FGM

23
Fig. 9, Free Throw Attempts Per Game in 2021/22 (NBA)
Free throws follow the same upward trend, ultimately resulting in a higher number of attempts
than the previous season. Players drew 16.7% more free throws by the end of the season than the
beginning, highlighting a huge increase. It is unlikely that players would adjust to the rule change
quickly enough to produce more FTA than the previous season. While players might have adjusted their
foul-hunting strategies by the end of the season, there is likely more at play. One explanation is that
adjustments in officiating are responsible for the increase in free throw attempts, and possibly scoring
as a whole.
There is no shortage of evidence showing that referees making biased calls in professional
sports. Referees in various soccer leagues have been shown to make biased calls if they do not have a
financial incentive to call the game by the book (Sauer). Similarly, NBA refs were fixing games as
recently as 2007 (Eden). Suffice to say, this would not be the first instance of inconsistent officiating.
18
19
20
21
22
23
24
Oct Nov Dec Jan Feb Mar Apr
FTA in the 2021/22 Season
24
The NBA’s preferences influence referees’ decisions, since the refs serve as the league’s way of
ensuring a consistent style of play. Research from Price et. al.’s Subperfect Game: Profitable Biases of
NBA Referees finds evidence that referees make biased calls in favor of the NBA’s bottom line (Price et.
al.). After the first two months of the ‘21/22 season, scoring was on pace to revert to ‘17/18 numbers,
and free throw attempts would have been the lowest in the SportsVU era. High scoring games have
long been a staple of the NBA’s brand, so the league might have worried for its revenue after seeing a
sudden drop off in scoring at the beginning of the ‘21/22 season. In this case, I would expect the league
to favor a more relaxed interpretation of its new rules, allowing offensive players to draw more free
throws.
The effect of officiating on the game of basketball is difficult to quantify outside of foul
numbers. I have limited resources to evaluate referee performance, so I cannot control for inconsistent
officiating in my analysis. This is unfortunate, as refs have tremendous influence over the game, and I
would like to observe their impact on productivity.
In summation, the shifting scoring trends in the 2021/22 season make it difficult to isolate the
effect of the rule change. Whether the refs caused the shifts or not, the driver of these trends is
responsible for much of the variation in scoring and productivity in the ‘21/22 season. It is still possible
the changes are related to the rule change, which I investigate in subsequent sections
3. A Quick Note on the Playoffs
While scoring exploded by the end of the 2021/22 season, that trend did not carry into the
playoffs. Scoring dipped below its marks from the past two seasons (Basketball Reference). I might
expect free throws to dip as well as a result of the rule change, but they increased from last season. This
is further evidence of the rule change’s limited impact in the ‘21/22 season.
25
The playoffs offer too small of a sample size to draw firm conclusions, and they are also unique
because they only involve games between the NBA’s best teams. It seems like the rule change’s impact
was on par with the regular season going off scoring and free throw numbers. For these reasons, it is
not worth digging too deeply into the outcomes of the playoffs.
POSSIBLE CONFOUNDING FACTORS
Here, I investigate different factors that could affect productivity in 2021/22 besides the rule
change. These consist of other unique factors in the NBA between the ‘21/22 season and past seasons
that could present confounding variables in my analysis of the rule change. Many of these differences
stem from the wake of the Covid-19 pandemic. They include the return of fans to stadiums, the NBA’s
shortened offseason, and time players missed due to Covid itself. Additionally, I look into the effects of
the NBA’s new ball and possible changes in referees’ behavior during the season.
1. Games Missed Due to Covid Protocols
The impact of the Covid-19 pandemic cannot be discounted when considering factors that
influenced the 2021/22 season. It caused schedule changes in the two prior seasons, and a shorter
offseason for ‘21/22. Additionally, it directly impacted the game as players missed time due to illness or
protocols. I compare the spikes in time missed due to Covid with scoring trends in the 2021/22 season.
Figure 10 shows how many players missed time due to Covid-19 protocols in each month of the season:

26
Fig. 10, Players Missing Time Due to Covid-19 Protocols in 2021/22 (Hashtag Basketball)
NBA players dealt with Covid alongside the rest of society, as cases peaked in December and
January across the United States (CDC). I would expect teams to perform worse on both sides of the ball
in those months, as players missed time. This does not align with the period when offenses performed
at their worst, however. Teams started their upward scoring trend in December, when protocols
peaked. Scoring continued to increase steadily through the rest of the season as well, so it is unlikely
that the time missed due to protocols was depressing scoring significantly. Defensive performance
might have declined more than offensive performance with players out. If Covid impacted worker
productivity via missed time, that impact is ambiguous.
2. The Shorter Offseason
The time between the ‘20/21 and ‘21/22 seasons was shorter than usual, as the league rushed
to get its schedule back on track after the pandemic disrupted it. The previous NBA Finals ended in July,
with the ‘21/22 season starting in October; the offseason was about a month shorter than usual. This
was the second season in a row where players had less time to rest, as the NBA shortened the prior
0
50
100
150
200
250
Oct Nov Dec Jan Feb Mar Apr
Players in Covid-19 Protocols in 2021-22
27
offseason even more drastically. The shorter off seasons caused concern for player health and
conditioning. The 2020/21 season featured the most injuries since 2009, according to Bleacher Report
(Zucker).
While the shorter offseason certainly affected players’ conditioning and preparation for the
‘20/21 and ‘21/22 season, there is not an easy way to measure its effect. Other NBA off seasons have
historically been consistent in terms of length, so there is not much to compare it to. The ‘20/21
season’s scoring numbers did not trend upward within the season like they did in ‘21/22 so it is unlikely
that the shorter 2021 offseason was responsible for the shift. I can use the shorter offseason to help
explain aspects of the 2021/22 season qualitatively, but I cannot control for it in statistical analysis.
3. Attendance
The Covid-19 pandemic did not just affect players; it also affected fans who could not attend
games. Attendance is likely to impact players’ shooting, as fans cause distractions. This is particularly
relevant when considering the effects of the Covid-19 pandemic, since NBA stadiums were at reduced
capacity or completely empty throughout it. This had an obvious impact on attendance in the 2020/21
season, as shown in figure 11:

28
Fig. 11, Average NBA Attendance by Year (Gough)
Attendance has yet to return to pre-pandemic levels. The low attendance in 2020/21 might
partially explain the high shooting percentages in that season. A graph of 3-point percentage (3p%) in
different seasons is shown in figure 12:
0.00
5.00
10.00
15.00
20.00
25.00
Average NBA Game Attendance by Year
33
33.5
34
34.5
35
35.5
36
36.5
37
37.5
2014 2015 2016 2017 2018 2019 2020 2021
3p% from 2014/15 - 2021/22
avg
29
Fig. 12, 3-point % from 2014/15 – 2021/22 (NBA); Note: includes 95% confidence intervals for each
season
Teams shot significantly better in 2020/21 than they did in any season but 2017/18 at the 95%
confidence level. Seeing this, it is important to control for the effect of attendance. I control for
attendance with my approximated data, which admittedly leaves room for error. This method still
controls for most of the effects of the pandemic on attendance though, as attendance was steadily near
zero in 2020/21.
4. The New Ball
Another possible confounding factor for the 2021/22 season is the NBA’s new ball. After 38
years with the iconic Spalding ball, the NBA switched over to Wilson and their ball (Sundaresan). Several
players made complaints about the new ball amid a sluggish start to the season. All-star Paul George,
who posted his worst 3-point percentage since 2010, was quoted as saying, "It's a different basketball.
It don't have the same touch and softness that the Spalding ball had” (Sundaresan). Wilson, for their
part, claims that their new ball is identical to the Spalding ball.
This was not the first time the NBA introduced a new ball. In 2006, the NBA introduced a new
synthetic ball to replace the classic leather one. Players were even more upset about the new ball in
2006, causing the NBA to reverse course just halfway into the season. Dallas Mavericks owner Mark
Cuban commissioned research on the 2006 ball to analyze differences in player performance and
qualities of the ball (Julian). While the full extent of the methods used in that investigation is beyond
the scope of this research, I can borrow their usage of two key stats to evaluate the impact of the ball:
free throw shooting and turnovers.
It is possible that players were affected by the new ball and needed time to adjust. Free throw
shooting is particularly useful in isolating the effect of the new ball, as it is the only major difference in

30
free throws from years past. If players were truly adjusting to the new ball as the season went on, I
would expect improved performance during the season. Figure 13 shows evidence of this, though there
were not statistically significant differences in shooting percentage from the beginning of the season to
the end:
Fig. 13, Free Throw % in 2021/22 (NBA); Note: includes 95% confidence intervals for each month
The lack of significant differences in shooting suggests that if players were adjusting to the new
ball over the course of the season, it did not have a large impact on performance. Furthermore, players
shot just as well or better than they had in recent seasons, as shown in figure 14. This further indicates
that players were not adversely affected by the new ball:
71
72
73
74
75
76
77
78
79
80
81
Oct Nov Dec Jan Feb Mar Apr
Free Throw % in 2021-2022
avg

31
Fig. 14, Free Throw % from 2014/15 - 2021/22 (NBA)
Free throw percentage only gives a partial view as to the effects of the new ball. Turnovers help
contextualize how players adjust to the new ball’s grip; an adverse effect in grip-ability should manifest
in more turnovers. Of course, there are several other facets of the game where the new ball could
affect play. Still, free throw shooting and turnovers help to partially control for the effect of the new
ball with the data at my disposal.
EVIDENCE OF THE RULE CHANGE’S IMPACT: STRATEGIC CHANGES AND WORKER PRODUCTIVITY
1. A Decrease in 3-point Foul Calls
To gauge expectations for how the new rules impact fouling, I look to the work of McCormick
and Tollison in their paper Crime on the Court. This paper analyzes the decrease in “crime,” or fouls
committed, after the introduction of a third ref in college basketball. They found crime’s supply
elasticity of demand to be relatively elastic and inferred that increased surveillance results in a
significant decrease in fouling and “nonproductive behavior” (McCormick, 1984). Put simply, players
foul less when the risk of getting caught increases.
74
74.5
75
75.5
76
76.5
77
77.5
78
78.5
2013 2014 2015 2016 2017 2018 2019 2020 2021 2022
FT% from 2014-15 through 2021-22
32
In the case of the rule change, the NBA changed the definition of crime to be fairer to defenders.
With this change, defenders are free to play tighter defense, while shooters cannot force contact to gain
fouls. I expect players to respond to this change by seeking fewer fouls, and for defensive shooting fouls
to drop significantly. In particular, I expect that offensive players will not draw as many fouls on 3-point
shots, where non-basketball moves were exploited the most.
The rule change was introduced to stop “non-basketball moves” on shot attempts. These non-
basketball moves were most prevalent on 3-pointers. There are several reasons as to why shooters
tried to force contact more on 3’s than 2’s. The main reason has to do with the opportunity cost of
drawing contact in that manner.
Unnatural shooting motions naturally lead to worse shots and more misses; however, a player
was often willing to sacrifice his odds of making a field goal for the chance at taking 3 free throws. This
is amplified by the fact that 3’s already have a lower chance of going in than 2’s, so players sacrificed
less to potentially gain more points at the free throw line. With the new rule change, the opportunity
cost of taking unnatural shots has increased. There was a significant drop in the rate at which players
drew fouls on 3-pointers in 2021/22, shown in figure 15:

33
Fig. 15, 3-point Foul Rate from 2014/15 - 2021/22 (PBP Statistics); Note: includes 95% confidence intervals for each year
The 3-point foul rate declined by nearly 25% from 2020/21 to 2021/22. It was also significantly
lower in ‘21/22 than any prior season, at the 95% confidence level. Aside from inconsistent officiating,
none of my confounding factors should significantly affect this metric, so I am confident the rule change
is responsible for it. The time trend highlights how teams exploited the ability to draw fouls on three-
point attempts prior to the rule change, and their inability to afterwards.
I expected the 2-point foul rate to decrease as well, but this was not the case. While it briefly
dipped below historic levels in October and November of 2021, it eventually returned to slightly higher
levels than the previous season. 2-point Fouls contribute much more to FTA than 3pt Fouls, as they are
far more common (see figure 16):
1.30%
1.36%
1.74%
1.58%
1.50%
1.66%
1.42%
1.07%
0.80%
0.90%
1.00%
1.10%
1.20%
1.30%
1.40%
1.50%
1.60%
1.70%
1.80%
2014 2015 2016 2017 2018 2019 2020 2021
3-point Foul Rate, 2014/15 - 2021/22
Percent of 3's with Fouls Drawn, 2014/15 - 2021/22 Average
34
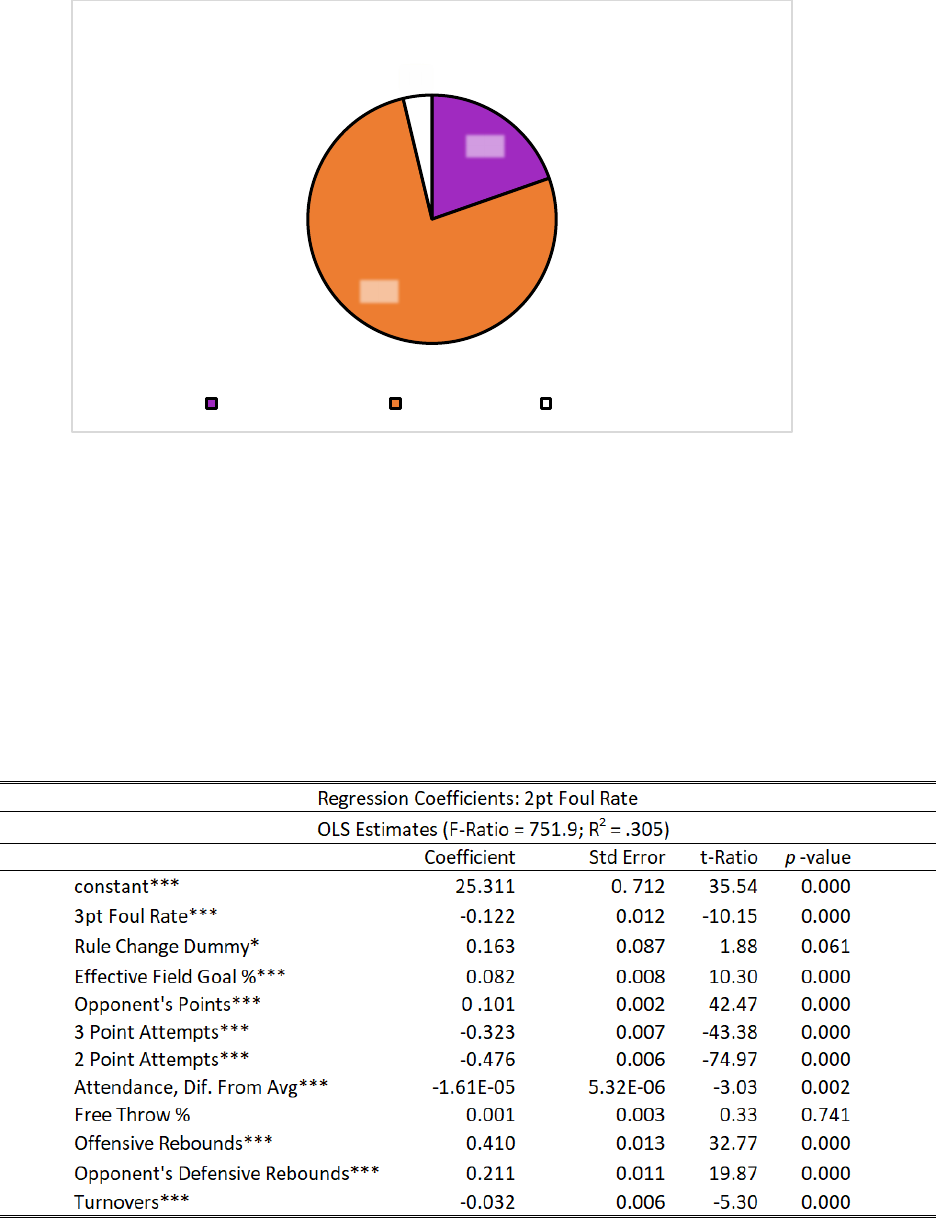
Figure 16: Percent of Fouls per Source from 2014/15 - 2021/22 (PBP Statistics)
As a result, foul numbers increased in 2021/22, despite the rule change’s introduction. It is
possible that the 2-point foul rate was affected to some degree by the rule change. To test this, I
performed a multiple linear regression on 2-point foul rate. The results of that regression are shown in
Table 2:
Table 2, Multiple Linear Regression Results- 2-point Foul Rate
20%
76%
4%
Foul Sources, 2014/15 - 2021/22
Non-Shooting Fouls 2-Pt Shot Fouls 3-Pt Shot Fouls
35
I used the 3-point foul rate as a proxy for the impact of the rule change. I controlled for the
impact of varying fan attendance with a regressor for a game’s difference in attendance from the mean
attendance. I controlled for the impact of the new ball via the Free Throw % and Turnover regressors,
though free throw percentage does not appear to have a statistically significant relationship with 2-point
foul rate.
The model has useful predictive capabilities, as it predicts 30.5% of the variation in the data for
2-point foul rate; it is jointly significant as shown by the high F-statistic. As a result, it allows us to gain a
sense of the impact of the relevant variables. I find a negative, inelastic change in 2-point foul rate as 3-
point foul rate increases. The effect is quite small in practice, as 3-point foul rate varies by less than a
percentage point season to season. The change in 3-point foul rate from the ‘20/21 season to ‘21/22 is
associated with a .043 percentage point increase in 2-point foul rate, ceteris paribus, according to this
model. This effect is not economically significant.
The 2-point foul rate rose in 2021/22, as indicated by the positive coefficient for the rule change
dummy. This is not necessarily attributable to the rule change though, as other confounding differences
in the ‘21/22 season could be responsible. It is possible that more aggressive defense sparked by the
rule change is behind the increase in 2-point foul rate, but there is not enough evidence to attribute any
significant shifts in the 2-point foul rate to the rule change.
Though we see a significant decrease in the number of 3-point fouls after the 2021 Rule Change,
the effect did not extend to the 2-point foul rate. Since a relatively small number of 3-point fouls are
called anyway, the overall number of fouls called remains largely unaffected by the rule change. It
appears that the effects of the rule change on FTA are limited to how many 3-point fouls are called.
2. Analyzing Changes in Worker Productivity
36
I attempt to measure the impact of the rule change on three of Oliver’s Four Factors: turnovers,
free throw attempts (FTA) and shooting, measured by effective field goal percentage (EFG). These serve
as my relevant metrics for NBA players’ worker productivity.
My findings from the effects of the new rules uncover the impact, or lack thereof, of the rule
change on FTA. There is a statistically significant decrease in FTA from 3-point fouls in response to the
rule change. The decrease is not economically significant though, as only 4% of free throw attempts
come from 3-point fouls. The rule change had a nearly inconsequential effect on 2-point foul rate. Since
2-point fouls are the main source of free throws in the NBA, the drop-off in 3-point foul calls does little
to affect FTA. Thus, the rule change’s impact on worker productivity via FTA is minimal.
Oliver himself calls shooting the most important factor of basketball success, making it an
important gauge of worker productivity (Oliver). To measure the impact of the rule change on shooting,
I perform a multiple linear regression with EFG as the dependent variable. It includes variables like 3-
point ratio which are known to improve EFG; variables like attendance to control for possible
confounding effects; and of course, 3-point foul rate to identify the effect of the rule change. The data
used comes from my game-by-game dataset and the results are shown in Table 2:
37
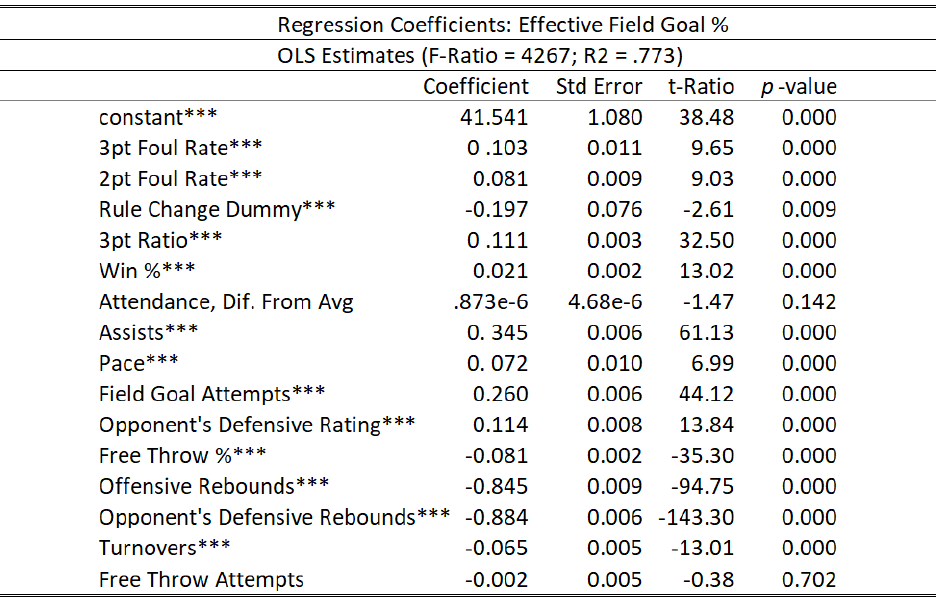
Table 3, Multiple Linear Regression Results- Effective Field Goal %
Like the previous regression, I took special care to avoid stats that would introduce severe
endogeneity issues. In this case, that meant abstaining from regressors like points, field goal
percentage, etc. that are directly tied to shooting efficiency. Again, it impossible to eliminate all
concerns on that front, as basketball stats are all linked in some form or fashion. This model does a good
job minimizing those issues while maximizing performance. I use 3-point foul rate as a proxy for the rule
change’s impact and include a year dummy for the rule change, FT%, and the same attendance data as
before to control for possible confounding factors.
The model is an accurate predictor of EFG, as it explains 77.3% of the variation in the data. It is
also jointly significant as demonstrated by the F-Statistic of 4267. All the coefficient estimates are
significant at the .01 level except for the attendance control and free throw attempts.
38
Out of the variables used to control for confounding factors, free throw % improved the model’s
performance the most. Omitting the foul rate and attendance variables lowers the R Squared value by
less than a percent, while the F-statistic rises significantly. This implies that while there is a statistically
significant relationship between them and EFG, they are not primary drivers of shooting efficiency.
I am still interested in the impact of 3-point foul rate on EFG, as it could potentially reveal the
effects of the rule change on offensive productivity. The coefficient for 3-point foul rate, while small, is
significantly greater than zero at the .01 level, so I infer that there is a positive, inelastic relationship
between it and EFG. A one percentage point increase in 3-point foul rate is associated with a .05
percentage point increase in EFG, ceteris paribus. Since the yearly variation in 3-point foul rate is much
less than a percentage point, that effect would explain very little of the variation in EFG. Therefore, the
relationship between 3-point foul rate and EFG is not economically significant.
The dummy variable for the rule change indicates that teams shot less efficiently in the 2021/22
season. It is statistically significant and is associated with a decrease of .197 percentage points in EFG,
which is notable. While this could be an effect of the rule change, it would make just as much sense if
the shift was related to the new ball or shorter offseason. We cannot control fully for these
confounding variables, so it is unclear whether that decrease is attributable to the rule change. Thus,
we find no evidence suggesting that the rule change affected shooting performance.
To approximate the impact of the rule change on defensive productivity, I performed a
regression with turnovers as the outcome variable. If the rule change improved defensive productivity,
we would expect offensive teams to turn the ball over more in response to increased defensive
pressure. Regressions results with turnovers as the dependent variable are shown in figure 5:
39
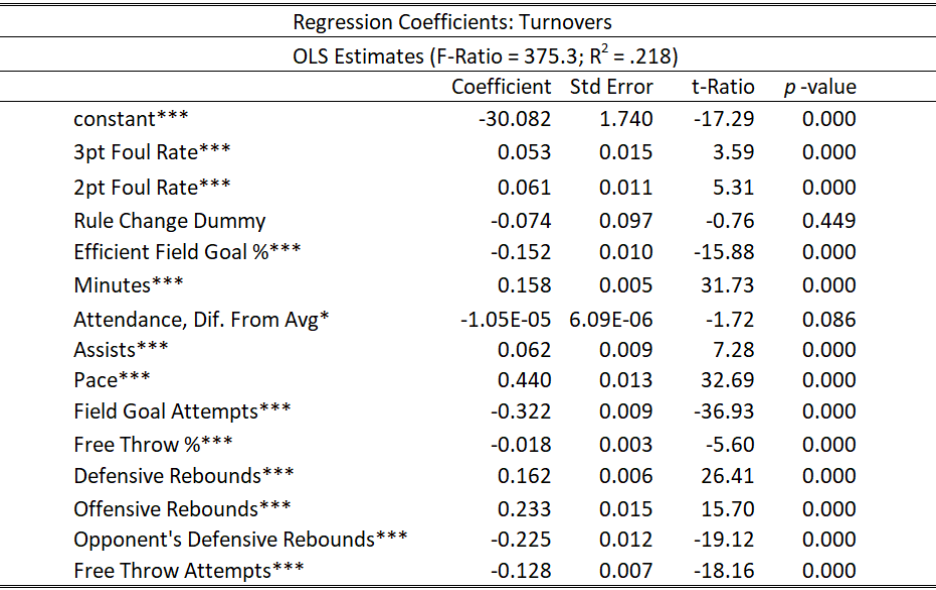
Table 4, Multiple Linear Regression Results- Turnovers
Turnovers are a particularly noisy stat. They are influenced by a variety of factors, many of
which are not included in the model. The model’s limitations are apparent in the R Squared value, as it
predicts just 21.8% of the variation in the data.
There is once again an economically insignificant relationship between 3-point foul rate and the
outcome variable. An increase in 3-point foul rate is associated with a fractional increase in turnovers,
which indicates that the decrease in 3-point foul rate in ‘21/22 would not lead to a meaningful increase
in turnovers. Additionally, the rule change dummy is not statistically significant, so we would not expect
additional shifts from the rule change to affect turnovers. It appears that the new rules have not
improved defensive productivity, at least through turnovers.
40
The regression results provide little evidence of an impact on offensive or defensive productivity
in basketball. None of the factors I analyzed reacted to a change in the 3-point foul rate, which is the
only strong point of evidence of the rule change’s impact. The only tangible effect is the slight reduction
in FTA as players drew fewer 3-point fouls in ’21/22. This is still easily overshadowed by other factors,
so I conclude that the rule change did not have a meaningful effect on worker productivity.
3. Investigating Strategic Changes
Teams went to the foul line less from 3-point fouls in ‘21/22. The reason for the decrease in 3-
point fouls is two-fold. As discussed in Crime on the Court, when surveillance increases, not only does
the percentage of correct calls increase, but the willingness of players to commit crime decreases
(McCormick, 1984). The decrease in willingness to commit crime here is due to the higher opportunity
cost of crime, as players are less likely to score on non-basketball moves while foregoing other scoring
options. Thus, players are incentivized to score through other means.
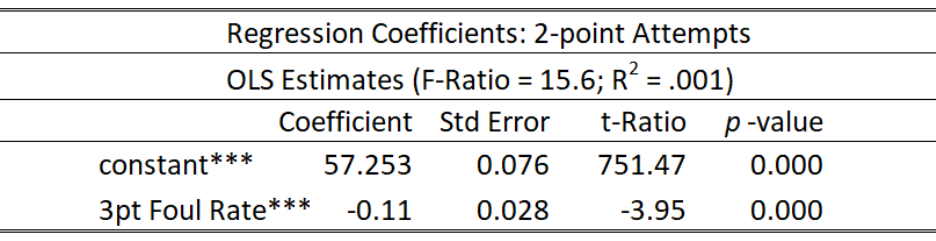
While players had less incentive to commit non-basketball moves, how they substituted away
from those moves is unclear. I attempted to reveal the impact of the rule change on shot selection by
using 3-point foul fate as a proxy variable in Simple Linear Regressions. I found that 3-point foul rate
explains just a thousandth of the variation in the data for 2-point attempts and 3-point attempts. The
results are shown below in tables 2 and 3:
Table 5, Simple Linear Regression Results- 2-point Attempts

41
Table 6, Simple Linear Regression Results- 3-point Attempts
Though we see a statistically significant, negative relationship between 3-point foul rate and
both types of shot attempts, there is not an economically significant relationship. Additionally, the
miniscule R Squared value indicates that 3-point foul rate does a poor job of predicting 2 and 3-point
shot attempts by itself. Therefore, there is no evidence that the rule change has affected shot selection
through its impact on the 3-point foul rate.
The scope of the rule change is probably too narrow to spark specific strategic changes in the
short run. While players drew 25% fewer fouls on 3-point shots in 2021/22 than the prior season, that
only equates to losing a 3-point foul call every few games. Many players might not even notice such a
small difference at first. Besides cutting down on non-basketball moves, players appeared to make very
few adjustments to their offensive strategies in 2021/22.
NBA teams have a history of being slow to adapt to changes. McCormick and Clement’s
Intrafirm Profit Opportunities and Managerial Slack demonstrates that it often takes longer than a
season for coaches to adjust to new information (McCormick, 1992). This makes sense as investing time
in new strategies and risking worse performance can lead to a coach getting fired. The opportunity cost
to making any adjustments is huge for a coach, and they must spend their time wisely. Clippers
assistant coach Dan Craig appears unconcerned with the rule change, and was quoted by Sports
42
Illustrated as saying, “has there been a carryover because of the rule changes and the way I coach?
That’s not something we honed in on” (Nadkarni). This shows that at least some coaches are not yet
adjusting to the rule change, which explains part of why I have not seen strategic changes in response to
the rule change.
It is hard to blame coaches for being slow to react to new information, especially in a season like
2021/22 where the statistical trends of the game varied wildly. The 3-point foul rate stood below 1% at
the beginning of the ‘21/22 season but eventually rose along with Points and EFG. A large part of that
inconsistency has to do with officiating, as there is a learning curve with the rule change for referees as
well as players. I also speculate that the refs backed off calling the new rules as aggressively as they did
in the first couple months of the season.
As a result, it is not entirely surprising that we see such little evidence of strategic adjustments
to the rule change. It is plausible that teams and players will adjust in the coming seasons, but it could
be years before the full effects of the rule change are realized.
Players were forced to set aside their strategy of trying to draw fouls through unnatural motions
after the introduction of the rule change. The assumptions I can make about strategic responses to it
end there, however. The rule change affects only a small subset of possessions, making it difficult to
observe exactly when or if players are adjusting their behavior. Between that, the short time the rule
change has been implemented, and coaches’ reluctance to adjust to changes, there are no discernible
trends stemming from the rule change besides a reduction in 3-point fouls.
After the 2021/22 season, it appears that the NBA successfully limited the ability of players to
draw shooting fouls, at least on 3-pointers. There is no evidence of strategic changes or resulting shifts
in worker productivity. It seems that the NBA’s new rules have addressed foul hunting in a niche area
without affecting other areas of the game. The isolated effect of the rule change is unusual in basketball
43
and stands apart from more connected strategic changes like we observe from the Hot Hand
phenomenon (Dixit). If the NBA’s goal was to reduce 3-point foul hunting and nothing else, it seems
that they were quite successful.
LIMITATIONS AND RECOMMENDATIONS FOR FURTHER STUDY
I am confident in my findings regarding the 2021 Rule Change, but there is much that remains
unclear. Access to more detailed data and a longer time period could reveal trends that I was unable to
uncover in this research. Here, I make recommendations for further study on the subject, and elaborate
on the lacking aspects of this paper.
1. Larger Sample Size
This paper analyzed just one season’s worth of data where the rule change was active. While
this provided over 2,400 observations, it is still a relatively short time span. On top of that, my subject
season demonstrated historically unusual intra-season trends in scoring, free throw attempts, and other
areas. As such, I am interested in seeing the effects of the rule change over additional seasons. Not
only will this provide a larger sample size, but it also allows researchers to differentiate between the rule
change’s short and long-run effects.
2. Access to SportsVU Data
SportsVU’s motion-tracking technology offers the potential to observe players’ behavior at a
physical level. Unfortunately, the general public does not have access to its insights. Someone with
access could reveal the extent to which players were foul-hunting before and after the rule change and
show when the refs made the right calls.
Gauging referee performance would be particularly pertinent to my research, as it would show
how strictly the refs are calling the rules at any given point. my lack of a proxy for referee performance
44
is a major shortcoming in my analysis. This information, along with many other insights offered by
SportsVU, would allow us to develop a more sophisticated model to analyze the rule change’s effects. I
call for interested NBA teams or others with access to SportsVU data to investigate the rule change and
how well the refs called the new rules in the 2021/22 season.
3. Player-level Data
Our research used team-level data on a game-by-game basis to analyze NBA trends. It is
possible to get even more granular by using player-level data. This poses the benefit of controlling for
players’ attributes like height, shooting ability, position, etc. Access to this data is difficult to find,
however.
While season-long averages for players are readily available, single-game data is harder to come
by in a usable format. When considering the number of games in my sample, the work effort involved in
accumulating data from multiple sources adds up quickly. Additional data on individual player attributes
would also be necessary to make the data worthwhile.
Creating a game-by-game cross sectional dataset of player-level performance could reveal
insights beyond the capabilities of this research. The resources to create such a dataset are sadly also
beyond those capabilities. I recommend for future researchers to accumulate player-level data, as it
would add tremendous value to their findings and allow them to answer questions I have not even
thought to ask.
4. Labor Market Analysis
Due to the timing of this research, I have no evidence of the rule change’s impact on the labor
market in basketball. Teams can acquire players in three ways: through trades, the Draft, and via Free
Agency signings. The players that teams target, and their corresponding compensation paint a picture
45
of the traits NBA teams find valuable. If teams think the rule change has impacted productivity, I would
expect winners and losers in the NBA’s labor market. Identifying those winners and losers can help us
back into some of the rule change’s effects.
Gannaway’s Technological Change, Relative Worker Productivity, and Firm-Level Substitution:
Evidence From the NBA lays out the framework for analyzing labor market effects from changes in
scoring technology, at least via the draft (Gannaway). I could follow his methodology to see if the draft
stock of players of certain heights, skillsets, or positions benefitted more from the new rules. This
process would be replicable in terms of salary too. Once enough data in this realm is available, say
several seasons’ worth, I can truly dig into the effects and identify how team behavior changed in
response to the rule change.
CONCLUSION
The 2021/22 season was historic. Aside from featuring new rules and being the first “normal”
season after the Covid-19 pandemic, teams increased their productivity within the season at an
unprecedented rate. Teams scored less than they had in previous seasons, but the last few months of
the season marked record highs in scoring and productivity. My analysis suggests that the 2021 Rule
Change had little to do with this; however, as it seemed to only significantly drive changes in the 3-point
foul rate.
The NBA’s 3-point foul rate dropped significantly in 2021/22, as players drew fouls on 3-point
shots 25% less frequently than the prior season. However, further analysis revealed that stats
associated with worker productivity, turnovers; EFG; and FTA, demonstrated insignificant responses to
changes in 3-point foul rate. I attribute the decrease in 3-point foul rate to the 2021 Rule Change, but it
appeared to have a minimal effect on productivity in 2021/22.
46
Aside from a reduction in successful non-basketball moves, I find no evidence of specific
strategic adjustments to the rule change. It does not appear to be a point of emphasis for coaches, who
are more concerned with improving productivity in proven facets of the game like 3-point shooting.
Perhaps innovative teams and players could find opportunities made possible by the new rules, but
there are no signs of broad strategic adjustments in ‘21/22. The rule change appears to have affected
players foul-hunting capabilities on 3-pointers without negatively affecting other aspects of the game.
In this way, the NBA caused a desired change with minimal offsetting consequences.
Any long-term strategic adjustments to the rule change are largely dependent on how the NBA
officiates the rules going forward. Free throws varied wildly throughout the ‘21/22 season, so more
consistency is required before teams can fully take in the new rules. The extent of teams’ potential
adjustments depends on how strictly the refs enforce the new rules in future seasons.
The NBA’s 2021 Rule Change seems to have limited effects. The reduction in the 3-point foul
rate offers optimism that the NBA’s bid to reduce foul-hunting was successful. The new rules did not
appear to spark broad-scale changes in player behavior or productivity, however. I hope to see a more
consistent picture of the rule change’s impact in the coming seasons, as the first two months of the
‘21/22 season show its long-term impact could reach beyond the findings of this research.
47
BIBLIOGRAPHY
Basketball Reference. “Basketball Statistics and History.” Basketball Reference,
https://www.basketball-reference.com/.
ESPN. “NBA Attendance Report.” ESPN, ESPN Internet Ventures,
http://www.espn.com/nba/attendance.
CDC. “CDC Covid Data Tracker.” Centers for Disease Control and Prevention, Centers for
Disease Control and Prevention, https://covid.cdc.gov/covid-data-
tracker/#trends_dailycases.
Cecchin, Alessandro. “Oliver’s Four-Factor Model: Validation through Causality.”
International Journal of Sports Science & Coaching, vol. 17, no. 4, 2022, pp. 838–847.,
https://doi.org/10.1177/17479541211049287.
Dixit, Avinash, and Barry Nalebuff. “Thinking Strategically: The Competitive Edge in Business,
Politics and Everyday Life.” Long Range Planning, vol. 25, no. 2, 1992, p. 127.,
https://doi.org/10.1016/0024-6301(92)90210-s.
Eden, Scott. “From the Archives: How Former Ref Tim Donaghy Conspired to Fix NBA
Games.” ESPN, ESPN Internet Ventures, 9 July 2020,
https://www.espn.com/nba/story/_/id/25980368/how-former-ref-tim-donaghy-conspired-
fix-nba-games.
Gannaway, Grant, et al. “Technological Change, Relative Worker Productivity, and Firm-Level
Substitution.” Journal of Sports Economics, vol. 15, no. 5, 2014, pp. 478–496.,
https://doi.org/10.1177/1527002514542740.
48
Gough, Christina. “NBA Average Attendance (Regular Season) from 2006/07 to 2021/22.”
Statista, 23 June 2022, https://www.statista.com/statistics/193632/average-regular-season-
home-attendance-per-team-in-the-nba-since-2006/.
Hashtag Basketball. “NBA Player Injury Database.” Hashtag Basketball,
https://hashtagbasketball.com/nba-injury.
Jacobs, Justin. “Introduction to Oliver's Four Factors.” Squared Statistics: Understanding
Basketball Analytics, 6 Sept. 2017, https://squared2020.com/2017/09/05/introduction-to-
olivers-four-
factors/#:~:text=Four%20Factors%3A%20Score%2C%20Protect%2C,a%20possession%2
0for%20a%20team.
Julian, Gentry, and Josh Price. “Keep to the Status Quo: Analyzing Behavioral Responses to the
Change of Ball in the NBA.” International Journal of Sport Finance, vol. 12, no. 2, May
2017, pp. 93–108.
McCormick, Robert E., and Robert D. Tollison. “Crime on the Court.” Journal of Political
Economy, vol. 92, no. 2, 1984, pp. 223–235., https://doi.org/10.1086/261221.
McCormick, Robert, and Robert Clement. “Intrafirm Profit Opportunities and Managerial Slack:
Evidence From Professional Basketball.” Advances in the Economics of Sport, edited by
Gerald W. Scully, JAI Press, Inc., Greenwich, CT, 1992, pp. 3–35.
Miller, Joshua. “Momentum Isn't Magic-Vindicating the Hot Hand with the Mathematics of
Streaks.” Scientific American, Scientific American, 28 Mar. 2018,
https://www.scientificamerican.com/article/momentum-isnt-magic-vindicating-the-hot-
hand-with-the-mathematics-of-streaks/.
Nadkarni, Rohan. “The Defense Strikes Back.” Sports Illustrated, Sports Illustrated, 27 Jan.
2022, https://www.si.com/nba/2022/01/27/nba-defense-foul-rules-joe-ingles-mikal-
bridges-aaron-gordon.
49
NBA. “The Official Site of the NBA for the Latest NBA Scores, Stats & News.” The Official
Site of the NBA for the Latest NBA Scores, Stats & News. | NBA.com,
https://www.nba.com/.
NBA Official. “For the 2021-22 NBA Season, There Will Be an Interpretive Change in the
Officiating of Overt, Abrupt or Abnormal Non-Basketball Moves by Offensive Players
with the Ball in an Effort to Draw Fouls. the Following Points of Education Videos
Showcase Areas Where a Change Was Needed:” Twitter, Twitter, 30 Sept. 2021,
https://twitter.com/NBAOfficial/status/1443591531953332224.
NBAstuffer. “SportVu.” NBAstuffer, 14 June 2020,
https://www.nbastuffer.com/analytics101/sportvu-data/.
NBAstuffer. “Dean Oliver.” NBAstuffer, 20 June 2020,
https://www.nbastuffer.com/analytics101/dean-oliver/.
NBAstuffer. “Points per Shot Attempt (Pts/FGA) Explained.” NBAstuffer, 18 Sept. 2021,
https://www.nbastuffer.com/analytics101/points-per-shot-
attempt/#:~:text=Points%20Per%20Shot%20Attempt%20is.
Oliver, Dean. “Roboscout and the Four Factors of Basketball Success.” Jobs: Roboscout and
the Four Factors of Basketball Success, 6 Apr. 4AD,
https://www.rawbw.com/~deano/articles/20040601_roboscout.htm.
PBP Stats. PBP Stats, Game Logs, https://www.pbpstats.com/.
Price, Joseph, et al. “Subperfect Game: Profitable Biases of NBA Referees.” Journal of
Economics & Management Strategy, vol. 21, no. 1, 2012, pp. 271–300.,
https://doi.org/10.1111/j.1530-9134.2011.00325.x.
Rivas, Christian. “NBA Reacts: Fans Are in Favor of New Shooting Foul Rules.” Sactown
Royalty, Sactown Royalty, 28 Oct. 2021,
50
https://www.sactownroyalty.com/2021/10/28/22750588/nba-fan-survey-new-shooting-
foul-rule-james-harden-deaaron-fox-kings-news.
Sauer, Raymond. “August 03, 2006.” SportsFilter, 16 July 2022,
https://sportsfilter.com/news/7414/refereekonomics.
Slater, Anthony. “Warriors' Steph Curry and Steve Kerr Adjust to NBA Rule Changes: 'The
Game Needs It'.” The Athletic, The Athletic, 4 Oct. 2021,
https://theathletic.com/2867566/2021/10/04/warriors-steph-curry-and-steve-kerr-adjust-to-
nba-rule-changes-the-game-needs-it/.
Sundaresan, Mano. “NBA Stars Are Missing 3-Pointers This Season. Is a New Ball Really to
Blame?” NPR, NPR, 9 Nov. 2021, https://www.npr.org/2021/11/09/1052884749/nba-
stars-are-missing-3-pointers-new-wilson-ball-
blamed#:~:text=After%2038%20years%2C%20the%20NBA,%22It's%20a%20different%2
0basketball.
Zucker, Joseph. “ESPN: NBA Players Saw More Injuries in 2020-21 than Any Season since
2009.” Bleacher Report, Bleacher Report, 9 June 2021,
https://bleacherreport.com/articles/10005239-espn-nba-players-saw-more-injuries-in-2020-
21-than-any-season-since-
2009#:~:text=ESPN%3A%20NBA%20Players%20Saw%20More%20Injuries%20in%202
020-21,to%202009-10%2C%20according%20to%20Kevin%20Pelton%20of%20ESPN.
