
Bikkasani. World Journal of Pharmaceutical Research
www.wjpr.net │ Vol 10, Issue 4, 2021. │ ISO 9001:2015 Certified Journal │
1391
NOVEL UV-SPECTROPHOTOMETRIC METHOD FOR
SIMULTANEOUS ESTIMATION OF ITRACONAZOLE AND
TERBINAFINE USING CHEMOMETRIC TOOLS
Priyanka Bikkasani*, Titus Darsi and Kesaraju Shivaranjini
Pharmaceutical Analysis, Vaagdevi College of Pharmacy (Affiliated to Kakatiya University),
Hanamkonda, Warangal.
1. INTRODUCTION
Pharmaceutical Analysis may be defined as a process or sequence of
process to identify and /quantify a substance or drug, the components
of a pharmaceutical solution or mixture or the determination of the
structures of chemical compounds used in the formulation of
pharmaceutical products.
Drug analysis has an important role in the development of medicine
using various analytical and instrumental methods. The great
advancement of analytical chemistry is the corner stone in the
development of newer drug. The tedious, labour, costly time taking
process of chemical analytical and instrumental analysis has become
more advanced time to time. Chromatography techniques such as: Thin
Layer Chromatography (TLC), High Performance Liquid Chromatography (HPLC), Gas
Chromatography (GC), etc., have played a pronounced role in drug analysis. The
spectroscopic techniques such as Ultraviolet-Visible (UV-Vis) spectroscopy, Fluorescence
spectroscopy, Infrared (IR) spectroscopy, etc., are now solving qualitative and quantitative
problems in chemical analysis. The trend in analytical chemistry has become changed from
time to time and sample to sample. One of the instruments being used with excellent
precision is UV-Vis spectroscopy.
[1]
In using the case where significant overlapping of the spectra of mixtures, utilizing the
instrument traditionally is hardly possible. In order to resolve this problem and get more data
a computer assisted method called chemometric is merged in drug analysis.
[2]
The combined
World Journal of Pharmaceutical Research
SJIF Impact Factor 8.084
Volume 10, Issue 4, 1391-1454. Research Article ISSN 2277– 7105
*Corresponding Author
Priyanka Bikkasani
Pharmaceutical Analysis,
Vaagdevi College of
Pharmacy (Affiliated to
Kakatiya University),
Hanamkonda, Warangal.
Article Received on
12 Feb. 2021,
Revised on 04 March 2021,
Accepted on 24 March 2021
DOI: 10.20959/wjpr20214-20168

Bikkasani. World Journal of Pharmaceutical Research
www.wjpr.net │ Vol 10, Issue 4, 2021. │ ISO 9001:2015 Certified Journal │
1392
uses of spectrophotometry and chemometric techniques become method of choice for the
development of better analytical procedures and quality control of many pharmaceuticals.
[3]
Fig. 1.1: Schematic diagram of analytical process.
Analytical chemistry
According to the American Chemistry Society, Analytical chemistry is a metrological science
that develops, optimizes and applies measurement process intended to derive quality
chemical information from natural or synthetic system in order to solve analytical problems.
Pharmaceutical analysis
Analytical chemistry is used to the pharmaceuticals like formulations products (intermediate
and final) and substances (additives). It also includes the analysis of raw material and
intermediates during the manufacturing process of drugs. Drug analysis has an important role
in the development of drugs using various analytical and instrumental methods. The
pharmaceutical analysis comprises, the procedures necessary to determine the “identity,
strength, quality and purity” of such compounds.
1.1 Types of analytical chemistry
The pharmaceutical analyses are generally of a quantitative as well as qualitative type.
Qualitative analysis
Qualitative inorganic analysis seeks to establish the presence of a given element or
inorganic compound in a sample.
Qualitative organic analysis seeks to establish the presence of a given functional group or
organic compound d in a sample.

Bikkasani. World Journal of Pharmaceutical Research
www.wjpr.net │ Vol 10, Issue 4, 2021. │ ISO 9001:2015 Certified Journal │
1393
Quantitative analysis
Quantitative analysis seeks to establish the amount of a given element or a compound in a
sample.
Both quantitative and qualitative analysis ensures the purity of a product i.e., whether there
are any impurities, degradation products or synthesis intermediates etc. in the sample and, if
so, how many and in what concentrations.
[4]
Many analytical technologies used to generate large amounts of data that are used in
characterizing substances (sample of any kind), and can form the basis of qualitative and
quantitative methods. Chromatographic techniques such as thin layer chromatography (TLC),
High Pressure Liquid Chromatography (HPLC), Gas Chromatography (GC), etc. have played
a pronounced role in drug analysis.
The spectroscopic techniques such as Ultraviolet- Visible (UV-Vis) spectroscopy,
Fluorescence spectroscopy, Infrared (IR) spectroscopy, etc. are now solving qualitative and
quantitative problems in chemical analysis. The trend in analytical chemical analyses has
become changed from time to time.
One of the instruments being used with excellent precision is UV-Vis spectroscopy.
[5]
The
inherent character of spectroscopic data is equal to greatly superimposed signals from various
chemical compounds jointed with a lot of related information. These characterization and
information can be complex to remove by using Univariate procedures. Therefore,
Multivariate data analysis methods have become common tools in applying modern
instruments to solve quantitative and qualitative analysis problems.
1.2 Spectroscopy
[6,7, 8]
Spectroscopy is branch that uses the interaction of energy with a sample to perform the
analysis that can provide information on the chemical composition and conformation of the
samples. It lies on the boundary between physical and chemical chemistry, its adaptation and
applications to chemical analysis is the responsibility of analytical chemistry which in turns
feeds on spectroscopic developments.
Spectroscopy is based on the dispersion of light into its component wavelengths (i.e.,
energies). The data that is obtained from spectroscopy is called spectrum. A spectrum is a

Bikkasani. World Journal of Pharmaceutical Research
www.wjpr.net │ Vol 10, Issue 4, 2021. │ ISO 9001:2015 Certified Journal │
1394
plot of the intensity of energy detected versus the wavelength (or frequency, etc.) of the
energy and provides the information on the structure of the sample under analysis.
The spectrum is comprised of data across many wavelengths (frequencies, variables), and is
best analyzed using multivariate analysis tools which provide a means to maximize the
information from the spectral data.
Spectroscopy is a quick and non-destructive analytical technique commonly used to measure
certain parameters if interest in terms of the absorbance spectrum. In the pharmaceutical
industry, it is used in control processes to determine some variables as, for example, the
amount of active ingredient of a drug.
Spectroscopy is a premier method of performing both qualitative and quantitative analysis,
but runs into difficulties when the sample is a complex mixture of ingredients. Ingredients
typically have different spectra and when sampled individually, each is simple to recognize.
When an unknown number of them are mixed together in unknown amounts, it can be
difficult to determine what and how much of each ingredient is present.
1.3 UV-Visible spectrophotometry
[8, 9]
UV-VIS spectroscopy is the study of how a sample responds to the light. When a beam of
light passes through the sample substance or solution, some of the light may absorbed and the
remainder transmitted through the sample. The ratio of the light entering the sample (I
0
) to
that transmitting the sample (I
t
) at a particular wavelength is defined as the transmittance (T).
This is often expressed as the percentage transmittance (%T), which is the transmittance
multiplied by 100:
%T = ( I
0
/I
t
) × 100
The absorbance (A) of a sample is the negative logarithm of the transmittance:
A = -log T
The UV-VIS range of the electromagnetic spectrum covers the range 190-700nm (most of the
instruments are capable of measuring at a longer wavelengths than this, depending on their
detector type).
Electronic transitions
[10]
The absorption of UV or Visible radiations corresponds to the three types of electronic
transitions:
Bikkasani. World Journal of Pharmaceutical Research
www.wjpr.net │ Vol 10, Issue 4, 2021. │ ISO 9001:2015 Certified Journal │
1395
1. Transition involving π, σ, and n electrons
2. Transitions involving charge-transfer electrons
3. Transitions involving d and f electrons
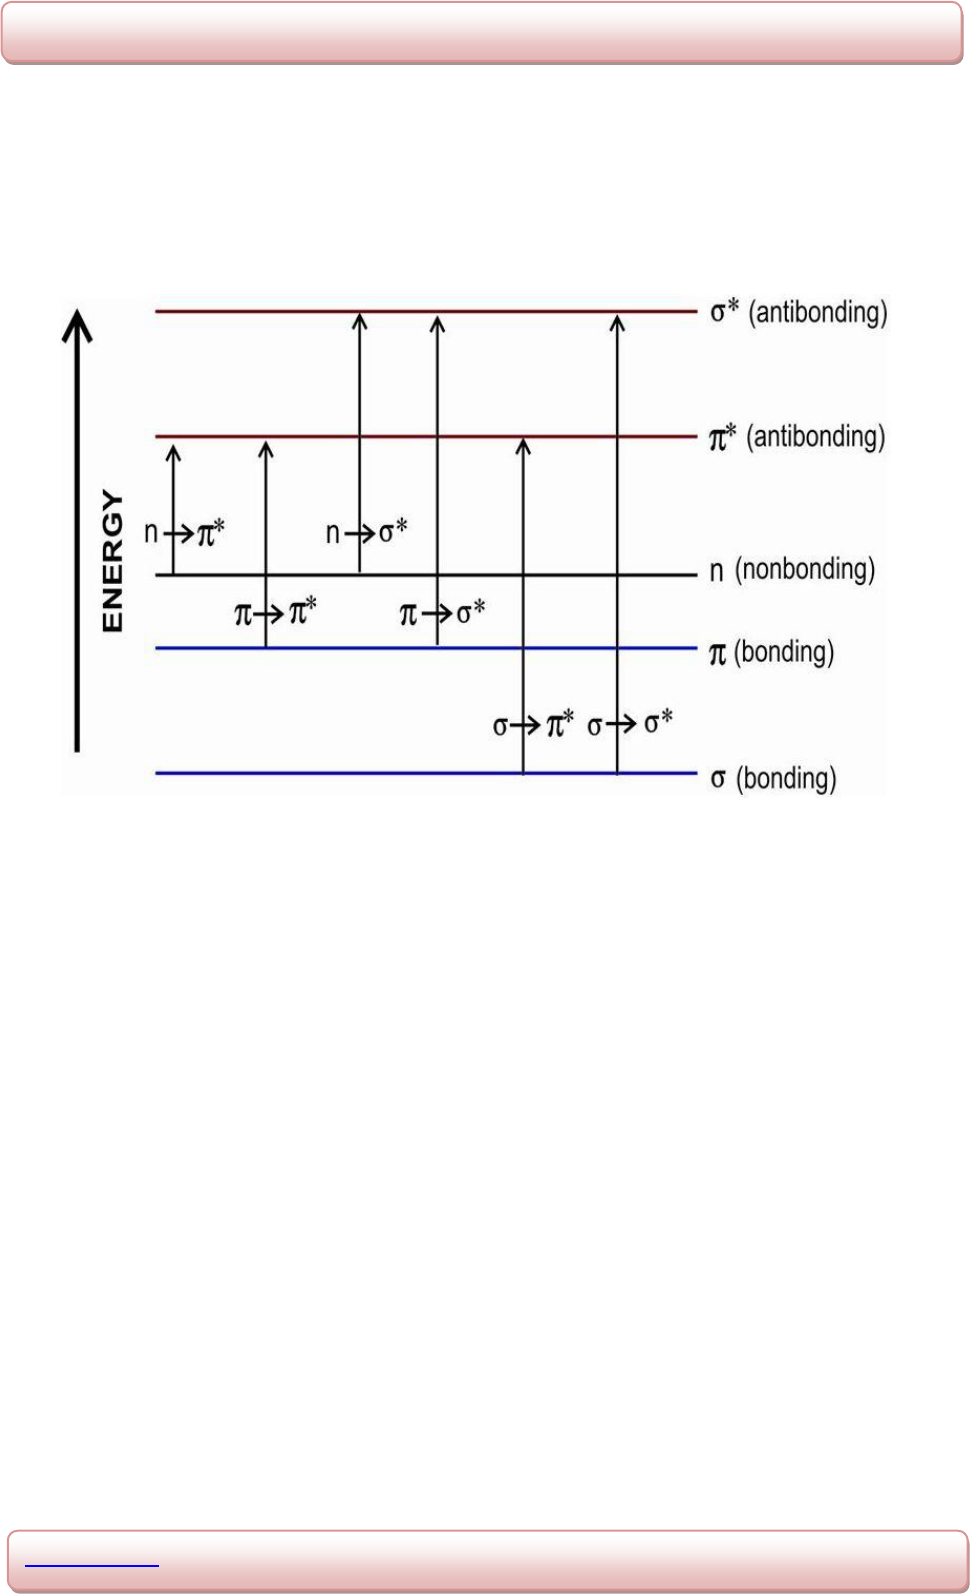
Possible electron transitions of π, σ, and n electrons are shown in the fig 1.2.:
Fig. 1.2: Electronic transitions.
σ → σ
*
Transitions
These transitions can occur in such compounds in which all the electrons are involved in
sigma bonds and there is no lone pair of electrons. The energy required for an electron in a
bonding σ orbital to get excited to the corresponding anti bonding orbital is large. For
example: in alkenes and saturated hydrocarbons. Methane contains only single C-H bonds
and thus undergoes σ → σ
*
transitions and exhibits absorption maximum at 125nm. Such
transitions are studied in vacuum ultraviolet region since below 200nm oxygen present in air
begins to absorb.
n → σ
*
Transitions
Saturated compounds containing atoms with unshared electron pair (non-bonding electrons)
like saturated alcohols, amines, halides, ethers etc are capable of showing N → σ
*
transitions.
Energy required for these transitions is usually less than σ → σ
*
transitions. Such compounds
absorb light having wavelength in the range 150-250nm, Eg: absorption maximum for water,
methyl chloride and methyl iodide are 167nm, 173nm and 259nm respectively.

Bikkasani. World Journal of Pharmaceutical Research
www.wjpr.net │ Vol 10, Issue 4, 2021. │ ISO 9001:2015 Certified Journal │
1396
π →π
*
Transitions
These transitions need an unsaturated group in the molecule to provide the π electrons. E.g.:
in alkenes, alkynes, aromatics, acyl compounds or nitriles. Most absorption spectroscopy of
organic compounds is based on transitions of n or π electrons to the π
*
excited state and the
absorption peaks for these transitions fall in an experimentally convenient region of the
spectrum (200-780nm). π →π
*
transitions normally give molar absorpitivites between 1000
and 10,000 Lmol
-1
cm
10
. Unconjugated alkenes absorb 170-190nm.
n → π
*
Transitions
Bands attributed to n → π
*
transitions are also known as R-bands. In these transitions
electrons of unshared electron pair on a hetro atom such as oxygen, nitrogen and sulphur is
excited to π
*
anti-bonding orbital. This transition involves least amount of energy than all the
transitions and hence this transition gives rise to an absorption band at longer wavelengths.
These transitions exhibit a weak band in the absorption spectrum. E.g.: saturated aldehydes
and ketones exhibit absorption of low intensity around 285nm.
π → π
*
Transitions
Transitions of diene or polyene systems are essentially unresponsive to solvent polarity,
because hydrocarbon double bonds are non-polar.
1.4 Theory
[11,12]
Beer’s law
Beer observed that logarithmic relationship holds between transmittance and the
concentration of the solution, i.e., “the intensity of beam of monochromatic light decreases
exponentially with the increase in the concentration of the absorbing substance
arithmetically”.
Lambert’s law
“When a beam of light is allowed to pass through a transparent medium, the rate of decrease
of intensity with the thickness of medium is directly proportional to the intensity of light”.
Beer-Lambert’s law
When a beam of light is passed through a transparent cell containing a solution of absorbing
substance, reduction of the intensity of light may occur. Mathematically, Beer-Lambert’s law
is expressed as

Bikkasani. World Journal of Pharmaceutical Research
www.wjpr.net │ Vol 10, Issue 4, 2021. │ ISO 9001:2015 Certified Journal │
1397
A α c and A α b
So, A α b × c
A = a b c
Where, A = absorbance or optical density
a = absorptivity or extension coefficient
b = path length of radiation through sample (cm)
c = concentration of solute in solution
Both b and c are constant so a is directly proportional to the concentration c
When c is in gm/100ml, then the constant is called A1
%1cm
A = a b c
Deviations from Beer-Lambert’s law
According to Beer-Lambert’s law, a straight line passing through the origin should be
obtained if we plot absorbance (A) against concentration. But usually there is no deviation
from a linear relationship between concentration and absorbance and an apparent failure of
Beer-Lambert’s law may occur.
Deviation from the law is reported as positive if the curve deviates upwards or negative if it
deviates downwards.
Deviations from Beer-Lambert’s law can arise due to the following factors:
I. If concentration of colored ion changes when dissolved in solvent.
II. If colored solute ionizes or associates or disassociates in solution.
III. Due to the presence of impurities that fluoresce or absorb at absorption wavelength of
sample.
IV. If monochromatic light is used.
V. If undesirable light (stray light) fall on the detector due to improper slit width.
VI. If the solution species undergo polymerization.
VII. This law cannot be applied to suspensions.
1.5 Instrumentation and Working of VU-Visible spectrophotometer
[13]
A spectrophotometer is an instrument for measuring the transmittance or absorbance of a
sample as a function of the wavelength of electromagnetic radiation. The key components of
spectrophotometer are:

Bikkasani. World Journal of Pharmaceutical Research
www.wjpr.net │ Vol 10, Issue 4, 2021. │ ISO 9001:2015 Certified Journal │
1398
Radiation source/light source
A continuous source of radiation energy covering the region of spectrum in which the
instrument is designed to work. Some of the sources are Tungsten lamp, Xenon arc lamps, D
2
lamps etc.
Tungsten filament lamp and Hydrogen-D
2
lamps are most widely used and suitable light
source as they cover the whole UV region. Tungsten filament lamps are rich in red radiations,
more specifically they emit the radiations of 375nm, while the intensity of Hydrogen-D
2
lamps fall below 375nm.
Monochromators
Monochromators are generally composed of prism and slits. The most of the
spectrophotometers are double beam spectrophotometers. The radiation emitted from the
primary source is dispersed with the help of the rotating prisms. The various wavelengths of
the light source which are separated by the prism are then selected by the slits such the
rotation of the prism results in a series of continuously increasing wavelengths to pass
through the slits for recording purpose. The beam selected by the slit is a monochromatic and
further divided into two beams with the help of another prism.
Sample and Reference cells
One of the two divided beams is passed through the sample solution and the second beam is
passed through the reference solution. Both the sample and the reference solutions are
contained in the cells. These cells are made up of either Silica or Quartz. Glass can’t be used
for the cells as it also absorbs light in the UV region.
Detector
Generally two photocells serve the purpose of detector in the UV Spectroscopy. One of the
photocells receives the beam from the sample cells and the second detector receives the beam
from the reference. The intensity of the radiation from the reference cell is stronger than the
beam of sample cell. This result in the generation of pulsating (or) alternating current in the
photo cells.
Amplifier
The alternating current generated in the photocells is transferred to the amplifier. The
amplifier is coupled to a small servo meter. Generally current generated in the photocells is of

Bikkasani. World Journal of Pharmaceutical Research
www.wjpr.net │ Vol 10, Issue 4, 2021. │ ISO 9001:2015 Certified Journal │
1399
very low intensity, the main purpose of the amplifier is to amplify the signals many times so
we can get clear and recordable signals.
Recording devices
Most of the time amplifier is coupled to a pen recorded which is connected to the computer.
Computer stores all the data generated and produces the spectrum of the desired compound.
Solvent system
The solvent system must obviously be chosen for its spectroscopic properties, it must
miscible with compound to be analyzed and quantitative and qualitative determination of
mixture as fast and as efficiently as possible. As a general rule, range of solve any particular
problems, so selection must be based on different criteria.
1. Viscosity.
2. Solubility.
3. UV transparency.
4. Refractive index.
5. Boiling point.
6. Purity.
7. Inert with respect to sample compounds.
8. Corrosion resistance.
9. Toxicity.
10. Price.
A large number of solvents in order of their polarity are available .Many of them are not
suitable as solvents for different reasons. The table below makes clear why a certain
compound is not a good choice; e.g. because UV absorption or the viscosity is too high.
Some solvents are used as additives in low concentration foe certain applications: with a
small amount of an amine the solvent become basic; with an acidic compound.
Table 1.1: Minimum wavelengths at which different solvents.
Solvent
Cut off Wavelength(nm)
Water
191
Ethanol
203
Methanol
204
Ether
215
Chloroform
237
Carbon tetra chloride
257

Bikkasani. World Journal of Pharmaceutical Research
www.wjpr.net │ Vol 10, Issue 4, 2021. │ ISO 9001:2015 Certified Journal │
1400
Solvent selection
Selection of the solvents is based on the miscibility of solvent with the compounds. The
excited states of most * transition are more polar than their ground states because a
greater charge separation is observed if the excited state reduces the degree of hydrogen
bonding.
The transitions are n and the shift of the wave length is due to the lesser extent than the
solvent can hydrogen bond to the excited state. Carbonyl groups in particular hydrogen bond
to their solvent.
For example changing from hexane to water as the solvent for propane, the absorption
maximum moves from 280 to 257nm.
Care must be taken when choosing a solvent, because many solvent absorb in the UV region.
1.6 Applications of UV Visible spectrophotometry
In research, UV-Visible spectroscopy is used more extensively in assaying than
identification. The trace metal content of an alloy, such as manganese in steel, can be
determined firstly by reacting the sample to get the metal ion into the solution as an ion. The
ion is then complexed to react so as that it is in the form that can be measured.
E.g.: Manganese as the magnate (VII) ion.
When the spectrum is recovered, the most useful piece of information is the absorbance
because if the absorption coefficient of the chromophore is known the concentration of the
solution can be calculated, and hence the mass of the metal in the sample. The same principle
can be applied to drug metabolites. Samples are taken from various sites around the body and
their solutions are analyzed to determine the amount of drug reaching those parts of the body.
A useful feature of this type of analysis is the ability to calculate very small concentrations
with extreme accuracy. It is important that the absorbance of the solution remains below two
for quantitative measurements because of the limitations of the instrument and solute-solute
interactions that can cause deviations from Beer-Lambert law. The absorption of UV light is
a feature of optical whiteners put into washing powders. The whitener absorbs radiation in
the near UV and re-emits it in the visible range.

Bikkasani. World Journal of Pharmaceutical Research
www.wjpr.net │ Vol 10, Issue 4, 2021. │ ISO 9001:2015 Certified Journal │
1401
UV/VIS spectroscopy is routinely used for quantitative determination of analytes solution in
transition metal ions highly conjugated organic compounds.
Solutions of transition metal ions can be colored (i.e., absorb visible light) because the
electrons within the metal atoms can be excited from one electronic state to another.
While charge transfer complexes also give rise to colors are often too intense to be used
for quantitative measurements.
The absorbance of the solution id directly proportional to the concentration of the
absorbing species in the solution and the path length, UV/VIS spectroscopy can be used
to determine the concentration of the absorber in the solution.
The main applications are
Detection of functional groups.
Detection of extent conjugation.
Identification of unknown compound.
Determination of configurations of geometrical isomers.
Determination of purity of a substance.
Determination of dissociation constant for acids and bases.
To study the chemical kinetics of drugs.
To study the tautomeric equilibrium.
1.7 UV Spectroscopy method Development and Validation
[14,15]
Best solvent, best detection and wavelength selection, efforts in their selection can make a
world of difference while developing method for routine analysis. Determining the ideal
combination of these factors assures faster delivery of desired results- a validation method for
quantitative determination.
To have an efficient method development process, the following two questions must be
answered
1. What are the critical components for a spectroscopic method?
The three critical components for a spectroscopic method are: sample preparation, spectral
analysis and standardization (calculations). During the preliminary method development
stage, all individual components should be investigated before the final method optimization.
This gives the scientist a chance to critically evaluate the method performance in each
component and streamline the final optimization.

Bikkasani. World Journal of Pharmaceutical Research
www.wjpr.net │ Vol 10, Issue 4, 2021. │ ISO 9001:2015 Certified Journal │
1402
2. How should a method development experiment be designed?
A properly designed method development should consider the following important questions;
What sample should be selected at each stage?
What should the researcher look for in this experiment?
What are the acceptance criteria?
According to the ICH Guidelines method validation can be defined as “Establishing
documented evidence, which provides high degree of assurance that a specific activity will
consistently produce a desired results or product meeting is predetermined specifications and
quality characteristics”.
Validation parameters
[14,15]
I. Accuracy
The accuracy of an analytical method is defined as the degree to which the determined value
of analyte in a sample corresponds to the true value. Accuracy may be measured in different
ways and the method should be appropriate to the matrix. The accuracy of the analytical
method may be determined by:
a) Analyzing of the sample of known concentration and comparing the measured value to
the true value. However, a well characterized sample (e.g., reference standard) must be
used.
b) Spiked-placebo (product matrix) recovery method : In the spiked-placebo recovery
method, a known amount of pure active constituent is added to formulation blank [sample
that contains all other ingredients except the active(s)], the resulting is assayed, and the
resulting obtained are compared with the expected results.
c) Standard addition method: In the standard addition method, a sample is assayed, a known
pure active constituent is added, and the sample is again assayed. The difference between
the results of two assays is compared with the expected results.
II. Precision
The precision of an analytical procedure expresses the agreement between a series of
measurements obtained from multiple sampling of the same homogeneous sample under the
prescribed conditions.

Bikkasani. World Journal of Pharmaceutical Research
www.wjpr.net │ Vol 10, Issue 4, 2021. │ ISO 9001:2015 Certified Journal │
1403
Precision may be considered at three levels
a) Repeatability
Repeatability expresses the precision under the same operating conditions over a short
interval of time. Repeatability is also termed as intra-assay precision or intra-day precision.
b) Intermediate precision
Intermediate precision expresses within- laboratories variations; different days, different
analysts, different equipments, etc.
Reproducibility
Reproducibility expresses the precision between the laboratories. For these guidelines, a
simple assessment of repeatability will be acceptable. The precision of an analytical
procedure is usually expressed as the variance, standard deviation or coefficient of variation
of a series of measurement. A minimum 5 replicate sample determinations should be made
together with a simple statistical assessment of the results, including the percent relative
standard deviation.
III. Limit of detection (LOD)
The detection limit of an analytical procedure is the lowest of an analyte in the sample that
can be detected, but not necessarily quantified as an exact value. The lowest calibration
standard which produces response corresponding to the analyte should be measured.
LOD can be calculated by the formula;
LOD = 3.3 x σ/S
IV. Limit of Quantification (LOQ):
The limit of quantification is the lowest amount of analyte in the sample that can be
quantitatively determined with defined precision under the stated experimental conditions.
LOQ can be calculated by the formula;
LOQ = 10 x σ/S
V. Linearity
The linearity is the ability of an analytical procedure to the concentration (amount) of analyte
in sample within a given concentration ranges, either directly or by means of a well defined
mathematical transformation. Linearity should be determined by using a minimum of six
standards whose concentration spam 80-120%of the expected concentration range. The result

Bikkasani. World Journal of Pharmaceutical Research
www.wjpr.net │ Vol 10, Issue 4, 2021. │ ISO 9001:2015 Certified Journal │
1404
should not show a significant deviation from linearity, which is taken to the mean that the
correlation coefficient, r
2
> 0.99, over the working range (80-120%).
VI. Range
The specified range is normally derived from the linearity studies. The range of analytical
procedures is the interval between the upper and lower concentration (amounts) of analyte in
the sample for which it has been demonstrated that the analytical method has suitable levels
of precision, accuracy, and linearity.
VII. Ruggedness
Ruggedness is the degree of reproducibility of the test results obtained by the analysis of the
same samples under different instruments, different lots of reagents, different elapsed assay
times, different assay temperatures, different days, etc.
VIII. Robustness
It is the capability of analytical method to remain unaffected by small deliberate variations in
the method parameter and provides an indication of its reliability during normal range.
Robustness testing is normally restricted to methods that are to be used repetitively in the
same laboratory.
1.8 Chemometry
[16, 17, 18]
Introduction
Chemometrics is a branch of science that is used for the extraction of the data related to
chemical and physical phenomena involved in the analytical process by the application of
statistical and mathematical methods that possesses and use mathematical tool to increase the
amount and the quality of the information that can be derived from the primary data provided
by the analytical instruments. Chemometric is an interdisciplinary field that combines
statistics, mathematical methods (high information models, ad hoc models, and analogy
models), computer science and analytical chemistry to solve multivariate problems of data
analysis Encyclopedia of analytical chemistry and others also agree to this definition.
This task demands knowledge of statistics, numerical analysis, operation analysis, etc. and in
all, applied mathematics. The Chemometry is a field which is related with various disciplines.
It is used as a guide to the chemist in extraction of maximum chemical information from
complex observation.

Bikkasani. World Journal of Pharmaceutical Research
www.wjpr.net │ Vol 10, Issue 4, 2021. │ ISO 9001:2015 Certified Journal │
1405
Fig. 1.3: Chemometrics-spectrophotometrics.
The name chemo metric can be divided into chemo (from chemistry) and metric (meaning
measurement). Chemometric thus deals with chemical data and how to obtain information
from it.
According to the international chemometrics society, “chemometrics is a science relating
measurements made on a chemical system or process to the state of the system via
application of mathematical or statistical methods”.
The art of extracting chemically relevant information from data produced in chemical
experiments is given the name of “chemometrics” in analogy with biometrics, econometrics,
etc.
Understanding of chemistry and statistics both are necessary in chemometrics because of the
combination of both in their analytical purposes. The role of chemometry in the process of
analytical techniques is quit broad which provides complete information and knowledge
about chemicals.
In analytical chemometrics, the statistics applied to analytical and chemical data is a part of
the multidisciplinary entity which aims to expand and enhance the information by using less
material, time and human sources with aid of computers.

Bikkasani. World Journal of Pharmaceutical Research
www.wjpr.net │ Vol 10, Issue 4, 2021. │ ISO 9001:2015 Certified Journal │
1406
However, as in all applied branches of science, the difficult and interesting problems are
defined by the applications; in chemometrics the main issue is to structure the chemical
problem to a form that can be expressed as a mathematical relation.
Chemometrics is an approach to analytical and measurement science based on the idea of
indirect observations. Measurement related to the chemical composition of a substance is
taken and the value of property of interest is inferred from them through some mathematical
relations. So, after processing of the product, measurements followed by the collection of
data chemometrics are used to gather information and to gain the real knowledge about the
product information and to gain the real knowledge about the product.
Fig. 1.4: Chemometric strategies.
Typical chemometrics strategy comprises
[19-24]
The sucessful purpose of chemometrics involves systematically design of experiments,
proper application of preprocessing (pre-treatment), calibration, diagnostics and rigorous
prediction validation. Chemometrics shows its application in the multivariate data colleection
and analysis. Various algorithms and analogous ways are avilable for processsing and
evaluating the data.they can be implemented to varaious fields, like medicine, pharmacy,
agricultural chemistry, forensic descrimination, foood control, and environmental sciences.
1.9 Experimental design
[25]
The objectives of experimental design is to plan and conduct experimentts in order to extract
the maximum amount of information from the collected data in the smallest number of
experimental runs and the selection of the points where the response should be evaluated.

Bikkasani. World Journal of Pharmaceutical Research
www.wjpr.net │ Vol 10, Issue 4, 2021. │ ISO 9001:2015 Certified Journal │
1407
The basic ida is to change all relevant factors simultaneously over a set of planned
experiments and then connect and interpret the results using the mathametical models.
Weather the objective is screening of process factors or optimization of a chemical reaction,
the variables that influence the responses are center of attention.
There are several key reasons why the chemist can be more productive if He/She understands
the bases of designincluding the following four main areas:
i. Screening
This types of experiment involve seeing which factors are important for the success of a
process. An example may be the study of a chemical reaction, dependant on prportion of
solvent, catalyst cooncentration, temperature, PH, stirring rate, etc. typically 10 or more
factors might be relavent. This can be eliminated.
ii. Optimization
Systamatic methods can result in a better optimum, found more rapidly. Simplex is a clasical
method for optimization although several designs such as a mixture designs and central
composit desiigns can also be employed to find optima.
iii. Saving time
Fromstructural data, of existing molecule, it is possible to predict a small number of
compounds for further testing, represantative for a large set of molecules.
This allows enormous saving in time. Fractional factorial designs are good examples,
although almost all experimental designs have this aspects in mind.
iv. Quantitative modeling
Almost all experiments, ranging from simple linear calibration in analytical chemistry to
complex physical processes, where a series of observations are requiredto obtain a
mathematical model of the system, benefit from good experimental design. Many such
designs are based around the central composite design, although calibration designs are also
useful.
Principles of experimental design
[26-27]
ED first principle: Random assignment
In planning an experiment, any assigning that would otherwise be haphazard (without an
obvious plan) should be done using a chance device, random premutation.
Example: choose mice from cages to assign them to hyper or hypo caloric diets.
But methods that attempt at making the allocation as “fair”as possible.

Bikkasani. World Journal of Pharmaceutical Research
www.wjpr.net │ Vol 10, Issue 4, 2021. │ ISO 9001:2015 Certified Journal │
1408
ED Second principle: Blocking
First sudivide the experimental material into groups (blocks of similar units; then assign
condition units seperately within each block. Each bllock should include (roughly) equal
numbers for each treatmrnt. Units are similar if they are likely to give similar values of
measurement.
Because response from different units varies even if the units are treated identically, must
apply each treatment to several different units.
Blocking converts unplanned, systematic variability into planned, systematic variability.
REPLICATION: Replication needed to estimate the scale of random effect /
measurement errors.
ED third principle: Factorial crossing
Compare two or more sets of conditions in the same experiment.
Designs with factorial treatement structue allows you to measure interaction between two
or more sets of conditions influence the response.
Factorial designes may be either obsrevational or experimental.
Different types of2- factor factorial designs
1. 2 experimental factors – randamoized treatements to each unit.
2. 2 obsrevational factors – cros -classification of populations into groups and get a sample
from each population.
3. 1 experiment and 1 observational factor – you get a sample of units from each population,
then use randamization to assign levels of the experimental factor (treatments), seperately
within each sample.
The designs of experiments as follows
[26]
A. Full Factorial and Fractional Factorial Design
B. Completely Randamoized Design (CRD)
C. Randomized Complete Block Design (RCBD)
D. Latin Square Design LSD)
E. Confounding
A. Full Factorial and Fractional factorial design
In a full factorial experimental design all the combinations of extreme values are included
as experiments. If there are k variables, the number of experiment is 2
k
. For statistical

Bikkasani. World Journal of Pharmaceutical Research
www.wjpr.net │ Vol 10, Issue 4, 2021. │ ISO 9001:2015 Certified Journal │
1409
validation, one experiiment, usually the center point is repeated atleast three times. The
experiments are performed in random in- order to eliminate systemic errors.
The number of experiments In an experimental design grows rapidly with increasing
number of variables. When dealing with many number of variables for the purpose of
screening, a full factorial design is not realistic option. A reduced design, called fractional
factorial design is then more appropriate choice.
For a factorial design, experiments are chosen to give the maximum amount of variation
with fewer experimental runs. The drawback is lost information caused by confounding
of main effects with interaction effects if resolution is lower than four.
B. Completely randamoized design (CRD)
A completely randomised design is one where the treatements are assigned completely at
random so that each treatement unit has the same chance of receiving any one treatement.
However, in CRD, any difference among experimental units receiving the same
treatement is considered as experimental errors. Thus, randamization givese every
experimental unit in the experimental material an equal probability of receiving the
treatement.
Advantages of CRD
One of the chief advantage of CRD is that the number of replications may be varied from
treatment to treatment. Because of the flexibility, all the experimental material can be
used without any wastage.
It allows for complete flexibility. Any number of treatments can be usedand different
treatements can be used unequal number of times without unduly complicating the
statistical analysis in most of the cases.
Disadvantages
The chief disadvantages of the design is that it is usually suited only for small number of
treatements and for homogeneous experimental material.
C. Randomized Complete Block Design (RCBD)
The radomized complete block design is one of the most widely used experimental
designs in agricultural research.

Bikkasani. World Journal of Pharmaceutical Research
www.wjpr.net │ Vol 10, Issue 4, 2021. │ ISO 9001:2015 Certified Journal │
1410
It is particularly so in agricultural and other field experiments. In such situations, the
principle of local control is adopted and the experimental material is grouped into
homogenous sub-groups. The sub-group is commonly termed as block.
Since each block will consist the entire set of treatements, a block equivalent to a
replication.
Hence, the term block and replication are used synonymously in case of complete block
design.
Advantages
This design is more important and efficient because the amount of information got in
RBD is more than as compared to CRD.
If large number of homogenous units are available, large number of treatements can be
included in this design.
Disadvantages
RBD is not suitable for large number of treatements or for cases in which complete block
contains considerable variability. It is because when the number of treatements is increased,
the block size will increase. If the block size is large it may be difficult to maintain
homogeneity within blocks. Consequently, the experimental error will be increased.
D. Latin square design (LSD)
In latin square design there have to be as many replications as there are treatements. The
experimental area is divided into plots, arranged in a square, in such manner that there are
as many plots in each row, as there are ini each column, this number being also equal to
the number of treatements.
The plots are then assigned to various treatements, such that every treatement occurs once
in each row, and once in each column.
The two directional blocking in a latin square design, commonly reffered to as row-
blocking and column-blocking is accomplished by ensuring that every treatement occurs
only once in row-block and once in each column-block.
Advantages
With a two way-stratification or grouping, the LSD, controls more of the variation than
the completely randamoized design, and the randamization complete block design.
Disadvantages

Bikkasani. World Journal of Pharmaceutical Research
www.wjpr.net │ Vol 10, Issue 4, 2021. │ ISO 9001:2015 Certified Journal │
1411
LSD is suitable for the number of treatements between 5 and 10 and, more than 10 to
12 treatements the design is used since in that case the square becomes two large and does
not remain homogenous.
With the increase in size of square, the experimental error is likely to increase.
E. Confounding
Confounding in experimental designs is then a term of denote an arrangement of the
treatement combinations in the blocks in which less important treatement effects and
purposively confounded with the blocks.
When only the portions of portions of treatement combinations are allocated to blocks
within a replication, the comparision between blocks in a replication represents some
treatement comparision, either a main effect or an interaction.
In such cases, it is not possible to distinguish treatement comparisions from block
comparisions-such a mix up is termed as confounding.
The principle of confounding depends on number of factors and the number of levels of
each factor undre trial.
Three – level full factorial designs (or) surface response methodology
[27]
The three-level designn is written as 3
k
factorial design. It means that K factors are
considered, each at 3 levels.these are reffered to as low, intermediate and high levels.
These levels are numerically expressed as 0, 1, and 2. One could have considered the
digits -1, 0 and +1, but this may be confusing with respect to the 2-level designs since 0 is
reserved for center points. Therefore, we will use the 0, 1, 2 scheme.
The reason that he three level design was preposed is to model possible curvature in the
reponse function and to handle the case of nominal factors at 3 levels. A third level for a
continious factor facilitates investigation of a quadratic relationship between the response
and each of the factors.
Unfortunately, the three-level design is prohibitive in terms the number of runs, and thus
in terms o fcost and effort.
In the same way the response surface methodology (RSM) is a combination of
mathemetical and statistical technique for emperical model building. By careful design of
experiments, the objective is to optimize a response (output variable) which is influenced
by several independent variables (input variables). An experiment is an series of tests

Bikkasani. World Journal of Pharmaceutical Research
www.wjpr.net │ Vol 10, Issue 4, 2021. │ ISO 9001:2015 Certified Journal │
1412
(runs), in which changes are made in the input variables in order to identify the reasons
changes in the output response.
The basic strategy has four steps
1. Procedures to move into optimum region.
2. Behavior of therespose in hre optimum region.
3. Estimation of the optimum conditions.
4. Verification.
Analysis of variance (ANOVA)
[28-33]
The purpose and the reason for doing an ANOVA is to see there is any difference between
groups on some variable.
For example we have data on student performance in non-assessed tutorial exercises as well
as their final grading. You are intrested in seeing if tutorial performance is related to final
grade. ANOVA allows you to break up the group according to the grade and then see if the
performance is different across these grades.
ANOVA is avilable for both parametric (score data) and non- parametric (ranking/ordering)
data. Types of ANOVA
One-way between groups
The example given above is called one-way between groups model.
We are looking at the differences between the groups.
There is only one grouping (final grade) which you are using to define the groups.
This is the simplest version of ANOVA.
This type of ANOVA can also be used to compare variables between different groups-
tutorial performance from different intakes.
One-way repeated measures
One-way repeated measures ANOVA is used when we have a single group on which we
have measured something a few times.
For example, we may have a test of understanding of clases. We give this test at the
beginning of the topic, at the end of the topic and then at the end of the subject.
We would use one-way repeated measures ANOVA to see if students performance on the
test changed over time.

Bikkasani. World Journal of Pharmaceutical Research
www.wjpr.net │ Vol 10, Issue 4, 2021. │ ISO 9001:2015 Certified Journal │
1413
Two-way between groups
A two-way between groups ANOVA is used to look at complex groupings.
For example, the grades by the tutorial analysis could be extended to see if overseas
students performed differently to local students. What you would have from this form of
ANOVA is :
o The effect of final grade
o the effect of overseas versus local
o the interaction between final grade and overseas/local
each of the main effects is one-way tests. The interaction effect is simply asking “is there
any significant difference in perfofrmance when you take final grade and overseas/local
acting togeather”.
Two-way repeated measures
This version of ANOVA simple uses the repeated measure structure and includes an
interaction effect.
In the example given for one-way between groups, you could add Gender and see if there
was any joint effect of gender and time of testing – i.e., do males and females differ in the
amount they remember/absorb over time.
Finally, ANOVA produces the F statistic which is the ratio Between Group Variation to
the Within Group Variation.
If the Between Group Variation is significantly greater than Within Grouup Variation,
then it is likely that there is a statistically significant difference between the groups.
This statistcal package will tell you if the F ratio is significant or not.
1.10 Data trasformation
[34]
Very often, the measured spectra are not used “as-is,” but are subjected to various types of
data transformation before being introduced into any calibration algorithm to reduce or to
eliminate extraneous variations.
Typical transformations includes smothing (averaging sets of adjecent spectral data points),
computing a derivative (first or second derivative of the spectrum with respect to wavelength
are common), and any of several more specialized transformations of the data.
Typically, a careful analyst will inspect the spectral data both before and after performing any
transformation to ensure that the data from a coherent whoole, and that no spectra or samples

Bikkasani. World Journal of Pharmaceutical Research
www.wjpr.net │ Vol 10, Issue 4, 2021. │ ISO 9001:2015 Certified Journal │
1414
appear to be outiners. Proper application of spectrocopic data pre-processing, to reduce and
correct interferences such as overlapped bands, baseline drifts, stattering, and pathlength
variation.
Multivariate analysis (MVA)
[35]
MVA is synonymous with the term chemometric. It is a method which takes into
consideratioon many variables acting together. The method is fast and efficient in
determination as well as exttraction of information.
MVA applied to spectral data provides the necessary tools foe analysis of data for qualitative
applications, such as classification and identification (i.e., raw material identification,
counterfeit detection and security screening).
Quantitative models can be developed from spectral data, providing predective models that
can be used to predict values for composition, and concentration of various analytes from
spectral data. Such models provide rappid means of obtaining results from analytical data that
can readily be collected on samples in their natural state (in the field, lab, or process).
1.11 Multivariate calibration (MVC)
[36]
Calibration process is necessary before starting quantitative analysis to do MVA. The term
MVC can be defined as the use of emperical data and prior knowledge for determining how
to predict unknown quantitative information Y from available measurements x, via a
mathematical transfer function. Calibration hence is described as the process of establishing
this mathematical function (f) between measured variable x and a dependent variable.
Y : f(x) = y…………………[1]
One of the simplest forms of calibration is linear regression expression
y = a+bx………………….[2]
where b is the regression coefficient and a is the intercept of the linear approximation, x is the
independent variable and y is the dependent variable (response parameter). In linear
regression one x-variable and one y-variable are used. In multivariate calibration, however,
numerous X and Y are used.
MVC process includes
Selection of representative calibration sample set.
Spectra acquisition and determination of reference values.

Bikkasani. World Journal of Pharmaceutical Research
www.wjpr.net │ Vol 10, Issue 4, 2021. │ ISO 9001:2015 Certified Journal │
1415
Multivariate modeling to relate the spectral validations to the reference values of the
analytical target property.
Validation of the model by cross validation or external validation.
A method which has being used widely for quantitative determination.
Used to construct mathematical models at more that one wavelength.
Multivariate calibration Vs Univariate calibration
[37,38,39]
MVC method has got numerous advantages over univariate callibration (UVC) methods.
Some of these advantages are :-
a. Handling interferents: unlike in UVC, it does not need to remove background
correction. This means that the contribution from one does not affect the contribution
from other. This is the best straight forward advantage of MVA.
b. Selectivity: UVC works well as long as no other components in the sample analyzede
absorb light at the wavelength used, i.e., the wavelength is selective for the compound
under study. If this is not the case, all the interferences in the sample must be known. In
MVC, however, this is not the case scince using many x-variables automatically corrects
for each other’s selectivity problem, and the x-variables used thus donot need to be totally
selective.
c. Eliminate sample error : in MVC, 100% compliance and analytical accuracy is obtained
to eliiminate the sampling error and attaining 100% compliance is one of the further most
confronted. Sampling error is one of the error which are happened in the conventional
system, as process analytical technique (PAT) is merge eith the chemometrics which
reduce the sampling error and provide accuracy in samppling and precised analysis.
d. Outliners control : Multi-variates are important to detect outliners in all data analysis.
Errors are the rule rather than the exception due to for instance trivial errors, instrument
errors and sampling errors. If these errors are sufficiently large either in quantity or
quality, they can affect any meaningful result or interpretation. It may seem difficult to
detect outliners when complicated multivariate data are used, but in fact, the detection of
outliners is greatly enhanced from having multivariate data.
e. Robustness : MVC is more robust to small changes in the experimental or instrumental
parameters such as small changes in Ph, temperature or lamp intensity. Generally MVC
has many advantages over the UVC methhod, with respect to different analytical
parameters.

Bikkasani. World Journal of Pharmaceutical Research
www.wjpr.net │ Vol 10, Issue 4, 2021. │ ISO 9001:2015 Certified Journal │
1416
MVA and Spectroscopy
[40]
Using chemometric algorithms, modern computer technologies and modern spectroscopy
provides the basis for the modern-day development of methods of chemical analysis with the
best rewards.
Using chemometric methods with UV-Visible spectroscopic measurements rresults in a fast
analytical method that is simple enough for technicians to perform. Basically, the user
“calibrates” or “trains” the instrument to perform the analysis. This training step should be
done by an expert to ensure accuracy.
“Training the chemometrics” requires that the user obtains samples representative of all the
future variations of those types of samples that the instrument willl analyze during routine
operation. Choosing the number and the appropriate samples is one of the key steps in
creating a good calibration model, i.e., the mathematical model describing the samples that
the computer will use in the future to do the actual analyses. Training the spectrometer
requires measuring the spectra from all the samples and then saving them to a computer file.
The science of chemometrics gives spectroscopists many efficient ways to slove the
calibration problem for analysis of spectral data. Chemometrics can be used to enhance
method development and make routine use of statistical models for data analysis.
Spectroscopists use software packages for spectroscopic data analysis, modeling,
classification and prediction to meet process monitoring and quality assurance needs. The
spectroscopists requirements are :
Proper application of spectroscopic data of pre-processing, to reduce and correct
intrfrences such as overlapped bands ,base line drifts,scattering,and path length variations.
Strong calibration and diagnostics means of sample selection and vairable selection
,stastic results caluclation to build representative and reliable models.
Model validation and itegration means to supply rigorous prediction,measurement quality
control (QC) and real-time product quality and process monitoring.
Chemometrics provides some advantages which includes:
Speed to obtain real information of the data.
Extact high quality information from the fewer resolute data.
Accuracy of the information that derives by the integration and probability of the data.
Precision of data collection from one sensor to another sensor.

Bikkasani. World Journal of Pharmaceutical Research
www.wjpr.net │ Vol 10, Issue 4, 2021. │ ISO 9001:2015 Certified Journal │
1417
Clear set of information collected from the cell from all the possible order of data.
1.12 Calibration techniques involved in chemometrics
Fig. 1.5: Model types used in chemometric analysis.
Multivariate Calibration Analysis methods (MCA; Performing the calibration)
[34]
They are hard coreof chemometrics:the algorthims that relate the measured spectral data to
the samples properties. These are numerous algorithhms available foe both qualitative and
quntitative analysis.
MVC used to resolve the problem in analyzing multi-component mixture by allowing rapid
and simultaneous determination of each component in the mixture with minimum sample
preparation ,responsible accuracy and precision and without the need of lengthy separation.
The accuracy and precision is achieved without prior seperation of the components. This
implies that these methods are time and cost effective. Although various methods are there in
the appliction, two of them will be treated here for the convinence of the study.
Bilinear models
In this the data is arranged in data matrices in such a way that each vertical column has
vairables and each horizontal row has the samples.
Bilinear chemometrics techniques include following:
Classical least squares regression analysis (CLS)
[40,41,42,43]
CLS is one of the traditional regression algorithms, that depends on the Beer Lambert law
with assistance of close tools mixtures of components with overlapping spectra will be

Bikkasani. World Journal of Pharmaceutical Research
www.wjpr.net │ Vol 10, Issue 4, 2021. │ ISO 9001:2015 Certified Journal │
1418
resolved. Beer’s law describes the relation between two variables, the spectral response (A)
and the constituent concentration (C), and two constants, the intercept (a) and the regression
coefficient (b).
A λ
1
= CaKa λ
1
+ CbKb λ
1
………………………….(1).
According to Beer’s law absorbance of multiple constituent at a given wavelength is additive.
A λ
2
= CaKa λ
2
+ CbKb λ
2
…………………………(2).
A λ
1
= CaKa
1
+ CbKb
1
.....CnKn λ
1
+ E λ
1
……..(3).
A λ
2
= CaKa
2
+ CbKb
2
…..CnKn λ
1
+ E λ
2
……...(4).
Solving the equation for K matrix one can use the resulting best fit least squares lines (S) to
predict concentrations of unknown analyte.
Advantages of CLS
Based on Beer’s law.
Unlike to other techniques calculations are relatively simpler.
The CLS method can be applied for moderately complex mixtures such as binary and
terinary mixtures.
The calibration method doesnot need the selection of wavelengths necessarily. Once the
number of wavelengths to be used exceeds the number of constituents, any number can be
utilized, even upto the entire spectrum.
Making use of large number of wavelength results CLS in giving an averaging effect to
the solution. This further leads to less susceptability to noise in the spectra.
Disadvantages of CLS :
It needs understanding the entire composition (i.e., concentration of all constituent) of
mixtures in the calibration mode.
This method is not applicable for which chemically interact within the mixture.
It is exposed or succeptible to base line effects.
Principle component regression (PCR)
[40,41,42,43]
It is a factor analysis method. Problems which usually are not sloved by traditionally
regression methods will be sloved better with PCR. It is a well known pronounced and known
method.as a procedure the steps to be followed are two.
Step 1: linear combination of the original variable will be combined to optimize a certain
criterion. The explained variation in the data are also called latent variables. In short terms no
correlation is needed between regression models.

Bikkasani. World Journal of Pharmaceutical Research
www.wjpr.net │ Vol 10, Issue 4, 2021. │ ISO 9001:2015 Certified Journal │
1419
Step 2 : In the second step, MLR (Multiple Linear Regression) is applied to the newly
obtained latent variables. When co linearity between original variable occurs, interpretation
of the variation is observed in the data set than plotts of original variable selected by MLR.
Since the scores are orthogonal, the MLR solution is stable and therefore the PCR model does
n ot suffer from collinearity effects. It is the belief of some data analysis purists that PCR is
superior to PLS since it forces analysts to better understanding their data and its
preprocessing (transformations) before the application of a regression procedure.
Advantages of PCR
PCR doesn’t need the selection of wavelength most of the time the whole spectrum were
used.
Averaging effect: as one uses great number of wavelenngths the averaging effect will be
attained decreasing the chance for spectral noise can be utilized for mixtures with large
constituents (highly complex). PCR also enables, sometimes to figure out samples with
constituents which are not present basically (originally) in the calibration mixture.
Disadvantages of PCR
The caluclation is slower if compared to Classical Least Square (CLS).
Optimization needs knowledge of PCA i.e., interpretation and understanding the model is
not a simple task.
It needs large number of sample for the accurate calibration.
Inspite of the above inconveniences, PCR has widely been applied for the spectrophotometric
resolution of mixtures comprising two or more serious overlapping spectra.
Partial least square regression (PLSR)
In PLS technique, the regressions are caluclated with least square algorithms. The aim of the
PLS is th launch a linear link between two matrices, the spectral data X and the reference
value Y.
PLSR also sometimes reffered to as projection to latent structures or just PLS, models both
the X and Y-matrices simultaneously to find the latent (or hidden) variables in X that will
best predict the latent variables in Y. PLSR components are similar to principle component,
but will be referred as factors.

Bikkasani. World Journal of Pharmaceutical Research
www.wjpr.net │ Vol 10, Issue 4, 2021. │ ISO 9001:2015 Certified Journal │
1420
PLSR maximizes the covariance between X and Y. in this case, convergance of the system to
a minimum residual error is often achieved in fewer factors than using PCR. This is in
contrast to PCR, which first performs PCA on X and then regresses the scores (T) vs. the Y
data. PLSR may be carried out with one or more Y variables, meaning that multiple Y
responses can be used during regression modeling. A conceptual illustration for PLSR is
shown graphically in fig hindu)
X – Y relationship outliners
[44,45,46]
X – Y relationship outliners plots the t-scores from X vs. the u-scores from Y and is used for
two main purposes, to detect possible outliners and to determine the optimal number of
factors to use in a PLSR model.
This plot is unique to the PLSR algorithm. Since PLSR attempts to maximize the covariance
between X and Y variables in the first caluclated factors, the t vs. u plot should ideally show a
straight line relationship. Samples that deviate noticebly are potential outliners.
The t – score are the new coordinates of the data points in the X-space, computed in such a
way that they capture the part of the structure in X which is most predictive for Y. the u-score
summerize the part of the structure in Y which is explained by X along a given factor, and are
related to T by a constant. The – Y relationship outliners plot for ideal and outliner shown in
the fig (hindu)
The – Y relationship outliners plot is also useful for detecting nonlinear relationships that
may exist in the data. This may suggest a different preprocessing should be considered.
Advantages of PLSR
PLS are the combination of both full spectra coverage of CLS and the partial composition
of regression of inverse least square (ILS).
The decomposition and the regression steps follow the one step process.
The calibration process is more robust and accurate to caluclate the unknown sample
which make the PLS more beneficial to detrmination of the unknown sample.
Prediction of the elements of interest that are not present in the original calibration
mixtures also be done by this PLS method.

Bikkasani. World Journal of Pharmaceutical Research
www.wjpr.net │ Vol 10, Issue 4, 2021. │ ISO 9001:2015 Certified Journal │
1421
PLS having the superiority to predict the elements of interest rather than other methods
that were sucessfully appplied for spectral quantitative analysis. PLSR provide much
better outcome than PCR method.
Disadvantages of PLSR
Despite of wide variety of advantages are observed iin PLSR which also has some sort of
disadvantages.
It is quit slower process to caluclate the data which might be slower than some classical
methods.
The difficulty in understanding and the interpretation of data make the method more
complicated.
A huge number of samples are required to calibrate the methods.
Difficult to obtain the calibration sample and it might avoid the collinear constituent
concentration.
From several methods one can use the best model which fits the calibration. It is also possible
to use two or more methods to attain comparable results.
Multiway models
Multiway models are basically used when the data is multivariate and linear in more than
two dimensions.
Bilinear techniques could not provide sufficient data which was provided by multivariate
techniques.
The methods like multiway principlecomponent analysis (MPCA) and multiway partial
least square (MPLS) improve the process understanding and summerizes its behavior in a
batch-wise manner and are therefore recognized as tools for monitoring batch data.
The multiway methods
Parallel factor analysis (PARAFAC)
Parallel factor analysis (PARAFAC) is a decomposition method used for the modeling of
three-way or higher data and is mainly intended for data having congruent variable profiles
within each batch.
Parallel factor analysis – 2 (PARAFAC-2)
PARAFAC-2 can handle data variable profiles that are shifted or/are in a different phase.

Bikkasani. World Journal of Pharmaceutical Research
www.wjpr.net │ Vol 10, Issue 4, 2021. │ ISO 9001:2015 Certified Journal │
1422
In PARAFAC trilinearity is a fundamental condition where as PARAFAC-2 enables
trilinearity. However, it should be noted that PARAFAC may be used to fit nonlinearity
to some extent in one mode only in cases where data shifts from linearity are regular.
Both the techniques asre mainly applied for analyzing chemical data from experiments
that form a 3-way or higher data, structure, for example, chromatographic data,
fluoresence spectroscopy measurements, temporal varied spectroscopy data with
overlapping spectral profiles, and process data.
Tucker – 3 model
This can be used for exploring n way array data as it consists of n modes of loading
matrices.
The generality of the Tucker – 3 models, and the fact that it covers the PARAFAC model
as a special case, has made it an often used model for decomposition, compression, and
interpretation in many applications.
N-Partial least square (N-PLS)
For handiling a multiway data extension of PLS method namely N-PLS was introduced.
It basically uses dependent and independent variables for finding the latent variables
which describes maximal covariance.
Chemometric software’s
Statistical software’s for data analysis, modeling, classification and prediction.
Ex : Design expert, Unscambler, Matlab, SAS and etc.,
1.13 Applications of chemometry
[47,48,49]
Chemometry allows the interpretation of multivariate data to predict the concentration of
each drug in a mixture.
Identification of source of chemical pollutions.
Analytical evolution of quality and quntity of some food products.
Evolution of the analytical potential of coupled methods.
Evolution of effectiveness of sample pre-treatment methods for trace elements
determination.
Quality control of laboratory results, standardization and interpretation of laboratory tests
in disease monitoring.

Bikkasani. World Journal of Pharmaceutical Research
www.wjpr.net │ Vol 10, Issue 4, 2021. │ ISO 9001:2015 Certified Journal │
1423
Diagnostics and detection of significant change in patients condition during medical
treatment and clinical care, prediction of the futre medical state of the patient.
Drug synthesis and dovelopment and design, tools for drug discovery, SAR, drug
mechanism,
Merits
Fast, cheap and non-destructive (advantages over HPLC).
Accurate quntitative analysis in the precense of heavy intrference by other analytes.
High selectivity.
No need of seperation procedures in the drug determintions.
Combination of chemometrics with analytical chemistry can enhance th signal to
noise(S/N) ratio.
Improve selectivity to determination.
Optimize exmerimental conditions.
Raise analytical opereration efficiency.
The advert of rapid, in expensive computers has perimitted the prolifiration of
computationally intensive calibration methods. One must choose between many competing
methods nad algorithms for aplication to any particayular calibration challenge. The need to
develop logical rules to aid in calibration method selectiom is imperitive since,as technology
progress, technologist are moving closer to implementing multivariate and higher order
sensors capable of self-calibration. The best calibration method for futre prediction of
accuracy and precision will be the one that employs the simplest model that fits the data to
the arbitary presicion, the method that incoprates a basis set that best mimics the data will
construct the simplest model.
Applications of chemometrics in pharmaceutical field
[49,50,51]
Chemometrics method is widely used in different areas of pharmceutical fields like
manufacturing, quality evaluation and quality assurance.
Powder flow properties
The experimental results for flow properties of pharmaceutical powders obtained were
correlated with the NIR spectrum.PLSR method was used for correlation to determine the
sample density for transmission of Raman spectroscopy. A quick and accurate way to

Bikkasani. World Journal of Pharmaceutical Research
www.wjpr.net │ Vol 10, Issue 4, 2021. │ ISO 9001:2015 Certified Journal │
1424
determine the pharmaceutical properties of granules(particle size and angle of repose) and
tablets (porosity and hardness), in the formulation of pharmaceuticals by application of
chemoinformetric and NIR spectroscopy using PSR.
Moisture content
Moisture content is very important for the pharmaceutical product. Accurate amount of
moisture should be available in the pharmaceutical product to dovelop a successful drug and
formulations which key to stability the product. The determination of moisture content is one
of the most important and several multivaraite regression method are used to analyze the
water content.PLSR widely used by several researchers to determine the water content in the
pharmaceutical products.
Drug content determination
Detemination of drug content in pharmaceuticals is the matter of concerns for its importance.
The content of the in the pharmaceutical product is challenging to determine and necessary to
obtain the pharmacological responses of the drug. Spectroscopy is the technique choice
which combined the MVR method to analyze the content of the drug. PSR is the best
prediction to determine the active substance content in the low dosage tablets by using rather
than the PCR.
Lyophilisation
Broadly used technique for the formulation of a huge range of pharmaceutical products
especially vulnerable to degradation in aqueous solutions like peptides, proteins or complex
organic molecules. The objectives of Lyothilisation are to manufacture materials with
superior self-stability and which are unaffected after reconstitution with water.
Determination of the residual moisture content from the glass vials is done by NIR spectra.
Curve fitting analysis and PLSR models have been developed to enumerate both hydrate and
surface water content in lyophilized product.
Powder blending
Blending of powder is the crucial step to manufacture the pharmaceutical product. This
blending step is mainly done among the API powders and the excipients that are necessary to
prepare a phamaceutical dosage forms. So blending steps posesses a major role in the
pharmaceutical analysis prospect of view. Without homogenous blend of the API and
excipents it is impossible to get a uniform dosage form. But the blend homogeneity is

Bikkasani. World Journal of Pharmaceutical Research
www.wjpr.net │ Vol 10, Issue 4, 2021. │ ISO 9001:2015 Certified Journal │
1425
problematic. Methods like HPLC,NIR spectroscopy and UV-Vis are widely used in the
determination of content during the blending.
But these methods are destructive, codtly and time consuming. PSLR has the better
prediction than principal component analysis for these analytical purposes.
Drying
Drying is also a critical step for the pharmaceutical manufacturing. It is employed in
progression such as granulation. In conventional way, if the representative sample passes then
its assumed that the entire sample having same quality. But it does not guarantee that the
entire product is controlled. To minimise the uncertainly a new system is established where
quality control check is done by the design of the experiments. So the chemometrics with the
spectroscopy where PCA and PLS both are used to ressolve the analysis of product after
drying. Here PCA is used for the identification of the products and PLS is used for the
qulification of the pharmaceutical product which reveals the 100% control of the quality of
the product.
1.1.1 Drug profile
1.1.2 Itraconazole
[52, 53, 54, 55]
Chemical structure
• IUPAC name: 4-[4-[4-[4-[{2-{2,4-Dichlorophenyl}-2(1H-1,2,4-triazol-1-methyl)-1,3-
dioxolan-4-yl]methoxy]phenyl]-1-piperazinyl]phenyl]- 2,4 Dihydro- 2-(1-methylpropyl) -
3H-1,2,4-triazol-3-one
Molecular formula: C
35
H
38
Cl
2
N
8
O
4
Molecular weight: 705.64 g·mol
−1
Description: 1) It is an odorless powder with a bitter taste prepared by
2) Chemical synthesis.
3) It is an optically active compound.

Bikkasani. World Journal of Pharmaceutical Research
www.wjpr.net │ Vol 10, Issue 4, 2021. │ ISO 9001:2015 Certified Journal │
1426
Solubility: Soluble in water and alcohol.
Category: It is an orally active triazole drug with a broad spectrum of Antifungal
activity.
Melting point : 170°c
Log P : 5.66
pKa : 3-4
Protein binding : 99.8%SS
BCS Classification : Class II
Oral bioavailability : 55%
Oral absorption : >85%
Plasma half-life : 20 hrs
Metabolism : Extensively metabolized in liver (CYP 450) into a large number
of metabolites; Hydroitraconazole, the major metabolites.
Food interactions :Milk and calcium containing dairy products, Iron, Antacids
or Aluminum salts.
MOA : Cell membrane synthesis inhibitors.
Fig. 1.6: Schematic representation of mechanism of action of Itraconazole.
Treatment :Dermatophytosis, Superficial candidiasis, Pityriasis versicolor,
Oculomycoses, Subcutaneous mycoses, Systemic mycoses
Mycoses (Paraccidioido mycoses, Cryptococcal menengitis,
Histoplasmosis, Coccidioidomycoses, Blastomycoses)
Pulmonary and extra pulmonary blastomycoses.

Bikkasani. World Journal of Pharmaceutical Research
www.wjpr.net │ Vol 10, Issue 4, 2021. │ ISO 9001:2015 Certified Journal │
1427
1.1.3 Terbinafine
[52,53,54,55]
Chemical structure
IUPAC name : (E)-N-[6,6-Dimethyl -2-hepten-4-ynyl]-N-methyl-1-naphthalene
methanamine
Molecular formula : C
21
H
25
N
Molecular weight :327.90 g/mol
Description :It is slightly bitter, white, Odorless, that is obtained by chemical
Synthesis.
Solubility :Organic solvents, Alcohols, sparingly soluble in aqueous buffers.
Category :Terbinafine is a synthetic Allylamine antifungal agent.
Melting point :>202°c
LogP : 5.53
pKa : 8.94
Protein binding :99%
BCS Classification :Class II
Oral bioavailability :50%
Oral absorption : ~80%
Plasma Half-life :11-17 hrs
Metabolism :Extensively metabolized in liver (CYP2C9, CYP1A2, CYP3A4)
With the production of about 15 metabolites
MOA :Cell membrane synthesis inhibitors
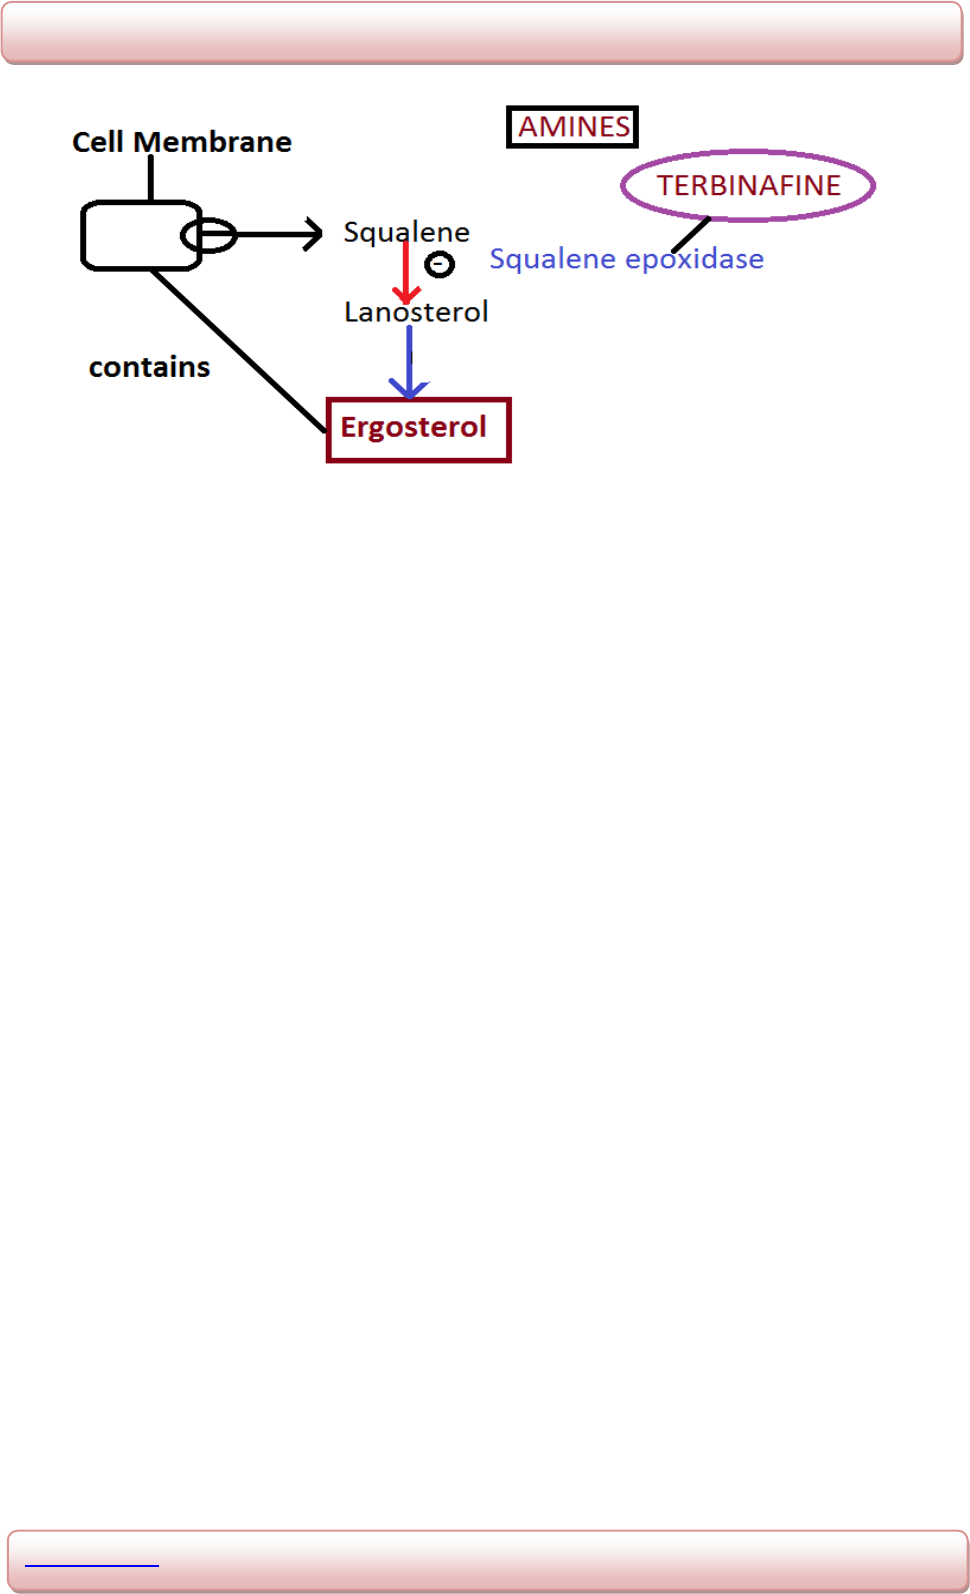
Bikkasani. World Journal of Pharmaceutical Research
www.wjpr.net │ Vol 10, Issue 4, 2021. │ ISO 9001:2015 Certified Journal │
1428
Fig. 1.7: Schematic representation of mechanism of action of terbinafine.
Treatment 1) Dermatophyte infections of skin and hair
2) Dermatophyte infections of finger and toenails
3) Pityriasis versicolor
4) Yeast infections of skin
2.1. UV Analytical method development for Itraconazole (ITR):
1. Poonam A. Salunke et.al., (2016):
[56]
Reported work on UV method development and
validation of Itraconazole bulk and capsule formulation. Spectroscopic method was
carried out by using acidic ethanol as solvent. Itraconazole detection wavelength was set
at 262nm.The linearity was found to be in the range of 2-12μg/ml. the results of analysis
have been validated statistically as per ICH guidelines.
2. G. Soundarya et.al., (2016):
[57]
Reported work on Method development and analytical
method validation of Itraconazole by UV. Spectroscopic method was carried out by using
methanol as solvent. The absorbance maximum was observed at 261nm. The linearity
was found to be in the range of 2.5-25 μg/ml. the results of analysis have been validated
statistically as per ICH guidelines.
3. M. Koteswara Rao et.al., (2014):
[58]
Reported work on Method development and
validation of Itraconazole by UV. Spectroscopic method was carried out by using
chloroform as solvent. The detection wavelength was observed at 267nm. The linearity
was found to be 1-10 µg/ml. the results of analysis have been validated statistically as per
ICH guidelines.
4. S. K. Sahoo et.al., (2011):
[59]
Reported work on First derivative UV method development
and validation of Itraconazole in its Bulk and Dosage form. Spectroscopic method was

Bikkasani. World Journal of Pharmaceutical Research
www.wjpr.net │ Vol 10, Issue 4, 2021. │ ISO 9001:2015 Certified Journal │
1429
carried by using methanol as solvent. The detection wavelength was observed at 261nm.
The linearity was found to be 20-60µg/ml. the results of analysis have been validated
statistically as per ICH guidelines.
5. Shalin K. Parikh et.al., (2010):
[60]
Reported work on Development and validation of UV
spectrophotometric method for the estimation Itraconazole bulk drug and pharmaceutical
formulation. Spectroscopic method was carried out by using methanol as solvent. The
absorbance maximum was observed at 262nm. The linearity was found to be 4-14μg/ml.
the results of analysis have been validated statistically as per ICH guidelines.
2.2. UV Analytical method development for terbinafine (TER)
1. K. Basavaiah et.al., (2016):
[61]
Reported work on Analytical methods for determination
of Terbinafine hydrochloride in pharmaceuticals and biological materials. Determination
of TER by UV in raw materials, tablets and creams by using methanol as solvent. The
detection wavelength was observed at 223nm. The linearity was found to be 8-24 µg/ml.
the results of analysis have been validated statistically and recovery studies were
performed as per ICH guidelines.
2. K. Basavaiah et al., (2013):
[62]
reported work on Stability Indicating UV-
Spectrophotometric Assay of Terbinafine Hydrochloride in Dosage Forms. Determination
of TFH in bulk drug and tablets are based on the measurement of absorbance of TFH in i)
0.1M HCl, ii) 0.1M acetic acid. The absorption maxima 222nm and 282nm were
observed respectively. The linearity was found to be 0.2-4.0 μg/ ml and 2.0-50.0 μg/ ml
respectively. The results of analysis have been validated statistically and recovery studies
were performed as per ICH guidelines.
3. K.Krupa Patel et al., (2012):
[63]
reported work on Development and validation of the
UV-spectrophotometric method for determination of terbinafine hydrochloride in bulk
and in formulation. The method was carried by using methanol as solvent. The detection
wavelength was observed at 282nm. The linearity was found to be 8-24 µg/ml. The
results of analysis have been validated statistically and recovery studies were performed
as per ICH guidelines.
4. S.Pritam Jain et.al., (2011):
[64]
reported work on Development and validation of the UV-
spectrophotometric method for determination of terbinafine hydrochloride in bulk and in
formulation. The method was carried by using water as solvent. The detection wavelength
was observed at 283nm. The linearity was found to be 5–30 μg/ml. The results of analysis

Bikkasani. World Journal of Pharmaceutical Research
www.wjpr.net │ Vol 10, Issue 4, 2021. │ ISO 9001:2015 Certified Journal │
1430
have been validated statistically and recovery studies were performed as per ICH
guidelines.
2.3. UV-Visible Spectrophotometry with chemometric analysis
1. T. Eticha et.al., (2018):
[65]
reported work on Chemometric-Assisted Spectrophotometric
method for the simultaneous determination of Ciprofloxacin and Doxycycline Hyclate in
pharmaceutical formulations was performed by chemometric techniques like PCR and
PLS by using Minitab 7.1 version software and Unscrambler® X 10.5 version software.
Two sets of standard mixtures, 25 as a calibration set and 9 as a validation set, were
prepared. For both drugs the linearity ranges of 1–10 μg/ml for ciprofloxacin and 5–25
μg/ml for doxycycline hyclate. Absorbance values were recorded at λ max of each drug
272nm for CIP and 275nm for DOX with r
2
of 0.998 (PCR) 0.998 (PLS), 0.994 (PCR)
0.994 (PLS), RMSEP values 0.142 (PCR) 0.143 (PLS), 0.219 (PCR) 0.208 (PLS) of
Ciprofloxicin and Doxycycline hyclate respectively.
2. Umang H. Shah et.al., (2017):
[66]
reported work on Chemometric Assisted
Spectrophotometric methods for simultaneous determination of Paracetamol and
Tolperisone Hydrochloride in pharmaceutical dosage Form by using chemometric
techniques like CLS, PLS, and PCR by using Unscrambler® 10.3.0.80, MATLAB
(R2009A) 7.8.0.347 software. Twenty five (25) mixed solutions were prepared for the
chemo metric calibration as training set and sixteen mixed solutions were prepared as
validation set. The linearity ranges of 5-25 µg/ml for Paracetamol and 1.5-7.5 µg/ml for
Tolperisone hydrochloride. RMSEP values 0.022 (PCR) 0.214 (PLS) 0.259 (CLS), 0.079
(PCR) 0.075 (PLS) 0.113 (CLS) of Paracetamol and Tolperisone hydrochloride
respectively.
3. Lawan et.al., (2014):
[67]
reported work on chemometric – assisted UV
Spectrophotometric method for determination of Metformin HCl and Glyburide in
pharmaceutical tablets was performed by chemometric techniques like PCR, PLS by
using Unscrambler 10.1X software. The absorbance was measured in the wavelength
range of 200-400 nm and linearity ranges used to construct the calibration matrix were
selected in the ranges 40-200 µg/ml (MET), 1-10 µg/ml (GLY). RMSEP values of MET
& GLY were found to be 1.806, 0.256 (PCR) & 1.802, 0.185 (PLS) respectively.

Bikkasani. World Journal of Pharmaceutical Research
www.wjpr.net │ Vol 10, Issue 4, 2021. │ ISO 9001:2015 Certified Journal │
1431
4. Khushboo et.al., (2014):
[68]
reported work on multivariate chemometric assisted
spectrophotometric techniques for simultaneous determination of Amlodipine besylate
and Telmisartanin marketed tablet formulation was performed by chemmometric
techniques like PLS, CLS by using Design expert 8.0.4 software and matlab R2007
software. The absorbance was measured for the 24 synthetic mixtures involving 19
calibration and 10 validation sets are scanned at 230-302 nm at every 3 nm. Calibration
range was found to be 1-10 µg/ml (AMP, 8-80 µg/ml (TEL) with a r
2
of 0.999 (PLS)
0.998 (CLS), 0.999(PLS) 0.998 (CLS) for Amlodipine besylate and Telimisartan
respectively.
AIM AND OBJECTIVES
3.1. Aim
The primary aim of this work is to show how spectroscopy and chemometrics in
conjugation can be used as an alternative to HPLC for quantitative and qualitative
analysis.
The study is mainly aimed at analyzing overlapped binary combinations (Itraconazole and
Terbinafine) by using chemometrics-assisted UV-Visible spectrophotometric techniques
without prior separation of them, and comparing the obtained results with those obtained
from official, or reported methods.
To determine the quantities in binary combinations (Itraconazole and Terbinafine) with
the Classical Least Square method (CLS), Partial Least Square (PLS) method, Principle
Component Regression (PCR) method.
The aim has been to combine chemometric methods with spectroscopic analytical techniques
in a simple and straight forward fashion to obtain easily applied methods applicable in real
life.
3.2. Objectives
The USP has suggested that the reduction in amount of reagents and materials which are
routinely used in HPLC assays that have the potential to cause harm to human health and
environment. Therefore, spectrophotometry as a simple, robust, quick and low cost
method may be a good alternative if it is combined with multivariate calibration methods
for determination of a complex mixture in pharmaceutical quality control laboratories.

Bikkasani. World Journal of Pharmaceutical Research
www.wjpr.net │ Vol 10, Issue 4, 2021. │ ISO 9001:2015 Certified Journal │
1432
The quality control of dosage form requires reliable and quick analytical methods.
UV/Visible spectrophotometry is by far the instrumental technique of choice, owing
mainly to simplicity, often demanding low cost equipment.
Simultaneous quantitative analysis of pharmaceuticals containing multi-active
compounds is difficult to perform by classical spectrophotometric methods due to
overlapping spectra.
The objective of this work is to illustrate how spectroscopic techniques can be used in
conjugation with chemometric tools in order to achieve rapid and efficient analytical
methods for the analysis of solutions.
These spectrometric methods consisting of spectroscopic analysis, a high level of
automation and chemometric data evaluation can lead to rapid methods having a high
analytical capacity, and the term high capacity analysis (HCA) is suggested for these
methods.
HCA methods might very well be alternatives to HPLC and in some cases even
outperform the chromatographic methods.
Chemometric methods with spectroscopic measurements which will results in fast
analytical method that is simple enough for technicians to perform.
The use of experimental design as a means to obtain good quality data and combine with
multivariate data analysis to eliminate possible covariance between variables.
Use of multivariate data analysis is to reduce relatively large number of variables to a
small number of orthogonal factors by treating with statistical methods.
These methods might very well be alternatives to HPLC and, in some cases, even
outperform the chromatographic methods.
Plan of work
Literature survey
Procurement of selected drug for study
Reference standards were procured from pharmaceutical company.
Selection of analytical technique
UV spectroscopy.
Estimation of drugs in combination by UV-spectrophotometric method
1) Selection of solvent system.
2) Selection of wavelength.
3) Selection of different conditions.

Bikkasani. World Journal of Pharmaceutical Research
www.wjpr.net │ Vol 10, Issue 4, 2021. │ ISO 9001:2015 Certified Journal │
1433
4) System suitability parameters study.
5) Analysis of standard laboratory mixture to see feasibility of proposed method.
6) To adopt selected method on marketed formulation.
o Accuracy
o Linearity/range
o Precision
o LOD
o LOQ
o Ruggedness
o Robustness
o specificity
Preparation of standard solutions of drugs in required concentrations, analyzing using
UV-Visible spectrophotometer and optimizing the method using surface response method
by Design Expert 11.1 software.
Using the above obtained optimized results carrying out chemometric analysis with
suitable methods for both pure drug and pharmaceutical formulation by using
Unscrambler 10.4X statistical software.
Comparison of models to conclude with with the best.
Fig. 4.1: Plan of work.
5.1. MATERIALS AND METHODS
Spectrophotometric measurements were carried out on a computerized double beam
Shimadzu 1800 series UV/Visible spectrophotometer and a pair of 1cm matched quartz cells
was used to measure absorbance of solution over the range 200-400nm. The subsequent

Bikkasani. World Journal of Pharmaceutical Research
www.wjpr.net │ Vol 10, Issue 4, 2021. │ ISO 9001:2015 Certified Journal │
1434
statistical manipulation was performed by transferring the spectral data to Microsoft Excel®
2017 program and processing them with standard curve fit package and matrix calculations.
Data were processed on an Intel® Pentium V equipped with essential statistical trail version
programs (Design Expert® 11.1 provided by Stat Ease and Unscrambler® 10.4X provided by
Camo Software) were used for optimization and linearity of method.
Pharmaceutical grade Itraconazole and Terbinafine provided as a gift samples by K.P Labs
Pvt Ltd., Hyderabad, India, were used as working standards. All other chemicals used were
analytical grade. Methanol was used as a solvent. The Myitra-T tablets containing (each
100mg of Itraconazole and 250mg of Terbinafine) manufactured by Biophar life science
Pvt.Ltd, India was purchased from the local market and subjected to analysis by proposed
method.
5.2. Procedures
5.2.1. Preparation of standard solutions for linear calibration models Itraconazole and
Terbinafine standard stock solutions
Accurately weighed quantity of Itraconazole (ITRA; 10mg) and Terbinafine (TERB; 10mg)
were transferred to two separate 100ml volumetric flask. Dissolved in sufficient quantity of
Methanol, and then diluted up to the mark with same solvent (stock solution 100 µg/ml). A
training set of standard mixture solutions containing 2-30 µg/ml ITRA and 2-45 µg/ml TERB
was made from stock solutions. A calibration curve was prepared by plotting absorbance vs.
concentration at their respective λ
max
.
5.2.2. Preparation of sample solution
Twenty tablets of Myitra-T were weighed and crushed to fine powder. An accurately weighed
powder sample equivalent to 1000 mg was weighed, transferred to 100ml volumetric and
dissolved in sufficient quantity of Methanol. Sonicated for 15 mins and filtered through
Whatmann filter paper. Finally, the filtrate was made up to volume with Methanol.
5.2.3. Stanard solutions for multivariate calibration
A multivariate calibration model for the analysis of individual drugs was carried out using
UV-Visible spectrophotometer. In order to obtain the calibration matrixes for applying PCR
and PLS analysis, solutions of each of ITRA and TERB were prepared with 2-35 µg/ml and
2-45µg/ml respectively. These ranges were previously verified to obey Beer’s – Lambert’s
law for each of the ITRA and TERB in the selected solutions. Absorption spectrum was

Bikkasani. World Journal of Pharmaceutical Research
www.wjpr.net │ Vol 10, Issue 4, 2021. │ ISO 9001:2015 Certified Journal │
1435
recorded for each solution between 200 and 260nm (digitalized every 2.0nm interval) with
Methanol as blank were subjected to the least square regression (PCR and PLS) analysis in
order to obtain the calibration model for each.
The optimum number of factors used in PLS algorithm is an important parameter towards
obtaining the best prediction performance. This means modeling the system with the
optimum amount of information and avoiding over fitting or under fitting (over fitting and
under fitting means that the defined model must neither over estimate nor under estimate
values, and is made by fitting constants). Cross validation procedures were applied to
calculate the number of factors which gives as much as possible information from the
absorbance data to measure the property of interest (concentration). Thus the range between
230-330 nm at 2nm interval was selected as two drugs shows closely overlapping bands and
optimum number of factors was extracted. The absorbance data matrices were constructed
from the raw spectra containing absorbance values at wavelength ranges between 230-330
nm at 2 nm intervals. The spectrum of the single sample consists of the individual absorbance
value for each wavelength at which sample was measured. Generally, MLR techniques (PLS
and PCR) employ data that is organized as matrices either as a row vector or column vector.
The pure component mixtures were then prepared by mixing known amount of ITRA with
TERB vice versa. In different varied proportions used in order to verify the precision of the
method for analysis of such mixtures and matching the commercial multi-drugs with those
having the same or approximately comparable concentrations. Composition of calibration
samples for PLS and PCR were given in Table.
Table 5.1: Composition of calibration for multivariate analysis in µg/ml.
Set 1
Set 2
Set 3
Set 4
Set 5
Set 6
Set 7
Set 8
ITR
TER
ITR
TER
ITR
TER
ITR
TER
ITR
TER
ITR
TER
ITR
TER
ITR
TER
0
0
0
1
0
3
0
5
0
7
0
9
0
11
0
13
1
0
1
1
1
3
1
5
1
7
1
9
1
11
1
13
2
0
2
1
2
3
2
5
2
7
2
9
2
11
2
13
3
0
3
1
3
3
3
5
3
7
3
9
3
11
3
13
4
0
4
1
4
3
4
5
4
7
4
9
4
11
4
13
5
0
5
1
5
3
5
5
5
7
5
9
5
11
5
13
6
0
6
1
6
3
6
5
6
7
6
9
6
11
6
13
7
0
7
1
7
3
7
5
7
7
7
9
7
11
7
13

Bikkasani. World Journal of Pharmaceutical Research
www.wjpr.net │ Vol 10, Issue 4, 2021. │ ISO 9001:2015 Certified Journal │
1436
5.2.4. Data processing
Data were processed on computer equipped with essential statistical program for PLS and
PCR calculations. Multivariate calibration techniques are then used to construct a
mathematical model (calibration model) that relates the multivariate response (spectrum) to
the concentration of the analyte of interest, and such model can be used to effectively predict
“unknown” Y- values from the measurements of new X- variables.
5.2.5. Validation of the chemometric methods
Precision
The intra-day, inter-day, analyst to analyst variation, reproducibility of the method and
accuracy were determined by assaying one sample with ITR (10 µg/ml) and TER (20 µg/ml)
in replicates (n=6) for each drug for the applicability of proposed chemometric methods.
Precision is reported as percent relative standard deviation (%RSD). Intermediate precision
expresses within the laboratory variations: different days and different analysts. The
procedure followed for the method precision was repeated on two different days, and by two
different analysts. Six sets of standard solution each containing ITR and TER for evaluation
of intermediate precision were prepared using above said concentration was analyzed six
times.
Recovery studies
To check the validity of the proposed methods (PLS and PCR), recovery studies were carried
out by standard addition technique. Appropriate volumes of the standard stock solutions of
ITR and TER at three different concentration levels of ITR 15, 20, 25 µg/ml and TER
25,30,35 µg/ml.
6. RESULTS AND DISCUSSION
6.1. Preliminary investigation of data structure in chemometric techniques
The original laboratory (experimental) observations are taken as a raw data and well
tabulated systematically for software analysis like mathematical and statistical purpose. The
pure ITR and TER data are tabulated, discussed and analyzed first (calibration). Eventually
the dosage form (commercial) mixture is analyzed (prediction). Subsequently various graphs
are sketched from the tabulated data using software such as MS-Excel and Design Expert
11.1 software. These preliminary graphs may help us in reaching a final conclusion about the
data structure and the proper selection of the used analytical method.
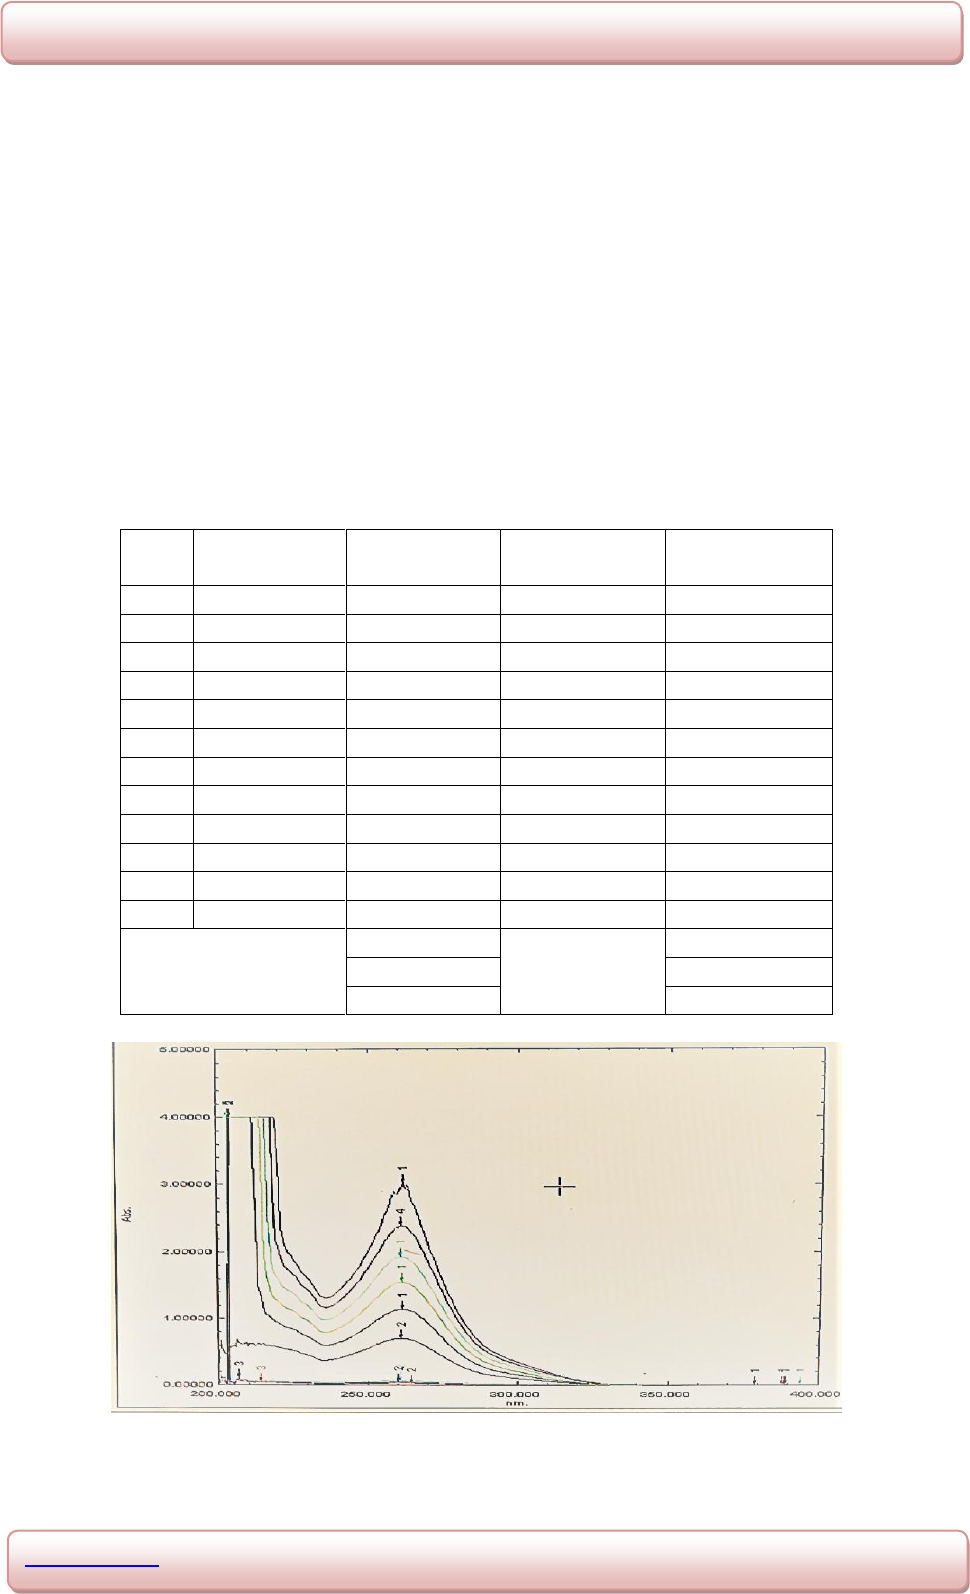
Bikkasani. World Journal of Pharmaceutical Research
www.wjpr.net │ Vol 10, Issue 4, 2021. │ ISO 9001:2015 Certified Journal │
1437
Overlay plots of the given spectra
This will make apparent gross outliners and clear clusters in the given responses (absorption
in our case) Figure.6.1 & 6.2 represent the overlay plots for the standard compounds (ITR
and TER respectively) at different concentration levels.
From the two graphs, one can readily observe that no obvious studied overlapping and/ or
crossing of spectra lines are observed. The lowest concentration is at the top outside with
longest amplitude. A calibration curve was plotted for absorbance versus concentration (ITR:
2-30 µg/ml; TER: 2-45 µg/ml) shown in figure.6.4 & 6.5
Table 6.1: Linearity table for ITR & TER.
S. no
Conc of ITR
(µg/ml)
Absorbance
Conc of TER
(µg/ml)
Absorbance
1
2
0.295
2
0.342
2
4
0.375
4
0.578
3
6
0.448
6
0.614
4
8
0.525
8
0.939
5
10
0.596
10
1.006
6
15
0.86
15
1.395
7
20
1.114
20
1.794
8
25
1.369
25
2.171
9
30
1.576
30
2.558
10
-
-
35
2.871
11
-
-
40
3.23
12
-
-
45
3.661
Slope
LOD
LOQ
0.047
0.075
0.622857
0.305492
1.88744
0.92573
Figure 6.1: Overlay absorption curves of Itraconazole in calibration range (2-35 µg/ml).

Bikkasani. World Journal of Pharmaceutical Research
www.wjpr.net │ Vol 10, Issue 4, 2021. │ ISO 9001:2015 Certified Journal │
1438
Figure 6.2: Overlay absorption of Terbinafine in the calibration range (2-45 µg/ml).
Figure 6.3: Isobestic point of the absorption curves of Itraconazole and Teerbinafine
(20µg/ml).
Figure 6.4: Linearity graph for Itraconazole (2-35 µg/ml).

Bikkasani. World Journal of Pharmaceutical Research
www.wjpr.net │ Vol 10, Issue 4, 2021. │ ISO 9001:2015 Certified Journal │
1439
Figure 6.5: Linearity graph for Terbinafine (2-45 µg/ml).
Statistical analysis
6.2. Surface response methodology
Surface response method is used to determine the relationship between dependent and
independent variables.
Statistical optimization was performed using Design Expert-11.1 software.
According to 3
2
experimental designs, over view of the experimental trial and observed
responses.
Method of experiment
Experimental design 3
2
(two-factor and three-level) factorial design was employed for
namely, ITR (A), TER (B), as prime selected independent variables (factors), which were
varied at three levels (low, middle and high concentrations). Different trial concentrations of
ITR and TER were prepared based on the trial proposal of 3
2
factorial designs. The
combination chart for all proposed trial and investigation as dependent variable (responses).
Design-Expert 11.1 software (Stat-Ease Inc., USA) was used for generation and evaluation of
the statistical experimental design by surface response method (screenshots shown in the
Figure.6.6) the matrix of the design including investigated factors and responses is shown in
Table 6.2.

Bikkasani. World Journal of Pharmaceutical Research
www.wjpr.net │ Vol 10, Issue 4, 2021. │ ISO 9001:2015 Certified Journal │
1440
Table 6.2: 3
2
factorial design and their observed response values with combination of
Itraconazole and Terbinafine.
Where; -1= low concentration of ITR and TER (2, 2 µg/ml); 0= middle concentration of ITR
and TER (10, 10 µg/ml); 1= high concentration of ITR and TER (20, 20 µg/ml)
The effect of various independent variables upon measured responses were modeled using
following mathematical model equation involving independent variables and their
interactions for various measured responses generated by 3
2
factorial design was given in
Table.6.3. 2D and 3D were shown in
Figure 6.6: Screen shot for design expert software.

Bikkasani. World Journal of Pharmaceutical Research
www.wjpr.net │ Vol 10, Issue 4, 2021. │ ISO 9001:2015 Certified Journal │
1441
Figure.6.7: 2D plot with respect to terbinafine.
Pale blue color indicates low absorption, whereas orange color indicates higher absorption.
Figure.6.8: 3D plots with respect to Terbinafine.

Bikkasani. World Journal of Pharmaceutical Research
www.wjpr.net │ Vol 10, Issue 4, 2021. │ ISO 9001:2015 Certified Journal │
1442
Figure 6.9: 2D plots with respect to Itraconazole.
Pale blue color indicates low absorption, whereas orange color indicates higher
concentration.
Figure.6.10: 3D plots with respect to itraconazole.
The effect of various independent variables upon measured responses were modeled using
following mathematical model equation involving independent variables and their
interactions for various measured responses generated by 3
2
factorial responses.

Bikkasani. World Journal of Pharmaceutical Research
www.wjpr.net │ Vol 10, Issue 4, 2021. │ ISO 9001:2015 Certified Journal │
1443
Table 6.3: Response surface model values obtained by design expert software.
Response
Equation model
Adjusted R
2
Predicted R
2
C.V
R1 (ITR)
0.1103+0.0764A+0.0138B
0.9954
0.9930
5.32
R2 (TER)
0.157754-
0.014255A+0.147563B+0.00
1560AB-
0.001656A
2
+0.011189B
2
0.9984
0.9953
3.24
Where A= Absorbance of ITR ; B= Absorbance of TER
General conclusion
Using surface response methodology by Design-Expert 11.1, the method is found to show
significant relationship between independent and dependent variables using the given
concentrations.
6.3. Calibration step
The purpose of the calibration step is to make a standard relationship between the response
(absorbance) and concentration. The absorbencies of well-known concentrations is measured
at wide range of wavelengths (200-400 nm).
It is clear that the relationship to be set will strongly help to predict the concentration of
unknown analyte to be analyzed. In a univariate case we may take one Y (response
component) for each X value (concentration ingredient). Unlike to this in case many Y
components that measured under the same conditions for many X values are treated. In this
process, to attain the suitable calibration for the entire data (matrix) many steps are followed.
Finally the efficiency of the calibration step is tested and the precision of determinations will
be seen.
The calibration is done for pure ITR and TER. In all the cases about 10 rows and about 200
column matrices are used. The calibration step done by using zero order absorbencies. Thus
the steps to be followed are the same in all studied compounds. Overlay plot of all samples
containing mixture of Itraconazole and Terbinafine in various concentrations [ITR (2-
35µg/ml) TER (2-45µg/ml)].
Principle component regression (PCR) method
In the basic concepts of the PCR are presented, for the original data of absorbances (A) and
concentrations (C) of analytes the mean-centering denoted by A
O
and C
O
, were calculated.
The next step is to calculate the covariance dispersion matrix of the centered A
o
. After that

Bikkasani. World Journal of Pharmaceutical Research
www.wjpr.net │ Vol 10, Issue 4, 2021. │ ISO 9001:2015 Certified Journal │
1444
the normalized eigenvalues and eigenvectors were calculated by using the square covariance
matrix. The number of the optimal eigenvectors is obtained by using the highest values of the
eigenvalues. The final PCR calibration equation is used for the prediction of analytes in
samples.
Partial least square (PLS) method
The PLS calibration method is done by the composition of both concentration and absorbance
matrix into latent variables,
A = TP
T
+ E and C = UQ
T
+ F
The vector b is given as,
b = W (P
T
W)
-1
Q ,
where W represent a weight matrix.
The next step is to use the linear regression
C = a+b x A,
Where the constant has the form
a = C
mean
– A
T
mean x b
Figure 6.11: Overlay plot of all samples containing mixture of Itraconazole and
Terbinafine in various concentrations (ITR (2-35µg/ml) TER (2-45µg/ml)).
In the techniques, calibration or regression was obtained by using the absorbance data matrix
and concentration data matrix for prediction of the unknown concentrations of ITR and TER
in the binary mixtures and pharmaceutical formulations.

Bikkasani. World Journal of Pharmaceutical Research
www.wjpr.net │ Vol 10, Issue 4, 2021. │ ISO 9001:2015 Certified Journal │
1445
The predictive ability of a model can be defined in various ways, the screenshots of
Unscrambler 10.4X are given in Figure.6.11. The most general expression is the standard
error of prediction (SEP) which is given by the following equation,
SEP =
Where, is the added concentration of drug
is the predicted concentration of drug
N is the total number of synthetic mixtures
In order to test the proposed techniques, the sets of synthetic mixtures containing the two
drugs in variable composition were prepared. The results obtained in the application of PLS
and PCR methods to the same binary mixture are indicated in table.6.4.and assay results for
the commercial preparations are given in table.6.5.
In the table.6.6.r
2
is defined as the correlation between constituent concentrations and shows
the absorbance effects relating to the constituents of interest. The obtained r values in the
methods are close to 1, this means no interference is coming from the other constituents in
this set of synthetic mixtures.
Another statistical value is the standard error of calibration (SEC) and the calculation of this
value realized by using following equation.
SEP =
Where, is the added concentration of drug
is the predicted concentration of drug
n is the total number of synthetic mixtures and
p is the number of components in the mixtures
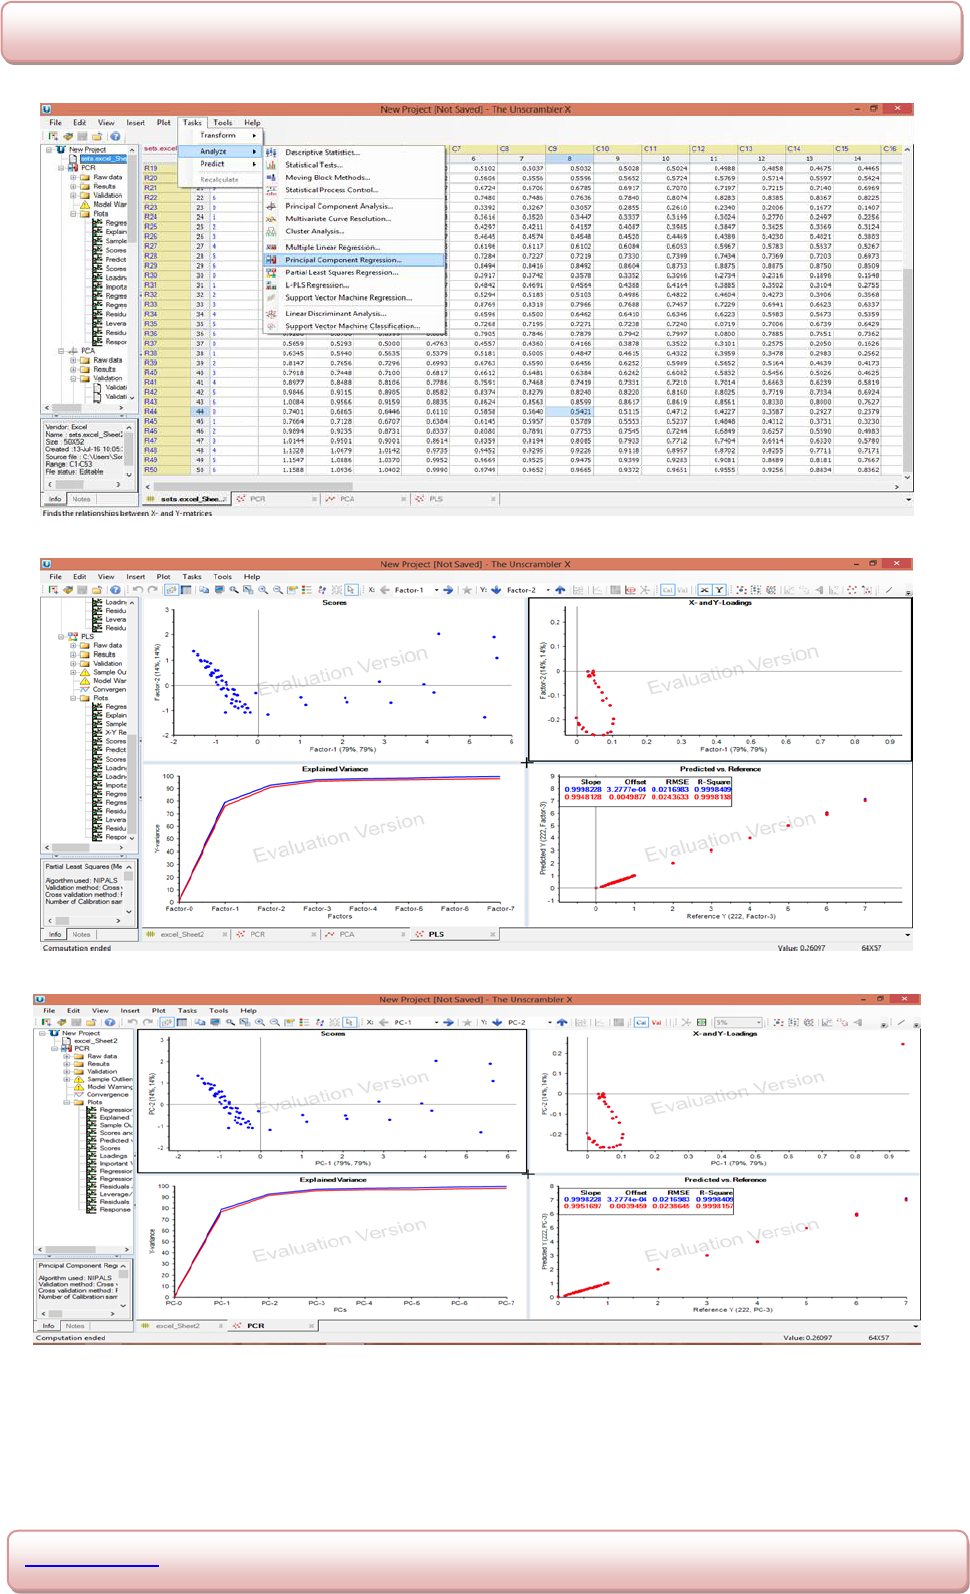
Bikkasani. World Journal of Pharmaceutical Research
www.wjpr.net │ Vol 10, Issue 4, 2021. │ ISO 9001:2015 Certified Journal │
1446
Figure 6.12: Screen shots of Unscrambler 10.4X used for chemometric analysis.

Bikkasani. World Journal of Pharmaceutical Research
www.wjpr.net │ Vol 10, Issue 4, 2021. │ ISO 9001:2015 Certified Journal │
1447
Table 6.4: Summary of statistics in PLS and PCR methods for ITR and TER in the
mixture.
Drug
ITR
TER
RMSEP
RMSEC
R
2
Intercept
Slope
PLS
PCR
PLS
PCR
PLS
PCR
PLS
PCR
PLS
PCR
0.482
0.496
0.495
0.426
0.495
0.433
0.275
0.426
0.998
0.997
0.985
0.992
0.099
0.221
0.094
0.225
0.987
0.952
0.969
0.964
Table 6.5: Assay results for commercial preparation.
Formulation
PLS
PCR
mg/tab found
%purity
mg/tablet found
%purity
ITR
TER
494.62
491.54
98.924
98.308
492.29
490.26
98.658
98.052
Validation of the chemometric methods
Precision
The method precision of the PLS method is expressed as %RSD and it is found to be 0.4460
for ITR and 0.114 for TER, results are tabulated in the Table 6.6. The PCR method precision
is expressed as %RSD and it is found to be 0.3791 and 0.114 for ITR and TER respectively.
The intraday and interday precision was tested for the applicability of proposed chemometric
methods. The results were found to be less than 2.0
Table 6.6: Precision data.
S. no
Itraconazole
Terbinafine
PLS
PCR
PLS
PCR
1
2
3
4
5
6
4.92
4.9
4.95
4.9
4.92
4.95
4.15
4.9
4.93
4.9
4.93
4.85
11.93
11.91
11.94
11.94
11.91
11.93
11.94
11.92
11.9
11.9
11.92
11.94
Mean
SD
%RSD
4.923
0.022
0.4460
4.906
0.0186
0.3791
11.926
0.0136
0.114
11.923
0.0136
0.114
Recovery studies
To check the validity of the proposed methods (PLS and PCR), recovery studies were carried
out by standard addition technique was used to observe the selectivity of the proposed
chemometric methods. Appropriate volumes of the standard stock solutions of ITR and TER
at three different concentration levels were added to the tablet solutions, respectively. This
procedure was repeated six times for each concentration level. The recovery results, standard
deviations and relative standard deviations were calculated and illustrated in Table 6.7

Bikkasani. World Journal of Pharmaceutical Research
www.wjpr.net │ Vol 10, Issue 4, 2021. │ ISO 9001:2015 Certified Journal │
1448
Table 6.7: Recovery studies.
Itraconazole Terbinafine
% of
Target
AA
PLS PCR
AA
PLS PCR
80
100
120
Mean
SD
%RSD
4
4
4
5
5
5
6
6
6
AF
%R
AF
%R
4
4
4
5
5
5
6
6
6
AF
%R
AF
%R
3.93
4.01
3.96
4.93
4.94
4.91
5.96
5.98
5.94
98.2
100.2
99.0
98.6
98.8
98.2
99.3
99.6
99.0
3.92
3.98
3.95
4.96
4.93
4.95
5.94
5.95
5.92
98
99.5
98.7
99.2
98.6
99.0
99
99.16
98.6
3.93
3.91
3.90
4.98
4.95
5.01
5.82
5.91
6.01
98.5
98.2
98
99.6
99.2
100.1
99.1
99.4
100.1
3.95
3.92
3.91
4.97
4.95
5.01
5.99
5.82
6.01
99.5
99.1
99.0
99.8
99.2
100
99.9
98
100
98.9
0.645
0.656
98.86
0.441
0.446
99.35
1.12
1.127
99.38
0.650
0.654
AA=Amount added; AF =Amount found; %R = Percentage recovery; %RSD=Relative
standard deviation
SUMMARY AND CONCLUSION
The contents of several pure component mixtures and commercial dosage forms were
simultaneously determined using chemometric assisted UV-spectrophotometric
measurements together with PLS and PCR calibration analysis.
Significant relationship of responses was found for the given concentrations using Design
Expert software 11.1 version.
Good recoveries were found for pure Itraconazole in the range of 2-35 µg/ml in
combination with Terbinafine. While Terbinafine showed good recovery in the range of
2-45 µg/ml.
Both the PLS and PCR are sufficiently good method for analysis of individual
compounds and their binary mixtures with satisfactory recovery in commercial
formulation. Hence, they can be applied for simultaneous determination of Itraconazole
and Terbinafine.
Chemometric algorithms, in combination with modern computer technologies and rapid
spectroscopic analysis, provide the basis for the modern-day development methods of
chemical analysis that are fast, simple to use and environmentally friendly.
Chemometry is a growing field with huge gains in quality and cost reduction for
development of pharmaceutical formulations.

Bikkasani. World Journal of Pharmaceutical Research
www.wjpr.net │ Vol 10, Issue 4, 2021. │ ISO 9001:2015 Certified Journal │
1449
ACKNOWLEDGEMENT
It is a moment of gratification and pride to look back with sense of contentment at the long
travelled path, to be able to recapture some of the fine moments, to be able to think infinite
number of people, some who were with me from the beginning, some who joined with me at
some stage during the journey whose kindness, love and blessing has brought this day. I wish
to thank each one of them with all my heart.
Among them there are two persons to whom I am grateful indebted and delighted to express
my gratitude for the successful completion of this thesis.
My heartfelt gratitude and respect to my esteemed teacher and research supervisor
Dr.K.Srinivas Reddy Associate Professor, Department of Pharmaceutical Analysis, Vaagdevi
college of Pharmacy, Ramnagar, Hanmakonda. Whose inspiring support, valuable
suggestions, confidence, constant motivation and guidance made me to complete this project
successfully.
It is a great affection and appreciation I acknowledge my esteemed teacher and research
supervisor Dr.K.Praveen Kumar, Associate professor, Department of Pharmaceutical
Analysis, for his keen interest in my work and constant co-operation.
Am grateful to Dr.C.Srinivas Reddy, Principal, Vaagdevi college of Pharmacy, Ramnagar,
Hanmakonda. Whose encouragement, constant support, dynamic approach boosted me
morally, which helped me to a very great extent in completion of my dissertation.
My humble thanks to Mr.Nagaraju, and supporting staff of Vaagdevi college of Pharmacy for
their kind cooperation.
Special thanks to Dr.Y.Sravan Kumar, Head, Department of Pharmaceutics for providing the
active pharmaceutical ingredients.
I express my humble thanks to my friends Shiva Ranjani, Sindhu, Aishwarya Kiron, Mounika
and senior Ravindar Reddy for their support at the time when I needed in doing my project
work.
I owe a special dept to my father, mother Sri&Smt Bikkasani.Ramesh Chowdary&Ahalya for
their encouragement and love that served as a soure of inspiration, strength and determination

Bikkasani. World Journal of Pharmaceutical Research
www.wjpr.net │ Vol 10, Issue 4, 2021. │ ISO 9001:2015 Certified Journal │
1450
at each and every front of my life to transport my dreams into reality. And also sincere thanks
to my beloved brother Mahesh chowdary for the emotional and healthy support which has
strengthened me.
REFERENCES
1. Fifield F.W, Kealey. D Principles and practice of analytical chemistry. Blackie Academic
and Professional. UK, 1995; 367.
2. Souza K.V, Peralta P.Z Spectrophotometric determination of phenols in the presence of
congeners by multivariate calibration, Analytica Chemica Acta, 2001; 348: 1-9.
3. Gindy A.E Spectrophotometric and LC determination of two binary mixtures containing
pyridoxine hydrochloride, Journal of pharmaceutical and biomedical analysis, 2003; 32:
277-286.
4. Pitor S. Application of chemometric techniques in analytical evaluation of biological and
environmental samples. Alija Generala Jozefa Hallera, 2005; 106: 80-416.
5. Fifield F.W, Kealey. D Principles and practice of analytical chemistry. Blackie Academic
and Professional. UK, 1995; 367.
6. Remington The science and practice of pharmacy, 2016; 21: 67-82.
7. Satoshkar R, Bandarkar S Pharmacology and pharmacotherapeutics, popular prakashan,
Mumbai, 1996; 15: 52-61.
8. Sethi P.D. Quantitative analysis of pharmaceutical formulation, CBS publishers and
Distributers, New Delhi, 2001; 1: 7-22, 38-43, 70, 94-105.
9. Beckett AH and Stenlake JB. Practical pharmaceutical chemistry, CBS publishers and
distributors, New Delhi, 2007; 4: 115-169.
10. Skoog M, Thomson A. Principles of instrumental analysis, 2007; 2: 169-173.
11. Beckett AH and Stenlake JB. Practical pharmaceutical chemistry, CBS publishers and
distributors, New Delhi, 2007; 4: 115-169.
12. http;//www.tissuegroup.chem.vt.edu/chem..ed/spec/uv/vis/graphics/spectrophotometer1gif
(25-06-2019, 10.00 am).
13. Sharma BK. Text book of instrumental methods of chemical analysis, 5: 149-159.
14. Basett J, Denny RC. Vogel’s text book of quantitative inorganic analysis, London, 4th
edition, 1986; 29-37.
15. Gurudeep Chatwal. Instrumental methods of chemical analysis, Himalaya publishing
house, Delhi, 1999; 2.108-2.113, 2.21, 2.150-2.153, 2.157-2.158, 2.168-2.173.

Bikkasani. World Journal of Pharmaceutical Research
www.wjpr.net │ Vol 10, Issue 4, 2021. │ ISO 9001:2015 Certified Journal │
1451
16. Miguel V. Principles of analytical chemistry a text book, Spinger International edition,
2000; 2: 14-16.
17. Buchner J, Keifhaber T. Book reviews, International Journal of Biological
Macromolecules, 2007; 41: 120-124.
18. Bezzera M, Santelli R. Response surface Methodology as a tool for Optimization in
Analytical Chemistry, Talanta, 2008; 76(5): 965-977.
19. Aguilera A, Escabis M. Functional analysis of chemometric data, Open journal of
statistics, 2013; 334-343.
20. Esteban M, Arino C. Chemometrics for the Analysis of Volumetric Data, Trends in
Analytical Chemistry, 2006; 25: 86-92.
21. Emilio CA, Magallanesa J.F. Chemometric study on the TiO
2
-Photocatalytic
Degradiation of Nitroaceticacid. Analytica Chemical Act, 2007; 89-97.
22. Yongnia N, Caoa D. Simultaneous Enzymatic kinetic Determination of Sticides,
Carbonyl and Phoxim, within the aid of Chemometrics, Analytica Chimica Acta, 2007;
588: 131-139.
23. Roggo Y, Chalus P. A review of Near Infrared Spectroscopy and Chemometrics in
Pharmaceutical Technologies, Journal of Pharamaceutical and Biomedical Analysis,
2007; 595: 89-97.
24. Alcantaraa G.B, Hondab N.K. Chemometric Analysis applied in 1H HR-MAS NMR and
FT-IR data for chemotaxonomic distinction of intact Lichen samples, Analytica Chimica
Acta, 2007; 595: 3-8.
25. Daszykowski M, Walczak B. Use and abuse of Chemometrics in Chromatography,
Trends in Analytical chemistry, 2006; 25: 1086-1096.
26. Khan and Khanum. A text book of Fundamentals of biostatistics, Ukaaz publications
Student edition, 401-465.
27. Mevik BJ, Ron Wehrens. Principal Component and Partial Least Squares Regression,
Journal of Statistical Software, 2007; 18(2): 1-24.
28. Richard G.A. Textbook of Chemometrics Data Analysis for the laboratory.
29. Rao G.N, Tiwari N.K. Biostatistics and computer applications, 2011; 80, 114, 129:
130-142.
30. Mahajan B.K. Methods in Biostatistics, 1997; 6: 168, 186, 152-155.
31. Gopala Krishna Murthy T.E, Srinivas Babu P, Seshagiri Rao P. Pharmaceutical Statistics,
2014; 118-340.
32. Dr.Vinod Kumar bais. Research and Methodology and Biostatistics, 2018; 98-169.

Bikkasani. World Journal of Pharmaceutical Research
www.wjpr.net │ Vol 10, Issue 4, 2021. │ ISO 9001:2015 Certified Journal │
1452
33. Sai Subramanaian. Biostatistics, 2008; 1: 53-149.
34. Helmut G, Alex W. Hand book of Analytical Techniques. Wiley-VCH, 2001; 1: 251-257.
35. Ibric S, Djuric Z. Computer aided applications in Pharmaceutical Technology, 2013;
31-56.
36. Howard M. Understanding Chemometrics for Pharmaceutical Analysis. Pharmaceutical
Manufacturing, 2007; 1-2.
37. Dongsheng Bu. Spectroscopy and Analyzing Spectroscopy Data. Pharmaceutical
manufacturing, 2005; 1-2.
38. Gabrielsson J, Lindberg N.O. Multivariate methods in Pharmaceutical Applications,
Journal of Chemometrics, 2002; 16(3): 141-160.
39. Bro R. Multivariate calibration. What is Chemometrics for the Analytical Chemist?
Analytic Chimica Acta, 2003; 500: 185-194.
40. Faber N.M. Notes on two competing Definitions of Multivariate Sensitivity, Analytica
Chimica acta, 1999; 381: 103-109.
41. Peter F, Sven S. Robust Multivariate Methods in Chemometrics, Department of
Chemistry, University of Antwerp, 2003; 5-51.
42. Workman J,& Berry L. Chemometrics and its application in Pharmaceutical Prospects,
Chemometrics in Spectroscopy, 2005; 20(9): 26-35.
43. Dinc E & Ustung O. Chemometric Resolution of a mixture containing
Hydrochlorothiazide and Amiloride by absorption and Derivative Spectrophotometry,
Journal of Pharmaceutical and Biomedical Analysis, 2002; 29: 371-379.
44. Tan H & B rown S.D. Multivariate calibration of spectral Data Using Dual Domain
Regression Analysis, Analytica Chinica Acta, 2003; 400: 399-412.
45. Fatal B.S and MacGregor J.H. Improved PLS Algorithms, Journal of Chemometrics,
1997; 11: 73-85.
46. Lindgren F, Geladi P. The Kernel algorithm for PLS, Journal of Chemometrics, 1993;
45-59.
47. Booksha K.S, Kowalski B.R. Calibration method choice by comparison of model basic
functions to the theoretical instrumental Response function, Analytica Chimica Acta,
1997; 348: 1-9.
48. Pawan H, Swathi R.K. Chemometrics and it’s application in pharmaceutical field.
Journal of Physical Chemistry and Biophysics, 2014; 4(6): 4-6.

Bikkasani. World Journal of Pharmaceutical Research
www.wjpr.net │ Vol 10, Issue 4, 2021. │ ISO 9001:2015 Certified Journal │
1453
49. Amira Kamal, Samah El-Malla. A Review on Spectrophotometric methods for
Simultaneous Multicomponent Analysis, European Journal of Pharmaceutical and
Medical Research, 2016; 2(3): 348-360.
50. Phechkrajang C.M, Wilarat P. Academic Sciences, International Journal of Pharmacy
and Pharmaceutical sciences, 2012; 4: 18-21.
51. Parixit Rohitbhai P, Deepika R. Chemometrics and its Applications in UV
Spectrophotometry, International Journal of Pharmaceutical Chemistry and Analysis,
2016; 3(1): 43-48.
52. The USP 34 NF 29, 2011; 2: 3232-3233.
53. The USP 34 NF 29, 2011; 3: 4362-4366.
54. Collin Dollery. Therapeutic Drugs, 1999; 2(2): I120-I126, T41-T45.
55. Mosby’s Drug consult, Elsevier Mosby, 2006; II 1653-1663, II 2743-2746.
56. Poonam A. Salunke, Kamlesh Ingale. UV-Visible Spectrophotometric Method
Development and Validation of Itraconazole in Bulk and Capsule Formulation,
International Journal of Advances in Pharmaceutical Analysis, 2016; 6: 4.
57. Soundarya G, Venkateswara Rao P. Method Development and Analytical method
Validation of Itraconazole by using UV- Visible Spectrophotometry, Indo American
Journal of Pharmaceutical Sciences, 2016; 3(5): 487-491.
58. Koteswara Rao M, Ramanjaneyulu K.V. Method Development and Validation of
Itraconazole by UV-Spectrophotometer, World Journal of Pharmaceutical Sciences,
2014; 3(10): 777-787.
59. Sahoo S.K, Anusa G. First derivative UV method development and validation of
Itraconazole in its Bulk and Dosage form, Inventi Rapid - Pharm Analysis & Quality
Assurance, 2011; 3: 324-328.
60. Shalin K. Parikh, Ankit D. Development and validation of UV spectrophotometric
method for the estimation Itraconazole bulk drug and pharmaceutical formulation,
International Journal of Drug and Research, 2010; 3(2): 324-328.
61. Basavaiah K, Vamsi Krishna P. Analytical methods for determination of Terbinafine
hydrochloride in pharmaceuticals and biological materials, Journal of Pharmaceutical
Analysis, 2016; 6(3): 137-149.
62. Basavaiah K, Vamsi Krishna P. Stability Indicating UV-Spectrophotometric Assay Of
Terbinafine Hydrochloride In Dosage Forms, International Journal of ChemTech
Research, 2013; 5(5): 2645-2655.

Bikkasani. World Journal of Pharmaceutical Research
www.wjpr.net │ Vol 10, Issue 4, 2021. │ ISO 9001:2015 Certified Journal │
1454
63. Krupa K, Bhavna H. Marya. Spectrophotometric determination and validation for
Terbinafine HCL in pure and tablet dosage form, Scholars Research Library, 2012; 4(4):
1119-1122.
64. Pritam S Jain, Amar Chaudhari J. Development and validation of the UV-
spectrophotometric method for determination of Terbinafine hydrochloride in bulk and in
formulation, Pharmaceutical Method, 2011; 2(3): 198-205.
65. Eticha T, Getu Kahsay. Chemometric-Assisted Spectrophotometric method for the
simultaneous determination of Ciprofloxacin and DoxycyclineHyclate in pharmaceutical
formulations, Journal of Analytical Methods in Chemistry, 2018.
66. Umang H. Shah, Ankita H. Jasani. Chemometric Assisted Spectrophotometric methods
for simultaneous determination of Paracetamol and Tolperisone Hydrochloride in
pharmaceutical dosage Form, Eurasian Journal of Analytical Chemistry, 2017; 12(3):
211-222.
