
ISSN(Online) : 2319-8753
ISSN (Print) : 2347-6710
International Journal of Innovative Research in Science,
Engineering and Technology
(An ISO 3297: 2007 Certified Organization)
Website: www.ijirset.com
Vol. 6, Issue 7, July 2017
Copyright to IJIRSET DOI:10.15680/IJIRSET.2017.0607022 12620
Heat and Mass Transfer in Food Engineering
Kirti Bhushan Zare
1
, Dr.Utkarsh Maheshwari
2
, D.P.Deshpande
3
, Pankaj Vardhe
4
Dept. of Chemical Engineering, Dr.D.Y.Patil Institute of Engineering Management and Research, Akurdi,
Pune, India
,2,3,4
ABSTRACT: Heat transfer in food processing is simultaneous heat and mass transfer in drying and frying, free
convection heat transfer in thermal sterilization of cans, and phase change in freezing and thawing. Air drying, freeze
drying, spray drying, and steam drying are accompanied by moisture transfer, which also undergoes phase change
(evaporation). Heat transfer, together with moisture and vapor transfer, controls these processes. There is a need for
deeper qualitative and quantitative understanding of the heat and mass transfer mechanisms underlying various
techniques for food production, processing, preservation and storage. Several classes of food-processing problems are
presented where advances can be made on the basis of improved understanding of heat and mass transfer mechanisms.
This is important for the development of new food sources, for more economical and energy-efficient processing of
food from existing sources, for better food quality and quality control, and for adherence to new regulations.Microwave
(MW) drying is a rapid dehydration technique that can be applied to specific foods increasing concerns over product
quality and production costs have motivated the researchers to investigate and the industry to adopt microwave drying
technology.
KEYWORDS: Heat transfer, mass transfer, food processes, microwave drying.
I.INTRODUCTION
1.1 Heat Transfer Principles:Air during retort come-up and for draining (D), outlet ports for venting the retort at the
end of thecycle (C), and a safety and pressure relief valve (F). A pocket for instruments, a thermometer, temperature-
recording probe, and a pressure gauge is located on the side of the vessel. The operating cycle of this type of a retort
involves bringing the retort up to a temperature of around 121◦C. Steam is then allowed to pass through the vessel so
that all air in the retort and between the cans is removed (venting) before the retort is finally brought up to the operating
pressure and processing temperature . At the end of the processing time, the steam is turned off, and a mixture of
cooling water and air is introduced into the retort to cool the cans. The purpose of the air is to maintain the pressure in
the retort, following the condensation of the residual steam after the initial introduction of cooling water. The
containers may deform because of the pressure difference between inside and outside of the container if this pressure is
not maintained.
The recent focus on thermal sterilization of foods is to improve the rates of heating, in order to increase production
rates and minimize damage to product quality.In most applications these two types of heat transfer occur
simultaneously, but one type may be more important than the other. Steady-state heat transfer takes place when there is
no change in temperature with time.
1.2. Unsteady-State Heat Conduction: In food processing, there are many situations where temperature is a function
of time. The calculations of unsteady-state heat transfer are usually complicated and involve solving the Fourier
equation, written in terms of the partial differential equation in three dimensions. In unsteady-state heat transfer, the
temperature within a food during processing depends on the time and position. The temperature changes are influenced
by
1. the initial temperatures of the heated body
2. the temperature of the heating medium
3. the surface heat transfer coefficient (heat transfer coefficient at all interfaces as well as whereconvection is involved)
4. the thermal conductivity, specific heat, and density of the food and their variation withtemperature and composition

ISSN(Online) : 2319-8753
ISSN (Print) : 2347-6710
International Journal of Innovative Research in Science,
Engineering and Technology
(An ISO 3297: 2007 Certified Organization)
Website: www.ijirset.com
Vol. 6, Issue 7, July 2017
Copyright to IJIRSET DOI:10.15680/IJIRSET.2017.0607022 12621
The basic equation for unsteady-state heat conduction in one-space dimension (x) is
--------------------------------------------------------------------------------------------------(1)
where ∂T/∂t is the change of temperature with time, ρ is the density (kg m−3), Cp is the specific heat capacity (J
kg−1K−1), and k is the thermal conductivity (W m−1K−1).
When a solid piece of food is heated or cooled by a fluid, the resistance to heat transfer is mainly controlled by the
surface heat transfer coefficient (h) and the thermal conductivity of the food (k)
[1]
These two factors are related by the Biot number (Bi):
-----------------------------------------------------------------------------------------------------------(2)
where δ is the characteristic dimension or heat transfer path length in the solid (m). At small Bi values (>0.2), the
surface film is the main resistance to heat flow; in this case, the assumption of anegligible internal (conductive) heat
transfer resistance in the solid food is valid .However, in most applications the thermal conductivity of the food limits
the rate of heat transfer (Bi >1).
[2]
1.3. Free Convection
When a fluid’s temperature changes, the resulting changes in density establish natural convection currents, which occur
as a result of bulk movement of the fluid, such as the movement of liquid inside a can during sterilization. Obviously,
heat transfer by conduction occurs simultaneously but is generally negligible compared to convection heat transfer
(Karl et al., 1975). The rate of convection heat transfer is governed by Newton’s law of cooling. This law states that the
rate of heat transfer by convection is directly proportional to the heat transfer area and the temperature difference
between the fluid and heating/cooling surface:
-----------------------------------------------------------------------------------------------(3)
where Q is the rate of heat transfer (W), a is the surface area (m2), Ts is the surface
temperature, Tbu is the bulk fluid temperature, and hs is the surface or film heat transfer coefficient (W m−2 K−1).
-------------------------------------------------------------(4)
where his the heat transfer coefficient at the solid liquid interface(Wm−2 K−1); dv is the characteristic dimension (m),
which may be the height or diameter of the can, as will be discussed later; k is the thermal conductivity of the fluid (W
m−1K−1); ρ is the density (kg m−3); Cp is the specific heatcapacity (J kg−1K−1); μ is the viscosity (N s m−2); g is the
acceleration due to gravity (m s−2); β is the thermal expansion coefficient (K−1); and _T is the temperature difference
(◦C).
[4]
II.RELATED WORK
2.1Thermal properties of food:Knowledge of the thermal properties of food is required in order to evaluate the heat
transfer in food products. Therefore, a composition-based prediction method was used to obtain the thermal properties
of food. The thermal properties are described by major components found in food such as: proteins, fat, carbohydrate,
fibers, ash and water/ice. The composition data is stated as mass fraction and given in [1] and [2] for different food
products such as vegetables, fruits, meat, etc. The thermo physical properties of each component are subsequently
ISSN(Online) : 2319-8753
ISSN (Print) : 2347-6710
International Journal of Innovative Research in Science,
Engineering and Technology
(An ISO 3297: 2007 Certified Organization)
Website: www.ijirset.com
Vol. 6, Issue 7, July 2017
Copyright to IJIRSET DOI:10.15680/IJIRSET.2017.0607022 12622
described by temperature dependent mathematical models in the temperature range of -40oC to 150oC. The properties
were evaluated in the global expression window in Comsol. Knowing the composition as well as the thermal properties
of the different components makes it possible to find the apparent properties of the food product. A different approach
is used for the evaluation of the properties in the unfrozen and frozen region of the food. In order to evaluate which
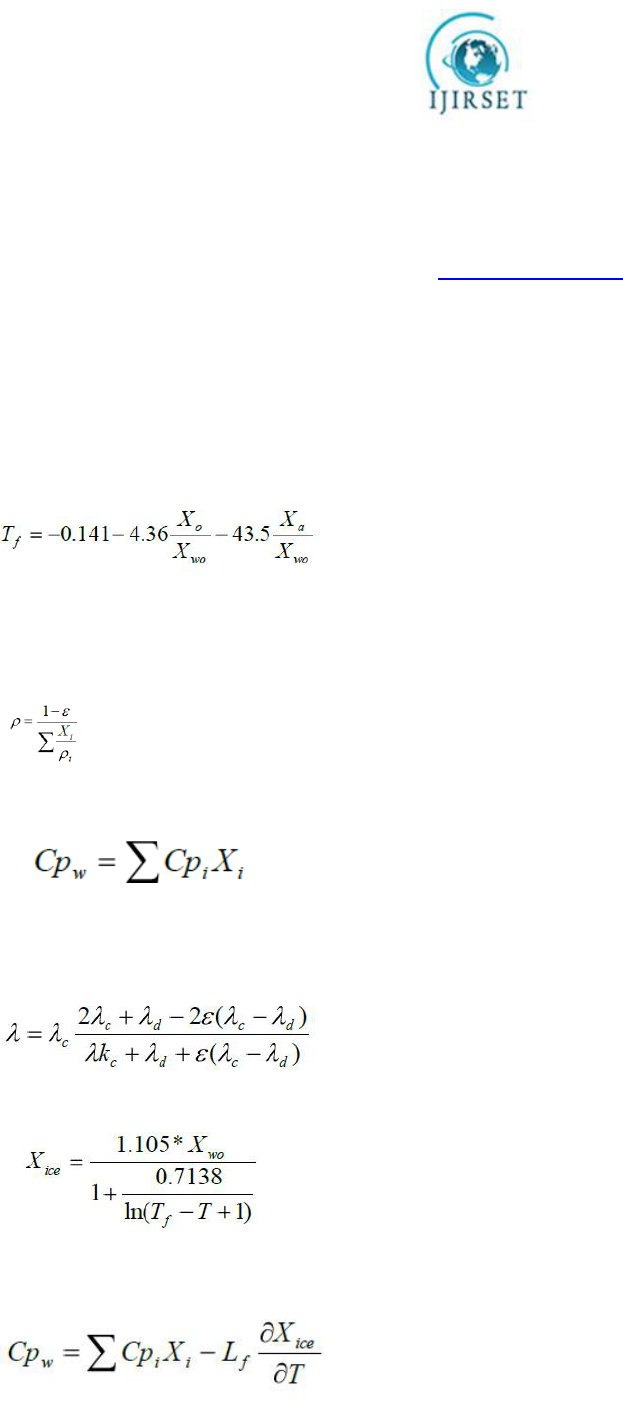
approach is to be used, determination of the initial freezing point is required. Pham Q.T. [3] has suggested the
following equation for evaluation of the initial freezing point based on the composition data of the product:
[5]
------------------------------------------(5)
Whether the temperature of the product is above or below the initial freezing point the thermal properties of the food
are calculated according to one of the following approaches:
Unfrozen food (T > Tf) The density of the food product is calculated according to the following equation:
-------------------------------------------------------------------------------------------------------(6)
The specific heat capacity in the unfrozen part of the food is obtained from the mass average of the heat capacities of
the components in the food product
------------------------------------------------------------------------------------(7)
The thermal conductivity is described by means of a Maxwell type model. The dispersed phase is air (if present) and
the continuous phase in the equation is obtained from the mass average of the conductivities of the remaining
components in the food product
[7]
--------------------------------------------------------(8)
Frozen food (T ≤ Tf) The ice fraction during freezing is determined by the
following equation given by [1]:
---------------------------------------------------------------------------------(9)
Knowing the fraction of ice, the thermal properties of the food during freezing can be obtained. The density of the food
product is calculated according to equation 2, however, now including the mass fraction of ice.
The latent heat of fusion is accommodated in the description of the
apparent specific heat of food during freezing.
----------------------------------------------------------------------(10)
Thermal conductivity is determined in two steps and is based on equation 4. First, ice is used as a dispersed phase (if
ISSN(Online) : 2319-8753
ISSN (Print) : 2347-6710
International Journal of Innovative Research in Science,
Engineering and Technology
(An ISO 3297: 2007 Certified Organization)
Website: www.ijirset.com
Vol. 6, Issue 7, July 2017
Copyright to IJIRSET DOI:10.15680/IJIRSET.2017.0607022 12623
present). Secondly, air is used as dispersed phase (if present) and continuous phase is the previously obtained
conductivity.
2.2 Heat transfer and reactions in foods:Foods are physically complex fluids and soft solids, with rheological and
material propertiesthat are time- and process-dependent and which have a natural variation. It is thus difficult tospecify
the physics in such a way as to allow accurate prediction of the process. Some safety marginis added to ensure that
every part of the material is safe.
2.3 Milk protein:Unlike tomato paste, milk deposit cannot be removed by water alone. The force required to disrupt
and remove the milk protein deposit has been measured without chemical being used and with cleaning chemical
containing 0.5 wt% NaOH, used.
2.4Cohesive and adhesive structures
It is possible, by setting the micromanipulation probe to pass above the disc, to leave deposit onthe surface. In this case
the force measured by the probe will corresponds to that required to breakthe cohesive forces between parts of the
deposit. This has been done for both types of deposit. For tomato, the force required for partial removal of the deposit
exceeds that for the total removal,
III.EXPERIMENTAL WORK
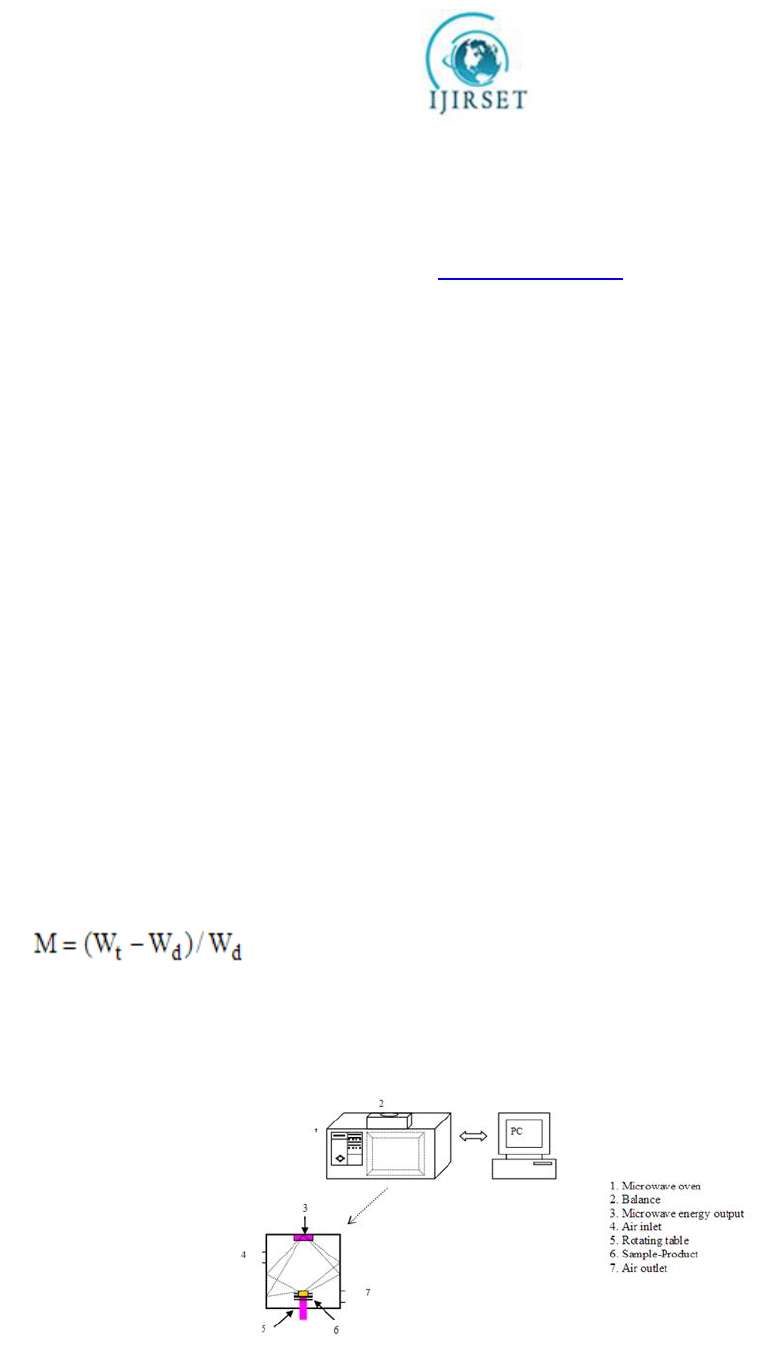
In all experiments, the microwave oven was brought to the operating temperature by heating 1000 ml of distilled water
in a glass beaker for 5 min before the first run of the day .The potato samples was placed on Petri dishes in the center of
the microwave oven cavity. Throughout the experimental run the sample weights were continuously recorded at
predetermined time intervals until no discernible difference between subsequent readings was observed. The moisture
content value was determined as
[12]
Where M is moisture content, Wt is the weight of sample (g) at any time and Wdis
the weight of the dried sample.
Figure No: 3 Microwave drying systems

ISSN(Online) : 2319-8753
ISSN (Print) : 2347-6710
International Journal of Innovative Research in Science,
Engineering and Technology
(An ISO 3297: 2007 Certified Organization)
Website: www.ijirset.com
Vol. 6, Issue 7, July 2017
Copyright to IJIRSET DOI:10.15680/IJIRSET.2017.0607022 12624
IV.RESULT AND DISCUSSION
Throughout the experimental run the sample weights were continuously recorded at regular time intervals until no
discernible difference between subsequent readings was observed.
Graph No: 4.1 Drying Curve
V. CONCLUSION
Based on the results of this study, the conclusions were drawn. Drying took place mainly in the falling rate period
followed by a constant rate period after a short heating period. The drying rate increases with increasing the microwave
power or sample diameter. An increase in slab diameter results an increase in the drying coefficient It is because of
sudden and volumetric heating, generating high pressure inside the potato samples, resulted in boiling and bubbling of
the samples.
REFERENCES
1. Barbosa-Canovas, G.V., Gongora-Nieto, M.M., & Swanson B.G. (1998). Nonthermal electrical methods in food preservation. Food Science and
Technology International, 4(5), 363–370.
2. Barbosa-Canovas, G.V., Ma, L., & Barletta B. (1997b). Food engineering laboratory manual. Lancaster, PA: Technomic
3. Pham Q.T., Prediction of calorimetric properties and freezing time of foods from composition data, Journal of Food Engineering, Vol. 30, p. 95-
107 (1996)
4. Srikiatden Jaruk, Roberts John S., Measuring moisture diffusivity of potato and carrot (core and cortex) during convective hot air and isothermal
drying, Journal of Food Engineering, Vol. 74, p. 143-152 (2006)
5. Delgado A.E., Sun Da-Wen, Heat and mass transfer for predicting freezing processes – a review, Journal of Food Engineering, Vol. 47, p. 157-174
(2001)
6. Pham Q.T., Modelling heat and mass transfer in frozen foods: a review, Journal of Refrigeration, Vol. 29, p. 876-888 (2006)
7. R.Y. Jumah, A.S. Mujumdar, G.S.V. Raghavan, A mathematical model for constant and intermittent batch
drying of grains in a novel rotating jet spouted bed, Drying Technol. 14 (3 and 4) (1996) 765–802.
8. M. Kemp, L. Davies, P.J. Fryer, The geometry of shadows: effects of inhomogeneities in electrical field processing,J. Food Eng. 40 (1999) 245–
258.
9. A. Kumar, M. Bhattacharya, J. Blaylock, Numerical simulation of natural convection heating of canned thickviscous food products, J. Food Sci. 55
(1990) 1403–1411, 1420.
10. W. Liu, G.K. Christian, Z. Zhang, P.J. Fryer, Development and use of a novel method for measuring the force required to disrupt and remove
fouling deposits, Trans IChemE C 80 (2002) 286–291.
11. Q. Zhao, Y. Liu, H. Muller-Steinhagen, in: D.I. Wilson, P.J. Fryer, A.P.M. Hasting (Eds.), Fouling, Cleaning andDisinfection in Food Processing,
Department of Chemical Engineering, University of Cambridge, UK, 2002, pp.41–48.
12. R.R. Ruan, P. Chen, K. Chang, H.J. Kim, I.A. Taub, Rapid food particle temperature mapping during ohmic heating using FLASH MRI, J. Food
Sci. 64 (1999) 1024–1026.
