
Abbey Capital Futures Strategy Fund
of
THE RBB FUND, INC.
Annual Report
August 31, 2023

1
Abbey Capital Futures Strategy Fund
Annual Investment Adviser’s Report
August 31, 2023 (Unaudited)
Abbey Capital Futures Strategy Fund Annual Report, August 31, 2023
Dear Shareholder,
The Abbey Capital Futures Strategy Fund (the “Fund”) Class I Shares returned -2.83% net of fees for the 12-month scal
year ended August 31, 2023.
Negative performance was driven by trading in metals, energy and major currencies. Emerging market currencies was
the main positive contributor to Fund performance during the 12-month period. The Fund’s core allocation to Diversied
Trendfollowing (“Trendfollowing”) strategies generated most of the negative performance, while the performance of
the Fund’s non- Trendfollowing allocation was modestly positive in aggregate during the period. The Fund may invest
up to 25% of its total assets in Abbey Capital Master Oshore Fund Limited (“ACMOF”), a wholly- owned subsidiary
of the Fund that invests substantially all of its assets in Abbey Capital Oshore Fund SPC (“ACOF”), which is a wholly-
owned and controlled segregated portfolio company and a multi- adviser fund that invests in managed futures and
foreign exchange contracts. The Fund may also invest a portion of its assets into Abbey Capital Onshore Series LLC
(“ACOS”), a wholly-owned subsidiary of the Fund which is a multi-adviser fund that invests in managed futures and
foreign exchange contracts.
Average Total Returns for the Periods Ended August 31, 2023 (unless otherwise noted)
2023
YTD 1 Year
Sep. 1, 2021 to
Aug. 31, 2022
5 Years
Annualized
ANNUALIZED
SINCE
INCEPTION ON
JULY 1, 2014
Class I Shares -1.36% -2.83% 17.72% 6.12% 4.99%
Class A Shares* -1.55% -3.05% 17.40% 5.84% 4.73%
Class A Shares (max load)* -7.24% -8.64% 10.64% 4.59% 4.06%
Class C Shares** -2.06% -3.77% 16.48% 5.05% 3.96%
ICE BofA 3-Month U.S. Treasury Bill Index*** 3.13% 4.25% 0.37% 1.65% 1.16%
Barclay CTA Index*** 0.28% -0.38% 8.34% 4.19% 2.64%
S&P 500
®
Total Return Index*** 18.73% 15.94% -11.23% 11.12% 11.59%
Barclay CTA numbers are based on the estimates available on the BarclayHedge website as of September 13, 2023
Source: Abbey Capital, Bloomberg and BarclayHedge.
Performance quoted is past performance and does not guarantee future results. Investment return and principal value will uctuate so that shares,
when redeemed, may be worth more or less than their original cost. Current performance may be lower or higher than the returns quoted. Visit
www.abbeycapital.com for returns updated daily. Call (US Toll Free) 1-844-261-6484 or (international callers) + 1-508-871-3276 for returns
current to the most recent month-end.
Please note the above is shown for illustrative purposes only.
* Class A Shares performance prior to its inception on August 29, 2014 is the performance of Class I Shares, adjusted for the Class
A Shares expense ratio. There is a maximum sales charge (load) imposed on purchases (as a percentage of oering price) of
5.75% in Class A Shares.
** Class C Shares performance prior to its inception on October 6, 2015 is the performance of Class I Shares, adjusted for the Class
C Shares expense ratio.
*** The Barclay CTA Index is derived from data that is self-reported by investment managers based on the performance of privately
managed funds. In contrast, the S&P 500® Total Return Index and the ICE BofA 3-Month U.S. Treasury Bill Index are comprised
of publicly traded securities. As a result of these dierences, these indices may not be directly comparable, and the table above
is shown for illustrative purposes only.
2
Abbey Capital Futures Strategy Fund
Annual Investment Adviser’s Report (Continued)
August 31, 2023 (Unaudited)
Abbey Capital Limited (the “Adviser”) has contractually agreed to waive its advisory fee and/or reimburse expenses in
order to limit total annual fund operating expenses (excluding acquired fund fees and expenses, brokerage commissions,
extraordinary items, interest or taxes) to 1.79%, 2.04% and 2.79% of the Fund’s average daily net assets aributable to
Class I Shares, Class A Shares, and Class C Shares, respectively. This contractual limitation is in eect until December
31, 2023, and may not be terminated without the approval of the Board of Directors of The RBB Fund, Inc. In addition,
the Adviser may recoup any waived or reimbursed amounts from the Fund within three years from the date on which
such waiver or reimbursement was made by the Adviser, provided such reimbursement does not cause the Fund
to exceed expense limitations that were in eect at the time of the waiver or reimbursement. Without the expense
limitation agreement, the expense ratios are 1.85%, 2.10% and 2.85% of the Fund’s average daily net assets aributable
to Class I Shares, Class A Shares, and Class C Shares, respectively, as stated in the Fund’s current prospectus dated
December 31, 2022 (and which may dier from the actual expense ratios for the period covered by this report). The
quoted performance would have been lower without the expense limitation.
Please refer to the prospectus for further information on expenses and fees.
Performance Analysis
The 12-month period ended August 31, 2023 was negative overall for Fund performance. The Fund’s Trendfollowing
sub-advisers drove losses for the period, while the non-Trendfollowing trading styles were modestly positive in
aggregate.
Central bank monetary policy was an important driver of market moves throughout the 12- month period. Most
central banks began aggressive interest rate hiking policies during the rst half of 2022, and this hawkish shift in policy
continued in the second half of the year and into 2023.
Ination slowed from multi-decade highs during the period, with US ination falling signicantly from its peak in June
2022. The pace at which ination slowed became a key focus for investors as markets tried to anticipate central bank
policy responses to falling, albeit elevated, ination. As we moved into 2023, central banks continued to raise rates,
but in smaller increments. Investor focus shifted away from forecasting how high interest rates could go, and instead
moved towards assessing when the peak in global central bank rates may occur and when central banks may begin to
start cuing rates.
This slowdown in ination supported equity returns. Stock markets steadied over the second half of 2022, though this
period did see some notable negative and positive months as investors digested both hawkish and dovish central bank
guidance. Equities then rallied strongly over the rst eight months of 2023 alongside slowing ination, generally strong
corporate earnings, solid US economic data and hopes that we were approaching the end of the global rate hiking cycle.
Commodity markets were challenging for much of the period. Demand uncertainty amid a mixed global growth
backdrop was a feature of several markets, with the outlook for the Chinese economy a factor within growth-sensitive
markets like energy and base metals. Economic data from China was subdued for much of the period, while the
reopening of the Chinese economy post-lockdowns in early 2023 ultimately stuered and the anticipated rebound in
economic activity proved weaker than expected. Oseing this uncertain demand backdrop were supply concerns in
some markets, for example in crude oil where OPEC+ production cuts were a feature, as well as in several agricultural
markets like cocoa and sugar. This combination of supply and demand considerations contributed to a lack of clear
trends and frequent price reversals across many commodity markets.
Fund performance from September to December 2022 was negative, with choppy price moves in commodity markets,
most notably energy, proving particularly challenging for the Fund’s Trendfollowing sub-advisers. Notable losses in
nancial contracts occurred in November 2022, when the release of weaker-than-expected US ination data prompted
a dovish revision to market expectations for Federal Reserve monetary policy going forward. This contributed to a
notable deviation from year-to-date uptrends in yields and the US Dollar, and supported equity prices.
3
Abbey Capital Futures Strategy Fund
Annual Investment Adviser’s Report (Continued)
August 31, 2023 (Unaudited)
Fund performance was also negative in Q1 2023. Concerns for the global banking sector in March 2023 following the
collapse of Silicon Valley Bank caused a sharp move lower in yields and interest rate expectations. This was, in part,
due to concerns about the impact of higher interest rates on the broader economy, and as uncertainty about whether
the Federal Reserve could maintain a hawkish monetary policy stance intensied. This sharp reversal in yields was
negative for many of the Fund’s sub-advisers which held short positions across several xed income contracts.
The performance backdrop for the Fund improved from April to August 2023 with longer-term price trends re-emerging
in currencies and xed income as expectations for central bank monetary policy turned more hawkish and concerns
about the health of the banking sector eased. This proved protable for the Fund. While Trendfollowing sub-advisers
were the primary source of negative Fund performance from September 2022 to March 2023, this trading style led gains
through the last ve months of the 12-month period.
For the 12-month period overall, the Fund’s allocation to Trendfollowing sub-advisers saw the largest losses at the
trading style level. The non-Trendfollowing trading styles were modestly positive in aggregate, with gains for the
Short-term and Global Macro sub-advisers outweighing losses for the Value sub-adviser.
The Fund’s largest losses over the 12-month period occurred in metals. Trendfollowing sub-advisers led losses in
the sector as price moves were often range-bound and resulted in sharp price reversals at times. In precious metals,
positioning in silver and gold transitioned between long and short as sustained price trends failed to emerge, leading
to steady losses throughout the period. Prices of both metals responded to the uctuating value of the US Dollar and
choppiness in global yields. Negative performance in copper was more concentrated in March and April 2023 when
long positions incurred losses as prices fell in response to weak Chinese economic data, risk-o sentiment in markets
amid banking sector concerns and US-China tensions.
Negative performance in energy was concentrated in crude oil futures contracts. Prices proved choppy over the period
owing to a lack of clear trends and frequent price reversals occurring. Demand-side factors behind these price moves
included global demand uncertainty and the subdued economic performance in China following the reopening of the
nation’s economy, while OPEC+ policy changes impacted global supplies at dierent times.
The Fund’s losses in major currencies were driven by the Short-term trading advisers, with Value and Trendfollowing
also negative. The clear and steady trends in major currency pair contracts evident for most of 2022 unwound in the
laer part of 2022 and trends were choppy for much of 2023. Trendfollowing and Short-term sub-advisers led losses in
EUR/ USD contracts while negative performance from the Value sub-adviser was concentrated in USD/ CHF contracts.
The US Dollar weakened against peers in the nal quarter of 2022, marking a reversal to the uptrends seen during the
rst nine months of 2022. 2023 has so far seen the US Dollar strengthen and weaken against peers at dierent times as
shifts in expectations for US monetary policy occurred, with prices trends lacking persistency.
Equities was another negative sector for the Fund during the year ended August 31, 2023, as losses from Trendfollowing
and Value sub-advisers more than oset gains from the Fund’s Short-term sub-adviser. Losses were concentrated in
the last four months of 2022, with choppy prices moves amid shifting expectations around the outlook for central bank
policy proving challenging for Trendfollowing sub-advisers. In contrast, above-average volatility in the equities sector
provided opportunities for the Fund’s Short-term sub-adviser which reported notable gains from trading in S&P 500
futures contracts.
Agricultural commodities was also a negative sector for the Fund. Losses in soybean, corn and coee futures contracts
were partially oset by gains in sugar and cocoa. Soybean losses stemmed from long positions held by Trendfollowing
sub-advisers while mixed positioning in response to range-bound price moves in corn and coee also incurred losses
for the Fund. Long positions in sugar and cocoa generated positive performance as prices in both commodities rose to
multi-year highs in 2023 owing to weather-related supply concerns.
Positively, the Fund’s largest gains over the 12-month period occurred in emerging market currencies. Gains were
concentrated in long positions in the Mexican Peso and Polish Zloty against the US Dollar. The Mexican Peso rallied
over the period owing to strong Mexican economic data and rate increases by the Bank of Mexico which led to an
4
aractive carry relative to US yields. In addition, robust US economic data was a further tailwind given the close links
between the Mexican and US economies. Meanwhile, gains in long Polish Zloty positions relative to the US Dollar were
led by the Fund’s Value sub-adviser.
Fixed income was also a modestly positive sector for the Fund during the 12-month period. Gains were concentrated in
short-term interest rates and more than oset losses in bonds. Despite several shifts for expectations around central bank
policy, expectations for US rates turned more hawkish over the 12-month period. Meanwhile, United Kingdom (“UK”)
rate expectations also rose as ination proved higher and more entrenched in the UK than in some other developed
economies.
Key to Currency Abbreviations
USD US Dollar
CHF Swiss Franc
EUR Euro
An investment in the Fund is speculative and involves substantial risk. It is possible that an investor may lose some
or all of their investment. The Fund may invest up to 25% of its total assets in ACMOF, which invests substantially
all of its assets in ACOF, which is a multi-adviser fund that invests in managed futures and foreign exchange. The
Fund may also invest a portion of its assets into ACOS, which is a multi-adviser fund that invests in managed
futures and foreign exchange. All investments in securities involve risk of the loss of capital. An investment in
open-ended investment product. Among the risks associated with investing in this Fund are Commodity Sector
Risk, Counter-Party Risk, Credit Risk, Currency Risk, Manager and Management Risks, Subsidiary Risk, Tax Risk,
Emerging Markets Risk, Leveraging Risk, Foreign Investment Risk, Fixed Income Securities Risks, Short Sale Risk
and Portfolio Turnover Risks. The Fund may invest in or utilize derivative investments, futures contracts, and
hedging strategies. One or more Trading Advisers, from time to time, may invest a substantial portion of the assets
and volatility than if investments had been made in the securities of a broader range of issuers. There can be no
high level of risk involved. The Fund is appropriate only for investors who can bear the risks associated with the
product. This brief statement cannot disclose all of the risks and other factors necessary to evaluate an investment
in the Fund. Investors are urged to take appropriate investment advice and to carefully consider their investment
tax considerations, sales charges and expenses.
Fund holdings and sector allocations are subject to change and should not be considered recommendations to buy or
sell any security. Please refer to the Consolidated Portfolio of Investments in this report for a complete list of Fund
holdings.
The Abbey Capital Futures Strategy Fund is distributed by Quasar Distributions, LLC.
This report is submied for general information to the shareholders of the Fund. It is not authorized for distribution
unless preceded or accompanied by a current prospectus for the Fund. Opinions expressed are subject to change at any
time, are not guaranteed, and should not be considered investment advice.
Abbey Capital Futures Strategy Fund
Annual Investment Adviser’s Report (Concluded)
August 31, 2023 (Unaudited)
5
Comparison of Change in Value of $10,000 Investment in Abbey Capital Futures Strategy Fund - Class A Shares
vs. ICE BofA 3-Month U.S. Treasury Bill Index, S&P 500
®
Total Return Index and Barclay CTA Index
8,000
10,000
12,000
14,000
16,000
18,000
20,000
22,000
24,000
26,000
28,000
Past performance is not predictive of future results.
Abbey Capital
Futures Strategy
Fund - Class A
Shares (no load)
$15,275
Abbey Capital
Futures Strategy
Fund - Class A
Shares (with load)
$14,397
ICE BofA
3-Month U.S.
Treasury Bill Index
$11,121
S&P 500
®
Total
Return Index
$27,148
Barclay CTA Index
$12,693
D
O
L
L
A
R
S
7/01/14
8/31/15
8/31/14
8/31/16
8/31/19
8/31/22
8/31/20
8/31/17
8/31/21
8/31/18
8/31/23
The chart illustrates the performance of a hypothetical $10,000 initial investment in the Fund made on July 1, 2014 and reects
Fund expenses and reinvestment of dividends and distributions (performance shown prior to August 29, 2014 is Class I Shares
performance adjusted for Class A shares expense ratio). Class A Shares growth of a hypothetical investment of $10,000 is adjusted
for the maximum sales charge of 5.75%. This results in a net initial investment of $9,425. Performance does not reect the deduction
of taxes a shareholder may pay on dividends, distributions or redemptions.
Average Annual Total Returns for the Periods Ended August 31, 2023
One
Year
Three
Years
Five
Years
Since
Inception††
Class A Shares (without sales charge)
(Pro forma July 1, 2014 to August 29, 2014) -3.05% 6.95% 5.84% 4.73%*
Class A Shares (with sales charge)
(Pro forma July 1, 2014 to August 29, 2014) -8.64% 4.86% 4.59% 4.06%*
S&P 500
®
Total Return Index 15.94% 10.52% 11.12% 11.59%**
ICE BofA 3-Month U.S. Treasury Bill Index*** 4.25% 1.55% 1.65% 1.16%**
Barclay CTA Index*** -0.38% 5.01% 4.19% 2.64%**
†† Inception date of Class A Shares of the Fund was August 29, 2014.
* Class A Shares performance prior to its inception on August 29, 2014 is the performance of Class I Shares, adjusted for the Class
A Shares expense ratio.
** Performance is from the inception date of the Fund and is not the inception date of the index itself. The above is shown for
illustrative purposes only.
*** This is not a primary benchmark of the Fund. Results of the index performance are presented for general comparative purposes.
The Fund charges a 5.75% maximum sales charge on purchases (as a percentage of oering price) of Class A Shares.
The performance data quoted reects fee waivers in eect and would have been less in their absence. The Adviser has
contractually agreed to waive its advisory fee and/or reimburse expenses in order to limit total annual Fund operating
expenses (excluding acquired fund fees and expenses, brokerage commissions, extraordinary items, interest or taxes)
Abbey Capital Futures Strategy Fund
Performance Data
August 31, 2023 (Unaudited)
6
Abbey Capital Futures Strategy Fund
Performance Data (Continued)
August 31, 2023 (Unaudited)
to 2.04% of the Fund’s average daily net assets aributable to Class A Shares. Without the limitation arrangement, the
gross expense ratio is 2.10% for Class A Shares as stated in the current prospectus, as supplemented (and which may
dier from the actual expense ratio for the period covered by this report). This contractual limitation is in eect until
December 31, 2023 and may not be terminated without the approval of the Board of Directors of The RBB Fund, Inc.
Please see the Consolidated Financial Highlights for current gures.

7
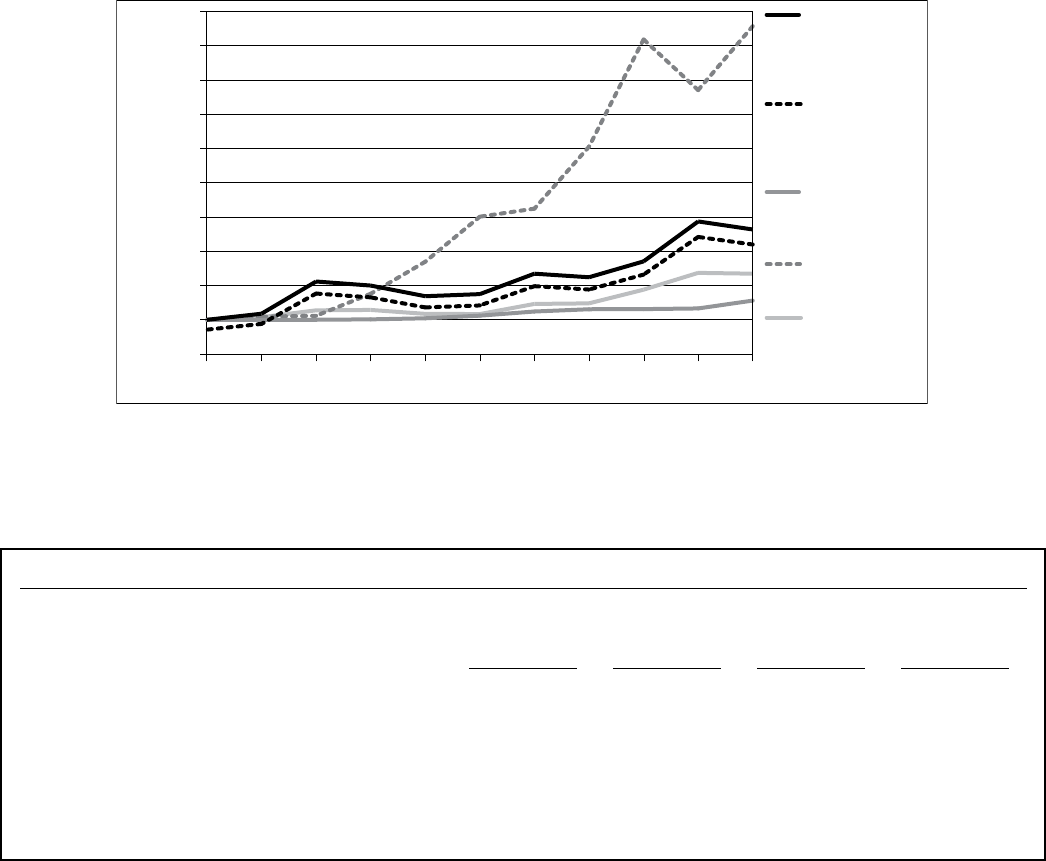
Comparison of Change in Value of $1,000,000 Investment in Abbey Capital Futures Strategy Fund – Class I Shares
vs. ICE BofA 3-Month U.S. Treasury Bill Index, S&P 500
®
Total Return Index and Barclay CTA Index
0
1,000,000
2,000,000
3,000,000
D
O
L
L
A
R
S
Past performance is not predictive of future results.
Abbey Capital
Futures Strategy
Fund - Class I
Shares
$1,563,095
ICE BofA
3-Month U.S.
Treasury Bill Index
$1,112,111
S&P 500
®
Total
Return Index
$2,714,819
Barclay CTA Index
$1,269,281
7/01/14
8/31/15
8/31/14
8/31/16
8/31/22
8/31/21
8/31/20
8/31/19
8/31/17
8/31/18
8/31/23
The chart illustrates the performance of a hypothetical $1,000,000 minimum initial investment in the Fund made on July
1, 2014 and reects Fund expenses and reinvestment of dividends and distributions. Performance does not reect the
deduction of taxes a shareholder may pay on dividends, distributions or redemptions.
Average Annual Total Returns for the Periods Ended August 31, 2023
One
Year
Three
Years
Five
Years
Since
Inception††
Class I Shares -2.83% 7.24% 6.12% 4.99%
S&P 500
®
Total Return Index 15.94% 10.52% 11.12% 11.59%*
ICE BofA 3-Month U.S. Treasury Bill Index** 4.25% 1.55% 1.65% 1.16%*
Barclay CTA Index** -0.38% 5.01% 4.19% 2.64%*
†† Inception date of Class I Shares of the Fund was July 1, 2014.
* Performance is from the inception date of the Fund and is not the inception date of the index itself. The above is shown for
illustrative purposes only.
** This is not a primary benchmark of the Fund. Results of the index performance are presented for general comparative purposes.
The performance data quoted reects fee waivers in eect and would have been less in their absence. The Adviser has
contractually agreed to waive its advisory fee and/or reimburse expenses in order to limit total annual Fund operating
expenses (excluding acquired fund fees and expenses, brokerage commissions, extraordinary items, interest or taxes)
to 1.79% of the Fund’s average daily net assets aributable to Class I Shares. Without the limitation arrangement, the
gross expense ratio is 1.85% for Class I Shares, as stated in the current prospectus, as supplemented (and which may
dier from the actual expense ratios for the period covered by this report). This contractual limitation is in eect until
December 31, 2023 and may not be terminated without the approval of the Board of Directors of The RBB Fund, Inc.
Please see the Consolidated Financial Highlights for current gures.
Abbey Capital Futures Strategy Fund
Performance Data (Continued)
August 31, 2023 (Unaudited)

8
Comparison of Change in Value of $10,000 Investment in Abbey Capital Futures Strategy Fund – Class C Shares
vs. ICE BofA 3-Month U.S. Treasury Bill Index, S&P 500
®
Total Return Index and Barclay CTA Index
8,000
10,000
12,000
14,000
16,000
18,000
20,000
22,000
24,000
26,000
28,000
D
O
L
L
A
R
S
Past performance is not predictive of future results.
Abbey Capital
Futures Strategy
Fund - Class C
Shares
$14,270
ICE BofA
3-Month U.S.
Treasury Bill Index
$11,121
S&P 500
®
Total
Return Index
$27,148
Barclay CTA Index
$12,693
7/01/14
8/31/15
8/31/14
8/31/16
8/31/22
8/31/21
8/31/20
8/31/19
8/31/17
8/31/18
8/31/23
The chart illustrates the performance of a hypothetical $10,000 minimum initial investment in the Fund made on July 1,
2014 and reects Fund expenses and reinvestment of dividends and distributions (performance shown prior to October
6, 2015 is Class I Shares performance adjusted for Class C Shares expense ratio). Performance does not reect the
deduction of taxes a shareholder may pay on dividends, distributions or redemptions.
Average Annual Total Returns for the Periods Ended August 31, 2023
One
Year
Three
Years
Five
Years
Since
Inception††
Class C Shares (without sales charge)
(Pro forma July 1, 2014 to October 6, 2015) -3.77% 6.18% 5.05% 3.96%*
Class C Shares (with sales charge)
(Pro forma July 1, 2014 to August 29, 2014) -4.60% 6.18% 5.05% 3.96%*
S&P 500
®
Total Return Index 15.94% 10.52% 11.12% 11.59%**
ICE BofA 3-Month U.S. Treasury Bill Index*** 4.25% 1.55% 1.65% 1.16%**
Barclay CTA Index*** -0.38% 5.01% 4.19% 2.64%**
†† Inception date of Class C Shares of the Fund was October 6, 2015.
* Class C Shares performance prior to its inception on October 6, 2015 is the performance of Class I Shares, adjusted for the Class
C Shares expense ratio.
** Performance is from the inception date of the Fund and is not the inception date of the index itself. The above is shown for
illustrative purposes only.
*** This is not a primary benchmark of the Fund. Results of the index performance are presented for general comparative purposes.
The Fund charges a contingent deferred sales charge (“CDSC”) of 1.00% on certain redemptions of Class C Shares
made within 12 months of purchase. The CDSC is assessed on an amount equal to the lesser of the oering price at the
time of purchase of the Class C Shares redeemed and the net asset value of the Class C Shares redeemed at the time of
redemption.
Abbey Capital Futures Strategy Fund
Performance Data (Continued)
August 31, 2023 (Unaudited)
9
Abbey Capital Futures Strategy Fund
Performance Data (Concluded)
August 31, 2023 (Unaudited)
The performance data quoted reects fee waivers in eect and would have been less in their absence. The Adviser has
contractually agreed to waive its advisory fee and/or reimburse expenses in order to limit total annual Fund operating
expenses (excluding acquired fund fees and expenses, brokerage commissions, extraordinary items, interest or taxes)
to 2.79% of the Fund’s average daily net assets aributable to Class C Shares. Without the limitation arrangement, the
gross expense ratio is 2.85% for Class C Shares, as stated in the current prospectus, as supplemented (and which may
dier from the actual expense ratios for the period covered by this report). This contractual limitation is in eect until
December 31, 2023 and may not be terminated without the approval of the Board of Directors of The RBB Fund, Inc.
Please see the Consolidated Financial Highlights for current gures.
Performance quoted is past performance and does not guarantee future results. Investment return and principal value of
an investment will uctuate so that shares, when redeemed, may be worth more or less than their original cost. Current
performance may be lower or higher than the returns quoted. Visit www.abbeycapital.com for returns updated daily. Call
(US Toll Free) 1-844-261-6484 or (international callers) + 1-508-871-3276 for returns current to the most recent month-end.
The Barclay CTA Index is derived from data which is self-reported by investment managers based on the performance
of privately managed funds. In contrast, the S&P 500
®
Total Return Index and the ICE BofA 3-Month U.S. Treasury
Bill Index are comprised of publicly traded securities. As a result of these dierences, these indices may not be directly
comparable. Additionally, these indices are not available for direct investment and the above is shown for illustrative
purposes only.
Barclay CTA Index
The Barclay CTA Index is a leading industry benchmark of representative performance of commodity trading advisors.
There are currently 412 programs included in the calculation of the Barclay CTA Index for 2023. The Barclay CTA Index
is equally weighted and rebalanced at the beginning of each year.
ICE BofA 3-Month U.S. Treasury Bill Index
The ICE BofA 3-Month U.S. Treasury Bill Index is an unmanaged market index of U.S. Treasury securities maturing in
90 days that assumes reinvestment of all income.
The S&P 500
®
Total Return Index
The S&P 500
®
Total Return Index is the total return version of the S&P 500
®
Index. Dividends are reinvested on a daily
basis and all regular cash dividends are assumed reinvested in the index on the ex-dividend date.
A basis point is one hundredth of one percent.
Portfolio composition is subject to change. It is not possible to invest directly in an index.

10
As a shareholder of the Fund, you incur two types of costs: (1) transaction costs, including sales charges (loads) on
purchase payments, (if any) and (2) ongoing costs, including management fees, distribution and/or service (12b-1)
fees and other Fund expenses. These examples are intended to help you understand your ongoing costs (in dollars) of
investing in the Fund and to compare these costs with the ongoing costs of investing in other mutual funds.
These examples are based on an investment of $1,000 invested at the beginning of the six-month period from March 1,
2023 through August 31, 2023, and held for the entire period.
ACTUAL EXPENSES
The rst section in the accompanying table provides information about actual account values and actual expenses. You
may use the information in this section, together with the amount you invested, to estimate the expenses that you paid
over the period. Simply divide your account value by $1,000 (for example, an $8,600 account value divided by $1,000
= 8.6), then multiply the result by the number in the rst section under the heading entitled “Expenses Paid During
Period” to estimate the expenses you paid on your account during this period.
HYPOTHETICAL EXAMPLE FOR COMPARISON PURPOSES
The second section of the accompanying table provides information about hypothetical account values and hypothetical
expenses based on the Fund’s actual expense ratio and an assumed rate of return of 5% per year before expenses, which
is not the Fund’s actual return. The hypothetical account values and expenses may not be used to estimate the actual
ending account balance or expenses you paid for the period. You may use this information to compare the ongoing costs
of investing in the Fund and other funds. To do so, compare these 5% hypothetical examples with the 5% hypothetical
examples that appear in the shareholder reports of other funds.
Please note that the expenses shown in the accompanying table are meant to highlight your ongoing costs only and do not
reect any transactional costs, such as sales charges (loads) on purchase payments (if any). Therefore, the second section
of the accompanying table is useful in comparing ongoing costs only and will not help you determine the relative total
costs of owning dierent funds. In addition, if these transactional costs were included, your costs would have been higher.
Beginning
Account Value
March 1, 2023
Ending
Account Value
August 31, 2023
Expenses Paid
During
Period
(1)
Annualized
Expense
Ratio
(2)
Actual Six-
Month Total
Investment
Returns for the
Fund
Actual
Class A Shares $ 1,000.00 $ 973.50 $ 10.15 2.04% -2.65%
Class I Shares 1,000.00 974.70 8.91 1.79% -2.53%
Class C Shares 1,000.00 969.90 13.85 2.79% -3.01%
Hypothetical (5% return before expenses)
Class A Shares $ 1,000.00 $ 1,014.92 $ 10.36 2.04% N/A
Class I Shares 1,000.00 1,016.18 9.10 1.79% N/A
Class C Shares 1,000.00 1,011.14 14.14 2.79% N/A
(1)
Expenses are equal to the Funds’ Class A Shares, Class I Shares, and Class C Shares annualized six-month expense ratios for
the period March 1, 2023 through August 31, 2023, multiplied by the average account value over the period, multiplied by the
number of days (184) in the most recent scal half-year, then divided by 365 to reect the one half year period. The Fund’s
ending account values in the rst section in the table are based on the actual six-month total investment return for the Fund’s
respective share classes.
(2)
Ratios reect expenses waived by the Fund’s investment adviser. Without these waivers, the Fund’s expenses would have been
higher and the ending account values would have been lower.
Abbey Capital Futures Strategy Fund
Fund Expense Examples
August 31, 2023 (Unaudited)

The accompanying notes are an integral part of the consolidated nancial statements.
11
Abbey Capital Futures Strategy Fund
Consolidated Portfolio Holdings Summary Table
August 31, 2023 (Unaudited)
The following table presents a consolidated summary of the portfolio holdings of the Fund:
% of Net
Assets Value
SHORT-TERM INVESTMENTS:
U.S. Treasury Obligations
81.9% $ 2,247,513,674
Money Market Deposit Account
2.3 62,235,219
OTHER ASSETS IN EXCESS OF LIABILITIES
(including futures and forward foreign currency contracts)
15.8 433,852,042
NET ASSETS
100.0% $ 2,743,600,935
The Fund seeks to achieve its investment objective by allocating its assets between a “Managed Futures” strategy and a “Fixed
Income” strategy.
As a result of the Fund’s use of derivatives, the Fund may hold signicant amounts of U.S. Treasuries or short-term investments.
Portfolio holdings are subject to change at any time.
Refer to the Consolidated Portfolio of Investments for a detailed listing of the Fund’s holdings.

The accompanying notes are an integral part of the consolidated nancial statements.
12
Abbey Capital Futures Strategy Fund
Consolidated Portfolio of Investments
August 31, 2023
Coupon*
Maturity
Date
Par
(000’s) Value
SHORT-TERM INVESTMENTS - 84.2%
U.S. TREASURY OBLIGATIONS - 81.9%
U.S. Treasury Bills . . . . . . . . . . . . . . . . . . . . . . . . . . . . . . . . . . . . . . . . . . . . . . . .
5.315% 09/07/23 $ 52,937 $ 52,890,530
U.S. Treasury Bills . . . . . . . . . . . . . . . . . . . . . . . . . . . . . . . . . . . . . . . . . . . . . . . .
4.849% 09/14/23 47,271 47,181,439
U.S. Treasury Bills . . . . . . . . . . . . . . . . . . . . . . . . . . . . . . . . . . . . . . . . . . . . . . . .
4.813% 09/21/23 97,780 97,493,517
U.S. Treasury Bills . . . . . . . . . . . . . . . . . . . . . . . . . . . . . . . . . . . . . . . . . . . . . . . .
4.947% 09/28/23 96,725 96,341,605
U.S. Treasury Bills . . . . . . . . . . . . . . . . . . . . . . . . . . . . . . . . . . . . . . . . . . . . . . . .
4.827% 10/05/23 105,598 105,071,002
U.S. Treasury Bills . . . . . . . . . . . . . . . . . . . . . . . . . . . . . . . . . . . . . . . . . . . . . . . .
4.955% 10/12/23 129,608 128,826,780
U.S. Treasury Bills . . . . . . . . . . . . . . . . . . . . . . . . . . . . . . . . . . . . . . . . . . . . . . . .
5.050% 10/19/23 136,853 135,889,556
U.S. Treasury Bills . . . . . . . . . . . . . . . . . . . . . . . . . . . . . . . . . . . . . . . . . . . . . . . .
5.056% 10/26/23 99,532 98,727,779
U.S. Treasury Bills . . . . . . . . . . . . . . . . . . . . . . . . . . . . . . . . . . . . . . . . . . . . . . . .
5.057% 11/02/23 117,558 116,490,524
U.S. Treasury Bills . . . . . . . . . . . . . . . . . . . . . . . . . . . . . . . . . . . . . . . . . . . . . . . .
5.120% 11/09/23 49,321 48,821,728
U.S. Treasury Bills . . . . . . . . . . . . . . . . . . . . . . . . . . . . . . . . . . . . . . . . . . . . . . . .
5.339% 11/16/23 39,985 39,539,301
U.S. Treasury Bills . . . . . . . . . . . . . . . . . . . . . . . . . . . . . . . . . . . . . . . . . . . . . . . .
5.440% 11/24/23 125,199 123,647,737
U.S. Treasury Bills . . . . . . . . . . . . . . . . . . . . . . . . . . . . . . . . . . . . . . . . . . . . . . . .
5.510% 11/30/23 89,913 88,719,405
U.S. Treasury Bills . . . . . . . . . . . . . . . . . . . . . . . . . . . . . . . . . . . . . . . . . . . . . . . .
5.398% 12/07/23 127,969 126,139,895
U.S. Treasury Bills . . . . . . . . . . . . . . . . . . . . . . . . . . . . . . . . . . . . . . . . . . . . . . . .
5.372% 12/14/23 43,532 42,872,708
U.S. Treasury Bills . . . . . . . . . . . . . . . . . . . . . . . . . . . . . . . . . . . . . . . . . . . . . . . .
5.449% 12/21/23 37,712 37,098,050
U.S. Treasury Bills . . . . . . . . . . . . . . . . . . . . . . . . . . . . . . . . . . . . . . . . . . . . . . . .
5.512% 12/28/23 75,030 73,731,481
U.S. Treasury Bills . . . . . . . . . . . . . . . . . . . . . . . . . . . . . . . . . . . . . . . . . . . . . . . .
5.528% 01/04/24 51,645 50,698,175
U.S. Treasury Bills . . . . . . . . . . . . . . . . . . . . . . . . . . . . . . . . . . . . . . . . . . . . . . . .
5.514% 01/11/24 77,955 76,445,791
U.S. Treasury Bills . . . . . . . . . . . . . . . . . . . . . . . . . . . . . . . . . . . . . . . . . . . . . . . .
5.522% 01/18/24 27,831 27,263,798
U.S. Treasury Bills . . . . . . . . . . . . . . . . . . . . . . . . . . . . . . . . . . . . . . . . . . . . . . . .
5.526% 01/25/24 27,385 26,798,595
U.S. Treasury Bills . . . . . . . . . . . . . . . . . . . . . . . . . . . . . . . . . . . . . . . . . . . . . . . .
5.510% 02/01/24 50,537 49,405,314
U.S. Treasury Bills . . . . . . . . . . . . . . . . . . . . . . . . . . . . . . . . . . . . . . . . . . . . . . . .
5.523% 02/08/24 126,016 123,061,624
U.S. Treasury Bills . . . . . . . . . . . . . . . . . . . . . . . . . . . . . . . . . . . . . . . . . . . . . . . .
5.531% 02/15/24 72,851 71,066,635
U.S. Treasury Bills . . . . . . . . . . . . . . . . . . . . . . . . . . . . . . . . . . . . . . . . . . . . . . . .
5.566% 02/22/24 260,544 253,887,362
U.S. Treasury Bills . . . . . . . . . . . . . . . . . . . . . . . . . . . . . . . . . . . . . . . . . . . . . . . .
5.554% 02/29/24 112,385 109,403,343
TOTAL U.S. TREASURY OBLIGATIONS ($2,248,356,446) . . . . . . . . . . .
2,247,513,674
Number
of Shares
(000’s)
MONEY MARKET DEPOSIT ACCOUNT - 2.3%
U.S. Bank Money Market Deposit Account, 5.20% (United States)
(a)
. . . .
62,235 62,235,219
TOTAL MONEY MARKET DEPOSIT ACCOUNT
(Cost $62,235,219) . . . . . . . . . . . . . . . . . . . . . . . . . . . . . . . . . . . . . . . . . .
62,235,219
TOTAL SHORT-TERM INVESTMENTS
(Cost $2,310,591,665) . . . . . . . . . . . . . . . . . . . . . . . . . . . . . . . . . . . . . . . .
2,309,748,893
TOTAL INVESTMENTS - 84.2%
(Cost $2,310,591,665) . . . . . . . . . . . . . . . . . . . . . . . . . . . . . . . . . . . . . . . . . . . .
2,309,748,893
OTHER ASSETS IN EXCESS OF LIABILITIES - 15.8% . . . . . . . . . . . .
433,852,042
NET ASSETS - 100.0% . . . . . . . . . . . . . . . . . . . . . . . . . . . . . . . . . . . . . . . . . . .
$ 2,743,600,935
* Short-term investments’ coupon reect the annualized eective yield on the date of purchase for discounted investments.
(a) The rate shown is as of August 31, 2023.

The accompanying notes are an integral part of the consolidated nancial statements.
13
Abbey Capital Futures Strategy Fund
Consolidated Portfolio of Investments (Continued)
August 31, 2023
Futures contracts outstanding as of August 31, 2023 were as follows:
Long Contracts
Expiration
Date
Number of
Contracts
Notional
Amount
Value and
Unrealized
Appreciation/
(Depreciation)
10-Year Mini Japanese Government Bond Futures
Sep-23 1 $ 100,959 $ 82
3-Month SOFR Futures
Mar-26 88 21,214,600 2,091
AUD/USD Currency Futures
Sep-23 79 5,117,620 (4,737)
Bank Acceptance Futures
Mar-24 30 5,243,117 6,106
Bank Acceptance Futures
Jun-24 35 6,125,065 7,318
BIST 30 Index Futures
Oct-23 379 1,247,021 (18,150)
Brent Crude Futures
Nov-23 314 27,264,620 760,932
Brent Crude Futures
Dec-23 94 8,105,620 372,460
Brent Crude Futures
Jan-24 69 5,909,160 136,680
Brent Crude Oil Last Day
Nov-23 17 1,476,110 62,730
CAC40 10 Euro Futures
Sep-23 637 50,620,298 215,126
CAD Currency Futures
Sep-23 111 8,212,335 31,620
Canola Futures (Winnipeg Commodity Exchange)
Nov-23 170 2,034,917 9,500
Canola Futures (Winnipeg Commodity Exchange)
Jan-24 28 337,318 (1,118)
Cale Feeder Futures
Oct-23 90 11,521,125 235,525
Cale Feeder Futures
Nov-23 23 2,962,975 48,188
Cale Feeder Futures
Jan-24 1 128,350 413
CHF Currency Futures
Sep-23 88 12,473,450 (301,875)
Cocoa Futures
Dec-23 611 22,228,180 1,116,926
Cocoa Futures
Mar-24 211 7,697,280 387,440
Cocoa Futures ICE
Dec-23 270 10,090,070 1,105,094
Cocoa Futures ICE
Mar-24 105 3,861,399 358,948
Cocoa Futures ICE
May-24 1 36,028 2,863
Coee Robusta Futures
Nov-23 117 2,912,130 (50,590)
Coee Robusta Futures
Jan-24 39 930,540 (38,310)
Copper Futures
Dec-23 307 29,333,850 152,138
Corn Futures
Dec-23 561 13,414,913 (470,376)
Coon No.2 Futures
Dec-23 673 29,551,430 924,100
Coon No.2 Futures
Mar-24 13 570,245 8,620
DAX Index Futures
Sep-23 149 64,623,322 (390,261)
DJIA Mini E-CBOT
Sep-23 503 87,499,364 (1,004,523)
Dollar Index
Sep-23 412 42,677,844 124,812
Dutch TTF Gas Futures
Oct-23 5 141,489 (13,293)
E-Mini Crude Oil
Oct-23 16 669,040 23,615
E-Mini Energy Select Futures
Sep-23 3 279,420 (1,550)
E-Mini Industrial Select Futures
Sep-23 1 108,990 4,950
E-Mini S&P 500 ESG Futures
Sep-23 28 5,615,400 96,735
E-Mini Technology Select Futures
Sep-23 1 177,090 7,860
EUR Foreign Exchange Currency Futures
Sep-23 492 66,742,874 (750,331)
Euro BUXL 30-Year Bond Futures
Sep-23 19 2,756,639 22,526
Euro E-Mini Futures
Sep-23 1 67,831 231
Euro STOXX 50
Sep-23 1,117 52,239,956 (503,220)
Euro Stoxx 50 Index Futures
Sep-23 4 172,455 (2,234)
Euro Stoxx Futures
Sep-23 70 425,066 (835)
Euro/JPY Futures
Sep-23 212 28,681,089 591,481
Euro-Bobl Futures
Sep-23 135 16,997,051 28,969
Euro-BTP Futures
Sep-23 161 20,237,386 126,995
Euro-BTP Futures
Dec-23 8 923,933 3,253
Euro-Bund Futures
Sep-23 1,357 195,984,461 185,063

The accompanying notes are an integral part of the consolidated nancial statements.
14
Abbey Capital Futures Strategy Fund
Consolidated Portfolio of Investments (Continued)
August 31, 2023
Long Contracts
Expiration
Date
Number of
Contracts
Notional
Amount
Value and
Unrealized
Appreciation/
(Depreciation)
Euro-Oat Futures
Sep-23 176 $ 24,411,099 $ 140,951
Euro-Scha Futures
Sep-23 34 3,875,560 1,958
FTSE 100 Index Futures
Sep-23 66 6,239,311 (16,272)
FTSE KLCI Futures
Sep-23 2 30,851 (199)
FTSE Taiwan Index
Sep-23 337 19,310,100 101,490
FTSE/JSE TOP 40
Sep-23 13 475,125 (13,115)
FTSE/MIB Index Futures
Sep-23 190 29,752,334 794,748
Gasoline RBOB Futures
Oct-23 480 51,728,544 (292,921)
Gasoline RBOB Futures
Nov-23 118 12,292,367 101,858
Gasoline RBOB Futures
Dec-23 46 4,643,176 90,237
Gasoline RBOB Futures
Jan-24 25 2,484,090 134
GBP Currency Futures
Sep-23 1,042 82,480,812 (458,789)
Gold 100 Oz Futures
Dec-23 162 31,847,580 82,681
IBEX 35 Index Futures
Sep-23 15 1,551,008 20,413
IBEX Mini Index Futures
Sep-23 2 20,680 349
Ice Three Miont SONIA Index Futures
Mar-24 345 103,017,281 341,149
Ice Three Miont SONIA Index Futures
Jun-24 333 99,550,079 353,089
IFSC Nifty 50 Futures
Sep-23 408 15,870,384 6,932
JPN 10-Year Bond (Osaka Securities Exchange)
Sep-23 45 45,409,808 (69,487)
JPX Nikkei Index 400 Futures
Sep-23 1 14,482 477
JPY Currency Futures
Sep-23 91 7,839,650 23,513
Lean Hogs Futures
Oct-23 85 2,806,700 (5,020)
Lean Hogs Futures
Dec-23 18 535,140 2,780
Live Cale Futures
Oct-23 373 26,979,090 (22,690)
Live Cale Futures
Dec-23 244 18,036,480 225,080
Live Cale Futures
Feb-24 161 12,161,940 94,850
Live Cale Futures
Apr-24 22 1,695,540 5,180
LME Aluminum Forward
Sep-23 3 162,210 (7,940)
LME Aluminum Forward
Sep-23 1 54,163 (404)
LME Aluminum Forward
Sep-23 1 54,274 (1,801)
LME Aluminum Forward
Sep-23 128 6,956,000 28,953
LME Aluminum Forward
Sep-23 2,227 121,023,530 (1,609,586)
LME Aluminum Forward
Sep-23 3 163,369 (1,019)
LME Aluminum Forward
Sep-23 1 54,481 (605)
LME Aluminum Forward
Sep-23 16 871,900 (6,604)
LME Aluminum Forward
Oct-23 17 927,031 20,931
LME Aluminum Forward
Oct-23 1 54,567 1,154
LME Aluminum Forward
Oct-23 1 54,620 (387)
LME Aluminum Forward
Oct-23 5 273,151 (5,824)
LME Aluminum Forward
Oct-23 9 491,767 (19,783)
LME Aluminum Forward
Oct-23 1 54,683 940
LME Aluminum Forward
Oct-23 147 8,039,981 10,835
LME Aluminum Forward
Oct-23 2 109,432 644
LME Aluminum Forward
Oct-23 1 54,739 957
LME Aluminum Forward
Oct-23 1 54,850 1,369
LME Aluminum Forward
Oct-23 1 54,875 977
LME Aluminum Forward
Oct-23 4 219,700 (8,913)
LME Aluminum Forward
Nov-23 1 54,938 (1,625)
LME Aluminum Forward
Nov-23 4 220,225 3,185
LME Aluminum Forward
Nov-23 8 440,300 7,700
LME Aluminum Forward
Nov-23 1 55,188 1,225

The accompanying notes are an integral part of the consolidated nancial statements.
15
Abbey Capital Futures Strategy Fund
Consolidated Portfolio of Investments (Continued)
August 31, 2023
Long Contracts
Expiration
Date
Number of
Contracts
Notional
Amount
Value and
Unrealized
Appreciation/
(Depreciation)
LME Aluminum Forward
Dec-23 321 $ 17,793,431 $ 175,153
LME Copper Forward
Sep-23 2 422,278 12,015
LME Copper Forward
Sep-23 1 210,461 523
LME Copper Forward
Sep-23 11 2,315,558 (9,805)
LME Copper Forward
Sep-23 1 210,550 (4,325)
LME Copper Forward
Sep-23 69 14,524,500 (34,392)
LME Copper Forward
Sep-23 520 109,459,999 411,285
LME Copper Forward
Sep-23 1 210,285 (5,028)
LME Copper Forward
Sep-23 5 1,051,338 (25,319)
LME Copper Forward
Sep-23 6 1,261,500 (37,274)
LME Copper Forward
Oct-23 5 1,051,364 (31,072)
LME Copper Forward
Oct-23 7 1,472,100 (35,038)
LME Copper Forward
Oct-23 55 11,565,813 (281,013)
LME Copper Forward
Oct-23 4 841,050 988
LME Copper Forward
Oct-23 2 420,550 (4,925)
LME Copper Forward
Oct-23 1 210,400 (4,950)
LME Copper Forward
Nov-23 5 1,052,213 (44,163)
LME Copper Forward
Nov-23 1 210,493 (3,082)
LME Copper Forward
Nov-23 1 210,502 (1,336)
LME Copper Forward
Nov-23 2 421,021 (1,892)
LME Copper Forward
Nov-23 6 1,262,925 (7,658)
LME Copper Forward
Nov-23 17 3,577,650 2,208
LME Copper Forward
Nov-23 1 210,428 3,078
LME Copper Forward
Dec-23 81 17,066,700 145,775
LME Lead Forward
Sep-23 3 164,700 12,615
LME Lead Forward
Sep-23 1 56,180 3,780
LME Lead Forward
Sep-23 6 338,010 18,223
LME Lead Forward
Sep-23 31 1,745,998 124,925
LME Lead Forward
Sep-23 931 52,436,247 2,794,824
LME Lead Forward
Sep-23 4 224,790 10,165
LME Lead Forward
Sep-23 5 279,488 12,068
LME Lead Forward
Sep-23 1 55,873 2,130
LME Lead Forward
Oct-23 1 55,781 731
LME Lead Forward
Oct-23 2 111,529 4,885
LME Lead Forward
Oct-23 4 222,857 7,193
LME Lead Forward
Oct-23 5 278,488 13,875
LME Lead Forward
Oct-23 30 1,669,425 52,319
LME Lead Forward
Oct-23 2 111,270 6,733
LME Lead Forward
Oct-23 1 55,623 3,223
LME Lead Forward
Oct-23 2 111,120 3,095
LME Lead Forward
Nov-23 1 55,550 1,962
LME Lead Forward
Nov-23 2 111,083 4,833
LME Lead Forward
Nov-23 1 55,539 2,127
LME Lead Forward
Nov-23 26 1,443,585 38,824
LME Lead Forward
Nov-23 4 221,750 2,538
LME Lead Forward
Nov-23 5 277,250 7,083
LME Lead Forward
Nov-23 2 110,900 675
LME Lead Forward
Dec-23 223 12,375,943 554,868
LME Nickel Forward
Sep-23 2 245,007 (14,133)
LME Nickel Forward
Sep-23 1 120,572 (6,437)
LME Nickel Forward
Sep-23 1 120,607 (5,123)

The accompanying notes are an integral part of the consolidated nancial statements.
16
Abbey Capital Futures Strategy Fund
Consolidated Portfolio of Investments (Continued)
August 31, 2023
Long Contracts
Expiration
Date
Number of
Contracts
Notional
Amount
Value and
Unrealized
Appreciation/
(Depreciation)
LME Nickel Forward
Sep-23 4 $ 482,464 $ (43,376)
LME Nickel Forward
Sep-23 1 120,625 (14,105)
LME Nickel Forward
Sep-23 2 241,267 (29,356)
LME Nickel Forward
Sep-23 22 2,654,916 (94,434)
LME Nickel Forward
Sep-23 44 5,309,832 (241,443)
LME Nickel Forward
Sep-23 1 120,786 (12,851)
LME Nickel Forward
Sep-23 1 120,807 (12,846)
LME Nickel Forward
Sep-23 3 362,486 (32,017)
LME Nickel Forward
Sep-23 4 483,400 (39,189)
LME Nickel Forward
Oct-23 1 120,935 (12,816)
LME Nickel Forward
Oct-23 2 241,956 (25,612)
LME Nickel Forward
Oct-23 1 120,990 (2,610)
LME Nickel Forward
Oct-23 2 242,100 (6,448)
LME Nickel Forward
Oct-23 2 242,148 (13,932)
LME Nickel Forward
Oct-23 27 3,270,618 (16,236)
LME Nickel Forward
Oct-23 1 121,157 (4,483)
LME Nickel Forward
Oct-23 2 242,359 (12,581)
LME Nickel Forward
Oct-23 1 121,270 (3,830)
LME Nickel Forward
Oct-23 1 121,293 (8,517)
LME Nickel Forward
Oct-23 2 242,631 (12,447)
LME Nickel Forward
Oct-23 5 606,692 (21,736)
LME Nickel Forward
Oct-23 1 121,429 (9,971)
LME Nickel Forward
Nov-23 1 121,626 (2,067)
LME Nickel Forward
Nov-23 5 608,670 (3,240)
LME Nickel Forward
Dec-23 1 122,106 (1,588)
LME Zinc Forward
Sep-23 2 120,815 2,605
LME Zinc Forward
Sep-23 1 60,479 842
LME Zinc Forward
Sep-23 2 120,975 (3,275)
LME Zinc Forward
Sep-23 5 302,646 (5,612)
LME Zinc Forward
Sep-23 60 3,632,250 31,760
LME Zinc Forward
Sep-23 504 30,510,900 83,331
LME Zinc Forward
Sep-23 2 121,150 3,025
LME Zinc Forward
Oct-23 1 60,590 1,290
LME Zinc Forward
Oct-23 1 60,594 (1,496)
LME Zinc Forward
Oct-23 1 60,604 1,566
LME Zinc Forward
Oct-23 4 242,700 (6,013)
LME Zinc Forward
Oct-23 58 3,520,600 1,715
LME Zinc Forward
Oct-23 80 4,856,000 (138,000)
LME Zinc Forward
Oct-23 1 60,713 1,147
LME Zinc Forward
Oct-23 4 242,875 (5,225)
LME Zinc Forward
Oct-23 5 303,719 (14,694)
LME Zinc Forward
Nov-23 1 60,800 (1,563)
LME Zinc Forward
Nov-23 1 60,788 (265)
LME Zinc Forward
Nov-23 3 182,138 7,763
LME Zinc Forward
Nov-23 2 121,450 2,100
LME Zinc Forward
Nov-23 1 60,750 (238)
LME Zinc Forward
Nov-23 5 303,813 (1,600)
LME Zinc Forward
Dec-23 9 547,538 6,349
Long Gilt Futures
Dec-23 123 14,891,384 122,234
Low Sulphur Gasoil G Futures
Sep-23 180 16,119,000 423,000
Low Sulphur Gasoil G Futures
Oct-23 238 21,021,350 36,375

The accompanying notes are an integral part of the consolidated nancial statements.
17
Abbey Capital Futures Strategy Fund
Consolidated Portfolio of Investments (Continued)
August 31, 2023
Long Contracts
Expiration
Date
Number of
Contracts
Notional
Amount
Value and
Unrealized
Appreciation/
(Depreciation)
Low Sulphur Gasoil G Futures
Nov-23 60 $ 5,140,500 $ 25,475
Low Sulphur Gasoil G Futures
Dec-23 28 2,321,900 (8,600)
Low Sulphur Gasoil G Futures
Jan-24 7 571,025 (1,450)
Micro E-mini Dow Jones Industrial Index Futures
Sep-23 6 104,373 (956)
Micro E-mini Nasdaq 100 Index Futures
Sep-23 1 31,077 (95)
Micro E-mini S&P 500 Index Futures
Sep-23 2 45,160 1,661
Micro EUR/USD Futures
Sep-23 2 27,131 (640)
Milk Futures
Sep-23 2 75,560 (80)
Mini FTSE/MIB Pound Futures
Sep-23 7 219,228 7,888
Mini TOPIX Index Futures
Sep-23 20 320,355 13,033
MSCI EAFE Index Futures
Sep-23 14 1,476,510 (40,335)
MXN Currency Futures
Sep-23 1,203 35,338,125 101,001
Nasdaq 100 E-Mini
Sep-23 388 120,578,759 1,677,376
Natural Gas Futures
Oct-23 5 138,400 (4,400)
Nikkei 225 (Chicago Mercantile Exchange)
Sep-23 12 1,950,000 8,950
Nikkei 225 (Osaka Securities Exchange)
Sep-23 144 32,274,923 122,872
Nikkei 225 (Osaka Securities Exchange)
Dec-23 2 64,670,618 619
Nikkei 225 (Singapore Exchange)
Sep-23 829 92,873,981 1,182,784
Nikkei 225 Mini
Sep-23 201 4,505,041 54,425
Nikkei/Yen Futures
Sep-23 55 6,142,823 23,571
NY Harbor Ultra-Low Sulfur Diesel Futures
Oct-23 268 35,041,054 1,058,045
NY Harbor Ultra-Low Sulfur Diesel Futures
Nov-23 64 8,161,037 120,704
NY Harbor Ultra-Low Sulfur Diesel Futures
Dec-23 43 5,301,694 59,594
NY Harbor Ultra-Low Sulfur Diesel Futures
Jan-24 16 1,936,637 (7,518)
OAT Futures
Dec-23 6 147,975 8,988
OMX Stockholm 30 ESG Responsible Index
Sep-23 4 76,575 295
OMX Stockholm 30 Index Futures
Sep-23 319 6,377,961 4,832
Orange Juice Futures
Nov-23 17 812,303 16,358
Palm Oil Futures
Nov-23 17 367,295 7,689
Palm Oil Futures
Dec-23 6 130,409 4,418
Palm Oil Futures
Jan-24 1 21,880 1,024
Platinum Futures
Oct-23 2 97,440 (1,040)
Rough Rice Futures
Nov-23 6 200,280 7,920
Russell 2000 E-Mini
Sep-23 174 16,543,920 (354,151)
S&P 500 E-Mini Futures
Sep-23 933 210,671,399 1,143,520
S&P Mid 400 E-Mini
Sep-23 24 6,356,880 (110,970)
S&P/TSX 60 IX Futures
Sep-23 81 14,580,240 134,251
SGX Iron Ore 62% Futures
Oct-23 189 2,157,624 59,194
SGX Iron Ore 62% Futures
Nov-23 20 224,940 4,890
SGX Iron Ore 62% Futures
Dec-23 10 111,180 2,295
Silver Futures
Dec-23 243 30,146,580 127,327
Silver Futures
Mar-24 3 377,640 (2,285)
Soybean Futures
Nov-23 816 55,844,999 (450,309)
Soybean Futures
Jan-24 46 3,178,600 (23,975)
Soybean Futures
Mar-24 259 17,938,988 233,663
Soybean Meal Futures
Dec-23 617 24,926,800 (130,256)
Soybean Meal Futures
Jan-24 16 642,240 (8,890)
Soybean Oil Futures
Dec-23 444 16,644,672 156,498
Soybean Oil Futures
Jan-24 32 1,187,328 42,774
Soybean Oil Futures
Mar-24 1 36,726 5,046
SPI 200 Futures
Sep-23 535 63,047,517 412,825

The accompanying notes are an integral part of the consolidated nancial statements.
18
Abbey Capital Futures Strategy Fund
Consolidated Portfolio of Investments (Continued)
August 31, 2023
Long Contracts
Expiration
Date
Number of
Contracts
Notional
Amount
Value and
Unrealized
Appreciation/
(Depreciation)
STOXX Dividend Futures
Dec-24 5 $ 79,375 $ 7,981
STOXX Europe 600 Banks Index
Sep-23 1 8,561 (179)
STOXX Europe 600 ESG-X Index
Sep-23 40 741,263 (7,243)
STOXX Europe 600 Index
Sep-23 61 1,519,030 6,211
STOXX Europe 600 Institutional Index
Sep-23 1 16,349 (141)
Sugar No. 11 (World)
Oct-23 497 13,949,398 106,837
Sugar No. 11 (World)
Mar-24 1,076 30,646,202 73,864
Sugar No. 11 (World)
May-24 153 4,116,067 42,000
Sugar No. 11 (World)
Jul-24 5 127,960 1,758
Topix Index Futures
Sep-23 366 58,624,901 2,054,033
Topix Index Futures
Dec-23 2 46,175,241 241
U.S. Treasury 2-Year Notes (Chicago Board of Trade)
Dec-23 93 18,953,836 (4,739)
U.S. Treasury 5-Year Notes (Chicago Board of Trade)
Dec-23 17 1,817,672 222
UK Natural Gas Futures
Nov-23 5 214,210 (11,819)
USD/BRL Futures
Oct-23 4 80,420 (1,230)
USD/CNH Futures
Sep-23 4 400,783 5,070
USD/NOK Futures
Sep-23 9 899,695 1,744
USD/SEK Futures
Sep-23 4 399,461 10,533
USD/TRY Futures
Oct-23 79 82,368 264
White Sugar ICE
Oct-23 3 107,280 3,990
White Sugar ICE
Dec-23 75 2,636,625 72,460
White Sugar ICE
Mar-24 23 798,445 30,500
WTI Crude Futures
Oct-23 500 41,815,000 1,519,231
WTI Crude Futures
Nov-23 50 4,148,000 161,410
WTI Crude Futures
Dec-23 45 3,701,700 161,360
WTI Crude Futures
Jan-24 23 1,876,340 50,760
WTI Crude Futures IPE
Oct-23 13 1,087,190 36,480
WTI Crude Futures IPE
Nov-23 13 1,078,480 36,860
WTI Crude Futures IPE
Dec-23 13 1,069,380 32,230
WTI Crude Futures IPE
Jan-24 15 1,223,700 28,800
WTI Crude Futures IPE
Feb-24 15 1,213,950 17,270
$ 17,403,499
Short Contracts
Expiration
Date
Number of
Contracts
Notional
Amount
Value and
Unrealized
Appreciation/
(Depreciation)
1-Month SOFR Future
Jan-24 7 $ (2,759,242) $ (146)
3-Month Euro Euribor
Dec-23 61 (15,898,060) (2,413)
3-Month Euro Euribor
Mar-24 92 (23,999,848) 20,833
3-Month Euro Euribor
Jun-24 1,457 (380,815,256) (641,557)
3-Month Euro Euribor
Sep-24 107 (28,031,793) (30,484)
3-Month Euro Euribor
Dec-24 1,410 (370,155,386) (692,609)
3-Month Euro Euribor
Mar-25 100 (26,290,107) (46,776)
3-Month Euro Euribor
Jun-25 181 (47,634,161) (84,688)
3-Month Euro Euribor
Sep-25 92 (24,230,544) (44,309)
3-Month Euro Euribor
Dec-25 81 (21,346,589) (37,234)
3-Month Euro Euribor
Mar-26 213 (52,776,778) (31,541)
3-Month Euro Euribor
Jun-26 283 (74,638,830) (153,517)

The accompanying notes are an integral part of the consolidated nancial statements.
19
Abbey Capital Futures Strategy Fund
Consolidated Portfolio of Investments (Continued)
August 31, 2023
Short Contracts
Expiration
Date
Number of
Contracts
Notional
Amount
Value and
Unrealized
Appreciation/
(Depreciation)
3-Month Euro Euribor
Sep-26 26 $ (6,858,335) $ (9,949)
3-Month SARON Futures
Dec-23 1 (277,877) (14)
3-Month SARON Futures
Mar-24 1 (277,891) (85)
3-Month SOFR Futures
Mar-24 1,328 (314,735,999) 198,150
3-Month SOFR Futures
Jun-24 343 (81,561,113) 217,400
3-Month SOFR Futures
Sep-24 229 (54,665,163) 248,963
3-Month SOFR Futures
Mar-25 464 (111,476,000) 273,988
3-Month SOFR Futures
Jun-25 238 (57,283,625) 118,113
3-Month SOFR Futures
Sep-25 222 (53,482,575) 82,313
3-Month SOFR Futures
Dec-25 197 (47,479,463) 76,488
3-Month SOFR Futures
Mar-26 526 (126,805,450) 153,088
3-Month SOFR Futures
Jun-26 167 (40,267,875) 39,200
3-Month SOFR Futures
Sep-26 126 (30,384,900) (3,025)
3-Month SOFR Futures
Dec-26 55 (13,263,938) 2,825
3-Month SOFR Futures
Mar-27 53 (12,780,950) 550
3-Month SOFR Futures
Jun-27 54 (13,020,750) 7,413
3-Month SOFR Futures
Sep-27 55 (13,259,125) 1,000
3-Month SOFR Futures
Dec-24 1,331 (318,874,324) 835,200
90-DAY Bank Bill
Sep-23 14 (8,979,409) (4,255)
90-DAY Bank Bill
Dec-23 92 (58,993,144) (49,975)
90-DAY Bank Bill
Mar-24 280 (179,535,589) (75,170)
90-DAY Bank Bill
Jun-24 151 (96,823,341) (78,441)
90-DAY Bank Bill
Sep-24 51 (32,709,905) (17,303)
90-DAY Bank Bill
Dec-24 14 (8,981,820) (5,916)
90-DAY Bank Bill
Mar-25 9 (5,775,578) (3,649)
AUD/USD Currency Futures
Sep-23 2,405 (155,795,900) 5,344,239
Australian 10-Year Bond Futures
Sep-23 1,519 (114,340,899) (154,753)
Australian 3-Year Bond Futures
Sep-23 3,218 (221,827,069) (844,881)
Bank Acceptance Futures
Dec-23 25 (4,366,489) 4,394
Bank Acceptance Futures
Mar-24 239 (41,770,167) 15,264
Bank Acceptance Futures
Jun-24 72 (12,600,133) 43,073
Bank Acceptance Futures
Sep-24 47 (8,250,740) 27,809
Bank Acceptance Futures
Dec-24 35 (6,161,005) 16,522
Bank Acceptance Futures
Mar-25 22 (3,881,994) 10,731
Bank Acceptance Futures
Jun-25 15 (3,583,784) (259)
Brent Crude Futures
Nov-23 154 (13,371,820) (534,370)
CAD Currency Futures
Sep-23 1,204 (89,077,940) (19,872)
Canadian 10-Year Bond Futures
Dec-23 1,863 (164,501,576) (1,292,385)
Canadian 5-Year Bond Futures
Dec-23 3 (243,983) (1,443)
CHF Currency Futures
Sep-23 369 (52,303,444) 9,640
Coee ‘C’ Futures
Dec-23 492 (28,505,250) 728,657
Coee ‘C’ Futures
Mar-24 67 (3,910,706) 49,238
Coee ‘C’ Futures
May-24 19 (1,115,775) 18,000
Copper Futures
Dec-23 143 (13,663,650) (191,055)
Copper Futures
Mar-24 6 (576,600) (5,138)
Corn Futures
Dec-23 1,608 (38,451,300) 839,042
Corn Futures
Mar-24 615 (15,190,500) 498,775
Corn Futures
May-24 32 (804,000) 22,525
DAX Index Futures
Sep-23 39 (16,914,830) (281,498)
DAX-Mini Futures
Sep-23 2 (173,485) (4,402)
Dollar Index
Sep-23 3 (310,761) 1,894

The accompanying notes are an integral part of the consolidated nancial statements.
20
Abbey Capital Futures Strategy Fund
Consolidated Portfolio of Investments (Continued)
August 31, 2023
Short Contracts
Expiration
Date
Number of
Contracts
Notional
Amount
Value and
Unrealized
Appreciation/
(Depreciation)
Dutch TTF Gas Futures
Oct-23 45 $ (1,273,405) $ 206,133
Dutch TTF Gas Futures
Nov-23 5 (177,714) (1,874)
Emerging Market ESG Leaders NTR Index Futures
Sep-23 2 (28,970) (410)
E-Mini Consumer Staples Select Futures
Sep-23 2 (146,340) (800)
E-Mini Financial Select Futures
Sep-23 2 (211,850) (3,063)
E-Mini Natural Gas
Oct-23 3 (20,760) (673)
E-Mini Utilities Select Futures
Sep-23 3 (190,170) 5,130
EUR Foreign Exchange Currency Futures
Sep-23 1,117 (151,528,031) 236,022
Euro BUXL 30-Year Bond Futures
Sep-23 129 (18,716,128) (174,754)
Euro BUXL 30-Year Bond Futures
Dec-23 33 (4,417,309) (41,509)
Euro STOXX 50
Sep-23 2 (93,536) (4)
Euro/GBP Futures
Sep-23 1 (135,690) 1,979
Euro-Bobl Futures
Sep-23 982 (123,637,805) (666,052)
Euro-Bobl Futures
Dec-23 970 (122,422,075) (521,823)
Euro-BTP Futures
Sep-23 120 (15,083,766) (100,346)
Euro-Bund Futures
Sep-23 533 (76,978,423) (576,539)
Euro-Bund Futures
Dec-23 423 (59,931,631) (278,646)
Euro-Oat Futures
Sep-23 427 (59,224,656) (634,693)
European Climate Exchange Futures
Dec-23 13 (1,201,616) 12,600
European Climate Exchange Futures
Dec-24 1 (89,921) 1,139
Euro-Scha Futures
Sep-23 2,215 (252,481,320) (131,722)
Euro-Scha Futures
Dec-23 238 (25,105,620) (17,745)
FTSE 100 Index Futures
Sep-23 1,230 (107,765,581) (874,371)
FTSE China A50 Index
Sep-23 1,247 (15,734,646) 23,872
FTSE KLCI Futures
Sep-23 6 (92,554) (323)
FTSE/JSE TOP 40
Sep-23 385 (14,070,999) (95,528)
Gasoline RBOB Futures
Oct-23 10 (1,077,678) (3,283)
GBP Currency Futures
Sep-23 277 (21,926,281) (59,031)
Gold 100 Oz Futures
Dec-23 1,315 (258,515,849) 242,089
Gold 100 Oz Futures
Feb-24 1 (198,630) (3,970)
Hang Seng China Enterprises Index Futures
Sep-23 229 (9,211,276) (62,367)
Hang Seng Index Futures
Sep-23 452 (52,748,270) (296,058)
Ice Three Miont SONIA Index Futures
Dec-23 80 (23,889,332) (51,701)
Ice Three Miont SONIA Index Futures
Mar-24 1,779 (531,210,855) (728,173)
Ice Three Miont SONIA Index Futures
Jun-24 244 (72,943,602) (48,328)
Ice Three Miont SONIA Index Futures
Sep-24 95 (28,460,346) 58,320
Ice Three Miont SONIA Index Futures
Dec-24 200 (60,065,366) (21,995)
Ice Three Miont SONIA Index Futures
Mar-25 224 (67,415,093) (101,233)
Ice Three Miont SONIA Index Futures
Jun-25 90 (27,132,026) 23,087
Ice Three Miont SONIA Index Futures
Sep-25 82 (24,756,648) 713
Ice Three Miont SONIA Index Futures
Dec-25 65 (19,647,845) 15,534
Ice Three Miont SONIA Index Futures
Mar-26 294 (82,650,222) (104,780)
Ice Three Miont SONIA Index Futures
Jun-26 26 (7,873,548) 6,081
Ice Three Miont SONIA Index Futures
Sep-26 16 (4,848,301) (4,165)
INR/USD Futures
Sep-23 4 (96,592) 248
INR/USD Standard Futures
Sep-23 2 (120,830) 70
JPN 10-Year Bond (Osaka Securities Exchange)
Sep-23 26 (26,236,778) (50,586)
JPY Currency Futures
Sep-23 2,849 (245,441,350) 8,583,638
Kansas City Hard Red Winter Wheat Futures
Dec-23 337 (12,254,163) 481,125
Kansas City Hard Red Winter Wheat Futures
Mar-24 24 (880,500) 32,438
Lean Hogs Futures
Oct-23 22 (726,440) (31,480)

The accompanying notes are an integral part of the consolidated nancial statements.
21
Abbey Capital Futures Strategy Fund
Consolidated Portfolio of Investments (Continued)
August 31, 2023
Short Contracts
Expiration
Date
Number of
Contracts
Notional
Amount
Value and
Unrealized
Appreciation/
(Depreciation)
Lean Hogs Futures
Dec-23 245 $ (7,283,850) $ (149,530)
Lean Hogs Futures
Feb-24 56 (1,762,880) (40,120)
LME Aluminum Forward
Sep-23 3 (162,210) (710)
LME Aluminum Forward
Sep-23 1 (54,163) 1,300
LME Aluminum Forward
Sep-23 1 (54,274) (393)
LME Aluminum Forward
Sep-23 2,227 (121,023,531) 2,235,188
LME Aluminum Forward
Sep-23 128 (6,956,000) 272,525
LME Aluminum Forward
Sep-23 3 (163,369) (1,619)
LME Aluminum Forward
Sep-23 1 (54,481) (56)
LME Aluminum Forward
Sep-23 16 (871,900) (2,500)
LME Aluminum Forward
Oct-23 17 (927,031) 5,498
LME Aluminum Forward
Oct-23 1 (54,567) (967)
LME Aluminum Forward
Oct-23 1 (54,620) (245)
LME Aluminum Forward
Oct-23 5 (273,151) 1,886
LME Aluminum Forward
Oct-23 9 (491,767) (3,965)
LME Aluminum Forward
Oct-23 1 (54,683) 1,367
LME Aluminum Forward
Oct-23 147 (8,039,981) (31,461)
LME Aluminum Forward
Oct-23 2 (109,432) (170)
LME Aluminum Forward
Oct-23 1 (54,739) 99
LME Aluminum Forward
Oct-23 1 (54,850) 938
LME Aluminum Forward
Oct-23 1 (54,875) 463
LME Aluminum Forward
Oct-23 4 (219,700) (4,321)
LME Aluminum Forward
Nov-23 1 (54,938) (981)
LME Aluminum Forward
Nov-23 1 (54,963) 1
LME Aluminum Forward
Nov-23 3 (165,169) (2,194)
LME Aluminum Forward
Nov-23 138 (7,597,763) (36,104)
LME Aluminum Forward
Nov-23 8 (440,300) (12,700)
LME Aluminum Forward
Nov-23 18 (993,375) (24,480)
LME Aluminum Forward
Dec-23 881 (48,834,931) (674,861)
LME Copper Forward
Sep-23 2 (422,278) (8,265)
LME Copper Forward
Sep-23 1 (210,461) (2,451)
LME Copper Forward
Sep-23 11 (2,315,558) 53,647
LME Copper Forward
Sep-23 1 (210,550) (2,575)
LME Copper Forward
Sep-23 520 (109,460,000) (1,770,682)
LME Copper Forward
Sep-23 69 (14,524,500) (183,951)
LME Copper Forward
Sep-23 1 (210,285) (1,410)
LME Copper Forward
Sep-23 5 (1,051,338) (19,338)
LME Copper Forward
Sep-23 6 (1,261,500) (38,625)
LME Copper Forward
Oct-23 5 (1,051,364) (8,001)
LME Copper Forward
Oct-23 7 (1,472,100) 13,895
LME Copper Forward
Oct-23 55 (11,565,813) (15,797)
LME Copper Forward
Oct-23 4 (841,050) 25,125
LME Copper Forward
Oct-23 2 (420,550) 7,529
LME Copper Forward
Oct-23 1 (210,400) 5,045
LME Copper Forward
Nov-23 5 (1,052,213) 6,330
LME Copper Forward
Nov-23 5 (1,052,509) (13,146)
LME Copper Forward
Nov-23 4 (842,041) (229)
LME Copper Forward
Nov-23 7 (1,473,413) (28,275)
LME Copper Forward
Nov-23 35 (7,365,750) (140,173)
LME Copper Forward
Nov-23 1 (210,428) 1,254
LME Copper Forward
Dec-23 170 (35,819,000) (381,486)

The accompanying notes are an integral part of the consolidated nancial statements.
22
Abbey Capital Futures Strategy Fund
Consolidated Portfolio of Investments (Continued)
August 31, 2023
Short Contracts
Expiration
Date
Number of
Contracts
Notional
Amount
Value and
Unrealized
Appreciation/
(Depreciation)
LME Lead Forward
Sep-23 3 $ (164,700) $ (15,963)
LME Lead Forward
Sep-23 1 (56,180) (5,392)
LME Lead Forward
Sep-23 6 (338,010) (17,548)
LME Lead Forward
Sep-23 931 (52,436,248) (4,402,300)
LME Lead Forward
Sep-23 31 (1,745,998) (143,473)
LME Lead Forward
Sep-23 4 (224,790) (15,290)
LME Lead Forward
Sep-23 5 (279,488) (17,988)
LME Lead Forward
Sep-23 1 (55,873) (3,810)
LME Lead Forward
Oct-23 1 (55,781) (3,793)
LME Lead Forward
Oct-23 2 (111,529) (9,316)
LME Lead Forward
Oct-23 4 (222,857) (16,045)
LME Lead Forward
Oct-23 5 (278,488) (8,183)
LME Lead Forward
Oct-23 30 (1,669,425) (111,197)
LME Lead Forward
Oct-23 2 (111,270) (3,714)
LME Lead Forward
Oct-23 1 (55,623) (1,854)
LME Lead Forward
Oct-23 2 (111,120) (3,616)
LME Lead Forward
Nov-23 2 (111,083) (1,395)
LME Lead Forward
Nov-23 4 (222,090) (11,103)
LME Lead Forward
Nov-23 4 (221,750) (2,700)
LME Lead Forward
Dec-23 10 (554,975) (18,533)
LME Nickel Forward
Sep-23 2 (245,007) 6,261
LME Nickel Forward
Sep-23 1 (120,572) 8,789
LME Nickel Forward
Sep-23 1 (120,607) 6,447
LME Nickel Forward
Sep-23 4 (482,464) 25,151
LME Nickel Forward
Sep-23 1 (120,625) 6,452
LME Nickel Forward
Sep-23 2 (241,267) 25,311
LME Nickel Forward
Sep-23 44 (5,309,832) 294,234
LME Nickel Forward
Sep-23 22 (2,654,916) 123,932
LME Nickel Forward
Sep-23 1 (120,786) 4,134
LME Nickel Forward
Sep-23 1 (120,807) 2,193
LME Nickel Forward
Sep-23 3 (362,486) (1,286)
LME Nickel Forward
Sep-23 4 (483,400) (880)
LME Nickel Forward
Oct-23 1 (120,935) 1,975
LME Nickel Forward
Oct-23 2 (241,956) 3,354
LME Nickel Forward
Oct-23 1 (120,990) 12,810
LME Nickel Forward
Oct-23 2 (242,100) 16,372
LME Nickel Forward
Oct-23 2 (242,148) 14,885
LME Nickel Forward
Oct-23 27 (3,270,618) 100,044
LME Nickel Forward
Oct-23 1 (121,157) 12,835
LME Nickel Forward
Oct-23 2 (242,359) 25,625
LME Nickel Forward
Oct-23 1 (121,270) 12,779
LME Nickel Forward
Oct-23 1 (121,293) 12,651
LME Nickel Forward
Oct-23 2 (242,631) 22,485
LME Nickel Forward
Oct-23 5 (606,692) 46,096
LME Nickel Forward
Oct-23 1 (121,429) 12,719
LME Nickel Forward
Nov-23 1 (121,486) 7,214
LME Nickel Forward
Nov-23 3 (364,698) 9,522
LME Nickel Forward
Nov-23 1 (121,578) 1,992
LME Nickel Forward
Nov-23 1 (121,590) 1,350
LME Nickel Forward
Nov-23 1 (121,626) (1,116)
LME Nickel Forward
Nov-23 25 (3,040,650) 2,325

The accompanying notes are an integral part of the consolidated nancial statements.
23
Abbey Capital Futures Strategy Fund
Consolidated Portfolio of Investments (Continued)
August 31, 2023
Short Contracts
Expiration
Date
Number of
Contracts
Notional
Amount
Value and
Unrealized
Appreciation/
(Depreciation)
LME Nickel Forward
Nov-23 2 $ (243,219) $ (2,529)
LME Nickel Forward
Nov-23 1 (121,593) (813)
LME Nickel Forward
Nov-23 7 (852,057) 20,569
LME Nickel Forward
Dec-23 37 (4,517,922) 44,593
LME Zinc Forward
Sep-23 2 (120,815) (5,990)
LME Zinc Forward
Sep-23 1 (60,479) (1,367)
LME Zinc Forward
Sep-23 2 (120,975) (2,750)
LME Zinc Forward
Sep-23 5 (302,646) (5,384)
LME Zinc Forward
Sep-23 504 (30,510,900) 848,584
LME Zinc Forward
Sep-23 60 (3,632,250) (56,435)
LME Zinc Forward
Sep-23 2 (121,150) (3,725)
LME Zinc Forward
Oct-23 2 (121,180) (2,841)
LME Zinc Forward
Oct-23 1 (60,594) (1,119)
LME Zinc Forward
Oct-23 1 (60,604) (1,520)
LME Zinc Forward
Oct-23 80 (4,856,000) 147,038
LME Zinc Forward
Oct-23 58 (3,520,600) (40,393)
LME Zinc Forward
Oct-23 1 (60,713) 925
LME Zinc Forward
Oct-23 8 (485,750) 8,790
LME Zinc Forward
Oct-23 5 (303,719) 6,219
LME Zinc Forward
Nov-23 1 (60,781) 681
LME Zinc Forward
Nov-23 1 (60,800) 313
LME Zinc Forward
Nov-23 3 (182,400) (7,038)
LME Zinc Forward
Nov-23 85 (5,166,938) 132,900
LME Zinc Forward
Nov-23 60 (3,647,250) (23,518)
LME Zinc Forward
Nov-23 1 (60,750) (3,888)
LME Zinc Forward
Nov-23 5 (303,563) (18,588)
LME Zinc Forward
Nov-23 1 (60,718) (3,368)
LME Zinc Forward
Nov-23 1 (60,750) (1,164)
LME Zinc Forward
Dec-23 337 (20,502,238) (558,463)
Long Gilt Futures
Dec-23 1,052 (127,363,711) (1,270,183)
Low Sulphur Gasoil G Futures
Oct-23 22 (1,943,150) 18,363
Lumber Futures
Nov-23 4 (55,880) 44
MAIZE Futures
Nov-23 12 (137,930) 2,928
Micro E-mini Russell 200 Index Futures
Sep-23 1 (9,508) (252)
Micro Gold Futures
Dec-23 32 (629,088) (13,981)
Mill Wheat Euro
Sep-23 11 (133,741) 4,121
Mill Wheat Euro
Dec-23 177 (2,269,575) 122,112
Mill Wheat Euro
Mar-24 40 (526,995) 5,734
Mill Wheat Euro
May-24 3 (40,094) 407
Mini H-Shares Index Futures
Sep-23 4 (32,179) 15
Mini HSI Index Futures
Sep-23 51 (1,190,337) (4,658)
MSCI China A 50 Connect Index
Sep-23 2 (101,880) 1,235
MSCI EAFE Index Futures
Sep-23 1 (105,465) 140
MSCI Emerging Markets Index Futures
Sep-23 146 (7,148,890) (60,395)
MSCI Singapore Exchange ETS
Sep-23 244 (5,130,238) (37,268)
MXN Currency Futures
Sep-23 2 (58,750) 220
Natural Gas Futures
Oct-23 774 (21,424,320) (621,535)
Natural Gas Futures
Nov-23 401 (12,619,470) 116,380
Natural Gas Futures
Dec-23 125 (4,513,750) 31,970
Natural Gas Futures
Jan-24 33 (1,265,550) 8,870
New Zealand 3-Month Bank Bill Futures
Dec-23 2 (112) 1

The accompanying notes are an integral part of the consolidated nancial statements.
24
Short Contracts
Expiration
Date
Number of
Contracts
Notional
Amount
Value and
Unrealized
Appreciation/
(Depreciation)
New Zealand 3-Month Bank Bill Futures
Mar-24 11 $ (618) $ (1)
NY Harbor Ultra-Low Sulfur Diesel Futures
Oct-23 11 (1,438,252) (14,057)
NYSE FANG+ Index Futures
Sep-23 1 (39,312) (109)
NZD Currency Futures
Sep-23 433 (25,795,975) 435,137
OMX Stockholm 30 ESG Responsible Index
Sep-23 2 (38,287) (504)
OMX Stockholm 30 Index Futures
Sep-23 1,550 (30,990,091) (460,426)
Palladium Futures
Dec-23 39 (4,752,930) 140,790
Phelix DE Baseload Futures
Oct-23 1 (275,607) 64,171
Phelix DE Baseload Futures
Jan-24 1 (1,278,248) 140,969
Platinum Futures
Oct-23 188 (9,159,360) (424,190)
Rapeseed Euro
Nov-23 23 (584,533) (29,942)
Rapeseed Euro
Feb-24 4 (104,640) (2,887)
Red Wheat Futures (Minneapolis Grain Exchange)
Dec-23 45 (1,725,188) 87,363
Red Wheat Futures (Minneapolis Grain Exchange)
Mar-24 9 (353,025) 11,750
Russell 2000 E-Mini
Sep-23 26 (2,472,080) (46,020)
S&P 500 E-Mini Futures
Sep-23 243 (54,869,400) 778,925
S&P/TSX 60 IX Futures
Sep-23 93 (16,740,275) (374,038)
SA Rand Currency Futures
Sep-23 2 (52,900) 1,963
Short BTP Future
Sep-23 346 (39,503,302) (87,214)
Short BTP Future
Dec-23 197 (20,692,665) (22,555)
Silver Futures
Dec-23 185 (22,951,100) (211,903)
Soybean Meal Futures
Dec-23 73 (2,949,200) (94,740)
Soybean Oil Futures
Dec-23 563 (21,105,744) (993,302)
SPI 200 Futures
Sep-23 87 (10,252,587) (266,777)
Sugar No. 11 (World)
Oct-23 573 (16,082,506) (477,104)
U.S. Treasury 10-Year Notes (Chicago Board of Trade)
Dec-23 2,540 (282,019,374) (1,912,824)
U.S. Treasury 2-Year Notes (Chicago Board of Trade)
Dec-23 1,497 (305,095,617) (729,055)
U.S. Treasury 3-Year Notes (Chicago Board of Trade)
Dec-23 3 (624,492) (3,336)
U.S. Treasury 5-Year Notes (Chicago Board of Trade)
Dec-23 2,698 (288,475,218) (1,434,312)
U.S. Treasury Long Bond (Chicago Board of Trade)
Dec-23 1,030 (125,338,125) (1,300,215)
U.S. Treasury Ultra 10-Year Notes
Dec-23 338 (39,244,969) (423,975)
U.S. Treasury Ultra Long Bond (Chicago Board of Trade)
Dec-23 302 (39,099,563) (580,982)
UK Natural Gas Futures
Oct-23 20 (673,338) 125,254
UK Natural Gas Futures
Nov-23 5 (214,210) 4,313
Wheat (Chicago Board of Trade)
Dec-23 1,106 (33,290,600) 1,969,127
Wheat (Chicago Board of Trade)
Mar-24 93 (2,923,688) 194,163
Wheat (Chicago Board of Trade)
May-24 4 (129,100) 5,550
WTI Crude Futures
Oct-23 122 (10,202,860) (191,630)
WTI Crude Futures
Dec-23 4 (329,040) (15,870)
$ (3,526,347)
Total Futures Contracts
$ 13,877,152
Forward foreign currency contracts outstanding as of August 31, 2023 were as follows:
Currency Purchased Currency Sold
Expiration
Date Counterparty
Unrealized
Appreciation/
(Depreciation)
AUD
112,492,936
USD
73,030,281 Sep 01 2023 BOA $ (137,867)
AUD
400,000
USD
258,993 Sep 05 2023 BOA 234
AUD
4,100,000
USD
2,637,723 Sep 20 2023 BOA 20,831
Abbey Capital Futures Strategy Fund
Consolidated Portfolio of Investments (Continued)
August 31, 2023

The accompanying notes are an integral part of the consolidated nancial statements.
25
Currency Purchased Currency Sold
Expiration
Date Counterparty
Unrealized
Appreciation/
(Depreciation)
AUD
1,049,842
EUR
625,000 Sep 22 2023 BOA $ 2,364
AUD
13,400,000
JPY
1,253,583,132 Sep 22 2023 BOA 43,279
AUD
28,206,000
USD
19,166,632 Sep 22 2023 BOA (875,721)
AUD
63,451,000
USD
41,093,885 Oct 18 2023 BOA 92,659
BRL
39,812,867
USD
8,202,101 Sep 05 2023 BOA (167,178)
BRL
116,024,241
USD
23,550,000 Sep 20 2023 BOA (193,252)
BRL
14,785,018
USD
3,000,000 Oct 03 2023 BOA (30,038)
CAD
2,979,568
USD
2,202,059 Sep 01 2023 BOA 3,099
CAD
60,100,999
USD
44,719,753 Sep 20 2023 BOA (226,544)
CAD
19,184,482
AUD
22,000,000 Sep 22 2023 BOA (63,611)
CAD
11,800,000
JPY
1,266,011,380 Sep 22 2023 BOA 3,882
CAD
57,923,000
USD
43,782,105 Sep 22 2023 BOA (899,935)
CHF
14,708,858
USD
16,735,531 Sep 01 2023 BOA (82,571)
CHF
14,708,858
USD
16,721,661 Sep 05 2023 BOA (61,749)
CHF
28,721,364
EUR
30,000,000 Sep 20 2023 BOA 22,634
CHF
14,591,908
USD
16,700,000 Sep 20 2023 BOA (145,547)
CHF
18,058,364
EUR
18,875,000 Sep 22 2023 BOA 2,935
CHF
2,796,314
GBP
2,500,000 Sep 22 2023 BOA 5,769
CHF
10,250,000
JPY
1,700,899,965 Sep 22 2023 BOA (100,434)
CHF
59,618,000
USD
68,028,127 Sep 22 2023 BOA (376,946)
CLP
1,032,912,000
USD
1,200,000 Sep 08 2023 BOA 10,593
CLP
4,946,700,796
USD
5,750,000 Sep 20 2023 BOA 39,240
CLP
87,186,870
USD
100,000 Sep 29 2023 BOA 1,926
CNH
500,000
USD
68,510 Sep 01 2023 BOA 198
CNH
500,000
USD
68,534 Sep 05 2023 BOA 189
CNH
53,411,139
USD
7,392,323 Sep 20 2023 BOA (45,382)
COP
393,431,000
USD
100,000 Sep 05 2023 BOA (3,986)
COP
1,239,076,200
USD
300,000 Sep 11 2023 BOA 1,759
COP
1,205,935,070
USD
300,000 Sep 15 2023 BOA (6,720)
COP
413,974,000
USD
100,000 Sep 18 2023 BOA 573
COP
16,351,329,990
USD
3,950,000 Sep 20 2023 BOA 19,708
COP
411,761,000
USD
100,000 Sep 22 2023 BOA (104)
COP
416,440,000
USD
100,000 Sep 28 2023 BOA 822
CZK
124,966,428
EUR
5,150,000 Sep 20 2023 BOA 35,957
EUR
173,237
NOK
2,000,000 Sep 01 2023 BOA (266)
EUR
133,615,631
USD
145,906,835 Sep 01 2023 BOA (1,013,874)
EUR
258,961
NOK
3,000,000 Sep 05 2023 BOA (1,359)
EUR
500,000
PLN
2,233,444 Sep 05 2023 BOA 1,079
EUR
84,331
SEK
1,000,000 Sep 05 2023 BOA 106
EUR
29
USD
32 Sep 05 2023 BOA 1
EUR
1,300,000
CHF
1,248,148 Sep 20 2023 BOA (5,015)
EUR
1,600,000
CZK
38,924,083 Sep 20 2023 BOA (15,653)
EUR
2,650,000
GBP
2,289,913 Sep 20 2023 BOA (24,863)
EUR
34,500,000
JPY
5,410,495,444 Sep 20 2023 BOA 140,281
EUR
36,676,993
NOK
420,644,631 Sep 20 2023 BOA 217,886
EUR
4,291,967
PLN
19,198,665 Sep 20 2023 BOA 10,076
EUR
57,852,474
SEK
677,831,795 Sep 20 2023 BOA 820,510
EUR
43,500,000
USD
47,808,451 Sep 20 2023 BOA (594,098)
EUR
12,875,000
AUD
21,847,842 Sep 22 2023 BOA (192,071)
EUR
13,625,000
CAD
20,159,223 Sep 22 2023 BOA (134,641)
EUR
900,000
GBP
770,920 Sep 22 2023 BOA 240
EUR
600,000
HUF
231,143,014 Sep 22 2023 BOA (3,026)
Abbey Capital Futures Strategy Fund
Consolidated Portfolio of Investments (Continued)
August 31, 2023

The accompanying notes are an integral part of the consolidated nancial statements.
26
Currency Purchased Currency Sold
Expiration
Date Counterparty
Unrealized
Appreciation/
(Depreciation)
EUR
11,800,000
JPY
1,873,729,080 Sep 22 2023 BOA $ (114,788)
EUR
7,250,000
NOK
83,748,121 Sep 22 2023 BOA (12,973)
EUR
14,250,000
SEK
169,828,690 Sep 22 2023 BOA (60,113)
EUR
49,714,000
USD
54,758,569 Sep 22 2023 BOA (794,346)
EUR
24,028,000
USD
26,306,221 Oct 18 2023 BOA (189,795)
GBP
134,357,403
USD
169,842,889 Sep 01 2023 BOA 362,121
GBP
171,172
EUR
200,000 Sep 05 2023 BOA (73)
GBP
132,457,403
USD
168,355,646 Sep 05 2023 BOA (553,927)
GBP
38,219,704
EUR
44,400,000 Sep 20 2023 BOA 230,170
GBP
50,000,000
USD
63,725,572 Sep 20 2023 BOA (379,489)
GBP
9,500,000
AUD
18,852,542 Sep 22 2023 BOA (189,557)
GBP
22,682,488
EUR
26,500,000 Sep 22 2023 BOA (28,388)
GBP
9,125,000
JPY
1,693,985,349 Sep 22 2023 BOA (123,108)
GBP
45,561,500
USD
58,040,529 Sep 22 2023 BOA (317,169)
GBP
1,028,000
USD
1,310,511 Oct 18 2023 BOA (8,038)
HUF
3,613,312,838
EUR
9,300,000 Sep 20 2023 BOA 138,622
HUF
191,585,050
EUR
500,000 Sep 22 2023 BOA (406)
HUF
528,109,260
USD
1,500,000 Sep 22 2023 BOA (5,022)
HUF
2,781,500,000
USD
7,767,680 Oct 18 2023 BOA 65,929
IDR
27,577,256,000
USD
1,800,000 Sep 27 2023 BOA 10,396
ILS
2,262,694
USD
600,000 Sep 20 2023 BOA (4,563)
INR
2,227,040,736
USD
26,800,000 Sep 05 2023 BOA 96,453
INR
115,796,248
USD
1,400,000 Sep 20 2023 BOA (2,244)
INR
465,378,930
USD
5,600,000 Sep 27 2023 BOA 16,113
JPY
11,523,371,255
USD
78,991,159 Sep 01 2023 BOA 222,345
JPY
267,146,315
USD
1,831,453 Sep 05 2023 BOA 6,100
JPY
882,965,185
EUR
5,600,000 Sep 20 2023 BOA 9,911
JPY
2,165,791,833
USD
14,917,925 Sep 20 2023 BOA 15,298
JPY
2,100,035,000
USD
14,855,660 Sep 22 2023 BOA (371,158)
JPY
36,600,000
USD
253,209 Oct 18 2023 BOA 327
KRW
1,168,262,500
USD
900,000 Sep 01 2023 BOA (16,081)
KRW
1,184,848,106
USD
900,000 Sep 05 2023 BOA (3,358)
KRW
1,183,894,097
USD
900,000 Sep 07 2023 BOA (3,993)
KRW
1,206,418,307
USD
900,000 Sep 11 2023 BOA 13,258
KRW
17,235,945,235
USD
12,900,000 Sep 18 2023 BOA 152,719
KRW
330,285,950
USD
250,000 Sep 20 2023 BOA 152
KRW
17,417,210,037
USD
13,200,000 Sep 27 2023 BOA (3,362)
MXN
370,669,799
USD
21,600,000 Sep 20 2023 BOA 63,487
MXN
627,257,000
USD
36,313,862 Sep 22 2023 BOA 332,520
MXN
460,000
USD
26,641 Oct 18 2023 BOA 102
NOK
2,000,000
EUR
173,267 Sep 01 2023 BOA 233
NOK
7,425,799
USD
700,667 Sep 01 2023 BOA (2,182)
NOK
3,000,000
EUR
259,387 Sep 05 2023 BOA 897
NOK
5,727,819
USD
538,284 Sep 05 2023 BOA 566
NOK
103,311,688
EUR
9,121,335 Sep 20 2023 BOA (176,538)
NOK
112,630,979
USD
11,051,020 Sep 20 2023 BOA (450,249)
NOK
13,526,679
SEK
13,951,858 Sep 22 2023 BOA (2,497)
NOK
4,237,573
USD
400,000 Sep 22 2023 BOA (1,138)
NZD
1,100,000
USD
658,535 Sep 01 2023 BOA (2,605)
NZD
700,000
USD
415,996 Sep 05 2023 BOA 1,417
NZD
3,300,000
USD
1,954,415 Sep 20 2023 BOA 13,463
NZD
4,327,217
AUD
4,000,000 Sep 22 2023 BOA (13,456)
Abbey Capital Futures Strategy Fund
Consolidated Portfolio of Investments (Continued)
August 31, 2023

The accompanying notes are an integral part of the consolidated nancial statements.
27
Currency Purchased Currency Sold
Expiration
Date Counterparty
Unrealized
Appreciation/
(Depreciation)
NZD
20,400,000
JPY
1,763,763,600 Sep 22 2023 BOA $ (24)
NZD
23,135,000
USD
14,375,787 Sep 22 2023 BOA (579,700)
NZD
37,541,000
USD
22,374,686 Oct 18 2023 BOA 12,991
PEN
1,481,990
USD
400,000 Sep 20 2023 BOA 433
PHP
14,066,685
USD
250,000 Sep 20 2023 BOA (1,660)
PLN
1,787,590
EUR
400,000 Sep 05 2023 BOA (661)
PLN
34,619,481
EUR
154,387,340 Sep 20 2023 BOA (195,363)
PLN
8,508,373
EUR
1,900,000 Sep 22 2023 BOA (2,634)
PLN
55,275,480
USD
13,500,000 Sep 22 2023 BOA (118,285)
PLN
113,180,000
USD
27,645,295 Oct 18 2023 BOA (280,784)
SEK
21,512,394
USD
1,988,083 Sep 01 2023 BOA (23,117)
SEK
1,000,000
EUR
84,375 Sep 05 2023 BOA (155)
SEK
2,756,976
USD
252,941 Sep 05 2023 BOA (1,067)
SEK
88,186,132
EUR
7,503,775 Sep 20 2023 BOA (81,948)
SEK
21,605,628
USD
1,990,722 Sep 20 2023 BOA (15,394)
SEK
19,582,087
NOK
19,026,679 Sep 22 2023 BOA (387)
SEK
89,130,000
USD
8,121,437 Oct 18 2023 BOA 38,250
SGD
337,467
USD
250,000 Sep 20 2023 BOA (69)
SGD
33,579,217
USD
24,800,000 Sep 22 2023 BOA 71,335
THB
12,205,364
USD
350,000 Sep 20 2023 BOA (755)
TRY
3,000,000
USD
109,578 Sep 20 2023 BOA 1,097
TWD
193,666,698
USD
6,100,000 Sep 05 2023 BOA (15,019)
TWD
193,407,490
USD
6,100,000 Sep 11 2023 BOA (18,659)
TWD
111,422,635
USD
3,500,000 Sep 20 2023 BOA 7,393
TWD
194,123,942
USD
6,100,000 Sep 21 2023 BOA 11,447
TWD
3,181,657
USD
100,000 Sep 28 2023 BOA 253
USD
72,708,098
AUD
112,492,936 Sep 01 2023 BOA (184,316)
USD
73,687,701
AUD
113,492,936 Sep 05 2023 BOA 136,556
USD
47,840,029
AUD
73,500,000 Sep 20 2023 BOA 180,585
USD
36,769,747
AUD
55,449,000 Sep 22 2023 BOA 812,407
USD
8,093,615
BRL
39,833,998 Sep 05 2023 BOA 54,429
USD
6,050,000
BRL
30,214,750 Sep 20 2023 BOA (32,507)
USD
135,701,224
CAD
183,737,677 Sep 01 2023 BOA (281,806)
USD
95,837,172
CAD
128,893,779 Sep 20 2023 BOA 416,165
USD
70,249,269
CAD
94,359,000 Sep 22 2023 BOA 392,415
USD
31,466,743
CAD
42,397,000 Oct 18 2023 BOA 67,731
USD
16,714,611
CHF
14,708,858 Sep 01 2023 BOA 61,651
USD
9,400,000
CHF
8,226,564 Sep 20 2023 BOA 67,000
USD
18,568,370
CHF
16,438,000 Sep 22 2023 BOA (84,556)
USD
157,502,571
CHF
137,640,000 Oct 18 2023 BOA 862,257
USD
1,200,000
CLP
1,026,084,829 Sep 08 2023 BOA (2,592)
USD
5,900,000
CLP
5,103,390,688 Sep 20 2023 BOA (72,618)
USD
500,000
CLP
438,052,505 Sep 25 2023 BOA (12,354)
USD
600,000
CLP
515,976,000 Oct 02 2023 BOA (3,020)
USD
68,500
CNH
500,000 Sep 01 2023 BOA (207)
USD
68,521
CNH
500,000 Sep 05 2023 BOA (202)
USD
38,809,245
CNH
277,749,558 Sep 20 2023 BOA 603,548
USD
12,100,000
CNH
88,165,340 Sep 22 2023 BOA (28,796)
USD
100,000
COP
412,027,644 Sep 05 2023 BOA (553)
USD
300,000
COP
1,237,265,931 Sep 11 2023 BOA (1,318)
USD
300,000
COP
1,208,732,967 Sep 15 2023 BOA 6,040
USD
100,000
COP
415,147,644 Sep 18 2023 BOA (858)
Abbey Capital Futures Strategy Fund
Consolidated Portfolio of Investments (Continued)
August 31, 2023

The accompanying notes are an integral part of the consolidated nancial statements.
28
Currency Purchased Currency Sold
Expiration
Date Counterparty
Unrealized
Appreciation/
(Depreciation)
USD
1,500,000
COP
6,184,021,375 Sep 20 2023 BOA $ (1,331)
USD
100,000
COP
415,057,644 Sep 22 2023 BOA (696)
USD
100,000
COP
412,653,644 Sep 28 2023 BOA 95
USD
145,251,747
EUR
133,615,624 Sep 01 2023 BOA 358,794
USD
147,321,684
EUR
134,891,405 Sep 05 2023 BOA 1,018,527
USD
49,942,373
EUR
45,800,000 Sep 20 2023 BOA 231,628
USD
37,639,867
EUR
34,565,000 Sep 22 2023 BOA 119,786
USD
12,735,011
EUR
11,709,000 Oct 18 2023 BOA 8,307
USD
170,754,694
GBP
134,357,403 Sep 01 2023 BOA 549,684
USD
4,575,483
GBP
3,596,572 Sep 05 2023 BOA 19,219
USD
28,937,945
GBP
22,800,000 Sep 20 2023 BOA 52,131
USD
9,515,043
GBP
7,483,000 Sep 22 2023 BOA 34,585
USD
950,000
IDR
14,475,989,618 Sep 20 2023 BOA (363)
USD
13,300,000
ILS
49,157,959 Sep 20 2023 BOA 363,876
USD
6,700,000
ILS
25,289,280 Sep 22 2023 BOA 44,449
USD
26,800,000
INR
2,206,529,760 Sep 05 2023 BOA 151,262
USD
17,000,000
INR
1,411,858,330 Sep 18 2023 BOA (43,498)
USD
3,650,000
INR
302,910,645 Sep 20 2023 BOA (6,380)
USD
26,600,000
INR
2,212,194,320 Sep 25 2023 BOA (98,274)
USD
78,813,304
JPY
11,523,371,255 Sep 01 2023 BOA (400,200)
USD
77,807,029
JPY
11,342,889,086 Sep 05 2023 BOA (214,496)
USD
77,114,112
JPY
11,005,018,941 Sep 20 2023 BOA 1,234,060
USD
45,847,711
JPY
6,431,937,000 Sep 22 2023 BOA 1,484,921
USD
912,661
KRW
1,168,262,500 Sep 01 2023 BOA 28,743
USD
900,000
KRW
1,168,008,417 Sep 05 2023 BOA 16,102
USD
900,000
KRW
1,184,773,176 Sep 07 2023 BOA 3,328
USD
900,000
KRW
1,183,698,000 Sep 11 2023 BOA 3,941
USD
12,900,000
KRW
17,048,576,067 Sep 18 2023 BOA (10,825)
USD
4,400,000
KRW
5,831,041,699 Sep 20 2023 BOA (16,321)
USD
12,900,000
KRW
17,230,222,980 Sep 25 2023 BOA (153,500)
USD
15,100,000
KRW
20,005,702,618 Sep 27 2023 BOA (57,882)
USD
18,287,911
MXN
310,000,000 Sep 05 2023 BOA 121,847
USD
4,250,000
MXN
73,185,137 Sep 20 2023 BOA (27,244)
USD
1,607,852
MXN
27,618,000 Sep 22 2023 BOA (5,681)
USD
700,000
NOK
7,425,801 Sep 01 2023 BOA 1,515
USD
1,100,000
NOK
11,724,903 Sep 05 2023 BOA (3,032)
USD
26,348,416
NOK
279,107,738 Sep 20 2023 BOA 78,936
USD
9,400,000
NOK
99,259,932 Sep 22 2023 BOA 57,149
USD
654,482
NZD
1,100,000 Sep 01 2023 BOA (1,449)
USD
1,847,488
NZD
3,100,000 Sep 05 2023 BOA (1,055)
USD
40,055,492
NZD
66,700,000 Sep 20 2023 BOA 280,509
USD
33,637,441
NZD
55,446,000 Sep 22 2023 BOA 573,346
USD
150,000
PEN
557,180 Sep 20 2023 BOA (550)
USD
350,000
PHP
19,810,974 Sep 20 2023 BOA 247
USD
200,000
PHP
11,353,340 Sep 29 2023 BOA (415)
USD
1,980,143
SEK
21,512,392 Sep 01 2023 BOA 15,177
USD
1,809
SEK
19,694 Sep 05 2023 BOA 10
USD
28,973,590
SEK
313,191,538 Sep 20 2023 BOA 339,561
USD
8,600,000
SEK
93,709,197 Sep 22 2023 BOA 31,639
USD
4,250,000
SGD
5,737,452 Sep 20 2023 BOA 792
USD
3,800,000
THB
132,863,442 Sep 20 2023 BOA (1,763)
USD
493,772
TRY
13,000,000 Sep 20 2023 BOA 14,178
Abbey Capital Futures Strategy Fund
Consolidated Portfolio of Investments (Continued)
August 31, 2023

The accompanying notes are an integral part of the consolidated nancial statements.
29
Abbey Capital Futures Strategy Fund
Consolidated Portfolio of Investments (Concluded)
August 31, 2023
Currency Purchased Currency Sold
Expiration
Date Counterparty
Unrealized
Appreciation/
(Depreciation)
USD
6,300,000
TRY
173,365,474 Sep 22 2023 BOA $ (86,267)
USD
6,100,000
TWD
192,958,403 Sep 05 2023 BOA 37,273
USD
6,100,000
TWD
193,605,789 Sep 11 2023 BOA 12,424
USD
14,650,000
TWD
464,179,734 Sep 20 2023 BOA 38,420
USD
6,100,000
TWD
193,252,819 Sep 21 2023 BOA 15,978
USD
1,600,000
TWD
50,967,700 Sep 28 2023 BOA (5,970)
USD
6,100,000
TWD
193,980,787 Oct 02 2023 BOA (15,403)
USD
9,327,992
ZAR
176,715,678 Sep 20 2023 BOA (13,045)
USD
6,200,000
ZAR
117,051,796 Sep 22 2023 BOA 13,830
USD
102,657,967
JPY
14,826,500,000 Oct 18 2023 BOA (48,200)
ZAR
103,971,738
USD
5,621,376 Sep 20 2023 BOA (125,520)
ZAR
20,000
USD
1,039 Oct 18 2023 BOA 15
Total Forward Foreign Currency Contracts
$ 1,797,885
AUD Australian Dollar JSE Johannesburg Stock Exchange
BOA Bank of America KRW Korean Won
BRL Brazilian Real LME London Mercantile Exchange
BUXL German Bond MIB Milano Indice di Borsa
CAD Canadian Dollar MXN Mexican Peso
CHF Swiss Franc NOK Norwegian Krone
CLP Chilean Peso NZD New Zealand Dollar
CNH Chinese Yuan Renminbi OMX Stockholm Stock Exchange
COP Colombian Peso PHP Philippine Peso
CZK Czech Koruna PLN Polish Zloty
DAX German Stock Exchange RBOB Reformulated Blendstock for Oxygenate Blending
DJIA Dow Jones Industrial Average SEK Swedish Krona
EUR Euro SGD Singapore Dollar
FTSE Financial Times Stock Exchange THB Thai Baht
GBP British Pound TRY Turkish Lira
HUF Hungarian Forint TSX Toronto Stock Exchange
IBEX Index of the Bolsa de Madrid TWD Taiwan Dollar
ICE Intercontinental Exchange USD United States Dollar
ILS Israeli New Shekel WTI West Texas Intermediate
INR Indian Rupee ZAR South African Rand
JPY Japanese Yen

The accompanying notes are an integral part of the consolidated nancial statements.
30
Abbey Capital Futures Strategy Fund
Consolidated Statement of Assets And Liabilities
August 31, 2023
ASSETS
Investments, at value (cost $2,310,591,665) . . . . . . . . . . . . . . . . . . . . . . . . . . . . . . . . . . . . . . . . . . . . . . . .
$ 2,309,748,893
Foreign currency deposits with broker for futures contracts (cost $28,176,372) . . . . . . . . . . . . . . . . .
28,079,241
Deposits with broker for forward foreign currency contracts . . . . . . . . . . . . . . . . . . . . . . . . . . . . . . . .
106,232,176
Deposits with broker for futures contracts . . . . . . . . . . . . . . . . . . . . . . . . . . . . . . . . . . . . . . . . . . . . . . . .
281,819,306
Receivables for:
Capital shares sold . . . . . . . . . . . . . . . . . . . . . . . . . . . . . . . . . . . . . . . . . . . . . . . . . . . . . . . . . . . . . . . . . .
8,131,957
Interest receivable . . . . . . . . . . . . . . . . . . . . . . . . . . . . . . . . . . . . . . . . . . . . . . . . . . . . . . . . . . . . . . . . . . .
285,885
Unrealized appreciation on forward foreign currency contracts . . . . . . . . . . . . . . . . . . . . . . . . . . . . .
11,518,754
Unrealized appreciation on futures contracts . . . . . . . . . . . . . . . . . . . . . . . . . . . . . . . . . . . . . . . . . . . . .
54,852,063
Prepaid expenses and other assets . . . . . . . . . . . . . . . . . . . . . . . . . . . . . . . . . . . . . . . . . . . . . . . . . . . . . . .
127,991
Total assets . . . . . . . . . . . . . . . . . . . . . . . . . . . . . . . . . . . . . . . . . . . . . . . . . . . . . . . . . . . . . . . . . . . . . . .
2,800,796,266
LIABILITIES
Payables for:
Advisory fees . . . . . . . . . . . . . . . . . . . . . . . . . . . . . . . . . . . . . . . . . . . . . . . . . . . . . . . . . . . . . . . . . . . . . . .
3,944,417
Capital shares redeemed . . . . . . . . . . . . . . . . . . . . . . . . . . . . . . . . . . . . . . . . . . . . . . . . . . . . . . . . . . . . .
2,090,781
Unrealized depreciation on forward foreign currency contracts . . . . . . . . . . . . . . . . . . . . . . . . . . . . .
9,720,869
Unrealized depreciation on futures contracts . . . . . . . . . . . . . . . . . . . . . . . . . . . . . . . . . . . . . . . . . . . . .
40,974,911
Other accrued expenses and liabilities . . . . . . . . . . . . . . . . . . . . . . . . . . . . . . . . . . . . . . . . . . . . . . . . . . .
464,353
Total liabilities . . . . . . . . . . . . . . . . . . . . . . . . . . . . . . . . . . . . . . . . . . . . . . . . . . . . . . . . . . . . . . . . . . . .
57,195,331
Net assets . . . . . . . . . . . . . . . . . . . . . . . . . . . . . . . . . . . . . . . . . . . . . . . . . . . . . . . . . . . . . . . . . . . . . . . . . . . .
$ 2,743,600,935
NET ASSETS CONSIST OF:
Par value . . . . . . . . . . . . . . . . . . . . . . . . . . . . . . . . . . . . . . . . . . . . . . . . . . . . . . . . . . . . . . . . . . . . . . . . . . . .
$ 237,220
Paid-in capital . . . . . . . . . . . . . . . . . . . . . . . . . . . . . . . . . . . . . . . . . . . . . . . . . . . . . . . . . . . . . . . . . . . . . . . .
3,182,141,110
Total distributable earnings/(losses) . . . . . . . . . . . . . . . . . . . . . . . . . . . . . . . . . . . . . . . . . . . . . . . . . . . . .
(438,777,395)
Net assets . . . . . . . . . . . . . . . . . . . . . . . . . . . . . . . . . . . . . . . . . . . . . . . . . . . . . . . . . . . . . . . . . . . . . . . . . . . .
$ 2,743,600,935
CLASS A SHARES:
Net assets . . . . . . . . . . . . . . . . . . . . . . . . . . . . . . . . . . . . . . . . . . . . . . . . . . . . . . . . . . . . . . . . . . . . . . . . . . . .
$ 83,783,490
Shares outstanding ($0.001 par value, 100,000,000 shares authorized) . . . . . . . . . . . . . . . . . . . . . . . .
7,348,885
Net asset value and redemption price per share . . . . . . . . . . . . . . . . . . . . . . . . . . . . . . . . . . . . . . . . . . .
$ 11.40
Maximum oering price per share (100/94.25 of $11.40) . . . . . . . . . . . . . . . . . . . . . . . . . . . . . . . . . . . .
$ 12.10
CLASS I SHARES:
Net assets . . . . . . . . . . . . . . . . . . . . . . . . . . . . . . . . . . . . . . . . . . . . . . . . . . . . . . . . . . . . . . . . . . . . . . . . . . . .
$ 2,650,348,856
Shares outstanding ($0.001 par value, 500,000,000 shares authorized) . . . . . . . . . . . . . . . . . . . . . . . .
229,006,561
Net asset value, oering and redemption price per share . . . . . . . . . . . . . . . . . . . . . . . . . . . . . . . . . . .
$ 11.57
CLASS C SHARES:
Net assets . . . . . . . . . . . . . . . . . . . . . . . . . . . . . . . . . . . . . . . . . . . . . . . . . . . . . . . . . . . . . . . . . . . . . . . . . . . .
$ 9,468,589
Shares outstanding ($0.001 par value, 100,000,000 shares authorized) . . . . . . . . . . . . . . . . . . . . . . . .
864,386
Net asset value, oering and redemption price per share . . . . . . . . . . . . . . . . . . . . . . . . . . . . . . . . . . .
$ 10.95

The accompanying notes are an integral part of the consolidated nancial statements.
31
Abbey Capital Futures Strategy Fund
Consolidated Statement of Operations
For the Year Ended August 31, 2023
INVESTMENT INCOME
Interest . . . . . . . . . . . . . . . . . . . . . . . . . . . . . . . . . . . . . . . . . . . . . . . . . . . . . . . . . . . . . . . . . . . . . . . . . . . . . .
$ 105,658,298
Total investment income . . . . . . . . . . . . . . . . . . . . . . . . . . . . . . . . . . . . . . . . . . . . . . . . . . . . . . . . . . . . .
105,658,298
EXPENSES
Advisory fees (Note 2) . . . . . . . . . . . . . . . . . . . . . . . . . . . . . . . . . . . . . . . . . . . . . . . . . . . . . . . . . . . . . . . . .
48,673,170
Administration and accounting services fees (Note 2) . . . . . . . . . . . . . . . . . . . . . . . . . . . . . . . . . . . . . .
713,355
Transfer agent fees (Note 2) . . . . . . . . . . . . . . . . . . . . . . . . . . . . . . . . . . . . . . . . . . . . . . . . . . . . . . . . . . . .
389,034
Distribution fees (Class A Shares) (Note 2) . . . . . . . . . . . . . . . . . . . . . . . . . . . . . . . . . . . . . . . . . . . . . . .
318,830
Distribution fees (Class C Shares) (Note 2) . . . . . . . . . . . . . . . . . . . . . . . . . . . . . . . . . . . . . . . . . . . . . . . .
74,065
Directors fees . . . . . . . . . . . . . . . . . . . . . . . . . . . . . . . . . . . . . . . . . . . . . . . . . . . . . . . . . . . . . . . . . . . . . . . . .
304,606
Legal fees . . . . . . . . . . . . . . . . . . . . . . . . . . . . . . . . . . . . . . . . . . . . . . . . . . . . . . . . . . . . . . . . . . . . . . . . . . . .
199,316
Ocers fees . . . . . . . . . . . . . . . . . . . . . . . . . . . . . . . . . . . . . . . . . . . . . . . . . . . . . . . . . . . . . . . . . . . . . . . . . .
198,944
Registration and ling fees . . . . . . . . . . . . . . . . . . . . . . . . . . . . . . . . . . . . . . . . . . . . . . . . . . . . . . . . . . . . .
180,832
Printing and shareholder reporting fees . . . . . . . . . . . . . . . . . . . . . . . . . . . . . . . . . . . . . . . . . . . . . . . . . .
165,398
Custodian fees (Note 2) . . . . . . . . . . . . . . . . . . . . . . . . . . . . . . . . . . . . . . . . . . . . . . . . . . . . . . . . . . . . . . . .
121,722
Audit and tax service fees . . . . . . . . . . . . . . . . . . . . . . . . . . . . . . . . . . . . . . . . . . . . . . . . . . . . . . . . . . . . . .
71,201
Other expenses . . . . . . . . . . . . . . . . . . . . . . . . . . . . . . . . . . . . . . . . . . . . . . . . . . . . . . . . . . . . . . . . . . . . . . .
224,439
Total expenses before waivers and/or reimbursements . . . . . . . . . . . . . . . . . . . . . . . . . . . . . . . . . . .
51,634,912
Less: waivers and/or reimbursements (Note 2) . . . . . . . . . . . . . . . . . . . . . . . . . . . . . . . . . . . . . . . . . .
(1,932,271)
Net expenses after waivers and/or reimbursements . . . . . . . . . . . . . . . . . . . . . . . . . . . . . . . . . . . . . . . .
49,702,641
Net investment income/(loss) . . . . . . . . . . . . . . . . . . . . . . . . . . . . . . . . . . . . . . . . . . . . . . . . . . . . . . . . . . .
55,955,657
NET REALIZED AND UNREALIZED GAIN/(LOSS) FROM INVESTMENTS
Net realized gain/(loss) from:
Investments . . . . . . . . . . . . . . . . . . . . . . . . . . . . . . . . . . . . . . . . . . . . . . . . . . . . . . . . . . . . . . . . . . . . . . . .
(1,910,900)
Futures contracts . . . . . . . . . . . . . . . . . . . . . . . . . . . . . . . . . . . . . . . . . . . . . . . . . . . . . . . . . . . . . . . . . . . .
(130,630,689)
Foreign currency transactions . . . . . . . . . . . . . . . . . . . . . . . . . . . . . . . . . . . . . . . . . . . . . . . . . . . . . . . . .
(2,426,301)
Forward foreign currency contracts . . . . . . . . . . . . . . . . . . . . . . . . . . . . . . . . . . . . . . . . . . . . . . . . . . . .
28,851,008
Net change in unrealized appreciation/(depreciation) on:
Investments . . . . . . . . . . . . . . . . . . . . . . . . . . . . . . . . . . . . . . . . . . . . . . . . . . . . . . . . . . . . . . . . . . . . . . . .
2,262,645
Futures contracts . . . . . . . . . . . . . . . . . . . . . . . . . . . . . . . . . . . . . . . . . . . . . . . . . . . . . . . . . . . . . . . . . . . .
(24,904,435)
Foreign currency translations . . . . . . . . . . . . . . . . . . . . . . . . . . . . . . . . . . . . . . . . . . . . . . . . . . . . . . . . .
(44,582)
Forward foreign currency contracts . . . . . . . . . . . . . . . . . . . . . . . . . . . . . . . . . . . . . . . . . . . . . . . . . . . .
(12,077,132)
Net realized and unrealized gain/(loss) from investments . . . . . . . . . . . . . . . . . . . . . . . . . . . . . . . . . .
(140,880,386)
NET INCREASE/(DECREASE) IN NET ASSETS RESULTING FROM OPERATIONS . . . .
$ (84,924,729)

The accompanying notes are an integral part of the consolidated nancial statements.
32
Abbey Capital Futures Strategy Fund
Consolidated Statements of Changes in Net Assets
For the
Year Ended
August 31, 2023
For the
Year Ended
August 31, 2022
INCREASE/(DECREASE) IN NET ASSETS FROM OPERATIONS:
Net investment income/(loss) . . . . . . . . . . . . . . . . . . . . . . . . . . . . . . . . . . .
$ 55,955,657 $ (22,895,427)
Net realized gain/(loss) from investments, futures contracts, foreign
currency transactions, forward foreign currency contracts and
wrien options . . . . . . . . . . . . . . . . . . . . . . . . . . . . . . . . . . . . . . . . . . . . .
(106,116,882) 297,758,259
Net change in unrealized appreciation/(depreciation) on investments,
futures contracts, foreign currency translations, forward foreign
currency contracts and wrien options . . . . . . . . . . . . . . . . . . . . . . . . .
(34,763,504) 37,796,783
Net increase/(decrease) in net assets resulting from operations . . . . . . . .
(84,924,729) 312,659,615
DIVIDENDS AND DISTRIBUTIONS TO SHAREHOLDERS:
Class A . . . . . . . . . . . . . . . . . . . . . . . . . . . . . . . . . . . . . . . . . . . . . . . . . . . .
(17,240,224) (699,439)
Class I . . . . . . . . . . . . . . . . . . . . . . . . . . . . . . . . . . . . . . . . . . . . . . . . . . . . .
(350,326,206) (53,407,685)
Class C . . . . . . . . . . . . . . . . . . . . . . . . . . . . . . . . . . . . . . . . . . . . . . . . . . . .
(1,390,657) (168,600)
Net decrease in net assets from dividends and distributions to
shareholders . . . . . . . . . . . . . . . . . . . . . . . . . . . . . . . . . . . . . . . . . . . . . . . . .
(368,957,087) (54,275,724)
CAPITAL SHARE TRANSACTIONS:
Class A Shares
Proceeds from shares sold . . . . . . . . . . . . . . . . . . . . . . . . . . . . . . . . . . . .
72,909,552 96,389,889
Proceeds from reinvestment of distributions . . . . . . . . . . . . . . . . . . . .
15,458,188 594,933
Shares redeemed . . . . . . . . . . . . . . . . . . . . . . . . . . . . . . . . . . . . . . . . . . . .
(96,518,703) (11,764,526)
Total from Class A Shares . . . . . . . . . . . . . . . . . . . . . . . . . . . . . . . . . . . .
(8,150,963) 85,220,296
Class I Shares
Proceeds from shares sold . . . . . . . . . . . . . . . . . . . . . . . . . . . . . . . . . . . .
1,519,244,144 1,705,791,826
Proceeds from reinvestment of distributions . . . . . . . . . . . . . . . . . . . .
220,037,703 35,649,949
Shares redeemed . . . . . . . . . . . . . . . . . . . . . . . . . . . . . . . . . . . . . . . . . . . .
(1,223,121,986) (560,126,349)
Total from Class I Shares . . . . . . . . . . . . . . . . . . . . . . . . . . . . . . . . . . . . .
516,159,861 1,181,315,426
Class C Shares
Proceeds from shares sold . . . . . . . . . . . . . . . . . . . . . . . . . . . . . . . . . . . .
3,837,664 4,075,349
Proceeds from reinvestment of distributions . . . . . . . . . . . . . . . . . . . .
882,158 147,425
Shares redeemed . . . . . . . . . . . . . . . . . . . . . . . . . . . . . . . . . . . . . . . . . . . .
(2,504,539) (1,516,356)
Total from Class C Shares . . . . . . . . . . . . . . . . . . . . . . . . . . . . . . . . . . . .
2,215,283 2,706,418
Net increase/(decrease) in net assets from capital share transactions . . .
510,224,181 1,269,242,140
Total increase/(decrease) in net assets . . . . . . . . . . . . . . . . . . . . . . . . . . . . . .
56,342,365 1,527,626,031
NET ASSETS:
Beginning of period . . . . . . . . . . . . . . . . . . . . . . . . . . . . . . . . . . . . . . . . . . .
2,687,258,570 1,159,632,539
End of period . . . . . . . . . . . . . . . . . . . . . . . . . . . . . . . . . . . . . . . . . . . . . . . . .
$ 2,743,600,935 $ 2,687,258,570

The accompanying notes are an integral part of the consolidated nancial statements.
33
Abbey Capital Futures Strategy Fund
Consolidated Statements of Changes in Net Assets (Concluded)
For the
Year Ended
August 31, 2023
For the
Year Ended
August 31, 2022
SHARE TRANSACTIONS:
Class A Shares
Shares sold . . . . . . . . . . . . . . . . . . . . . . . . . . . . . . . . . . . . . . . . . . . . . . . . .
5,947,542 7,470,600
Shares reinvested . . . . . . . . . . . . . . . . . . . . . . . . . . . . . . . . . . . . . . . . . . .
1,333,752 51,509
Shares redeemed . . . . . . . . . . . . . . . . . . . . . . . . . . . . . . . . . . . . . . . . . . . .
(8,301,217) (943,646)
Total Class A Shares . . . . . . . . . . . . . . . . . . . . . . . . . . . . . . . . . . . . . . . . .
(1,019,923) 6,578,463
Class I Shares
Shares sold . . . . . . . . . . . . . . . . . . . . . . . . . . . . . . . . . . . . . . . . . . . . . . . . .
123,436,456 134,098,707
Shares reinvested . . . . . . . . . . . . . . . . . . . . . . . . . . . . . . . . . . . . . . . . . . .
18,742,564 3,054,837
Shares redeemed . . . . . . . . . . . . . . . . . . . . . . . . . . . . . . . . . . . . . . . . . . . .
(100,137,539) (44,029,159)
Total Class I Shares . . . . . . . . . . . . . . . . . . . . . . . . . . . . . . . . . . . . . . . . . .
42,041,481 93,124,385
Class C Shares
Shares sold . . . . . . . . . . . . . . . . . . . . . . . . . . . . . . . . . . . . . . . . . . . . . . . . .
305,269 326,237
Shares reinvested . . . . . . . . . . . . . . . . . . . . . . . . . . . . . . . . . . . . . . . . . . .
78,764 13,117
Shares redeemed . . . . . . . . . . . . . . . . . . . . . . . . . . . . . . . . . . . . . . . . . . . .
(211,397) (123,867)
Total Class C Shares . . . . . . . . . . . . . . . . . . . . . . . . . . . . . . . . . . . . . . . . .
172,636 215,487
Net increase/(decrease) in shares outstanding . . . . . . . . . . . . . . . . . . . . . .
41,194,194 99,918,335

34
The accompanying notes are an integral part of the consolidated nancial statements.
Abbey Capital Futures Strategy Fund
Consolidated Financial Highlights
Class A Shares
For the
Year
Ended
August 31,
2023
For the
Year
Ended
August 31,
2022
For the
Year
Ended
August 31,
2021
For the
Year
Ended
August 31,
2020
For the
Year
Ended
August 31,
2019
Per Share Operating Performance
Net asset value, beginning of period . . . . . . . . . . . . .
$ 13.56 $ 11.95 $ 11.28 $ 12.45 $ 11.28
Net investment income/(loss)
(1)
. . . . . . . . . . . . . . . . . 0.22 (0.19) (0.24) (0.11) (0.01)
Net realized and unrealized gain/(loss) from
investments . . . . . . . . . . . . . . . . . . . . . . . . . . . . . . . . (0.60) 2.20 1.07 (0.14) 1.18
Net increase/(decrease) in net assets
resulting from operations . . . . . . . . . . . . . . . . . . . . (0.38) 2.01 0.83 (0.25) 1.17
Dividends and distributions to shareholders from:
Net investment income . . . . . . . . . . . . . . . . . . . . . . . .
(1.11) (0.27) (0.16) (0.64) —
Net realized capital gains . . . . . . . . . . . . . . . . . . . . . . (0.67) (0.13) — (0.28) —
Total dividends and distributions to shareholders (1.78) (0.40) (0.16) (0.92) —
Net asset value, end of period . . . . . . . . . . . . . . . . . . $ 11.40 $ 13.56 $ 11.95 $ 11.28 $ 12.45
Total investment return/(loss)
(2)
. . . . . . . . . . . . . . . . . (3.05)% 17.40% 7.42% (1.64)% 10.37%
Ratios/Supplemental Data
Net assets, end of period (000’s omied) . . . . . . . . .
$ 83,783 $ 113,480 $ 21,395 $ 14,469 $ 12,434
Ratio of expenses to average net assets with waivers
and/or reimbursements (including interest
expense)
(3)
. . . . . . . . . . . . . . . . . . . . . . . . . . . . . . . . . . 2.04% 2.04% 2.04% 2.04% 2.04%
Ratio of expenses to average net assets with waivers
and/or reimbursements (excluding interest
expense)
(3)
. . . . . . . . . . . . . . . . . . . . . . . . . . . . . . . . . . 2.04% 2.04% 2.04% 2.04% 2.04%
Ratio of expenses to average net assets without
waivers and/or reimbursements (including
interest expense)
(3)
. . . . . . . . . . . . . . . . . . . . . . . . . . 2.11% 2.10% 2.14% 2.15% 2.14%
Ratio of net investment income/(loss) to average
net assets . . . . . . . . . . . . . . . . . . . . . . . . . . . . . . . . . . 1.80% (1.47)% (2.03)% (0.98)% (0.05)%
Portfolio turnover rate
(4)
. . . . . . . . . . . . . . . . . . . . . . . 0% 0% 0% 0% 0%
(1) Calculated based on average shares outstanding for the period.
(2) Total investment return/(loss) is calculated assuming a purchase of shares on the rst day and a sale of shares on the last day of each
period reported and includes reinvestments of dividends and distributions, if any. Total return does not reect any applicable sales
charge.
(3) The Adviser has contractually agreed to waive its advisory fee and/or reimburse expenses in order to limit total annual Fund
operating expenses (excluding acquired Fund fees and expenses, brokerage commissions, extraordinary items, interest or taxes) to
2.04% of the Fund’s average daily net assets aributable to Class A Shares.
(4) Portfolio turnover rate is calculated for the Fund, as a whole, for the entire period.
Contained below is per share operating performance data for Class A Shares outstanding, total investment return/
(loss), ratios to average net assets and other supplemental data for the respective periods. This information has been
derived from information provided in the consolidated nancial statements.

35
The accompanying notes are an integral part of the consolidated nancial statements.
Abbey Capital Futures Strategy Fund
Consolidated Financial Highlights (Continued)
Class I Shares
For the
Year
Ended
August 31,
2023
For the
Year
Ended
August 31,
2022
For the
Year
Ended
August 31,
2021
For the
Year
Ended
August 31,
2020
For the
Year
Ended
August 31,
2019
Per Share Operating Performance
Net asset value, beginning of period . . . . . . . . . . . . .
$ 13.72 $ 12.07 $ 11.38 $ 12.55 $ 11.36
Net investment income/(loss)
(1)
. . . . . . . . . . . . . . . . . 0.25 (0.15) (0.21) (0.09) 0.02
Net realized and unrealized gain/(loss) from
investments . . . . . . . . . . . . . . . . . . . . . . . . . . . . . . . . (0.61) 2.22 1.08 (0.14) 1.19
Net increase/(decrease) in net assets
resulting from operations . . . . . . . . . . . . . . . . . . . . (0.36) 2.07 0.87 (0.23) 1.21
Dividends and distributions to shareholders from:
Net investment income . . . . . . . . . . . . . . . . . . . . . . . .
(1.12) (0.29) (0.18) (0.66) (0.02)
Net realized capital gains . . . . . . . . . . . . . . . . . . . . . . (0.67) (0.13) — (0.28) —
Total dividends and distributions to shareholders (1.79) (0.42) (0.18) (0.94) (0.02)
Net asset value, end of period . . . . . . . . . . . . . . . . . . $ 11.57 $ 13.72 $ 12.07 $ 11.38 $ 12.55
Total investment return/(loss)
(2)
. . . . . . . . . . . . . . . . . (2.83)% 17.72% 7.74% (1.39)% 10.63%
Ratios/Supplemental Data
Net assets, end of period (000’s omied) . . . . . . . . .
$ 2,650,349 $ 2,564,701 $ 1,132,714 $ 883,997 $ 707,564
Ratio of expenses to average net assets with waivers
and/or reimbursements (including interest
expense)
(3)
. . . . . . . . . . . . . . . . . . . . . . . . . . . . . . . . . . 1.79% 1.79% 1.79% 1.79% 1.79%
Ratio of expenses to average net assets with waivers
and/or reimbursements (excluding interest
expense)
(3)
. . . . . . . . . . . . . . . . . . . . . . . . . . . . . . . . . . 1.79% 1.79% 1.79% 1.79% 1.79%
Ratio of expenses to average net assets without
waivers and/or reimbursements (including
interest expense)
(3)
. . . . . . . . . . . . . . . . . . . . . . . . . . 1.86% 1.85% 1.89% 1.90% 1.89%
Ratio of net investment income/(loss) to average
net assets . . . . . . . . . . . . . . . . . . . . . . . . . . . . . . . . . . 2.05% (1.22)% (1.78)% (0.73)% 0.20%
Portfolio turnover rate
(4)
. . . . . . . . . . . . . . . . . . . . . . . 0% 0% 0% 0% 0%
(1) Calculated based on average shares outstanding for the period.
(2) Total investment return/(loss) is calculated assuming a purchase of shares on the rst day and a sale of shares on the last day of
each period reported and includes reinvestments of dividends and distributions, if any.
(3) The Adviser has contractually agreed to waive its advisory fee and/or reimburse expenses in order to limit total annual Fund
operating expenses (excluding acquired Fund fees and expenses, brokerage commissions, extraordinary items, interest or taxes)
to 1.79% of the Fund’s average daily net assets aributable to Class I Shares.
(4) Portfolio turnover rate is calculated for the Fund, as a whole, for the entire period.
Contained below is per share operating performance data for Class I Shares outstanding, total investment return/(loss),
ratios to average net assets and other supplemental data for the respective periods. This information has been derived
from information provided in the consolidated nancial statements.

36
The accompanying notes are an integral part of the consolidated nancial statements.
Abbey Capital Futures Strategy Fund
Consolidated Financial Highlights (Concluded)
Class C Shares
For the
Year
Ended
August 31,
2023
For the
Year
Ended
August 31,
2022
For the
Year
Ended
August 31,
2021
For the
Year
Ended
August 31,
2020
For the
Year
Ended
August 31,
2019
Per Share Operating Performance
Net asset value, beginning of period . . . . . . . . . . . . .
$ 13.12 $ 11.60 $ 10.98 $ 12.11 $ 11.06
Net investment income/(loss)
(1)
. . . . . . . . . . . . . . . . . 0.12 (0.27) (0.32) (0.19) (0.08)
Net realized and unrealized gain/(loss) from
investments . . . . . . . . . . . . . . . . . . . . . . . . . . . . . . . . (0.57) 2.13 1.05 (0.14) 1.13
Net increase/(decrease) in net assets
resulting from operations . . . . . . . . . . . . . . . . . . . . (0.45) 1.86 0.73 (0.33) 1.05
Dividends and distributions to shareholders from:
Net investment income . . . . . . . . . . . . . . . . . . . . . . . .
(1.05) (0.21) (0.11) (0.52) —
Net realized capital gains . . . . . . . . . . . . . . . . . . . . . . (0.67) (0.13) — (0.28) —
Total dividends and distributions to shareholders (1.72) (0.34) (0.11) (0.80) —
Net asset value, end of period . . . . . . . . . . . . . . . . . . $ 10.95 $ 13.12 $ 11.60 $ 10.98 $ 12.11
Total investment return/(loss)
(2)
. . . . . . . . . . . . . . . . . (3.77)% 16.48% 6.72% (2.40)% 9.49%
Ratios/Supplemental Data
Net assets, end of period (000’s omied) . . . . . . . . .
$ 9,469 $ 9,078 $ 5,524 $ 5,151 $ 4,487
Ratio of expenses to average net assets with waivers
and/or reimbursements (including interest
expense)
(3)
. . . . . . . . . . . . . . . . . . . . . . . . . . . . . . . . . . 2.79% 2.79% 2.79% 2.79% 2.79%
Ratio of expenses to average net assets with waivers
and/or reimbursements (excluding interest
expense)
(3)
. . . . . . . . . . . . . . . . . . . . . . . . . . . . . . . . . . 2.79% 2.79% 2.79% 2.79% 2.79%
Ratio of expenses to average net assets without
waivers and/or reimbursements (including
interest expense)
(3)
. . . . . . . . . . . . . . . . . . . . . . . . . . 2.86% 2.85% 2.89% 2.90% 2.89%
Ratio of net investment income/(loss) to average
net assets . . . . . . . . . . . . . . . . . . . . . . . . . . . . . . . . . . 1.05% (2.22)% (2.78)% (1.73)% (0.80)%
Portfolio turnover rate
(4)
. . . . . . . . . . . . . . . . . . . . . . . 0% 0% 0% 0% 0%
(1) Calculated based on average shares outstanding for the period.
(2) Total investment return/(loss) is calculated assuming a purchase of shares on the rst day and a sale of shares on the last day of
each period reported and includes reinvestments of dividends and distributions, if any.
(3) The Adviser has contractually agreed to waive its advisory fee and/or reimburse expenses in order to limit total annual Fund
operating expenses (excluding acquired Fund fees and expenses, brokerage commissions, extraordinary items, interest or taxes) to
2.79% of the Fund’s average daily net assets aributable to Class C Shares.
(4) Portfolio turnover rate is calculated for the Fund, as a whole, for the entire period.
Contained below is per share operating performance data for Class C Shares outstanding, total investment return/
(loss), ratios to average net assets and other supplemental data for the respective periods. This information has been
derived from information provided in the consolidated nancial statements.
37
Abbey Capital Futures Strategy Fund
Notes To Consolidated Financial Statements
August 31, 2023
1. Organization and Significant Accounting Policies
The RBB Fund, Inc. (“RBB” or the “Company”) was incorporated under the laws of the State of Maryland on February
29, 1988 and is registered under the Investment Company Act of 1940, as amended (the “1940 Act”), as an open-end
management investment company. RBB is a “series fund,” which is a mutual fund divided into separate portfolios.
Each portfolio is treated as a separate entity for certain maers under the 1940 Act, and for other purposes, and a
shareholder of one portfolio is not deemed to be a shareholder of any other portfolio. Currently, RBB has fty-three
separate investment portfolios, including the Abbey Capital Futures Strategy Fund (the “Fund”), which commenced
investment operations on July 1, 2014. The Fund is authorized to oer four classes of shares, Class A Shares, Class I
Shares, Class C Shares and Class T Shares. Class A Shares are sold subject to a front-end maximum sales charge of
5.75%. Front-end sales charges may be reduced or waived under certain circumstances. Class T Shares are not currently
available for sale.
RBB has authorized capital of one hundred billion shares of common stock of which 91.523 billion shares are currently
classied into two hundred and twenty-two classes of common stock. Each class represents an interest in an active or
inactive RBB investment portfolio.
The Fund seeks to achieve its investment objective by allocating its assets between a “Managed Futures” strategy
and a “Fixed Income” strategy.
The Fund is an investment company and follows accounting and reporting guidance in the Financial Accounting
Standards Board (“FASB”) Accounting Standards Codication Topic 946 “Financial Services – Investment Companies.”
The end of the reporting period for the Fund is August 31, 2023, and the period covered by these Notes to Consolidated
Financial Statements is the scal year ended August 31, 2023 (the “current scal period”).
CONSOLIDATION OF SUBSIDIARIES – The Managed Futures strategy is achieved by the Fund investing up
to 25% of its total assets in Abbey Capital Master Oshore Fund Limited (the “Cayman Subsidiary”), a wholly-owned
and controlled subsidiary of the Fund organized under the acts of the Cayman Islands. The Cayman Subsidiary invests
all or substantially all of its assets in segregated portfolios of the Abbey Capital Oshore Fund SPC (the “SPC”), a
wholly-owned subsidiary of the Cayman Subsidiary organized under the acts of the Cayman Islands. The Cayman
Subsidiary serves solely as an intermediate entity through which the Fund invests in the SPC and makes no independent
investment decisions and has no investment or other discretion over the Fund’s investable assets.
The Fund may also invest a portion of its assets in segregated series of another wholly-owned subsidiary of the
Fund, the Abbey Capital Onshore Series LLC (the “Onshore Subsidiary”), a Delaware series limited liability company.
The consolidated nancial statements of the Fund include the nancial statements of the Cayman Subsidiary, the
Onshore Subsidiary and SPC. The Fund consolidates the results of subsidiaries in which the Fund holds a controlling
nancial interest. All inter-company accounts and transactions have been eliminated. As of the end of the reporting
period, the net assets of the Cayman Subsidiary and SPC were $613,222,542, which represented 22.35% of the Fund’s
net assets. As of the end of the reporting period, the net assets of the Onshore Subsidiary were $609,245,254, which
represented 22.21% of the Fund’s net assets.
PORTFOLIO VALUATION — The Fund’s net asset value (“NAV”) is calculated once daily at the close of regular
trading hours on the New York Stock Exchange (“NYSE”) (generally 4:00 p.m. Eastern time) on each day the NYSE is
open. Securities held by the Fund are valued using the closing price or the last sale price on a national securities exchange
or the National Association of Securities Dealers Automatic Quotation System (“NASDAQ”) market system where they
are primarily traded. Fixed income securities are valued using an independent pricing service, which considers such
factors as security prices, yields, maturities and ratings, and are deemed representative of market values at the close of
the market. Forward exchange contracts are valued by interpolating between spot and forward currency rates as quoted

38
by an independent pricing service. Futures contracts are generally valued using the selement price determined by the
relevant exchange. Options for which the primary market is a national securities exchange are valued at the last sale
price on the exchange on which they are traded, or, in the absence of any sale, will be valued at the mean of the last
bid and ask prices prior to the market close. Options not traded on a national securities exchange are valued at the last
quoted bid price for long option positions and the closing ask price for short option positions. If market quotations are
unavailable or deemed unreliable, securities will be valued by the Valuation Designee (as dened below) in accordance
with procedures adopted by the Company’s Board of Directors (the “Board”). Relying on prices supplied by pricing
services or dealers or using fair valuation may result in values that are higher or lower than the values used by other
investment companies and investors to price the same investments.
The Board has adopted a pricing and valuation policy for use by the Fund and its Valuation Designee (as dened
below) in calculating the Fund’s NAV. Pursuant to Rule 2a-5 under the 1940 Act, the Fund has designated Abbey Capital
Limited (the “Adviser” or “Abbey Capital”) as its “Valuation Designee” to perform all of the fair value determinations as
well as to perform all of the responsibilities that may be performed by the Valuation Designee in accordance with Rule
2a-5. The Valuation Designee is authorized to make all necessary determinations of the fair values of portfolio securities
and other assets for which market quotations are not readily available or if it is deemed that the prices obtained from
brokers and dealers or independent pricing services are unreliable.
Fair Value Measurements — The inputs and valuation techniques used to measure the fair value of the Fund’s
investments are summarized into three levels as described in the hierarchy below:
• Level 1 – Prices are determined using quoted prices in active markets for identical securities.
• Level 2 – Prices are determined using other signicant observable inputs (including quoted prices for similar
securities, interest rates, prepayment speeds, credit risk, etc.).
• Level 3 – Prices are determined using signicant unobservable inputs (including the Fund’s own assumptions
in determining the fair value of investments).
The inputs or methodologies used for valuing securities are not necessarily an indication of the risk associated with
investing in those securities.
The following is a summary of the inputs used, as of the end of the reporting period, in valuing the Fund’s investments
carried at fair value:
Total Level 1 Level 2 Level 3
Short-Term Investments $ 2,309,748,893 $ 2,309,748,893 $ — $ —
Commodity Contracts
Futures Contracts 26,591,920 26,591,920 — —
Equity Contracts
Futures Contracts 8,915,765 8,915,765 — —
Foreign Currency Contracts
Forward Foreign Currency Contracts 11,518,754 — 11,518,754 —
Futures Contracts 15,505,319 15,505,319 — —
Interest Rate Contracts
Futures Contracts 3,839,059 3,839,059 — —
Total Assets $ 2,376,119,710 $ 2,364,600,956 $ 11,518,754 $ —
Abbey Capital Futures Strategy Fund
Notes To Consolidated Financial Statements (Continued)
August 31, 2023

39
Total Level 1 Level 2 Level 3
Commodity Contracts
Futures Contracts $ (17,644,260) $ (17,644,260) $ — $ —
Equity Contracts
Futures Contracts (5,333,701) (5,333,701) — —
Foreign Currency Contracts
Forward Foreign Currency Contracts (9,720,869) — (9,720,869) —
Futures Contracts (1,596,505) (1,596,505) — —
Interest Rate Contracts
Futures Contracts (16,400,445) (16,400,445) — —
Total Liabilities $ (50,695,780) $ (40,974,911) $ (9,720,869) $ —
At the end of each quarter, management evaluates the classication of Levels 1, 2 and 3 assets and liabilities. Various
factors are considered, such as changes in liquidity from the prior reporting period; whether or not a broker is willing
to execute at the quoted price; the depth and consistency of prices from third party pricing services; and the existence of
contemporaneous, observable trades in the market. Additionally, management evaluates the classication of Levels 1, 2
and 3 assets and liabilities on a quarterly basis for changes in listings or delistings on national exchanges.
Due to the inherent uncertainty of determining the fair value of investments that do not have a readily available
market value, the fair value of the Fund’s investments may uctuate from period to period. Additionally, the fair value
of investments may dier signicantly from the values that would have been used had a ready market existed for such
investments and may dier materially from the values the Fund may ultimately realize. Further, such investments may
be subject to legal and other restrictions on resale or otherwise less liquid than publicly traded securities.
For fair valuations using signicant unobservable inputs, U.S. generally accepted accounting principles (“U.S.
GAAP”) requires the Fund to present a reconciliation of the beginning to ending balances for reported market values
that presents changes aributable to total realized and unrealized gains or losses, purchase and sales, and transfers in
and out of Level 3 during the period. Transfers in and out between levels are based on values at the end of the period.
A reconciliation of Level 3 investments is presented only when the Fund had an amount of Level 3 investments at the
end of the reporting period that was meaningful in relation to its net assets. The amounts and reasons for all Level
3 transfers are disclosed if the Fund had an amount of total Level 3 transfers during the reporting period that was
meaningful in relation to its net assets as of the end of the reporting period.
During the current scal period, the Fund had no Level 3 transfers.
Disclosures about Derivative instruments and Hedging Activities — Derivative instruments
are dened as nancial instruments whose value and performance are based on the value and performance of another
security or nancial instrument. Derivative instruments that the Fund used during the period include forward foreign
currency contracts and futures contracts.
During the current scal period, the Fund used long and short contracts on U.S. and foreign equity market indices,
U.S. and foreign government bonds, foreign currencies, interest rates and commodities (through investment in
the Cayman Subsidiary, the SPC and the Onshore Subsidiary), to gain investment exposure in accordance with its
investment objective.
The following tables provide quantitative disclosures about fair value amounts of, and gains and losses on, the
Fund’s derivative instruments as of and for the current scal period.
Abbey Capital Futures Strategy Fund
Notes To Consolidated Financial Statements (Continued)
August 31, 2023

40
The following tables list the fair values and location on the Consolidated Statement of Assets and Liabilities of the
Fund’s derivative holdings as of the end of the reporting period, grouped by derivative type and primary risk exposure
category by contract type.
Derivative Type
Consolidated
Statement
of Assets and
Liabilities
Location
Equity
Contracts
Interest
Rate
Contracts
Foreign
Currency
Contracts
Commodity
Contracts Total
Asset Derivatives
Forward Contracts
(a)
Unrealized appreciation
on forward foreign
currency contracts
$ — $ — $ 11,518,754 $ — $ 11,518,754
Futures Contracts
(a)
Unrealized appreciation
on futures contracts
8,915,765 3,839,058 15,505,319 26,591,919 54,852,061
Total Value- Assets $ 8,915,765 $ 3,839,058 $ 27,024,073 $ 26,591,919 $ 66,370,815
Liability Derivatives
Forward Contracts
(a)
Unrealized depreciation
on forward foreign
currency contracts
$ — $ — $ (9,720,869) $ — $ (9,720,869)
Futures Contracts
(a)
Unrealized depreciation
on futures contracts
(5,333,700) (16,400,444) (1,596,505) (17,644,260) (40,974,909)
Total Value- Liabilities $ (5,333,700) $ (16,400,444) $ (11,317,374) $ (17,644,260) $ (50,695,778)
(a) This amount represents the cumulative appreciation/(depreciation) of forwards and futures contracts as reported on the
Consolidated Portfolio of Investments.
The following table lists the amounts of realized gains/(losses) included in net increase/(decrease) in net assets
resulting from operations during the current scal period, grouped by derivative type and primary risk exposure
category by contract type.
Derivative Type
Consolidated
Statement of
Operations
Location
Equity
Contracts
Interest
Rate
Contracts
Foreign
Currency
Contracts
Commodity
Contracts Total
Realized Gain/(Loss)
Futures Contracts
Net realized gain/(loss)
from futures contracts
$ (36,175,149) $ 38,080,700 $ 2,092,153 $ (134,628,393) $ (130,630,689)
Forward Contracts
Net realized gain/(loss)
from forward foreign
currency contracts
— — 28,851,008 — 28,851,008
Total Realized Gain/(Loss) $ (36,175,149) $ 38,080,700 $ 30,943,161 $ (134,628,393) $ (101,779,681)
Abbey Capital Futures Strategy Fund
Notes To Consolidated Financial Statements (Continued)
August 31, 2023

41
Abbey Capital Futures Strategy Fund
Notes To Consolidated Financial Statements (Continued)
August 31, 2023
The following table lists the amounts of change in unrealized appreciation/(depreciation) included in net increase/
(decrease) in net assets resulting from operations during the current scal period, grouped by derivative type and
primary risk exposure category by contract type.
Derivative Type
Consolidated
Statement of
Operations
Location
Equity
Contracts
Interest
Rate
Contracts
Foreign
Currency
Contracts
Commodity
Contracts Total
Change in Unrealized Appreciation/(Depreciation)
Futures Contracts
Net change in
unrealized appreciation/
(depreciation) on futures
contracts
$ 13,272,253 $ (31,100,722) $ (10,947,084) $ 3,871,118 $ (24,904,435)
Forward Contracts
Net change in
unrealized appreciation/
(depreciation) on
forward foreign
currency contracts
— — (12,077,132) — (12,077,132)
Total Change in Unrealized Appreciation/
(Depreciation)
$ 13,272,253 $ (31,100,722) $ (23,024,216) $ 3,871,118 $ (36,981,567)
During the current scal period, the Fund’s quarterly average volume of derivatives was as follows:
Long Futures
Notional
Amount
Short Futures
Notional
Amount
Forward Foreign
Currency
Contracts — Payable
(Value at Trade Date)
Forward Foreign
Currency
Contracts —
Receivable
(Value at Trade Date)
$2,946,299,254 $(7,069,243,345) $(3,873,888,276) $3,878,307,322
For nancial reporting purposes, the Fund does not oset fair value amounts recognized for derivative instruments
and fair value amounts recognized for the right to reclaim cash collateral (receivables) or the obligation to return cash
collateral (payables) arising from derivative instruments recognized at fair value executed with the same counterparty
under a master neing arrangement.

42
Abbey Capital Futures Strategy Fund
Notes To Consolidated Financial Statements (Continued)
August 31, 2023
The following is a summary of nancial and derivative instruments that are subject to enforceable master neing
agreements (or similar arrangements) and collateral received and pledged in connection with the master neing
agreements (or similar arrangements).
Forward Foreign
Currency
Contracts $ 11,518,754 $ (9,720,869) $ — $ 1,797,885 $ 9,720,869 $ (9,720,869) $ — $ —
(1) Net amount represents the net amount receivable from the counterparty in the event of default.
(2) Actual collateral pledged may be more than the amount shown.
(3) Net amount represents the net amount payable to the counterparty in the event of default.
Use of Estimates — The preparation of consolidated nancial statements in conformity with U.S. GAAP
requires management to make estimates and assumptions that aect the reported amounts of assets and liabilities
and disclosure of contingent assets and liabilities at the date of the consolidated nancial statements and the reported
amounts of revenues and expenses during the reporting period. Actual results could dier from those estimates and
those dierences could be signicant.
Investment Transactions, Investment Income and Expenses — The Fund records security
transactions based on trade date for nancial reporting purposes. The cost of investments sold is determined by use of
the specic identication method for both nancial reporting and income tax purposes in determining realized gains
and losses on investments. Interest income (including amortization of premiums and accretion of discounts) is accrued
when earned. Dividend income is recorded on the ex-dividend date. Distributions received on securities that represent
a return of capital or capital gain are recorded as a reduction of cost of investments and/or as a realized gain. The Fund’s
investment income, expenses (other than class specic expenses) and unrealized and realized gains and losses are
allocated daily to each class of shares based upon the relative proportion of net assets of each class at the beginning of
the day. Certain expenses are shared with The RBB Fund Trust (the “Trust”), a series trust of aliated funds. Expenses
incurred on behalf of a specic class, fund or fund family of the Company or Trust are charged directly to the class,
fund or fund family (in proportion to net assets). Expenses incurred for all funds (such as director or professional fees)
are charged to all funds in proportion to their average net assets of RBB and the Trust, or in such other manner as the
Board deems fair or equitable. Expenses and fees, including investment advisory and administration fees, are accrued
daily and taken into account for the purpose of determining the NAV of the Fund.
Dividends and Distributions to Shareholders — Dividends from net investment income and
distributions from net realized capital gains, if any, are declared and paid at least annually to shareholders and
recorded on the ex-dividend date. Income dividends and capital gain distributions are determined in accordance with
U.S. federal income tax regulations, which may dier from U.S. GAAP.
U.S. Tax Status — No provision is made for U.S. income taxes as it is the Fund’s intention to continue to qualify for
and elect the tax treatment applicable to regulated investment companies under Subchapter M of the Internal Revenue
Code of 1986, as amended, and make the requisite distributions to its shareholders which will be sucient to relieve it
from U.S. income and excise taxes.
43
Abbey Capital Futures Strategy Fund
Notes To Consolidated Financial Statements (Continued)
August 31, 2023
The Cayman Subsidiary is registered as an “exempted company” and the SPC as an “exempted segregated portfolio
company” pursuant to the Companies Act (Revised) of the Cayman Islands (as amended). Each of the Cayman
Subsidiary and the SPC has received an undertaking from the Governor in Cabinet of the Cayman Islands to the eect
that, for a period of twenty years from the date of the undertaking, no act that thereafter is enacted in the Cayman
Islands imposing any tax or duty to be levied on prots, income or on gains or appreciation, or any tax in the nature
of estate duty or inheritance tax, will apply to any property comprised in or any income arising under the Cayman
Subsidiary or the SPC, or to the shareholders thereof, in respect of any such property or income. For U.S. federal income
tax purposes, the Cayman Subsidiary is treated as a “controlled foreign corporation.” The SPC is treated as an entity
disregarded from its owner, the Cayman Subsidiary, for U.S. income tax purposes. The Onshore Subsidiary is treated
as an entity disregarded from its owner, the Fund, for U.S. income tax purposes.
SEC RULE 18f-4 — Eective August 19, 2022, the U.S. Securities and Exchange Commission (“SEC”) implemented
Rule 18f-4 under the 1940 Act (“Rule 18f-4”), providing for the regulation of a registered investment company’s use of
derivatives and certain related instruments. Among other things, Rule 18f-4 limits a fund’s derivatives exposure through
a value-at-risk test and requires the adoption and implementation of a derivatives risk management program for certain
derivatives users. The Fund, as a full derivatives user (as dened in Rule 18f-4), is subject to the full requirements of
Rule 18f-4. The Fund is required to comply with Rule18f-4 and has adopted procedures for investing in derivatives and
other transactions in compliance with Rule 18f-4.
Foreign Currency Translation — Assets and liabilities initially expressed in non-U.S. currencies are
translated into U.S. dollars based on the applicable exchange rates at the date of the last business day of the nancial
statement period. Purchases and sales of securities, interest income, dividends, variation margin received and expenses
denominated in foreign currencies are translated into U.S. dollars at the exchange rates in eect on the transaction date.
The Fund does not separately report the eect of changes in foreign exchange rates from changes in market prices of
securities held. Such changes are included with the net realized gain or loss and change in unrealized appreciation or
depreciation on investments in the Consolidated Statement of Operations. Other foreign currency transactions resulting
in realized and unrealized gain or loss are reported separately as net realized gain or loss and change in unrealized
appreciation or depreciation on foreign currencies in the Consolidated Statement of Operations.
Currency Risk —Investment in foreign securities involves currency risk associated with securities that trade or
are denominated in currencies other than the U.S. dollar and which may be aected by uctuations in currency exchange
rates. An increase in the strength of the U.S. dollar relative to a foreign currency may cause the U.S. dollar value of an
investment in that country to decline. Foreign currencies also are subject to risks caused by ination, interest rates,
budget decits and low savings rates, political factors and government controls. Forward foreign currency exchange
contracts may limit potential gains from a favorable change in value between the U.S. dollar and foreign currencies.
Unanticipated changes in currency pricing may result in poorer overall performance for the Fund than if it had not
engaged in these contracts.
Commodity Sector Risk — Exposure to the commodities markets may subject the Fund to greater volatility
than investments in traditional securities. The value of commodity-linked derivative instruments may be aected
by changes in overall market movements, commodity index volatility, changes in interest rates or factors aecting
a particular industry or commodity, such as drought, oods, weather, livestock disease, embargoes, taris and
international economic, political and regulatory developments. The prices of energy, industrial metals, precious metals,
agriculture and livestock sector commodities may uctuate widely due to factors such as changes in value, supply and
demand and governmental regulatory policies. The commodity-linked securities in which the Fund invests may be
issued by companies in the nancial services sector, and events aecting the nancial services sector may cause the
Fund’s share value to uctuate.
Foreign Securities Market Risk — A substantial portion of the trades of the Fund are expected to take place
on markets or exchanges outside the United States. There is no limit to the amount of assets of the Fund that may be
commied to trading on foreign markets. The risk of loss in trading foreign futures and options on futures contracts
44
Abbey Capital Futures Strategy Fund
Notes To Consolidated Financial Statements (Continued)
August 31, 2023
can be substantial. Participation in foreign futures and options on futures contracts involves the execution and clearing
of trades on, or subject to the rules of, a foreign board of trade or exchange. Some of these foreign markets, in contrast
to U.S. exchanges, are so-called principals’ markets in which performance is the responsibility only of the individual
counterparty with whom the trader has entered into a commodity interest transaction and not of the exchange or
clearing corporation. In these kinds of markets, there is risk of bankruptcy or other failure or refusal to perform by the
counterparty.
Counterparty Risk — The derivative contracts entered into by the Fund, the SPC or Onshore Subsidiary may be
privately negotiated in the over-the-counter market. These contracts also involve exposure to credit risk, since contract
performance depends in part on the nancial condition of the counterparty. Relying on a counterparty exposes the
Fund to the risk that a counterparty will not sele a transaction in accordance with its terms and conditions because
of a dispute over the terms of the contract (whether or not bona de) or because of a credit or liquidity problem, thus
causing the Fund to suer a loss. If a counterparty defaults on its payment obligations to the Fund, this default will
cause the value of an investment in the Fund to decrease.
Credit Risk — Credit risk refers to the possibility that the issuer of the security or a counterparty in respect of a
derivative instrument will not be able to satisfy its payment obligations to the Fund when due. Changes in an issuer’s
credit rating or the market’s perception of an issuer’s creditworthiness may also aect the value of the Fund’s investment
in that issuer. Securities rated in the four highest categories by the rating agencies are considered investment grade, but
they may also have some speculative characteristics. Investment grade ratings do not guarantee that bonds will not lose
value or default. In addition, the credit quality of securities may be lowered if an issuer’s nancial condition changes.
Options — An option on a futures contract gives the purchaser the right, in exchange for a premium, to assume
a position in a futures contract at a specied exercise price during the term of the option. The Fund may use futures
contracts and related options for: bona de hedging; aempting to oset changes in the value of securities held or
expected to be acquired or be disposed of; aempting to minimize uctuations in foreign currencies; aempting to gain
exposure to a particular market, index or instrument; or other risk management purposes. The risk associated with
purchasing an option is that the Fund pays a premium whether or not the option is exercised. Additionally, the Fund
bears the risk of loss of premium and change in market value should the counterparty not perform under the contract.
Put and call options are accounted for in the same manner as other securities owned. The cost of securities acquired
through the exercise of call options is increased by the premiums paid. The proceeds from securities sold through the
exercise of put options are decreased by the premiums paid.
Options Written — The Fund may enter into options wrien for: bona de hedging; aempting to oset
changes in the value of securities held or expected to be acquired or be disposed of; aempting to minimize uctuations
in foreign currencies; aempting to gain exposure to a particular market, index or instrument; or other risk management
purposes. Such options may relate to particular securities or domestic stock indices, and may or may not be listed on
exchanges regulated by the Commodity Futures Trading Commission or on other non-U.S. exchanges. An option on
a futures contract gives the purchaser the right, in return for the premium paid, to assume a position in the contract (a
long position if the option is a call and a short position if the option is a put) at a specied exercise price at any time
during the option exercise period. The writer of the option is required upon exercise to assume a short futures position
(if the option is a call) or a long futures position (if the option is a put). Upon exercise of the option, the accumulated
cash balance in the writer’s futures margin account is delivered to the holder of the option. That balance represents
the amount by which the market price of the futures contract at exercise exceeds, in the case of a call, or is less than,
in the case of a put, the exercise price of the option. The maximum risk of loss associated with writing put options is
limited to the exercised fair value of the option contract. The maximum risk of loss associated with writing call options
is potentially unlimited. The Fund also has the additional risk of being unable to enter into a closing transaction at an
acceptable price if a liquid secondary market does not exist. The Fund also may write over-the-counter options where
completing the obligation depends upon the credit standing of the other party. Option contracts also involve the risk
that they may result in loss due to unanticipated developments in market conditions or other causes. Wrien options
are initially recorded as liabilities to the extent of premiums received and subsequently marked to market to reect the
45
Abbey Capital Futures Strategy Fund
Notes To Consolidated Financial Statements (Continued)
August 31, 2023
current value of the option wrien. Gains or losses are realized when the option transaction expires or closes. When
an option is exercised, the proceeds on sales for a wrien call option or the purchase cost for a wrien put option is
adjusted by the amount of the premium received. Listed option contracts present minimal counterparty credit risk since
they are exchange traded and the exchange’s clearinghouse, as counterparty to all exchange-traded options, guarantees
the options against default. As of the end of the reporting period, the Fund has no wrien options.
Futures Contracts — The Fund uses futures contracts in the normal course of pursuing its investment
objective. Upon entering into a futures contract, the Fund must deposit initial margin in addition to segregating cash
or liquid assets sucient to meet its obligation to purchase or provide securities, or to pay the amount owed at the
expiration of an index-based futures contract. Such liquid assets may consist of cash, cash equivalents, liquid debt or
equity securities or other acceptable assets. Pursuant to the futures contract, the Fund agrees to receive from, or pay to
the broker, an amount of cash equal to the daily uctuation in value of the contract. Such a receipt of payment is known
as “variation margin” and is recorded by the Fund as an unrealized gain or loss. When the contract is closed, the Fund
records a realized gain or loss equal to the dierence between the proceeds from (or cost of) the closing transactions
and the Fund’s basis in the contract. Futures contracts have market risks, including the risk that the change in the value
of the contract may not correlate with changes in the value of the underlying securities. Use of long futures contracts
subjects the Fund to risk of loss in excess of the amount shown on the Consolidated Statement of Assets and Liabilities,
up to the notional value of the futures contract. Use of short futures contracts subjects the Fund to potentially unlimited
risk of loss.
Forward Foreign Currency Contracts — In the normal course of pursuing its investment objectives, the
Fund is subject to foreign investment and currency risk. The Fund uses forward foreign currency contracts (“forward
contracts”) for purposes of hedging, duration management, as a substitute for securities, to increase returns, for
currency hedging or risk management, or to otherwise help achieve the Fund’s investment objective. These contracts
are marked-to-market daily at the applicable translation rates. The Fund records realized gains or losses at the time the
forward contract is closed. A forward contract is extinguished through a closing transaction or upon delivery of the
currency or entering an oseing contract. Risks may arise upon entering these contracts from the potential inability of
a counterparty to meet the terms of their contracts and from unanticipated movements in the value of a foreign currency
relative to the U.S. dollar or other currencies. The Fund’s maximum risk of loss from counterparty credit risk related to
forward foreign currency contracts is the fair value of the contract. The risk may be mitigated to some extent if a master
neing arrangement between the Fund and the counterparty is in place and to the extent the Fund obtains collateral to
cover the Fund’s exposure to the counterparty.
Cash and Cash Equivalents — Cash and cash equivalents are valued at cost plus accrued interest, which
approximates market value.
Other — In the normal course of business, the Fund may enter into contracts that provide general indemnications.
The Fund’s maximum exposure under these arrangements is dependent on claims that may be made against the Fund
in the future, and, therefore, cannot be estimated; however, the Fund expects the risk of material loss from such claims
to be remote.
2. Investment Adviser and Other Services
Abbey Capital Limited serves as the investment adviser to the Fund and the Cayman Subsidiary, Onshore Subsidiary
and SPC. The Adviser allocates the assets of the Onshore Subsidiary and SPC (via the Cayman Subsidiary) to one or
more Trading Advisers unaliated with the Adviser to manage. The Adviser also has the ultimate responsibility to
oversee the Trading Advisers, and to recommend their hiring, termination and replacement, subject to approval by the
Board. The Fund compensates the Adviser for its services at an annual rate based on the Fund’s average daily net assets
(the “Advisory Fee”), payable on a monthly basis in arrears, as shown in the following table. The Adviser compensates
the Trading Advisers out of the Advisory Fee.

46
Abbey Capital Futures Strategy Fund
Notes To Consolidated Financial Statements (Continued)
August 31, 2023
The Adviser has contractually agreed to waive its advisory fee and/or reimburse expenses in order to limit total
annual Fund operating expenses (excluding certain items discussed below) to the rates (“Expense Caps”) shown in the
following table of the Fund’s average daily net assets. In determining the Adviser’s obligation to waive advisory fees
and/or reimburse expenses, the following expenses are not taken into account and could cause net total annual Fund
operating expenses to exceed the Expense Caps as applicable: acquired fund fees and expenses, brokerage commissions,
extraordinary expenses, interest and taxes. This contractual limitation is in eect until December 31, 2023 and may not
be terminated without the approval of the Board. The Adviser may discontinue these arrangements at any time after
December 31, 2023.
Advisory
Fee Expense Caps
Class A Class I Class C Class T
1.77% 2.04% 1.79% 2.79% 2.04%
During the current scal period, investment advisory fees accrued, waived and/or reimbursed were as follows:
Gross
Advisory
Fees
Waivers and/or
Reimbursements
Net
Advisory
Fees
$48,673,170 $(1,932,271) $46,740,899
If at any time the Fund’s total annual fund operating expenses (not including acquired fund fees and expenses,
brokerage commissions, extraordinary items, interest or taxes) for a year are less than the relevant share class’s Expense
Cap, the Adviser may recoup any waived or reimbursed amounts from the Fund within three years from the date on
which such waiver or reimbursement was made, provided such reimbursement does not cause the Fund to exceed
expense limitations that were in eect at the time of the waiver or reimbursement.
As of the end of the reporting period, the Fund had amounts available for recoupment as follows:
Expiration
August ,
August ,
August ,
Total
$1,020,929 $1,164,300 $1,932,271 $4,117,500
Aspect Capital Limited, Crabel Capital Management, LLC, Eclipse Capital Management, Inc., Episteme Capital
Partners (UK), LLP, Graham Capital Management, LP, P/E Global, LLC, R.G. Niederhoer Capital Management, Inc.,
Revolution Capital Management, LLC, Systematica Investments Limited (acting as the general partner of Systematica
Investments LP), Tudor Investment Corporation, Welton Investment Partners, LLC and Winton Capital Management
Limited each served as a Trading Adviser to the Fund during the current scal period.
U.S. Bancorp Fund Services, LLC, doing business as U.S. Bank Global Fund Services (“Fund Services”), serves as
administrator for the Fund. For providing administrative and accounting services, Fund Services is entitled to receive a
monthly fee, subject to certain minimum and out of pocket expenses.
Fund Services serves as the Fund’s transfer and dividend disbursing agent. For providing transfer agent services,
Fund Services is entitled to receive a monthly fee, subject to certain minimum and out of pocket expenses.
U.S. Bank, N.A. (the “Custodian”) provides certain custodial services to the Fund. The Custodian is entitled to
receive a monthly fee, subject to certain minimum and out of pocket expenses.

47
Abbey Capital Futures Strategy Fund
Notes To Consolidated Financial Statements (Continued)
August 31, 2023
Quasar Distributors, LLC (the “Distributor”), a wholly-owned broker-dealer subsidiary of Foreside Financial Group, LLC,
serves as the principal underwriter and distributor of the Fund’s shares pursuant to a Distribution Agreement with RBB.
The Board has adopted a Plan of Distribution for the Class A Shares, Class C Shares and Class T Shares (the “Plan”)
pursuant to Rule 12b-1 under the 1940 Act. Under the Plan, the Fund’s distributor is entitled to receive from the Fund
a distribution fee with respect to the Shares, which is accrued daily and paid monthly, of up to 0.25% on an annualized
basis of the average daily net assets of the Class A Shares and Class T Shares and up to 1.00% of the Class C Shares.
The actual amount of such compensation under the Plan is agreed upon by the Board and by the Distributor. Because
these fees are paid out of the Fund’s assets on an ongoing basis, over time these fees will increase the cost of your
investment and may cost you more than paying other types of sales charges. Amounts paid to the Distributor under the
Plan may be used by the Distributor to cover expenses that are related to (i) the sale of the Shares, (ii) ongoing servicing
and/or maintenance of the accounts of shareholders, and (iii) sub-transfer agency services, subaccounting services or
administrative services related to the sale of the Shares, all as set forth in the Fund’s 12b-1 Plan.
For compensation amounts paid to Fund Services and the Custodian, please refer to the Consolidated Statement of
Operations.
3. Director And Officer Compensation
The Directors of the Company receive an annual retainer and meeting fees for meetings aended. An employee
of Vigilant Compliance, LLC serves as Chief Compliance Ocer of the Company. Vigilant Compliance, LLC is
compensated for the services provided to the Company. Employees of RBB serve as President, Chief Financial Ocer,
Chief Operating Ocer, Secretary and Director of Marketing & Business Development of the Company. They are
compensated by the Company for services provided. Certain employees of Fund Services serve as ocers of the
Company. They are not compensated by the Fund or the Company. For Director and Ocer compensation amounts,
please refer to the Consolidated Statement of Operations.
4. Purchases and Sales of Investment Securities
During the current scal period, there were no purchases or sales of investment securities or long-term U.S.
Government securities (excluding short-term investments and derivative transactions) by the Fund.
5. Federal Income Tax Information
The Fund has followed the authoritative guidance on accounting for and disclosure of uncertainty in tax positions,
which requires the Fund to determine whether a tax position is more likely than not to be sustained upon examination,
including resolution of any related appeals or litigation processes, based on the technical merits of the position. The
Fund has determined that there was no eect on the consolidated nancial statements from following this authoritative
guidance. In the normal course of business, the Fund is subject to examination by federal, state and local jurisdictions,
where applicable, for tax years for which applicable statutes of limitations have not expired.
As of August 31, 2023, the federal tax cost and aggregate gross unrealized appreciation and depreciation of
investments held by the Fund were as follows
(a)
:
Federal Tax
Cost
Unrealized
Appreciation
Unrealized
(Depreciation)
Net
Unrealized
Appreciation/
(Depreciation)
$2,946,372,094 $46,791,957 $(426,952,967) $(380,161,010)
(a) The dierence between the book basis and tax basis cost and aggregate gross unrealized appreciation and depreciation of investments
is aributable primarily to timing dierences related to taxable income from a wholly-owned controlled foreign corporation.

48
Distributions to shareholders, if any, from net investment income and realized gains are determined in accordance
with federal income tax regulations, which may dier from net investment income and realized gains recognized for
nancial reporting purposes. Accordingly, the character of distributions and composition of net assets for tax purposes
may dier from those reected in the accompanying consolidated nancial statements. To the extent these dierences
are permanent, such amounts are reclassied within the capital accounts based on the tax treatment; temporary
dierences do not require such reclassication.
Permanent dierences as of August 31, 2023, primarily aributable to disallowed book income from the Cayman
Subsidiary, were reclassied to the following accounts:
Distributable
Earnings/(Loss)
Paid-In
Capital
$61,531,137 $(61,531,137)
As of August 31, 2023, the components of distributable earnings/(decits) on a tax basis were as follows:
Undistributed
Ordinary
Income
Undistributed
Long-Term
Capital Gains
Net Unrealized
Appreciation/
(Depreciation)
Capital Loss
Carryforwards
Qualified
Late-Year
Losses
Other
Temporary
Differences
$31,161,514 $— $(388,866,834) $— $81,072,075 $—
The dierences between the book and tax basis components of distributable earnings/(decits) relate principally to
the timing of recognition of income and gains of the Cayman Subsidiary for federal income tax purposes.
The tax character of dividends and distributions paid during the scal years ended August 31, 2022 and August 31,
2023 was as follows:
Ordinary
Income
Long-Term
Gains Total
2023 $301,432,418 $67,524,669 $368,957,087
2022 $44,586,281 $9,689,443 $54,275,724
Pursuant to federal income tax rules applicable to regulated investment companies, the Fund may elect to treat certain
capital losses between November 1 and August 31 and late year ordinary losses ((i) ordinary losses between January 1
and August 31, and (ii) specied ordinary and currency losses between November 1 and August 31) as occurring on the
rst day of the following tax year. For the scal year ended August 31, 2023, any amount of losses elected within the
tax return will not be recognized for federal income tax purposes until September 1, 2023. The Fund deferred qualied
late-year losses of $81,072,075 which will be treated as arising on the rst business day of the following scal year.
The Fund is permied to carry forward capital losses for an unlimited period. Capital losses that are carried forward
will retain their character as either short-term or long-term capital losses. As of August 31, 2023, the Fund had no
unlimited short-term or long-term capital loss carryovers to oset future capital gains.
6. New Accounting Pronouncements and Regulatory Updates
In June 2022, the FASB issued Accounting Standards Update 2022-03, which amends Fair Value Measurement (Topic
820): Fair Value Measurement of Equity Securities Subject to Contractual Sale Restrictions (“ASU 2022-03”). ASU 2022-
03 claries guidance for fair value measurement of an equity security subject to a contractual sale restriction and
establishes new disclosure requirements for such equity securities. ASU 2022-03 is eective for scal years beginning
after December 15, 2023 and for interim periods within those scal years, with early adoption permied. Management
is currently evaluating the impact of these amendments on the nancial statements.
Abbey Capital Futures Strategy Fund
Notes To Consolidated Financial Statements (Continued)
August 31, 2023
49
In October 2022, the SEC adopted a nal rule relating to tailored shareholder reports for mutual funds and exchange-
traded funds and fee information in investment company advertisements. The rule and form amendments will, among
other things, require the Fund to transmit concise and visually engaging shareholder reports that highlight key
information. The amendments will require that funds tag information in a structured data format and that certain more
in-depth information be made available online and available for delivery free of charge to investors on request. The
amendments became eective January 24, 2023. There is an 18-month transition period after the eective date of the
amendments until the Fund is required to comply.
In December 2022, the FASB issued an Accounting Standards Update, ASU 2022-06, Reference Rate Reform (Topic 848)
– Deferral of the Sunset Date of Topic 848 (“ASU 2022-06”). ASU 2022-06 is an amendment to ASU 2020-04, which provided
optional guidance to ease the potential accounting burden due to the discontinuation of the London Inter-Bank Oered
Rate and other interbank-oered based reference rates and which was eective as of March 12, 2020 through December
31, 2022. ASU 2022-06 extends the eective period through December 31, 2024. Management is currently evaluating the
impact, if any, of applying ASU 2022-06.
7. Subsequent Events
Management has evaluated the impact of all subsequent events on the Fund through the date the nancial statements
were issued and has determined that there was the following subsequent event:
Israel-Hamas Conflict Risk — The U.S.-designated terrorist group Hamas aacked Israel on October 7, 2023,
resulting in an ensuing war in the region. Current hostilities and the potential for future hostilities may diminish the
value, or cause signicant volatility in the share price, of companies based in or having signicant operations in Israel.
The Israeli securities market may be closed for extended periods of time or trading on the Israeli securities market may
be suspended altogether. How long the armed conict and related events will last cannot be predicted.
Abbey Capital Futures Strategy Fund
Notes To Consolidated Financial Statements (Concluded)
August 31, 2023

50
To the Shareholders of Abbey Capital Futures Strategy Fund
and Board of Directors of The RBB Fund, Inc.
Opinion on the Financial Statements
We have audited the accompanying consolidated statement of assets and liabilities of Abbey Capital Futures Strategy
Fund (the “Fund”) (one of the portfolios constituting The RBB Fund, Inc. (the “Company”)), including the consolidated
portfolio of investments, as of August 31, 2023, and the related consolidated statement of operations for the year then
ended, the consolidated statements of changes in net assets for each of the two years in the period then ended, the
consolidated nancial highlights for each of the ve years in the period then ended and the related notes (collectively
referred to as the “nancial statements”). In our opinion, the nancial statements present fairly, in all material respects,
the consolidated nancial position of the Fund (one of the portfolios constituting The RBB Fund, Inc.) at August 31,
2023, the consolidated results of its operations for the year then ended, the consolidated changes in its net assets for
each of the two years in the period then ended and its consolidated nancial highlights for each of the ve years in the
period then ended, in conformity with U.S. generally accepted accounting principles.
Basis for Opinion
These nancial statements are the responsibility of the Company’s management. Our responsibility is to express an
opinion on the Fund’s nancial statements based on our audits. We are a public accounting rm registered with the
Public Company Accounting Oversight Board (United States) (“PCAOB”) and are required to be independent with
respect to the Company in accordance with the U.S. federal securities laws and the applicable rules and regulations of
the Securities and Exchange Commission and the PCAOB.
We conducted our audits in accordance with the standards of the PCAOB. Those standards require that we plan
and perform the audit to obtain reasonable assurance about whether the nancial statements are free of material
misstatement, whether due to error or fraud. The Company is not required to have, nor were we engaged to perform,
an audit of the Company’s internal control over nancial reporting. As part of our audits, we are required to obtain
an understanding of internal control over nancial reporting but not for the purpose of expressing an opinion on the
eectiveness of the Company’s internal control over nancial reporting. Accordingly, we express no such opinion.
Our audits included performing procedures to assess the risks of material misstatement of the nancial statements,
whether due to error or fraud, and performing procedures that respond to those risks. Such procedures included
examining, on a test basis, evidence regarding the amounts and disclosures in the nancial statements. Our procedures
included conrmation of securities owned as of August 31, 2023, by correspondence with the custodian and brokers;
when replies were not received from brokers, we performed other auditing procedures. Our audits also included
evaluating the accounting principles used and signicant estimates made by management, as well as evaluating the
overall presentation of the nancial statements. We believe that our audits provide a reasonable basis for our opinion.
We have served as the auditor of one or more Abbey Capital investment companies since 2014.
Philadelphia, Pennsylvania
October 30, 2023
Abbey Capital Futures Strategy Fund
Report of Independent Registered Public Accounting Firm
51
Abbey Capital Futures Strategy Fund
Shareholder Tax Information
(Unaudited)
Certain tax information regarding the Fund is required to be provided to shareholders based upon the Fund’s
income and distributions for the taxable year ended August 31, 2023. The information and distribution reported herein
may dier from information and distributions taxable to the shareholders for the calendar year ended December 31,
2023. During the scal year ended August 31, 2023, the Fund paid no ordinary income dividends that are designated as
“qualied dividend income” to its shareholders. Dividends from net investment income and short-term capital gains
are treated as ordinary income dividends for federal income tax purposes.
The percentage of taxable ordinary income distributions that are designated as short-term capital gain distributions
under Internal Revenue Section 871(k)(2)(c) for the Fund is 23.34%.
Because the Fund’s scal year is not the calendar year, another notication will be sent with respect to calendar year
2023. The second notication, which will reect the amount, if any, to be used by calendar year taxpayers on their U.S.
federal income tax returns, will be made in conjunction with Form 1099-DIV and will be mailed in January 2024.
Foreign shareholders will generally be subject to U.S. withholding tax on the amount of their ordinary income
dividends. They will generally not be entitled to a foreign tax credit or deduction for the withholding taxes paid by the
Fund, if any.
In general, dividends received by tax exempt recipients (e.g., IRAs and Keoghs) need not be reported as taxable
income for U.S. federal income tax purposes. However, some retirement trusts (e.g., corporate, Keogh and 403(b)(7)
plans) may need this information for their annual information reporting.
Shareholders are advised to consult their own tax advisers with respect to the tax consequences of their investment
in the Fund.
52
Abbey Capital Futures Strategy Fund
Other Information
(Unaudited)
Proxy Voting
Policies and procedures that the Fund uses to determine how to vote proxies relating to portfolio securities as well
as information regarding how the Fund voted proxies relating to portfolio securities for the most recent twelve-month
period ended June 30 are available without charge, upon request, by calling (844) 261-6484 and on the SEC’s website at
hp://www.sec.gov.
Quarterly Portfolio Schedules
The Company les its complete schedule of portfolio holdings with the SEC for the rst and third scal quarters of
each scal year (quarters ended November 30 and May 31) as an exhibit to its report on Form N-PORT. The Company’s
Forms N-PORT are available on the SEC’s website at hp://www.sec.gov.
Approval of Investment Advisory Agreements and Trading Advisory Agreements
As required by the 1940 Act, the Board, including all of the Directors who are not “interested persons” of the
Company, as that term is dened in the 1940 Act (the “Independent Directors”), considered the renewal of (1) the
investment advisory agreement between Abbey Capital and the Company on behalf of the Fund (the “Investment
Advisory Agreement”), (2) each of the separate advisory agreements between the Cayman Subsidiary, the Onshore
Subsidiary and SPC (the “Subsidiaries”) and Abbey Capital (collectively, the “Subsidiary Investment Advisory
Agreements”), and (3) the trading advisory agreements between Abbey Capital and each of Aspect Capital Limited,
Crabel Capital Management, LLP, Eclipse Capital Management, Inc., Episteme Capital Partners (UK), LLP, Graham
Capital Management, LP, P/E Global, LLC, Revolution Capital Management, LLC, R.G. Niederhoer Capital
Management, Inc., Systematica Investments Limited (acting as the general partner of Systematica Investments LP), Tudor
Investment Corporation, Welton Investment Partners LLC, and Winton Capital Management Limited (each, a “Trading
Adviser”) (the “Trading Advisory Agreements”), at a meeting of the Board held on May 16-17, 2023 (the “Meeting”).
At the Meeting, the Board, including all of the Independent Directors, approved the Investment Advisory Agreement,
the Subsidiary Investment Advisory Agreements, and the Trading Advisory Agreements for an additional one-year
term ending August 16, 2024. The Board’s decision to approve Investment the Advisory Agreement, the Subsidiary
Investment Advisory Agreements, and the Trading Advisory Agreements reects the exercise of its business judgment
to continue the existing arrangement. In approving the Investment Advisory Agreement, Subsidiary Investment
Advisory Agreements, and the Trading Advisory Agreements, the Board considered information provided by Abbey
Capital and each of the Trading Advisers with the assistance and advice of counsel to the Independent Directors and
the Company.
In considering the renewal and approval of the Investment Advisory Agreement, the Subsidiary Investment Advisory
Agreements, and the Trading Advisory Agreements, the Directors took into account all materials provided prior to
and during the Meeting and at other meetings throughout the past year, the presentations made during the Meeting,
and the discussions held during the Meeting. The Directors reviewed these materials with management of Abbey
Capital, and discussed the aforementioned Agreements with counsel in executive sessions, at which no representatives
of Abbey Capital, the Subsidiaries, or Trading Advisers were present. Among other things, the Directors considered
(i) the nature, extent, and quality of services provided to the Fund by Abbey Capital and each Trading Adviser; (ii)
descriptions of the experience and qualications of the personnel providing those services; (iii) Abbey Capital’s and the
Trading Advisers’ investment philosophies and processes; (iv) Abbey Capital’s and the Trading Advisers’ assets under
management and client descriptions; (v) Abbey Capital’s and the Trading Advisers’ soft dollar commission and trade
allocation policies, including information on the types of research and services obtained in connection with soft dollar
commissions; (vi) Abbey Capital’s and the Trading Advisers’ advisory fee arrangements with the Company and other
similarly managed clients, as applicable; (vii) Abbey Capital’s and the Trading Advisers’ compliance procedures; (viii)
Abbey Capital’s and the Trading Advisers’ nancial information and insurance coverage, as applicable, and Abbey
Capital’s protability analysis; (ix) the extent to which economies of scale are relevant to the Fund; (x) a report prepared
by Fuse Research Network, LLC comparing the Fund’s management fees and total expense ratios to a group of mutual
53
Abbey Capital Futures Strategy Fund
Other Information (Continued)
(Unaudited)
funds deemed comparable to the Fund based primarily on investment strategy similarity (“Peer Group”) and comparing
the performance of the Fund to the performance of its Peer Group; and (xi) a report comparing the performance of the
Fund to the performance of its benchmark.
As part of their review, the Directors considered the nature, extent and quality of the services provided by Abbey
Capital and each Trading Adviser. The Directors concluded that Abbey Capital and each Trading Adviser had substantial
resources to provide services to the Fund and the Subsidiaries, as applicable.
The Directors also considered the investment performance of the Fund, noting that the Fund had outperformed its
benchmark, the S&P 500 Total Return Index, for the one-year period ended March 31, 2023, and underperformed its
benchmark for the three-month, ve-year, and since-inception periods ended March 31, 2023. The Directors considered
the Fund’s investment performance in light of its investment objective and investment strategies. The Board noted that
the Fund’s total return for the since-inception period ended December 31, 2022, outperformed the median of its Peer
Group, and for the three-month, one-year, three-year, and ve-year periods ended December 31, 2022, underperformed
the median of its Peer Group.
The Board also considered the advisory fee rate payable by the Fund under the Investment Advisory Agreement.
In this regard, information on the fees paid by the Fund and the Fund’s total operating expense ratios (before and
after fee waivers and expense reimbursements) were compared to similar information for mutual funds advised by
other, unaliated investment advisory rms. The Directors noted that both the Fund’s net advisory fee and Fund’s
total net expenses were above the median and in the 5th quintile (most expensive) of its Peer Group. The Directors also
considered the fees payable to each Trading Adviser under the Trading Advisory Agreements and the information
provided by Abbey Capital on the services provided by the dierent Trading Advisers. In this regard, the Directors
noted that the fees for each Trading Adviser were paid directly by Abbey Capital and not by the Fund. The Directors
noted that Abbey Capital had contractually agreed to waive management fees and reimburse expenses through at least
December 31, 2023, to limit total annual operating expenses to agreed upon levels for the Fund.
After reviewing the information regarding Abbey Capital’s and the Trading Advisers’ costs, protability and
economies of scale, and after considering the services to be provided by Abbey Capital and each Trading Adviser, the
Directors concluded that the investment advisory fees to be paid by the Fund to Abbey Capital and the trading advisory
fees to be paid by Abbey Capital to each Trading Adviser were fair and reasonable and that the Investment Advisory
Agreement, Subsidiary Investment Advisory Agreements, and Trading Advisory Agreements should be approved and
continued for an additional one-year period ending August 16, 2024.
LIQUIDITY RISK MANAGEMENT PROGRAM
The Company has adopted and implemented a Liquidity Risk Management Program (the “Company Program”)
as required by rule 22e-4 under the 1940 Act. In accordance with the Company Program, the Adviser has adopted and
implemented a liquidity risk management program (the “Adviser Program” and together with the Company Program,
the “Programs”) on behalf of the Fund. The Programs seek to assess, manage and review the Fund’s Liquidity Risk.
“Liquidity Risk” is dened as the risk that the Fund could not meet requests to redeem shares issued by the Fund
without signicant dilution of remaining investors’ interest in the Fund.
The Board has appointed Vigilant Compliance, LLC (“Vigilant”) as the program administrator for the Company
Program and the Chief Risk Ocer of the Adviser as the program administrator for the Adviser Program. The process
of monitoring and determining the liquidity of the Fund’s investments is supported by one or more third-party vendors.
At meetings held during the current scal period, the Board and its Regulatory Oversight Commiee received and
reviewed a wrien report (the “Report”) of Vigilant and the Adviser concerning the operation of the Programs for
the period from January 1, 2022 to December 31, 2022 (the “Period”). The Report summarized the operation of the
Programs and the information and factors considered by Vigilant and the Adviser in reviewing the adequacy and
eectiveness of the implementation of the Programs with respect to the Fund. Such information and factors included,
54
among other things: (i) the methodology used to classify the liquidity of the Fund’s portfolio investments and the
Adviser’s assessment that the Fund’s strategy remained appropriate for an open-end mutual fund; (ii) analyses of the
Fund’s trading environment and reasonably anticipated trading size; (iii) that the Fund held primarily highly liquid
assets (investments that the Fund anticipates can be converted to cash within 3 business days or less in current market
conditions without signicantly changing their market value); (iv) that the Fund held a percentage of highly liquid
assets above its highly liquid investment minimum at all times during the Period; (v) conrmation that the Fund did
not breach the 15% maximum illiquid security threshold (investments that cannot be sold or disposed of in seven days
or less in current market conditions without the sale of the investment signicantly changing the market value of the
investment) during the Period and the procedures for monitoring compliance with the limit; (vi) that the processes,
technologies and third-party vendors used to assess, manage, and/or periodically review the Fund’s Liquidity Risk
functioned appropriately during the Period; and (vii) that the Programs operated adequately during the Period. The
Report also described material changes made to the Adviser Program during the Period and indicated that there were
no material changes made to the Company Program during the Period.
Based on the review, the Report concluded that the Programs were being implemented eectively and reasonably
designed to assess and manage Liquidity Risk in the Fund’s portfolio.
There can be no assurance that the Company Program or the Adviser Program will achieve its objectives under all
circumstances in the future. Please refer to the Fund’s prospectus for more information regarding the Fund’s exposure
to liquidity risk and other risks to which it may be subject.
Abbey Capital Futures Strategy Fund
Other Information (Concluded)
(Unaudited)

55
Abbey Capital Futures Strategy Fund
Company Management
(Unaudited)
The business and aairs of the Company are managed under the direction of the Company’s Board of Directors. The
Company is organized under and managed pursuant to Maryland law. The Directors and executive ocers of the
Company, their ages, business addresses and principal occupations during the past ve years are set forth below.
The statement of additional information (“SAI”) includes additional information about the Directors and is available
without charge, upon request, by calling (844) 261-6484.
Name, Address,
and Age
Position(s)
Held with
Company
and Length of
Time Served
1
Principal Occupation(s)
During Past 5 Years
Number of
Portfolios in
Fund Complex
Overseen by
Director*
Other
Directorships
Held by Director
During the Past
5 Years
Independent Directors
Julian A. Brodsky
615 East Michigan Street
Milwaukee, WI 53202
Age: 90
Director 1988 to present Retired. 63 AMDOCS Limited
(service provider to
telecommunications
companies).
Gregory P. Chandler
615 East Michigan Street
Milwaukee, WI 53202
Age: 56
Director 2012 to present Since 2020, Chief Financial
Ocer, HC Parent Corp. d/b/a
Herspiegel Consulting LLC (life
sciences consulting services); 2020,
Chief Financial Ocer, Avocado
Systems Inc. (cyber security
software provider); 2009-2020,
Chief Financial Ocer, Emtec, Inc.
(information technology consulting/
services).
63 FS Energy and Power
Fund (business
development
company); Wilmington
Funds (12 portfolios)
(registered investment
company); Emtec,
Inc. (until December
2019); FS Investment
Corporation (business
development company)
(until December 2018).
Lisa A. Dolly
615 East Michigan Street
Milwaukee, WI, 53202
Age: 57
Director October 2021 to
present
From July 2019-December 2019,
Chairman, Pershing LLC (broker
dealer, clearing and custody rm);
January 2016-June 2019, Chief
Executive Ocer, Pershing, LLC.
63 Allfunds Group PLC
(United Kingdom
wealthtech and fund
distribution provider);
Securities Industry
and Financial Markets
Association (trade
association for broker
dealers, investment
banks and asset
managers); Hightower
Advisors (wealth
management rm).
Nicholas A. Giordano
615 East Michigan Street
Milwaukee, WI 53202
Age: 80
Director 2006 to present Since 1997, Consultant, nancial
services organizations.
63 IntriCon Corporation
(biomedical device
manufacturer);
Wilmington Funds (12
portfolios) (registered
investment company);
Independence Blue Cross
(healthcare insurance)
(until March 2021).

56
Abbey Capital Futures Strategy Fund
Company Management (Continued)
(Unaudited)
Name, Address,
and Age
Position(s)
Held with
Company
and Length of
Time Served
1
Principal Occupation(s)
During Past 5 Years
Number of
Portfolios in
Fund Complex
Overseen by
Director*
Other
Directorships
Held by Director
During the Past
5 Years
Arnold M. Reichman
615 East Michigan Street
Milwaukee, WI 53202
Age: 75
Chair
Director
2005 to present
1991 to present
Retired. 63 EIP Investment Trust
(registered investment
company) (until
August 2022).
Brian T. Shea
615 East Michigan Street
Milwaukee, WI 53202
Age: 63
Director 2018 to present From 2014-2017, Chief Executive
Ocer, BNY Mellon Investment
Services (fund services, global
custodian and securities clearing rm);
from 1983-2014, Chief Executive Ocer
and various positions, Pershing LLC
(broker dealer, clearing and custody
rm).
63 Fidelity National
Information Services,
Inc. (nancial services
technology company);
Ameriprise Financial,
Inc. (nancial
services company);
WisdomTree
Investments, Inc.
(asset management
company) (until March
2019).
Robert A. Straniere
615 East Michigan Street
Milwaukee, WI 53202
Age: 82
Director 2006 to present Since 2009, Administrative Law Judge,
New York City; since 1980, Founding
Partner, Straniere Law Group (law
rm).
63 None.
Interested Director
2
Robert Sablowsky
615 East Michigan Street
Milwaukee, WI 53202
Age: 85
Vice Chair
Director
2016 to present
1991 to present
Since 2002, Senior Director –
Investments and, prior thereto,
Executive Vice President, of
Oppenheimer & Co., Inc. (a registered
broker-dealer).
63 None.
Officers
Steven Plump
615 East Michigan
Street
Milwaukee, WI 53202
Age: 64
President August 2022 to
present
From 2011 to 2021, Executive Vice
President, PIMCO LLC.
N/A N/A
Salvatore Faia, JD, CPA,
CFE
Vigilant Compliance, LLC
Gateway Corporate
Center, Suite 216
223 Wilmington West
Chester Pike
Chadds Ford, PA 19317
Age: 60
Chief
Compliance
Ocer
2004 to present Since 2004, President, Vigilant
Compliance, LLC (investment
management services company);
since 2005, Independent Trustee of
EIP Investment Trust (registered
investment company); since 2021, Chief
Compliance Ocer of The RBB Fund
Trust; President of The RBB Fund Trust
from 2021 to 2022; President of The RBB
Fund, Inc. from 2009 to 2022.
N/A N/A

57
Abbey Capital Futures Strategy Fund
Company Management (Continued)
(Unaudited)
Name, Address,
and Age
Position(s)
Held with
Company
and Length of
Time Served
1
Principal Occupation(s)
During Past 5 Years
Number of
Portfolios in
Fund Complex
Overseen by
Director*
Other
Directorships
Held by Director
During the Past
5 Years
James G. Shaw
615 East Michigan
Street
Milwaukee, WI 53202
Age: 63
Chief
Financial
Ocer and
Secretary
Chief
Operating
Ocer
2016 to present
2022 to present
Chief Financial Ocer and Secretary
(since 2016) and Chief Operating
Ocer (since 2022) of The RBB
Fund, Inc.; Chief Financial Ocer
and Secretary (since 2021) and Chief
Operating Ocer (since 2022) of The
RBB Fund Trust.
N/A N/A
Craig A. Urciuoli
615 East Michigan
Street
Milwaukee, WI 53202
Age: 49
Director of
Marketing
& Business
Development
2019 to present Director of Marketing & Business
Development of The RBB Fund, Inc.
(since 2019) and The RBB Fund Trust
(since 2021); from 2000-2019, Managing
Director, Third Avenue Management
LLC (an investment advisory rm).
N/A N/A
Jennifer Wi
615 East Michigan
Street
Milwaukee, WI 53202
Age: 40
Assistant
Treasurer
2018 to present Since 2020, Vice President, U.S.
Bank Global Fund Services (fund
administrative services rm); from
2016 to 2020, Assistant Vice President,
U.S. Bank Global Fund Services.
N/A N/A
Edward Paz
615 East Michigan
Street
Milwaukee, WI 53202
Age: 52
Assistant
Secretary
2016 to present Since 2007, Vice President and
Counsel, U.S. Bank Global Fund
Services, LLC (fund administrative
services rm).
N/A N/A
Michael P. Malloy
One Logan Square
Ste. 2000
Philadelphia, PA 19103
Age: 64
Assistant
Secretary
1999 to present Since 1993, Partner, Faegre Drinker
Biddle & Reath LLP (law rm).
N/A N/A
Jillian L. Bosmann
One Logan Square
Ste. 2000
Philadelphia, PA 19103
Age: 44
Assistant
Secretary
2017 to present Since 2017, Partner, Faegre Drinker
Biddle & Reath LLP (law rm).
N/A N/A
* Each Director oversees 63 portfolios of the fund complex, consisting of the series in the Company (53 portfolios) and The RBB
Fund Trust (10 portfolios).
1. Subject to the Company’s Retirement Policy, each Director may continue to serve as a Director until the last day of the calendar
year in which the applicable Director aains age 75 or until his or her successor is elected and qualied or his or her death,
resignation or removal. The Board reserves the right to waive the requirements of the Policy with respect to an individual
Director. The Board has approved waivers of the policy with respect to Messrs. Brodsky, Giordano, Sablowsky and Straniere.
Each ocer holds oce at the pleasure of the Board until the next special meeting of the Company or until his or her successor
is duly elected and qualied, or until he or she dies, resigns or is removed.
2. Mr. Sablowsky is considered an “interested person” of the Company as that term is dened in the 1940 Act and is referred to as
an “Interested Director.” Mr. Sablowsky is considered an “Interested Director” of the Company by virtue of his position as an
employee of Oppenheimer & Co., Inc., a registered broker-dealer.
58
The information above includes each Director’s principal occupations during the last ve years. Each Director
possesses extensive additional experience, skills and aributes relevant to his or her qualications to serve as a Director.
The cumulative background of each Director led to the conclusion that each Director should serve as a Director of the
Company. Mr. Brodsky has over 40 years of senior executive-level management experience in the cable television and
communications industry. Mr. Chandler has demonstrated leadership and management abilities as evidenced by his
senior executive level positions in the investment technology consulting/services and investment banking/brokerage
industries, and also serves on various boards. Ms. Dolly has over three decades of experience in the nancial services
industry, and she has demonstrated her leadership and management abilities by serving in numerous senior executive-
level positions. Mr. Giordano has years of experience as a consultant to nancial services organizations and also serves
on the boards of other registered investment companies. Mr. Reichman brings decades of investment management
experience to the Board, in addition to senior executive-level management experience. Mr. Sablowsky has demonstrated
leadership and management abilities as evidenced by his senior executive-level positions in the nancial services
industry. Mr. Shea has demonstrated leadership and management abilities as evidenced by his senior executive-level
positions in the brokerage, clearing, banking and investment services industry, including service on the boards of public
companies, industry regulatory organizations and a university. Mr. Straniere has been a practicing aorney for over
30 years and has served on the boards of an asset management company and another registered investment company.
Abbey Capital Futures Strategy Fund
Company Management (Concluded)
(Unaudited)

59
Abbey Capital Futures Strategy Fund
Privacy Notice
(Unaudited)
Abbey Capital Futures Strategy Fund
FACTS
WHAT DOES THE ABBEY CAPITAL FUTURES STRATEGY FUND DO WITH YOUR
PERSONAL INFORMATION?
Why? Financial companies choose how they share your personal information. Federal law gives consumers
the right to limit some but not all sharing. Federal law also requires us to tell you how we collect,
share, and protect your personal information. Please read this notice carefully to understand what we
do.
What? The types of personal information we collect and share depend on the product or service you have
with us. This information can include:
• Social Security number
• account balances
• account transactions
• transaction history
• wire transfer instructions
• checking account information
When you are no longer our customer, we continue to share your information as described in this
notice.
How? All financial companies need to share customers’ personal information to run their everyday business.
In the section below, we list the reasons financial companies can share their customers’ personal
information; the reasons the Abbey Capital Futures Strategy Fund chooses to share; and whether you
can limit this sharing.
Reasons we can share your information
Does the Abbey Capital
Futures Strategy Fund
share?
Can you limit this
sharing?
For our everyday business purpose —
such as to process your transactions, maintain your account(s),
respond to court orders and legal
investigations, or report to credit bureaus
Yes No
For our marketing purposes —
to offer our products and services to you
Yes No
For joint marketing with other financial companies No We don’t share.
For affiliates’ everyday business purposes —
information about your transactions and experiences
Yes No
For affiliates’ everyday business purposes —
information about your creditworthiness
No We don’t share
For our affiliates to market to you No We don’t share
For nonaffiliates to market to you No We don’t share
Questions? Call 1-844-261-6484 or go to www.abbeycapital.com

60
Abbey Capital Futures Strategy Fund
Privacy Notice (Continued)
(Unaudited)
What we do
How does the Abbey Capital Futures
Strategy Fund protect my personal
information?
To protect your personal information from unauthorized access and use,
we use security measures that comply with federal law. These measures
include computer safeguards and secured files and buildings.
How does the Abbey Capital Futures
Strategy Fund collect my personal
information?
We collect your personal information, for example, when you
• open an account
• provide account information
• give us your contact information
• make a wire transfer
• tell us where to send the money
We also collect your information from others, such as credit bureaus,
affiliates, or other companies.
Why can’t I limit all sharing? Federal law gives you the right to limit only
• sharing for affiliates’ everyday business purposes — information about
your creditworthiness
• affiliates from using your information to market to you
• sharing for nonaffiliates to market to you
State laws and individual companies may give you additional rights to limit
sharing.
European Union’s General Data
Protection Regulation
In addition to the above information, where applicable, you have the
following rights under the European Union’s General Data Protection
Regulation (“GDPR”) and U.S. Privacy Laws, as applicable and to the extent
permitted by law, to
• Check whether we hold personal information about you and to
access such data (in accordance with our policy)
• Request the correction of personal information about you that is
inaccurate
• Have a copy of the personal information we hold about you
provided to you or another “controller” where technically feasible
• Request the erasure of your personal information
• Request the restriction of processing concerning you
The legal grounds for processing of your personal information is for
contractual necessity and compliance with law.
If you wish to exercise any of your rights above, please call: 1-844-261-6484.
You are required to ensure the personal information we hold about you
is up-to-date and accurate and you must notify us of any changes to the
personal data you provided to us.

61
Abbey Capital Futures Strategy Fund
Privacy Notice (Concluded)
(Unaudited)
The Abbey Capital Futures Strategy Fund shall retain your personal data
for as long as you are an investor in the Fund and thereafter as long as
necessary to comply with applicable laws that require the Fund to retain
your personal data, such as the Securities and Exchange Commission’s data
retention rules. Your personal data will be transferred to the United States so
that the Fund may provide the agreed upon services for you. No adequacy
decision has been rendered by the European Commission as to the data
protection of your personal data when transferring it to the United States.
However, the Fund does take the security of your personal data seriously.
You also have the right to lodge a complaint with the appropriate regulatory
authority with respect to issues you may have.
Definitions
Affiliates Companies related by common ownership or control. They can be financial
and nonfinancial companies.
• Our affiliates include Abbey Capital Futures Strategy Fund’s investment
adviser, Abbey Capital Limited, and each sub-adviser.
Nonaffiliates Companies not related by common ownership or control. They can be
financial and nonfinancial companies.
• The Abbey Capital Futures Strategy Fund doesn’t share with nonaffiliates so
they can market to you.
Joint marketing A formal agreement between nonaffiliated financial companies that together
market financial products or services to you.
• The Abbey Capital Futures Strategy Fund does not jointly market.
Controller “Controller” means the natural or legal person, public authority, agency or
other body which, alone or jointly with others, determines the purposes and
means of the processing of personal data; where the purposes and means of
such processing are determined by European Union or European Member
State law, the controller or the specific criteria for its nomination may be
provided for by European Union or European Member State law.
Investment Adviser
Abbey Capital Limited
1-2 Cavendish Row
Dublin 1, Ireland
Administrator and Transfer Agent
U.S. Bancorp Fund Services, LLC
P.O. Box 701
Milwaukee, WI 53201
Principal Underwriter
Quasar Distributors, LLC
111 E Kilbourn Ave, Suite 2200
Milwaukee, WI 53202
Custodian
U.S. Bank, N.A.
1555 North Rivercenter Drive, Suite 302
Milwaukee, WI 53212
Independent Registered Public Accounting Firm
Ernst & Young LLP
One Commerce Square
2005 Market Street, Suite 700
Philadelphia, PA 19103
Legal Counsel
Faegre Drinker Biddle & Reath LLP
One Logan Square, Suite 2000
Philadelphia, PA 19103-6996
AFS-AR23
